1. Introduction
One of the basic concepts of the economics of natural resources and the living environment is sustainability and sustainable development. Despite different interpretations that can be found in the literature, this concept today has a central role in long-term perspectives on the survival and progress of mankind. In that sense, sustainable development occurs not only as a core requirement, but as the ultimate goal of effective non-profit or for-profit organizations [
1].
Overall economic and social development have a significant role in contributing to rising awareness of the importance of environmental protection and the establishment of sustainable development policies. Transport is recognized as an important factor of sustainable development strategy, due to the strong correlation between transport and economic and social development and particularly because of its significant impact on the environment. Besides the positive and significant impact of transport on social and economic development, there is its negative impact on the environment. The essence of the sustainable transport strategy is the control of negative effects/impacts of transport, i.e., traffic accidents, congestion, pollution of land, air, and water, noise produced by transport vehicles, and power consumption. All of these negative effects must be considered together, because there is a high degree of interdependence among them, and they result in direct or indirect impacts on human health, the environment, and the quality of everyday life.
Studies that consider transport strategies are mainly related to sustainable transport strategies at the state, region, city, or company level. For example, in [
2] the authors analyzed the usage of electric vehicles to implement sustainable strategy for road transport in Australia, and in [
3] the strategic planning guidelines are given for a sustainable transport system in the United States. Long-term sustainable transport strategy in Havana, Cuba is formulated in [
4], and in [
5] the analysis of public transport of passengers in Bucharest, Romania is provided. In 2013, to design a strategy for a semi-governmental start-up company allied with the railway transport industry Sarfaraz et al. [
6] applied the Strategy-Formulation Analytical Framework (proposed by David [
7]). There are also studies that deal with traffic safety strategies [
8,
9,
10,
11], road maintenance strategies [
12,
13,
14], or network management strategies [
15], etc. However, there are only a few cases of transport strategy selection with the aim to distribute the final product of a specific company. Since this type of strategy is a part of the overall company strategy, it needs to be competitive, socially responsible, and sustainable, in accordance with the company’s overall goals. According to Abbasi and Nilsson [
16], due to tremendous uncertainty, designing future sustainability-related logistic activities and transport between them is hindered. This is because it is very hard to plan at the strategic level due to rapidly changing external and internal factors in the environment [
17].
As a methodological framework for strategy formulation, SWOT analysis is often used. Besides all the advantages and wide practical implementation, SWOT analysis has disadvantages also. They are primarily related to quantification and prioritization of factors and alternatives. More about the problems in the implementation of SWOT analysis can be found in [
3]. The disadvantages of SWOT are reasons for combining SWOT with other methods and techniques. One of the first hybrid models of SWOT analysis was the A’WOT model [
18], combining SWOT analysis with the AHP method, with the aim of analytical priority determination among SWOT analysis factors. Later, this hybrid model was modified and widely exploited. Examples of SWOT–AHP model implementation can be found in [
19,
20,
21,
22,
23,
24], and examples of combining SWOT with fuzzy AHP in [
25,
26,
27]. For a combination of SWOT with other methods and techniques we refer to [
28,
29,
30,
31,
32], etc.
One of the popular ways to formulate the strategy is to combine SWOT analysis with ANP. Realizing that interdependence of the factors that are used in SWOT analysis can impact the selection of a final strategy, Yuksel and Dagdeviren proposed the hybrid SWOT–ANP model for strategy formulation [
33]. ANP was adopted by Al-Rafaie et al. [
34] to determine strategic factors’ relative importance as the basis of prioritizing previously formulated strategic options. In a similar way, Živković et al. [
35] also proposed strategic option selection, implementing the AHP method to determine the factor weights of dependency or independency. Examples of such models can be found in [
33,
34,
35,
36,
37,
38]. Also, in a similar way the combination of ANP and SWOT was used even in a fuzzy environment [
39,
40,
41,
42].
Although the ANP method was previously proposed for improving SWOT analysis, the SWOT–ANP combination was not sufficient because it does not solve the real problems of quantification of relations between SWOT factors. Specifically, when making maps of a relation network, in applying the ANP method, the mutual dependency of two factors is treated as the reciprocal value (the dependence of factor A on factor B is equal to the reciprocal value of the dependence of factor B on factor A) and that does not always correspond to reality. Also, the same problem arises when normalizing the unweighted supermatrix in ANP, where to each cluster the same relative importance is assigned.
The hybrid SWOT–DANP model proposed in this paper eliminates most of the disadvantages of standard SWOT and hybrid SWOT–ANP models. DEMATEL is an often used method for factors (criteria) segmentation and the identification of cause and effect relationships [
43,
44,
45]. Also, DEMATEL has been widely used in fuzzy environments [
46,
47,
48,
49,
50]. A DEMATEL-based ANP approach was used to examine influential weights among the criteria in the ANP model [
51,
52,
53,
54].
The presented SWOT–DANP model enables qualitative factor analysis, priority determination among factors and alternatives, and the selection of adequate alternatives even in the case of a large number of factors. Conditionally, the SWOT–DANP model can be divided into two phases.
Identification of influential factors and formulation of strategic options is conducted in the first phase. In the second phase selection of optimal strategic option takes place. Because of the high level of uncertainty that is present in the first phase, for influential factors identification, the fuzzy Delphi technique is used. Experts involved in the identification process evaluate factors’ influences on a fuzzy scale. The average opinion of group of experts is a fuzzy value obtained by individual opinions aggregation. By applying fuzzy SWOT analysis based on the fuzzy values of the factors’ influences, connections between factors are determined and strategic transport options are formulated. The highest level of uncertainty is present during the identification of factors and quantification of their influences. This is the reason for fuzzy approach application in the first phase of the model.
In the second phase of the model, DEMATEL and ANP methods are combined with fuzzy SWOT analysis with the aim of eliminating subjectivity during the process of mapping, quantifying their relative influence, and prioritizing strategic transport options. In this stage, crisp DEMATEL and ANP methods are used for strategic options evaluation because of the lower level of uncertainty in the second phase.
Quantification of reciprocal influence of cluster/factors in this model is performed by forming the total-influence matrix T and establishing a threshold value α, or constructing an effect relationship diagram (ERD), according to the DEMATEL method. Fuzzy SWOT analysis is used for factors evaluation and options formation based on the established relations between factors and the ANP method is used for the quantification of clusters’/factors’ relative importance and the selection of an optimal option.
The model of strategic transport management presented in this paper, in a difference from currently applied models, integrates all phases of strategic management process in transport companies. The model is applied to a company engaged in the transport of hazardous goods and it is also applicable in other companies that aim to establish a sustainable development strategy.
2. Strategic Transport Management Model
Most approaches to modelling the strategic management process follow the logic of strategic planning as the most important phase of the management process. This is understandable because the results of the planning phase are decisions about the objectives, policies, strategies, and set of individual plans that are implemented in real business. In this regard a formalized planning process has served as a framework to develop a model of strategic transport management.
Considering the company’s engagement in transport and the need to establish a sustainable transport strategy, this model should provide an adequate framework for solving a variety of problems such as variable and limited resources (human, material, information, weather, etc.) and taking present and future characteristics of external and internal environment into account.
Modern strategic management methods and techniques are used in the elaboration of the model. This makes it a comprehensive and complete process that begins with strategic analysis, then strategy formulation and implementation, and ends with strategic control. The strategic transportation management model includes the following phases:
- (1)
Strategic analysis
- (2)
Strategic options formulation
- (3)
Optimal strategic option selection
- (4)
Selected strategy implementation
- (5)
Strategic control
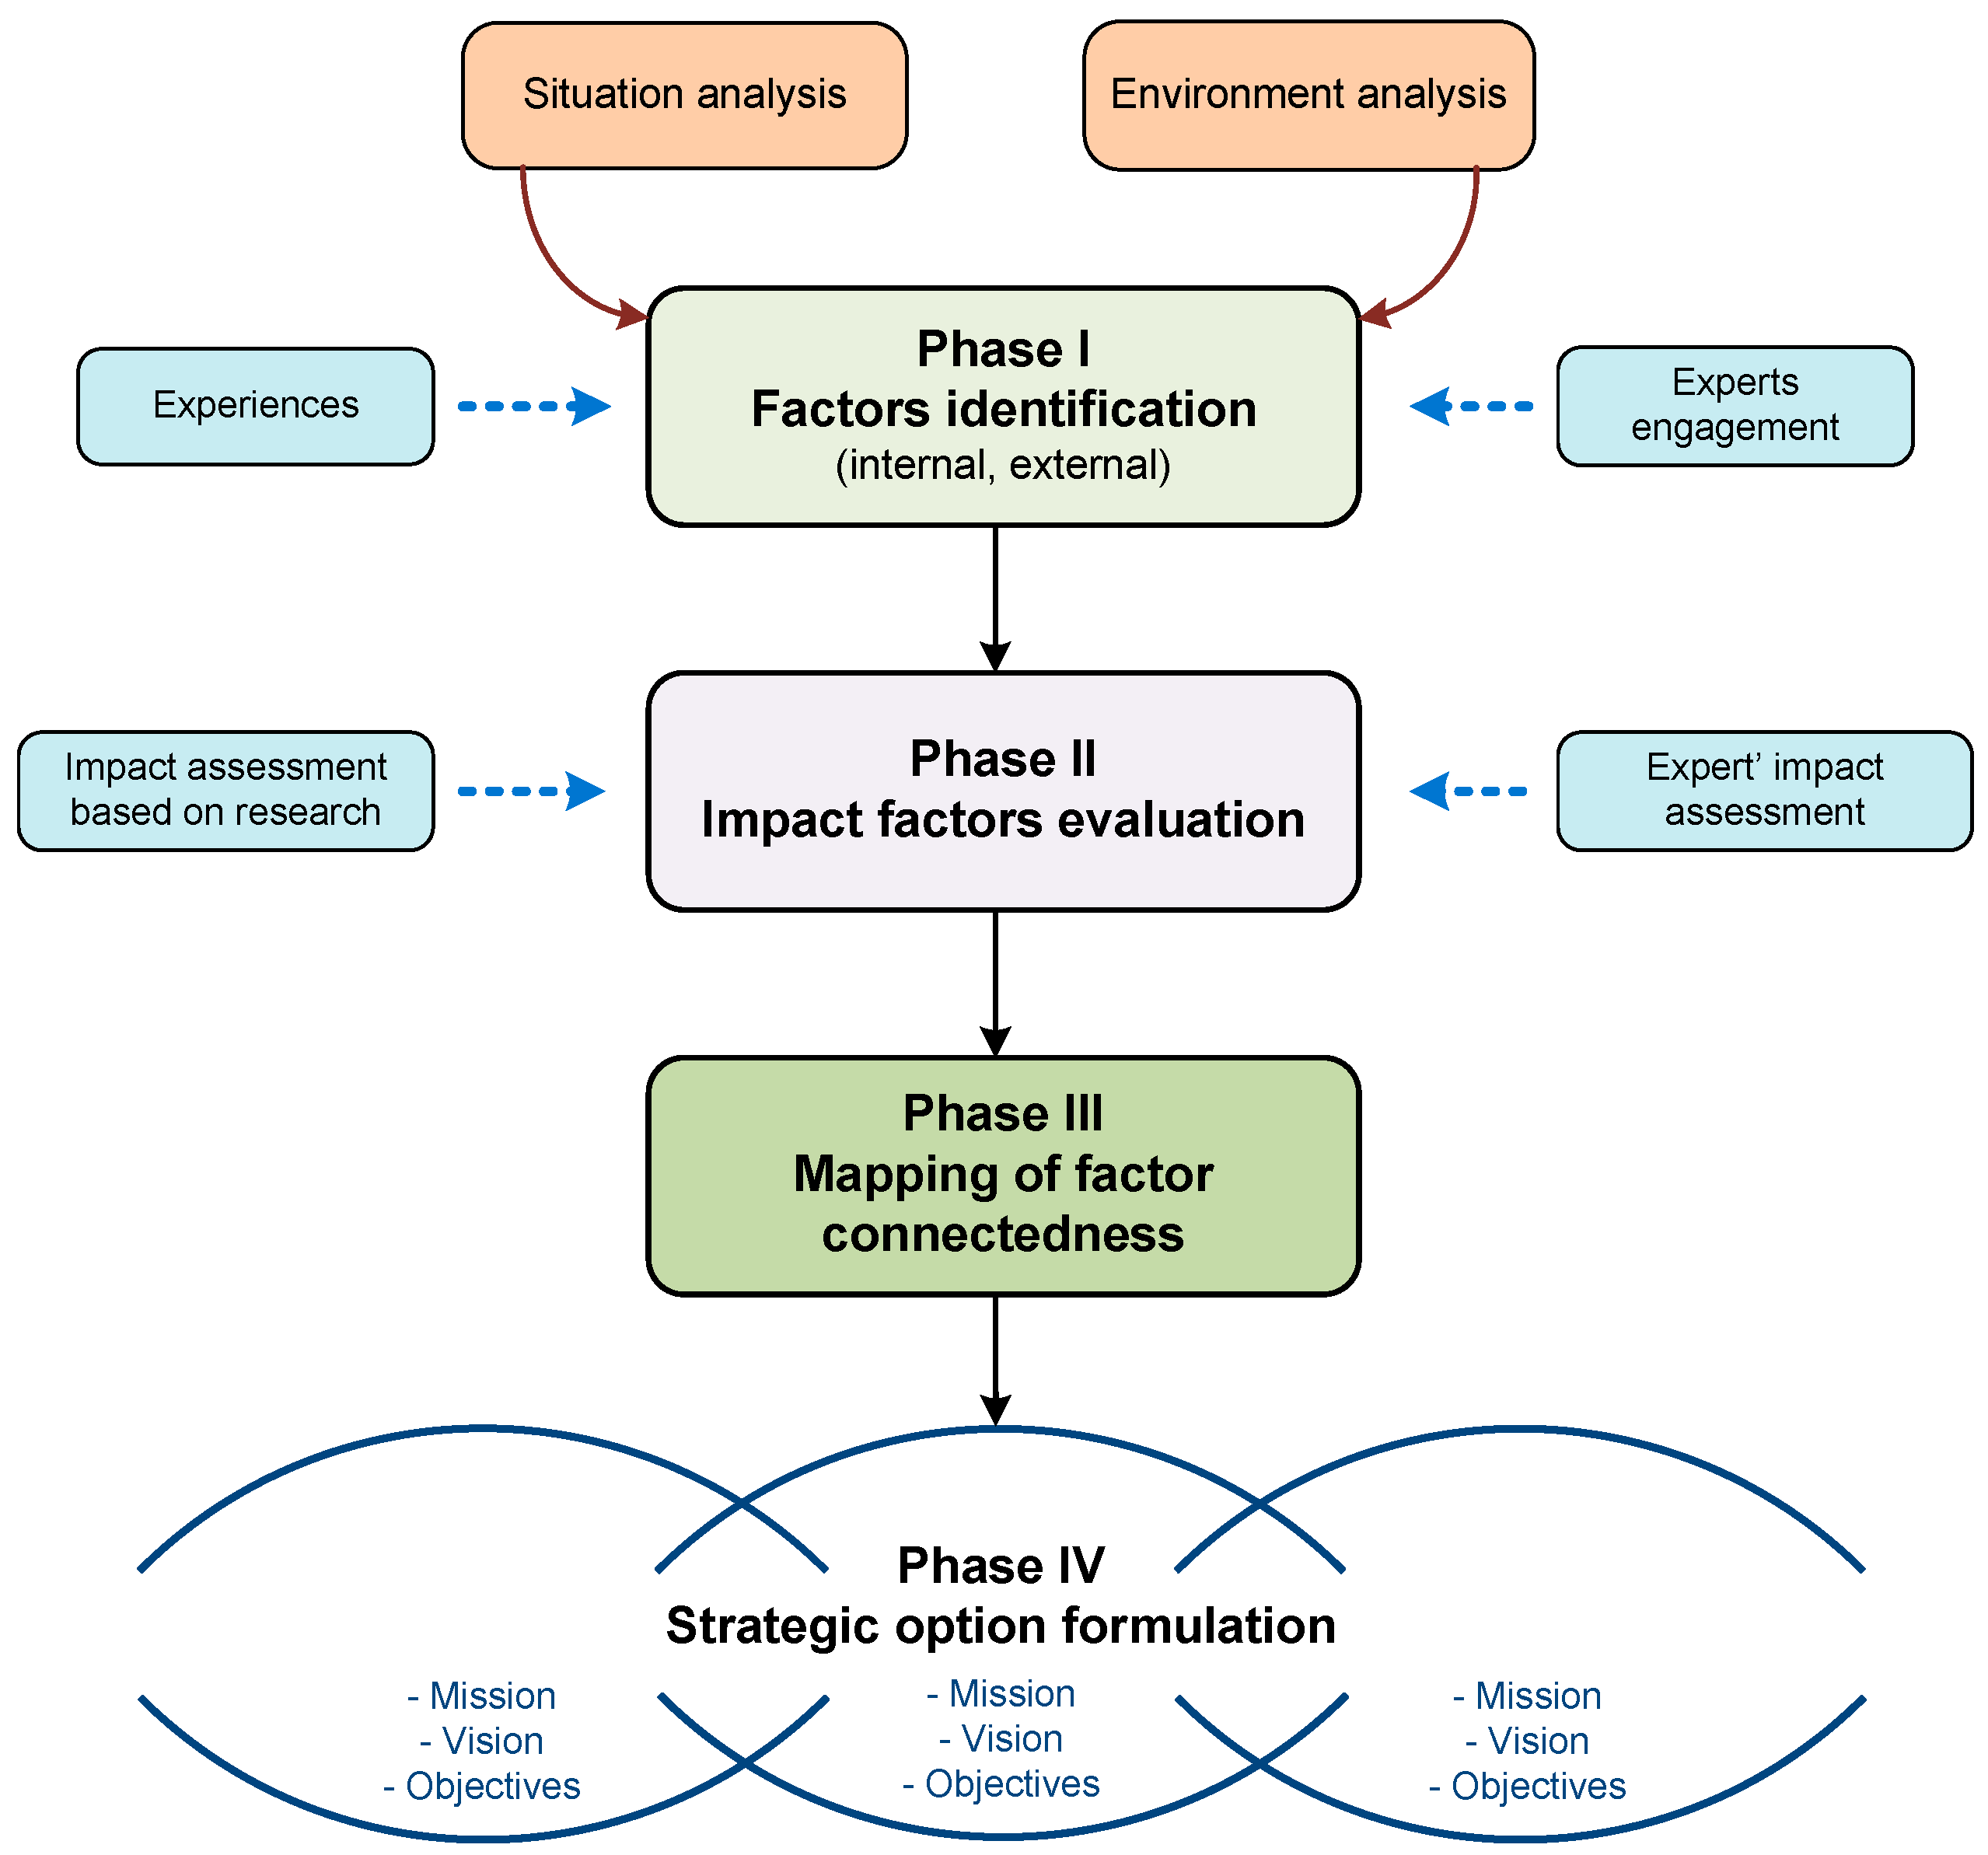
Each of these phases implies the implementation of sequence of permeated activities that can be grouped into several basic activities—presented in
Figure 1.
2.1. Strategic Analysis
The process of strategic transport management starts with strategic analysis, which consists of external and internal analysis of the company’s environment with special attention given to the operations of the transport sector. In this phase it is possible to use several methods such as SWOT analysis. The results of the first phase of this model are factors that are grouped into elements of the SWOT matrix (strengths, weaknesses, opportunities, and threats).
2.2. Strategic Option Formulation
When formulating strategic options, it should be noted that the chosen strategy must meet several basic requirements:
It is in accordance with business policy
It entails an acceptable level of risk
It is consistent with the external environment
It is acceptable in terms of available resources
It has an acceptable time frame according to the urgency of its implementation, period of strategy adoption, and the beginning of its execution
It is feasible and has measurable results, etc.
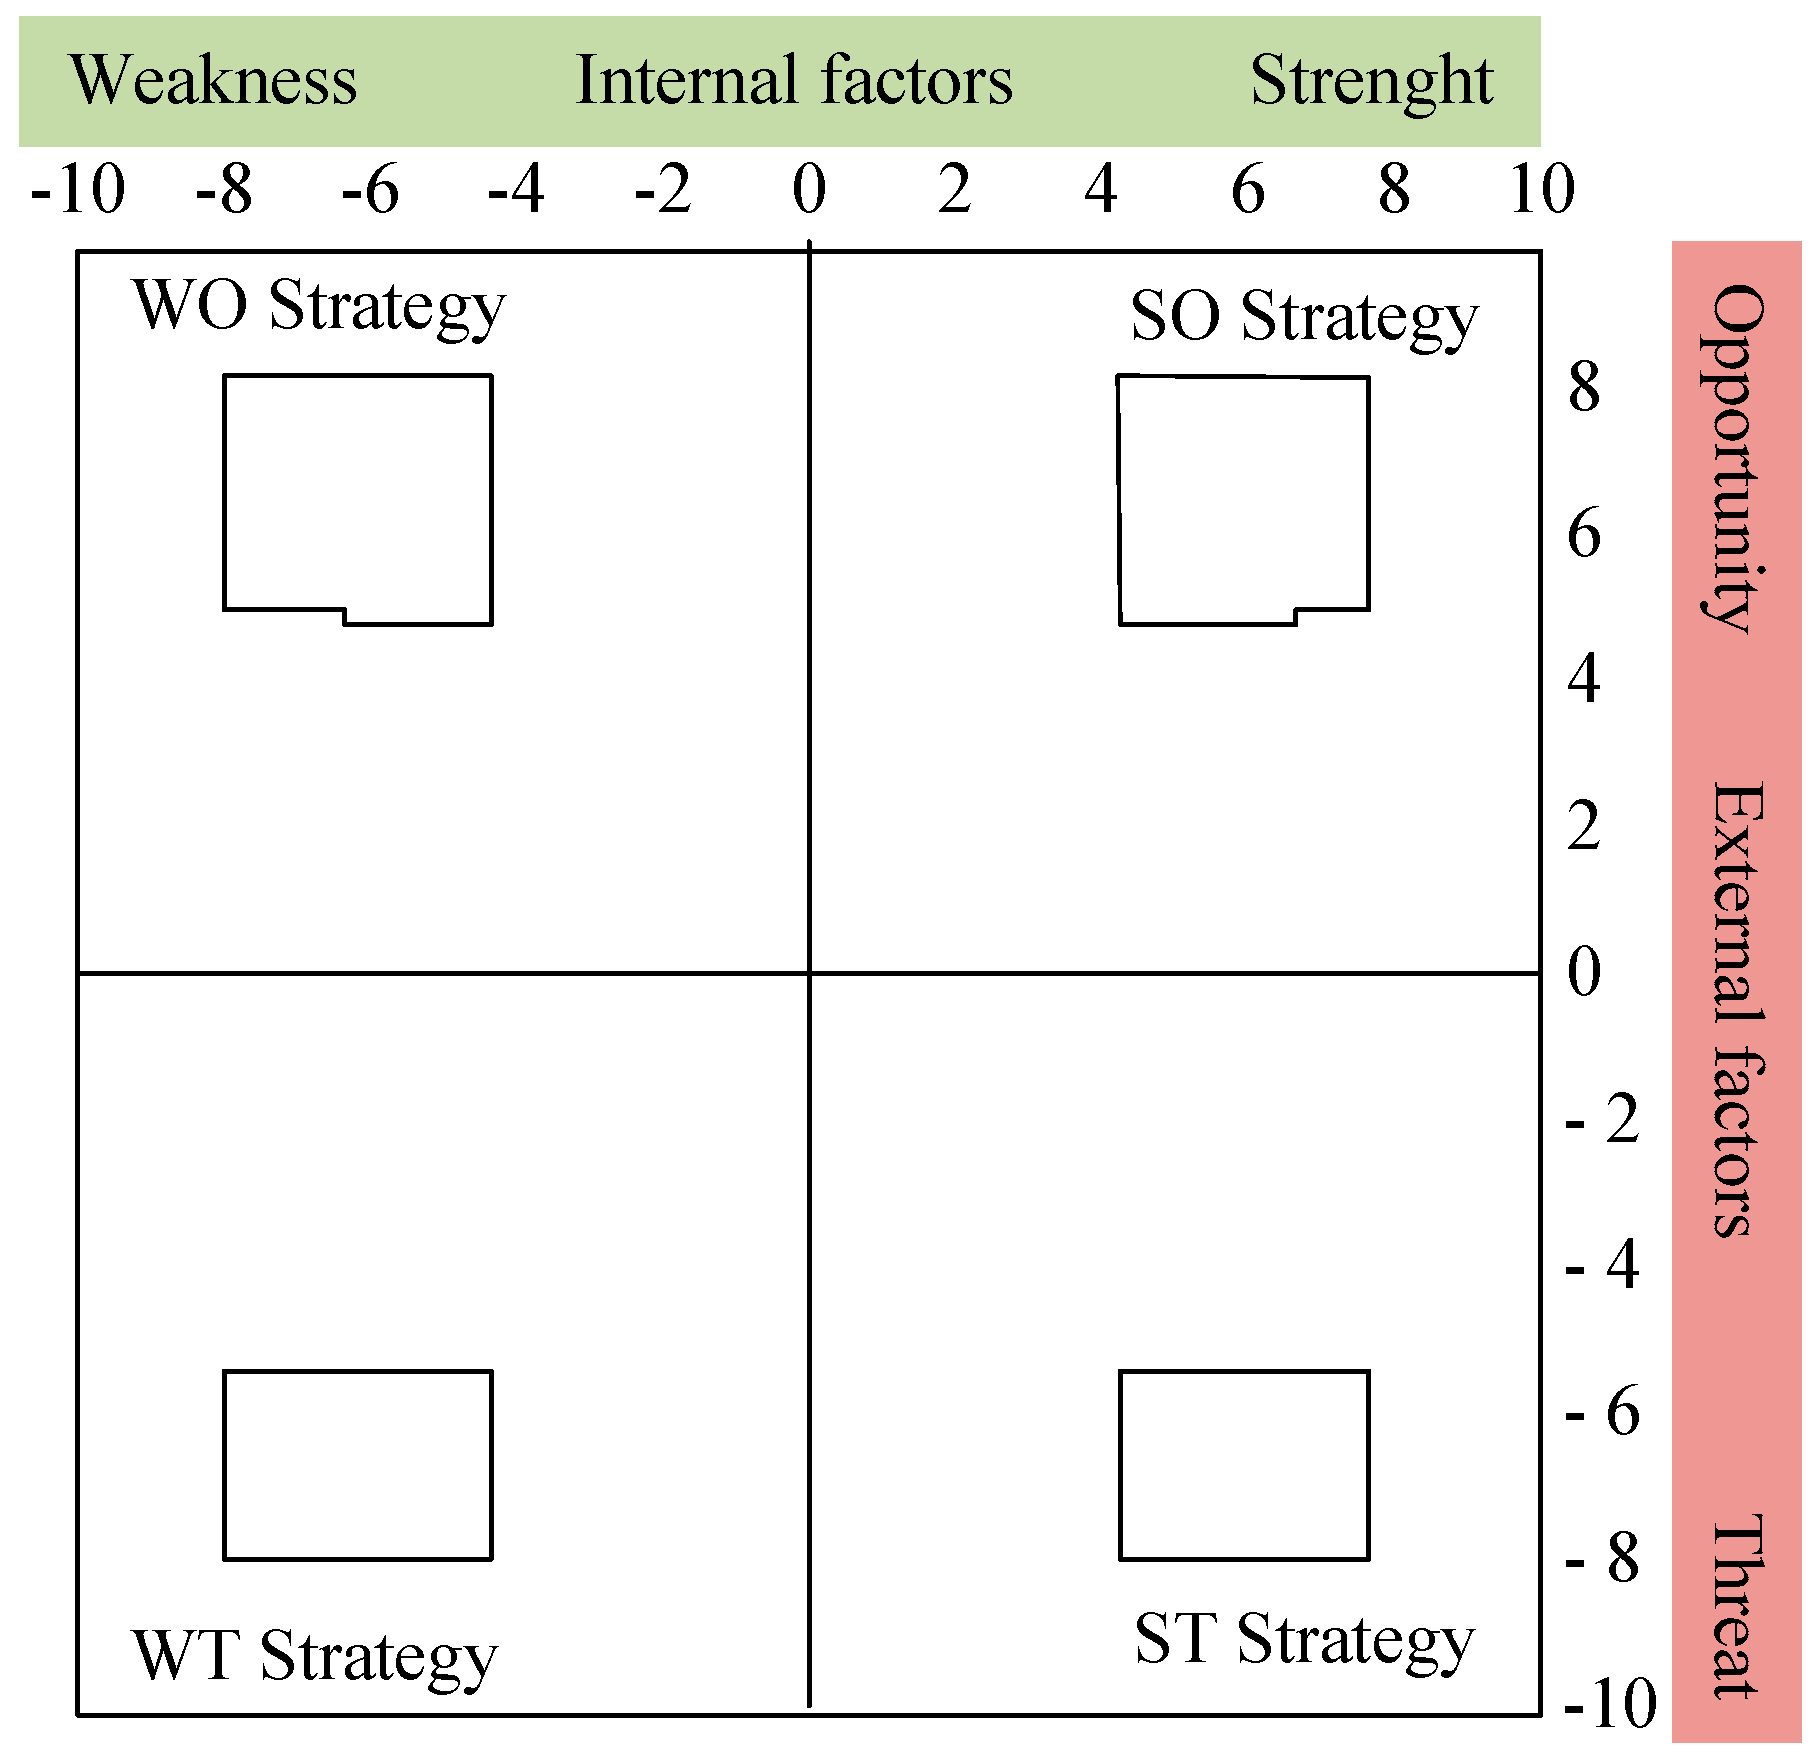
Sustainable development strategy should also meet these requirements. Many methods and techniques are used in strategic management theory and practice to provide insight into the operating requirements of companies and define adequate strategies. In this paper SWOT analysis is implemented because it is systematic, transparent, and simple to use. The process of establishing sustainable transport strategy is primary based on SWOT analysis ideas with additional modifications, as shown in
Figure 2.
After conducting a situation analysis of a company’s internal and external environment, impact factors that influence the transport sector are determined and classified into two groups: internal and external factors. Internal factors are the identified strengths and weaknesses of the company and external factors are opportunities and threats of the company’s external environment.
After determining impact factors, they are valued by applying a modification of the fuzzy Delphi method through the next steps:
Step 1. Expert selection.
Step 2. Sorting experts into groups according to their level of education, job position, previous experience, and similar research, etc. To each expert a specific weighting coefficient is assigned, , where the sum of weighting coefficients of all experts equals 1: , where N represents the number of experts taking part in the research.
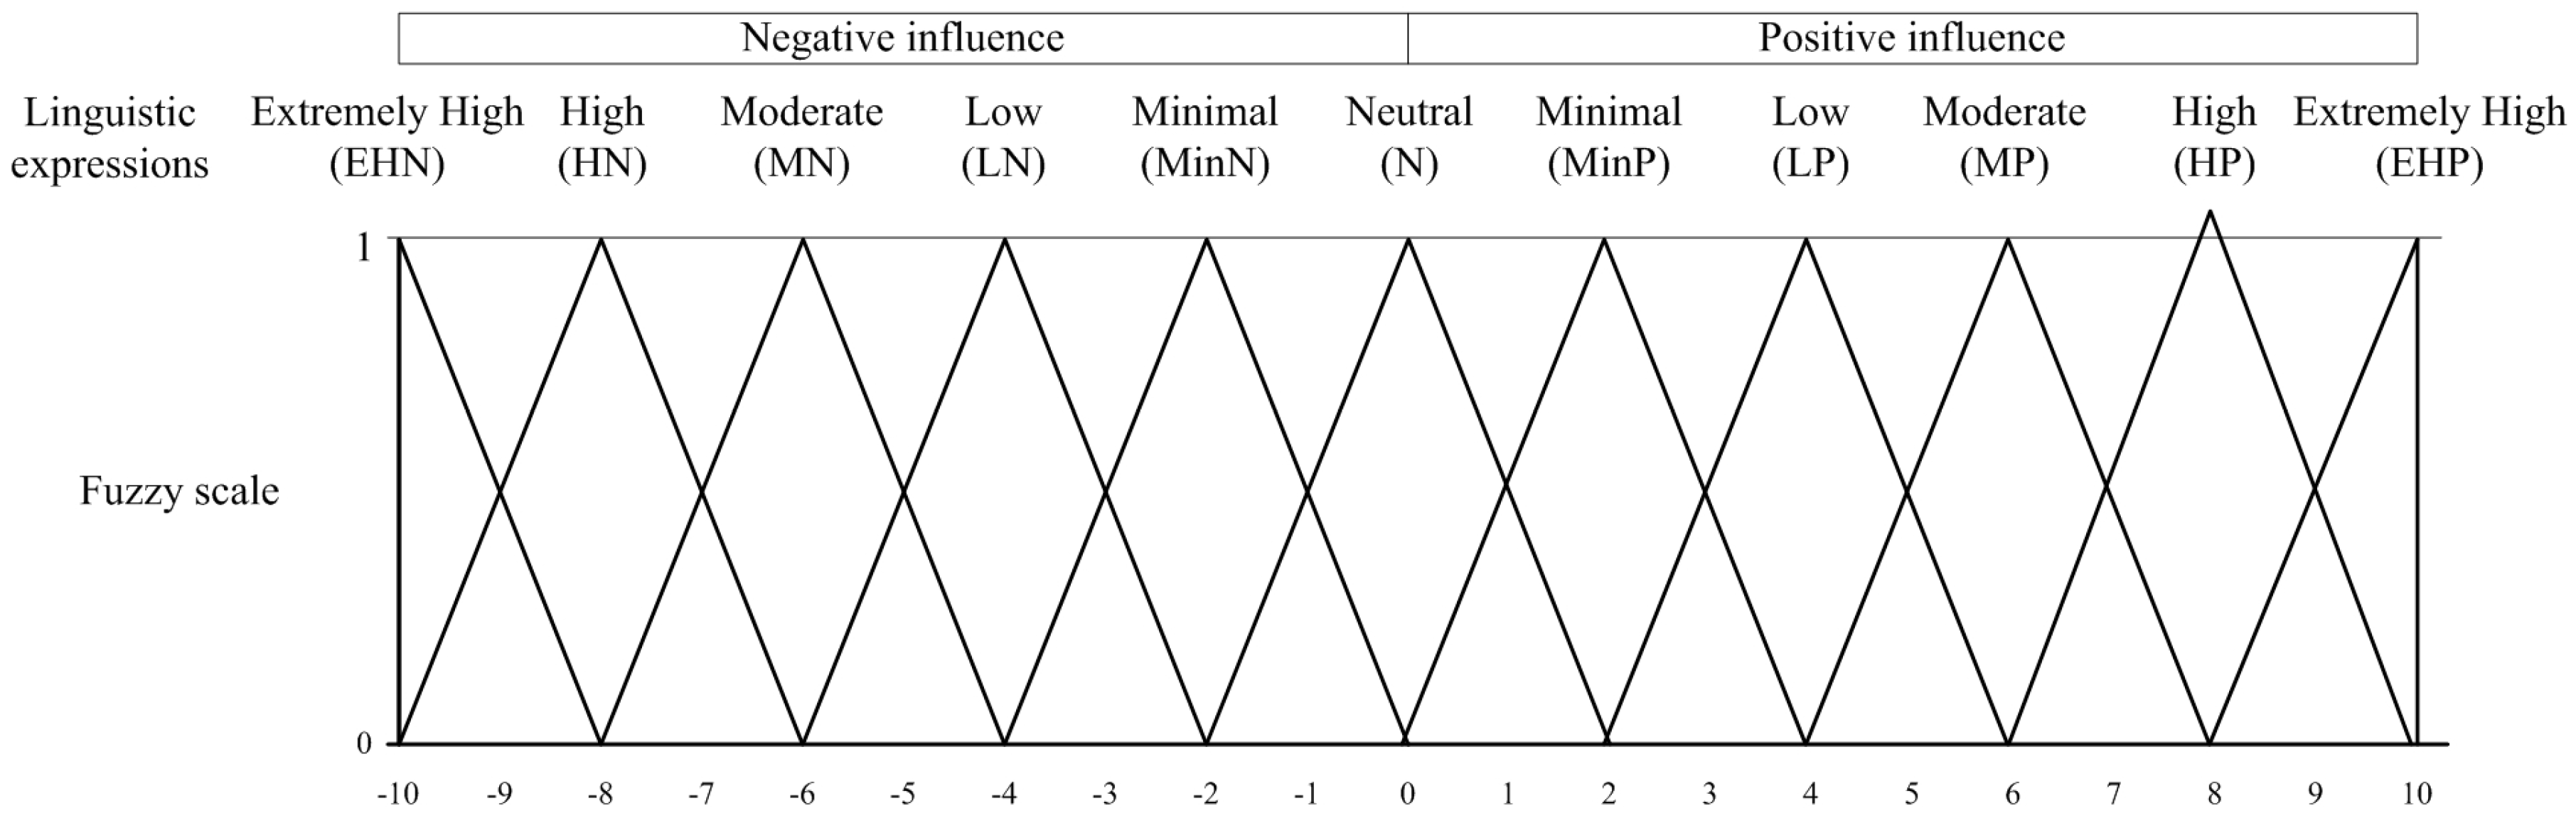
Step 3. Assessment of identified factors’ influence is provided by experts who assess the factor intensity through linguistic descriptors (very low—VL, low—L, medium—M, high—H, very high—VH). Assessed factors’ intensity values are later fuzzified through fuzzy scale transformation (
Figure 3).
Step 4. The average value of experts’ judgment is determined on the basis of specific weighting coefficients
and fuzzificated values of experts’ judgment
:
where
,
,
, and
N is the number of experts.
Step 5. The quantitative value of the group’s average judgment is determined
through the defuzzification of the average value of experts’ judgment:
Step 6. Linguistic terms for the average judgment of the group are determined through the compatibility analysis of the average value of the group’s judgment and fuzzy numbers of the scale to fuzzificate linguistic terms . For a linguistic term that represents the average value of the experts’ judgment, the value that coincides most closely with the fuzzy value is taken.
Step 7. The level of compatibility is determined on the basis of the height of the membership functions’ intersection of observed fuzzy numbers, and the linguistic equivalent of fuzzy number
that achieves the peak of determined intersection is taken:
Step 8. Results validation. To accept a specific linguistic term as the average judgment of the experts, consistency in experts’ opinion as the criterion needs to be fulfilled. This means that the sum of assigned weighting coefficients of the experts who changed their opinion in the last cycle, comparing to the previous cycle, is less than the consistency threshold
ε, which is set in advance. In this specific case, the value of the threshold is
ε = 0.15.
Step 9. After the n examination cycles , and when the stability criterion in expert judgment is fulfilled, i.e., , then expression O is taken as the average judgment of the group of experts.
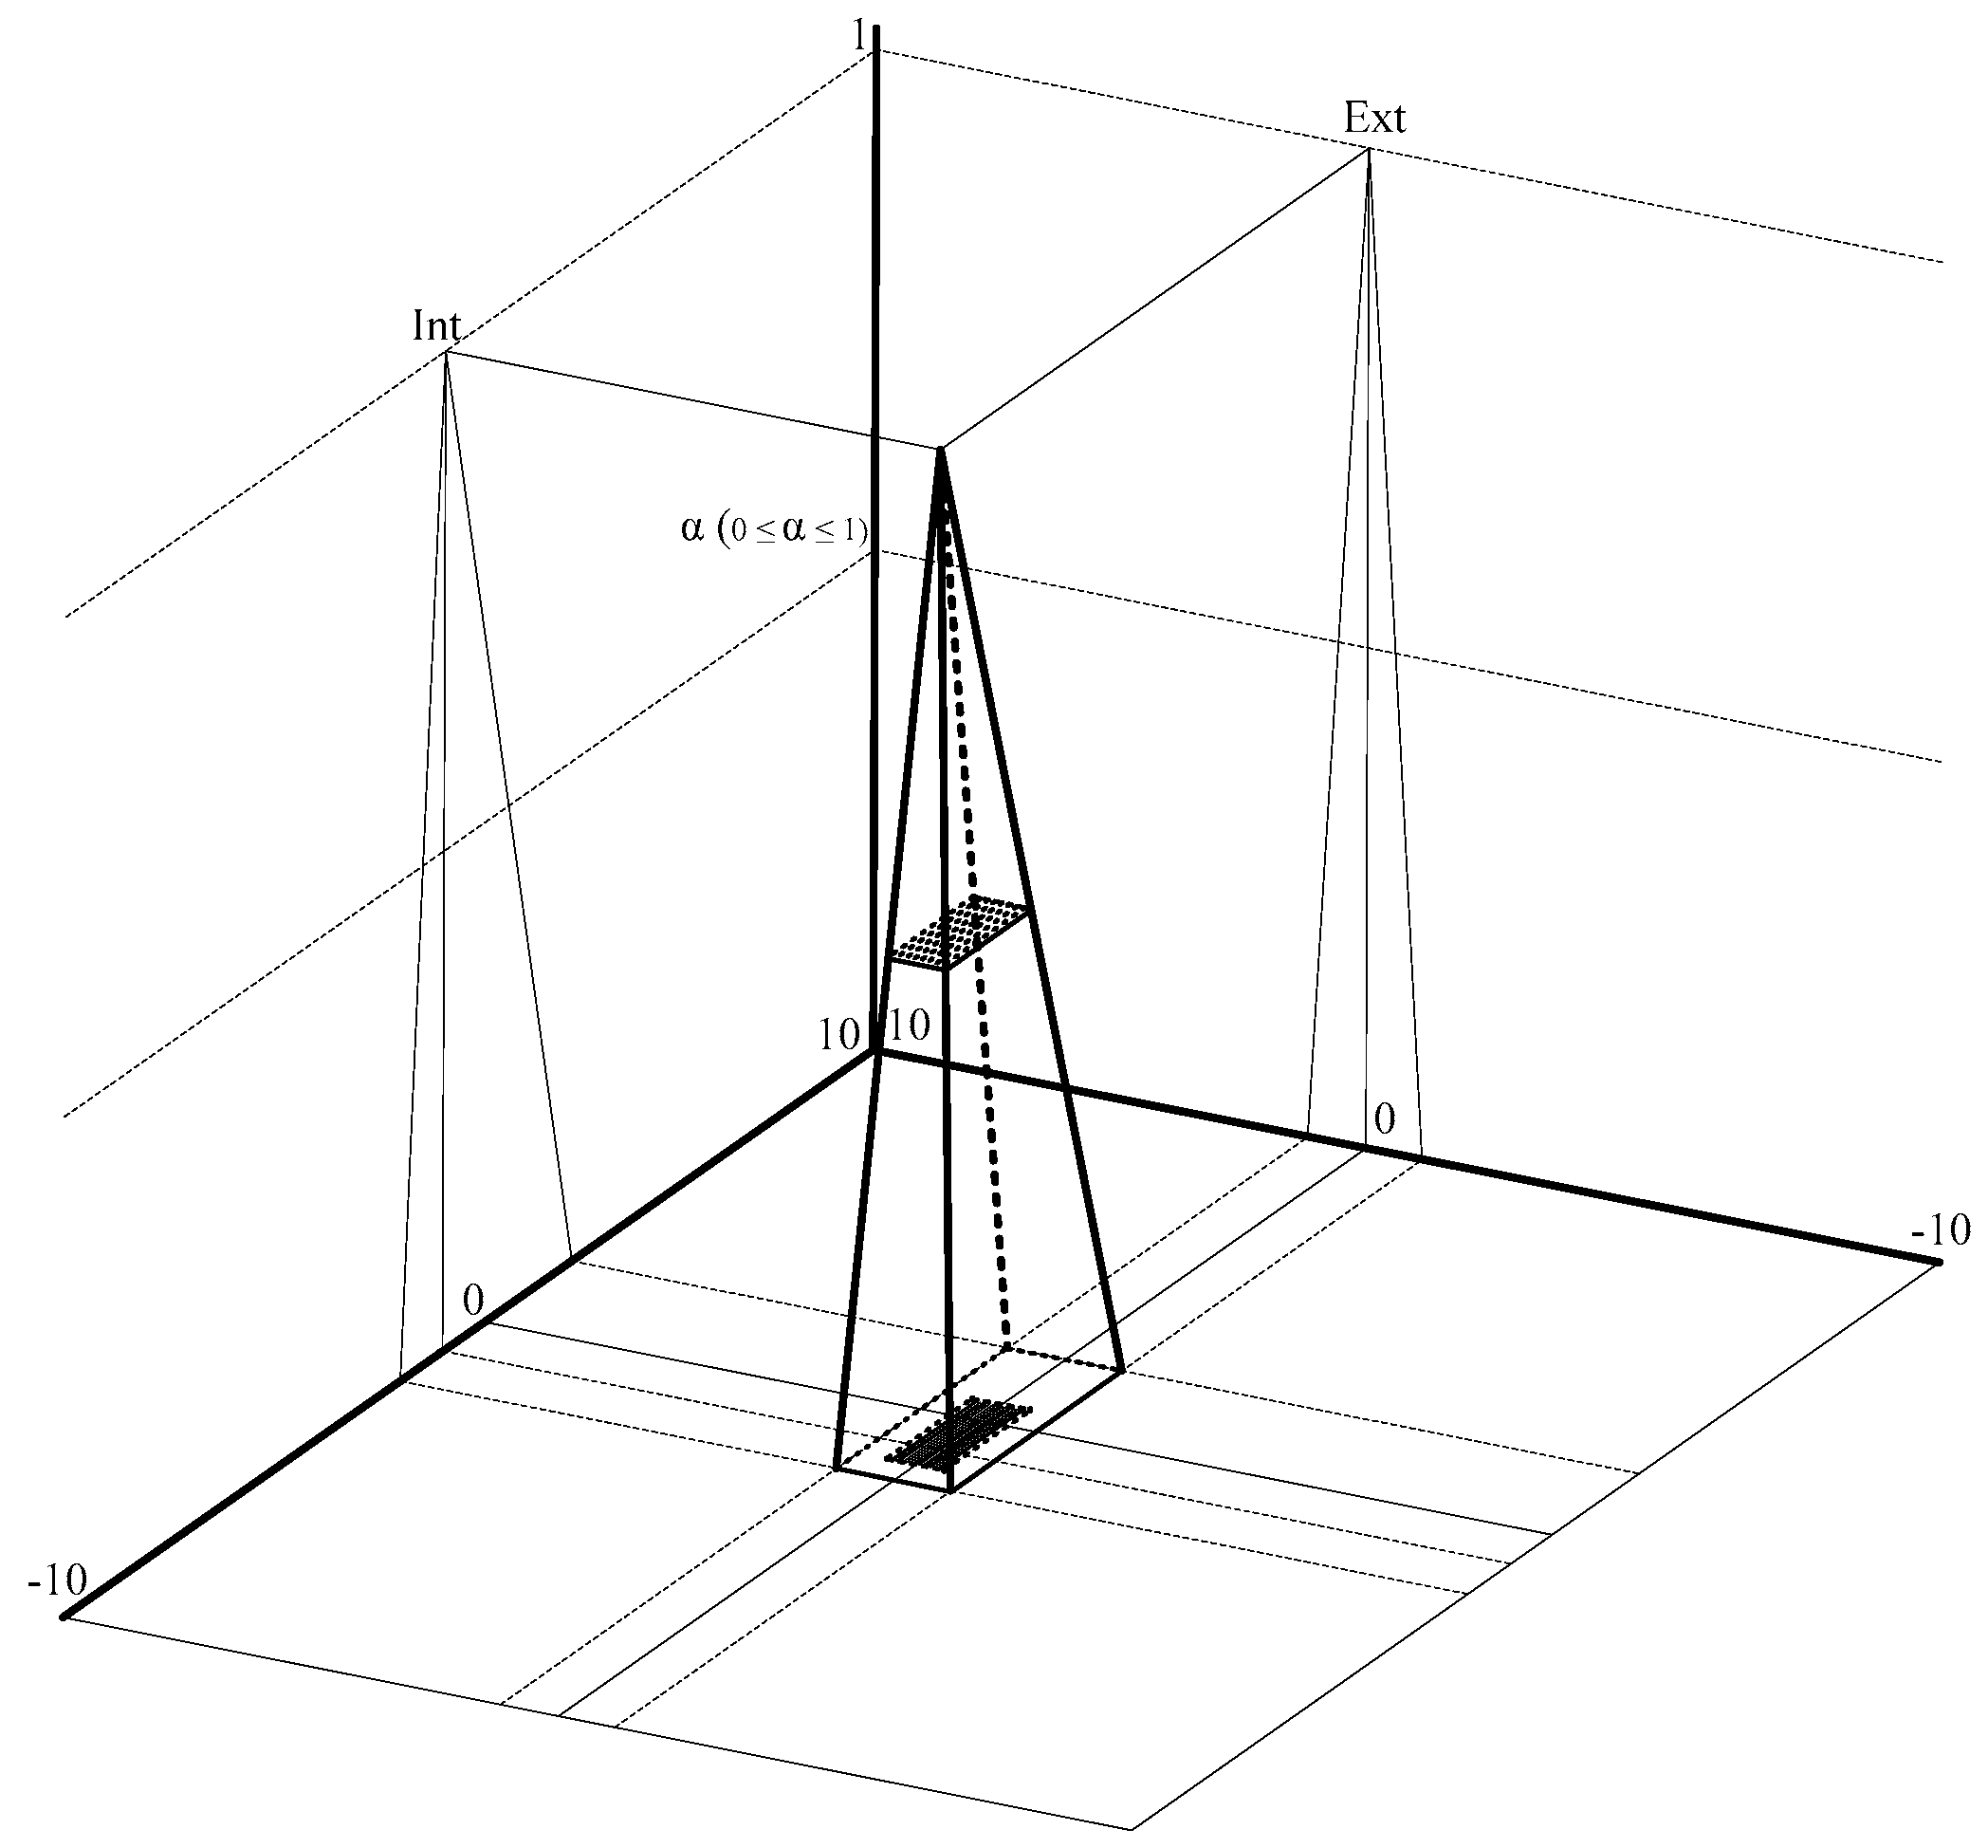
The next phase is the aggregation of the assessed values of membership function of connected internal and external factors in pairs. The result of the aggregation process is a set of pyramids that represent assumptions to formulate strategic options (
Figure 4).
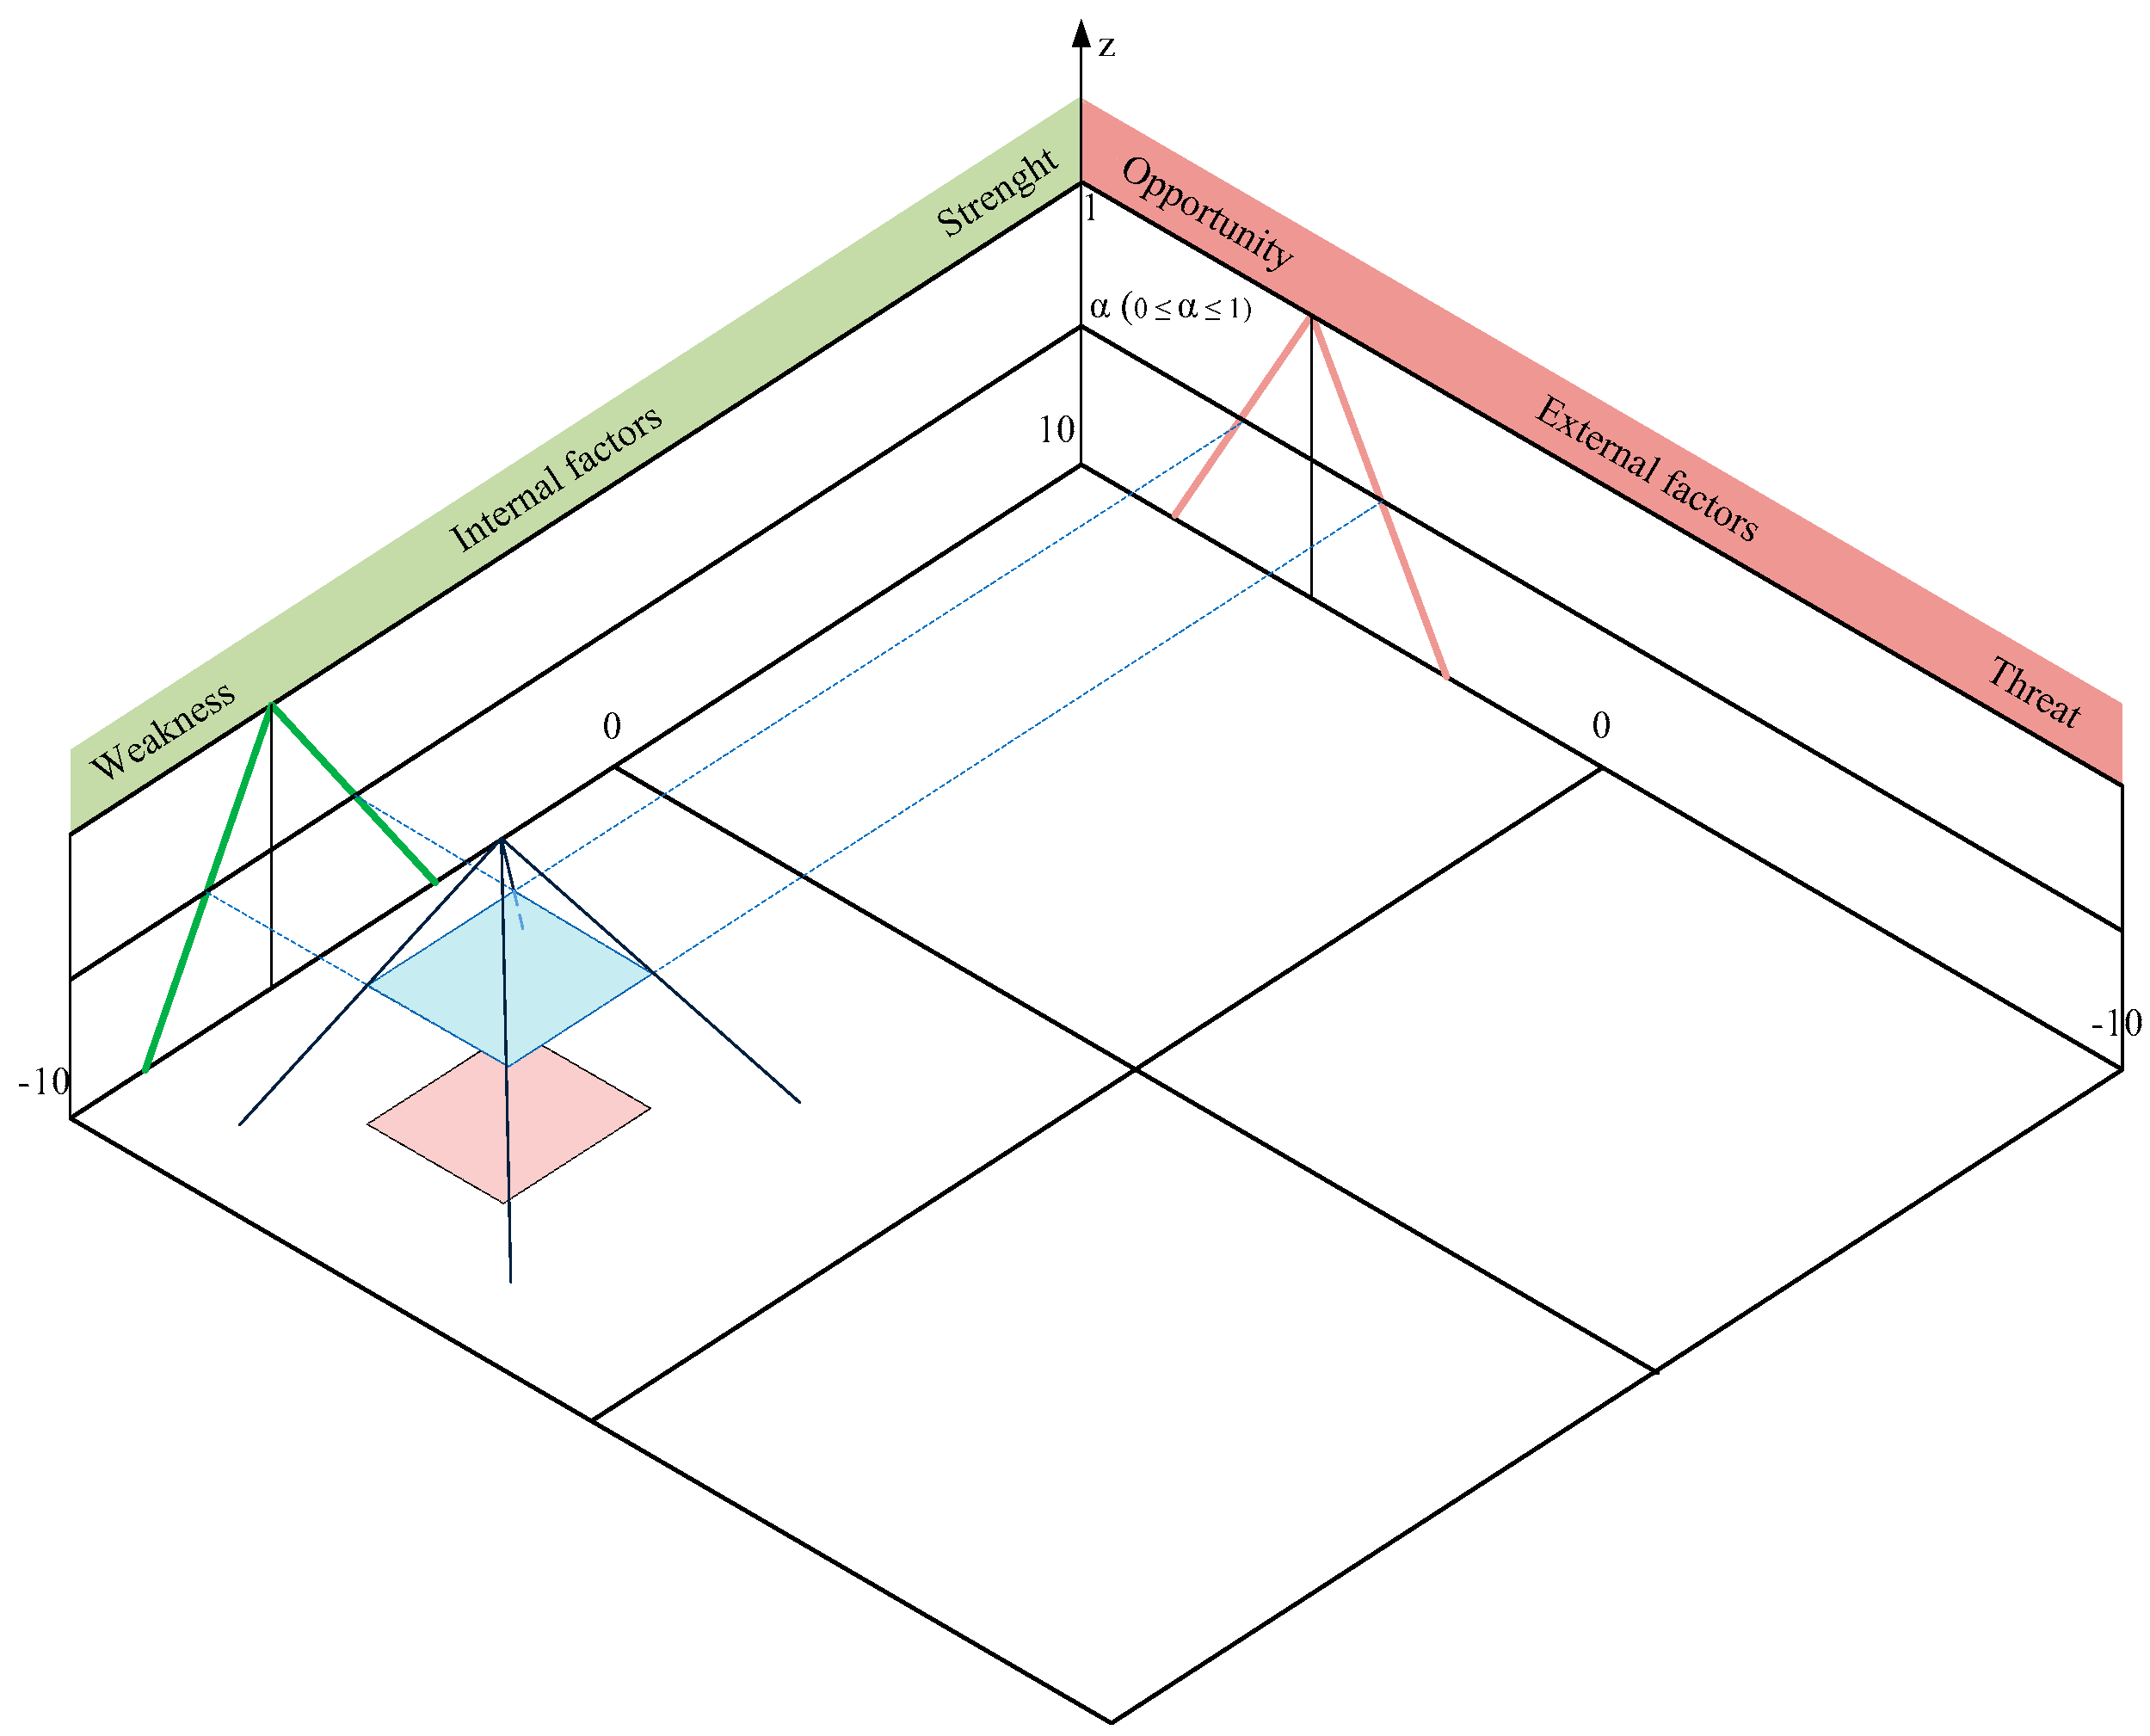
On the basis of aggregation results, further extraction proceedings of strategic options lead to the selection of an α intersection (0 ≤ α ≤ 1) of formed pyramids, its projection on the plane of pyramids’ base, and distance determination of these projections to the corner points of SWOT matrix on the base. The maximal percentage of projection surface is used as the criterion to determine the distance of projection to the corner points that is located in the appropriate quadrant of the matrix [
56].
On the basis of factors whose impacts are interconnected and that mostly fulfil the selected criterion, strategic options are formulated.
2.3. Optimal Strategic Option Selection
The selection of an optimal option from the previously determined set of optimal options is conducted through the application of the DANP method in the third phase of the strategic transport management model.
2.3.1. Integrated DEMATEL-ANP Approach
The ANP method is established with the aim of eliminating the hierarchical constraints of the AHP method [
57]. ANP represents a generalization of the AHP method, where hierarchy is replaced with a network through feedback. Compared to hierarchically structured problems, the ANP method takes different forms of dependency and feedback into account. The structure of the feedback is not linear and it has network characteristics where loops that interconnect groups frequently occur.
One of the main disadvantages of the traditional ANP method occurs when calculating relative weightings of criteria/clusters: interdependences between factors are treated as reciprocal values. As opposed to that, through the application of the DEMATEL method, the level of interdependence of factors is not a reciprocal value, and this makes it closer to real systems [
58]. Besides this constraint of the ANP method, one of the main problems for decision-makers is mapping network relations. The creation of the network relation map is a very important phase of the ANP model application because it represents the relations among criteria/clusters. In the traditional ANP method the network relations map is constructed on the basis of decision-makers’ subjective assessment. The aforementioned constraint is eliminated through the application of the DEMATEL method, since the result of its application is an effect relationship diagram (ERD) that is used for mapping network relations.
In application of the traditional ANP method, a weighted supermatrix is calculated by normalizing the unweighted supermatrix. Each column of the unweighted supermatrix is divided by the number of clusters so that each column sums to unity. This means that each cluster weighs the same. However, this is not an appropriate assumption, since it is known that clusters could have different mutual influence on one another. Although it is easy to normalize with such a method, this neglects the fact that different groups should have different degrees of influence. Thus we need to find another way of normalizing the unweighted supermatrix that does not rely on this assumption of equal weight among clusters. Here, we turn to the total-influence matrix
T in DEMATEL and threshold value α for help [
39].
By combining DEMATEL-a with the ANP method, the aforementioned problems can be solved. In this way the final results are closer to real circumstances. Later in this paper, the DEMATEL method is presented, and the authors concentrate on the process of hybrid DEMATEL–ANP (DANP) model implementation.
2.3.2. The DEMATEL Method
The mathematical formulation of DEMATEL method was established at Battelle Geneva Institute with the aim of enabling interpretation of interactive group models where there are multiple decision-makers in the decision-making process, as well as determination of qualitative factor relations that connect different aspects of social problems [
46]. The DEMATEL method enables an overview of factors’ position through their mutual influence. In this way, conditions for constructing structural relations among factors in the system are created. The mathematical concept of the DEMATEL method is evaluated and adjusted for different academic areas, such as strategy analysis, competence assessment, result analysis, selection, etc. Through its implementation in different academic areas, the DEMATEL method proved to be a very useful method in solving complex problems [
46,
59,
60,
61,
62].
Assuming that there are
m experts in the research and
n observed factors, each expert should determine the level of influence of factor
i on factor
j. Comparative analysis of the pair of factor
i and factor
j by expert
k is designated as
, where:
i = 1, ...,
n;
j = 1, ...,
n;
k = 1, ...,
m. The value of each pair
is an integer, where: 0—no influence; 1—low influence; 2—middle influence; 3—high influence; 4—very high influence. The judgment of expert
k is presented as a non-negative matrix
n ×
n rank, and each element of matrix
k in
designates a non-negative number
, where 1 ≤
k ≤
m. In accordance with this,
matrices are judgment matrices of each of
m experts. Diagonal elements of the judgment matrix have a value of 0 since the same factors do not influence each other. On the basis of judgment matrix
of all
m experts, the matrix of average judgments
is calculated to represent the average judgment value of all
m experts for each element of the
Z matrix in the following way:
where
Matrix
Z represents the starting effects caused by a specific factor, as well as the starting effects obtained from other factors. Normalized matrix of average judgment (
D) is calculated using matrix
Z:
where
The sum of each i row of the Z matrix is the total direct effect that i factor delivers to other factors and the sum of each j column of Z matrix is the total direct effect that j factor receives from other factors. Matrix D is calculated by dividing each element of matrix Z with Equation (8). Each element of matrix D is assigned a value between 0 and 1.
In the next step, the total-relation matrix is calculated (
T) of
n ×
n rank according to Equation (9). The
element denotes a direct influence of factor
i on factor
j, and the
T matrix denotes total relations among each pair of factors:
where
I represents
n ×
n identity matrix.
In total-relation matrix
T, the sum of rows and the sum columns are denoted as vectors
R and
C of the
n × 1 rank:
The value of is the sum of row i of matrix T and represents the total direct and indirect effects that factor i delivers to other factors. The value of is the sum of column j of matrix T and it represents the total direct and indirect effects that factor j receives from other factors. In cases where i = j, Equation indicates the impact of the factors and Equation indicates the intensity of the factors compared to others.
On the basis of obtained total influence matrix values, the threshold is determined (α) and a network relations map is constructed. The threshold is determined by applying Equation (13), which gives the mean of the elements in matrix
T. The aim of determining the threshold is to eliminate the influence of elements that have less influence on matrix
T [
58]:
where
N indicates the number of elements of matrix
T.
On the basis of the determined threshold, a filtered matrix T is obtained. It is used for creating network relations maps that represent a foundation for defining relations in the ANP method.
2.3.3. DANP Model
A hybrid DANP model, or an integration of DEMATEL and ANP method, is created in four steps, described in the following.
Step 1. The unweighted supermatrix determination. Before determining the unweighted supermatrix, it is necessary to define a network model for the ANP method. The network model is determined on the basis of the total relation matrix and ERD. By forming network model conditions for unweighted supermatrix determination are created. Normalize each level with the total degree of influence from the total relation matrix
T for criteria by DEMATEL. To normalize the matrix it is necessary to determine the sum of elements of the matrix by columns:
where matrix
contains factors from the group of S, W, O, and T factors (group
) and influences factors from group
. Matrix
(Equation (15)) contains factors from the group of
(
i indicates the number of internal/external sub-factors in the SWOT matrix) and influences with respect to the factors from group
, etc.,
Step 2. The normalized total influence matrix for criteria
. After obtaining matrix
, its normalization is conducted. During the process of normalizing, the criteria total-influence matrix
yields
. Normalized matrix
is shown in Equation (16):
For example, an explanation for the normalization of
on dimension
is shown by Equations (17) and (18). The sum of factors
I the group
is obtained thus:
where
indicates the values of factor influences
in relation to factors from group
, and elements
and their normalized values.
The process of calculation of other matrices in matrix is identical and we will not go deeper into defining it.
Step 3. Elements calculation of unweighted supermatrix
W. Since the total influence matrix
fills the interdependence among dimensions and criteria, we can transpose the normalized total influence matrix
by the dimensions based on the basic concept of ANP, resulting in the unweighted supermatrix
:
where matrix
indicates the values of factor influences from the group of S, W, O, and T factors (group
).
Step 4. Calculation of the elements of weighted normalized supermatrix
. Elements of weighted normalized supermatrix
are obtained by multiplying the elements of unweighted supermatrix
W and appropriate elements of normalized total influence matrix
. The elements of normalized total influence matrix
are obtained by normalizing the total influence matrix
, by applying Equations (20) and (21):
where
, and the value of
is obtained by
.
After determining the elements of matrix
, the elements of new weighted supermatrix
are calculated. The elements of matrix
are obtained by multiplying the normalized total influencematrix of the dimensions
and unweighted supermatrix
W:
Step 5. Find the limit of the weighted supermatrix . Multiply a weighted supermatrix by itself multiple times to obtain the limit supermatrix; then the weight of each evaluating criteria can be obtained. The weighted supermatrix can be raised to the limiting powers until the supermatrix has converged and become a long-term stable supermatrix to obtain the global priority vectors, called DANP influence weights, such as , where W represents the limit supermatix, while k denotes any number.
2.4. Selected Strategy Implementation
When the optimal sustainable transport strategy is selected, it is implemented in the fourth phase through the determination of perspectives, performances, and key performance indicators. A strategic map is used to visualize this process and it enables an overview of all the elements and their relations in the implementation process of the determined strategy. The DEMATEL method is applied to construct the strategic map [
63].
2.5. Strategic Control
The last phase in the strategic transport management model is strategic control. In this phase, the desired statement to be reached is determined. To realize this phase, it is necessary to constantly monitor key performance indicators and determine the statement according to perspectives and performances.
The process of statement determination by performances and perspectives, as well as future trends determination, is realized in the following six steps:
Key performance indicator determination
Indicator value transformation
Key indicator and performance weightings
Key performance indicator weighted values calculation
Performances and perspectives statement determination
Future trend determination
At the end of this process, if the statement reached is satisfying then it continues into strategy implementation. If not, appropriate corrective measures are taken for reaching the desired statement.
3. Results and Discussion
The presented strategic transport management model is applied for defining a sustainable transport strategy for NIS. The NIS is one of the greatest energy systems in southeastern Europe engaged in oil and natural gas exploration, production, and processing, as well as the sale of a wide assortment of oil and gas derivatives and energy projects.
In accordance with current macroeconomic changes that strongly influence this industry, NIS has begun current process of development strategy revision. Taking the importance of transport in sustainable development into account, long-term consideration of environmental changes occurred, as well as sustainable development strategy projection. The main challenge in sustainable transport strategy implementation is achieving a balance between environmental sustainability and competitiveness in the transport market. All of this includes investments in new technology, improvements in energy efficiency, an increase in renewable energy and recycling, and waste reduction.
The presented strategic transport management model enables long-term consideration of environmental changes and development projection.
The fourth and fifth phase, implementation and strategic control, are not explained in detail in this paper. The implementation of these phases requires monitoring of perspectives, performance, and indicators that are determined in the strategy implementation phase for a certain period of time. The aim of monitoring is to determine the reached level in the strategic control phase.
3.1. Strategic Transport Analysis in NIS
The first phase in applying the strategic transport model is strategic analysis. In order to revise the current development strategy for NIS, the first, strategic analysis phase is performed.
The strategic goal reflected in documents from NIS remains the same—to become the most efficient, fast-growing energy company in the Balkan region and to remain the leader in the domestic market. To become a regional leader, the expansion of NIS must proceed in two ways: exploration, and increased production and trade [
64].
In accordance with the commitment of NIS to implement principles of energy efficiency and the use of renewable energy, as well as the optimal use of available resources in the future, the sustainable development vision of NIS is focused on responsibility towards future generations.
According to the results of the strategic analysis and research, strengths, weaknesses, opportunities, and threats are determined and implemented in the SWOT matrix of NIS transport (
Table 1).
3.2. Formulating Strategic Sustainable Transport Options
Formulating strategic options is performed through the second phase of this model and it contains the following steps:
Identifying impact factors
Impact factors evaluation
Creating strategic options
3.2.1. Identifying Impact Factors
Internal and external factors that may affect sustainable transport strategy of NIS in the future are determined on the basis of results of performed strategic transport analysis in NIS, as well as identified strengths weaknesses, opportunities and threats (
Table 2).
3.2.2. Impact Factor Evaluation
Impact factor evaluation was conducted by 15 experts who assessed identified factors and assigned them a judgment using a linguistic scale. The expert judgment process took place between January and May 2015. Assessed intensity values of identified factors are transformed into triangular fuzzy numbers through the application of a fuzzy transformation scale (
Figure 3). Average expert judgment
, for each factor is obtained by the aggregation of individual judgment in the form of average values of a given set of fuzzy numbers (judgments) for this factor, according to the expression:
Given that is not entirely congruent with any number of the fuzzy scale for fuzzification of linguistic terms, like linguistic expert judgment interpretation, the fuzzy number that appears to be the average value of expert judgment, or its corresponding linguistic term that is mostly congruent with , should be accepted. In this sense, for a linguistic term that represents expert judgment about the influence of a specific factor, the term that will be accepted is the one whose fuzzy representation intersects at the maximum height, i.e., has the highest value of the membership degree.
In accordance with the modified fuzzy Delphi method, presented in previous parts of this paper, the process was conducted through two cycles when the required stability in expert judgment is obtained ().
Final results of this research, including identified factors, the average value of factor influence, and the linguistic term of assumed intensity of its influence and quantitative value of assumed value, are given in
Table 3.
3.2.3. Constructing Strategic Options
Strategic options construction starts with a determination of the identified factors’ interconnectedness. Combinations of factors that are relevant for strategic option formulation with the percentage of projected surface by quadrants of SWOT matrix are given in
Table 4.
The assessed values aggregation of membership function of connected internal and external factors that are connected was conducted in the next step. The result of the aggregation process was a set of pyramids that were used for strategic option formulation. An example of the combination of factors Int 5—Ext 2 is shown in
Figure 5.
To formulate sustainable transport strategic options for NIS, the selected value of α intersection is 0.5, and there are combinations of factors with a projection of the α intersection that are wholly (100%) projected in some of the strategic quadrants.
The projections of α intersection of a selected combination of internal and external factors are shown in
Figure 6.
According to selected factor combinations that are relevant to formulate strategic options, four alternative options are extracted that ensure sustainable transport strategy formulation for NIS:
Strategic option 1 (factors Int 1, Int 2, Int 4, Ext 2, Ext 4, Ext 5) Through the application of an integrated system of quality and safety management, create conditions for market expansion through organizational restructuring and transport of oil and oil derivatives dominantly redirected via railways, while optimizing the company’s own fleet for distribution of products to retail.
Strategic option 2 (factors Int 5, Int 6, Int 8, Ext 2, Ext 4, Ext 5) With road traffic dominant and a lack of awareness of the need for corporate social responsibility prevalent, continue with the standardization of the transport process and enable realization of management plans to expand the market through organizational restructuring and the use of state subsidies.
Strategic option 3 (factors Int 5, Int 6, Int 8, Ext 6, Ext 8, Ext 10) To strengthen competition, increase demand for environmental protection and management requirements for cost reduction, strive to establish a model of corporate social responsibility, and promote awareness on this issue through the standardization of remaining transport tasks.
Strategic option 4 (factors Int 1, Int 2, Int 4, Ext 6, Ext 8, Ext 10) By using the company’s own fleet and professional staff, through an integrated quality and safety management system, support the efforts of management to reduce costs and improve the quality of environmental protection, which will reduce the effect of competition in the market.
3.3. Optimal Strategic Option Selection
The optimal strategic option selection was performed through the previously described DANP method.
For determining the weighting coefficients of the S, W, O, T factors/subfactors and comparing the alternatives, 11 transport experts took part in the strategic planning. Experts with a minimum of 10 years of experience were identified. After interviewing experts, the collected data were processed and aggregation of their opinions was performed. Data collection was conducted between May and December 2015.
In the first step of DEMATEL application for the evaluation of S, W, O, T factors/subfactors the experts used the scale: 0—no influence; 1—low influence; 2—middle influence; 3—high influence; 4—very high influence. Using the fuzzy scale that is shown in
Figure 3, the experts made pairwise comparisons of factors/subfactors. The result is an average matrix
Z for each expert. A total of 11 average matrices
Z were obtained for the S, W, O, T factors/subfactors.
The aggregation of expert judgment was provided through Equation (24):
where
is the preference of the e
th expert,
M represents the set of experts who took part in the judgment process,
e represents the experts’ designation, and
m represents the total number of experts. The pairwise comparison results are shown in
Table 5.
Aggregation of experts’ opinions was performed using Equation (24). As a result, the average matrix
Z (
Table 5) was obtained. Aggregation of experts’ opinions for subfactors was done in the same way.
Through the normalization of average matrix
Z (Equations (5)–(8)), elements of initial direct-relation matrices
D were formed: matrix
for S, W, O, T factors, and matrix
for subfactors. Elements of the initial direct-relation matrix
D for factors are shown in
Table 6.
Element normalization of initial direct-relation matrix was conducted by dividing each element of average matrix by Equation (8). By applying Equations (9) and (10), the elements of the total relation matrix of S, W, O, T factors
were determined (see
Table 7).
By implementing Equations (11) and (12), the values in matrix
T are summarized by rows (R
i) and columns (C
i). Summarized values of matrices
and
by rows and columns are shown in
Table 8.
On the basis of the results that are shown in
Table 7 and
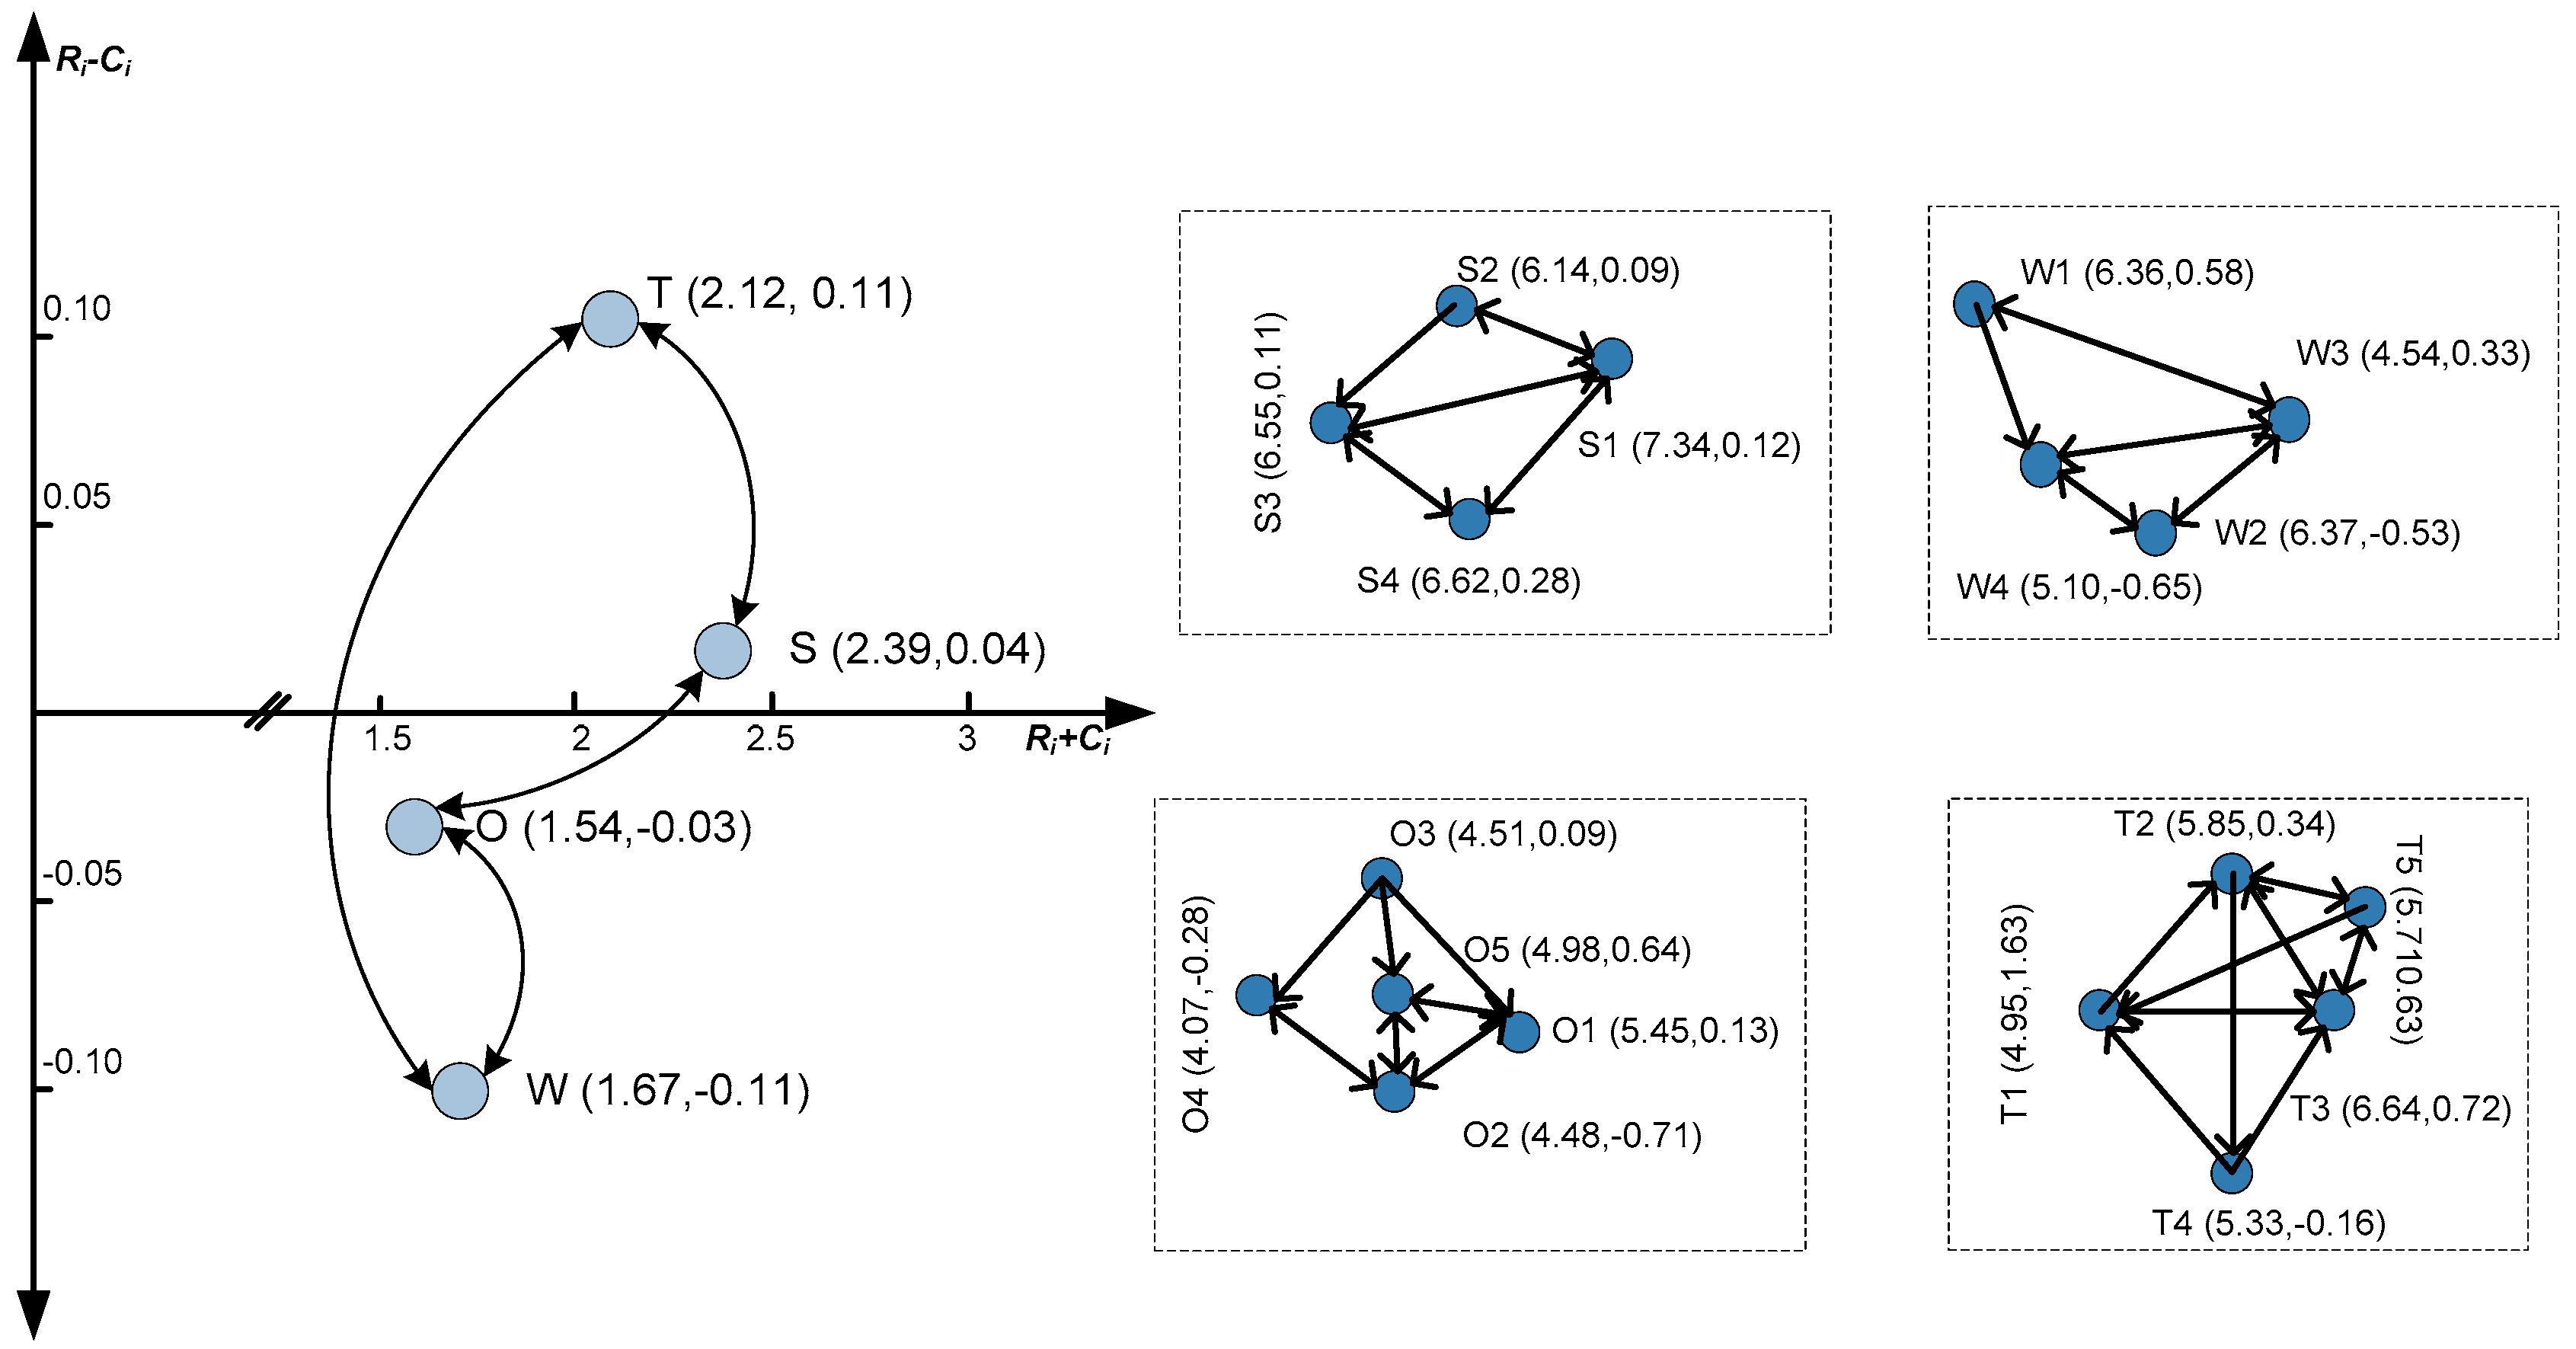
Table 8 and Equation (13), we constructed a cause and effect relationship diagram—CERD (
Figure 7)—that represents the interdependence of S, W, O, and T factors and the influence between factors within observed S, W, O, T factors. CERD is later used as the basis for the ANP method application and gives a better understanding of factor/subfactor relationships.
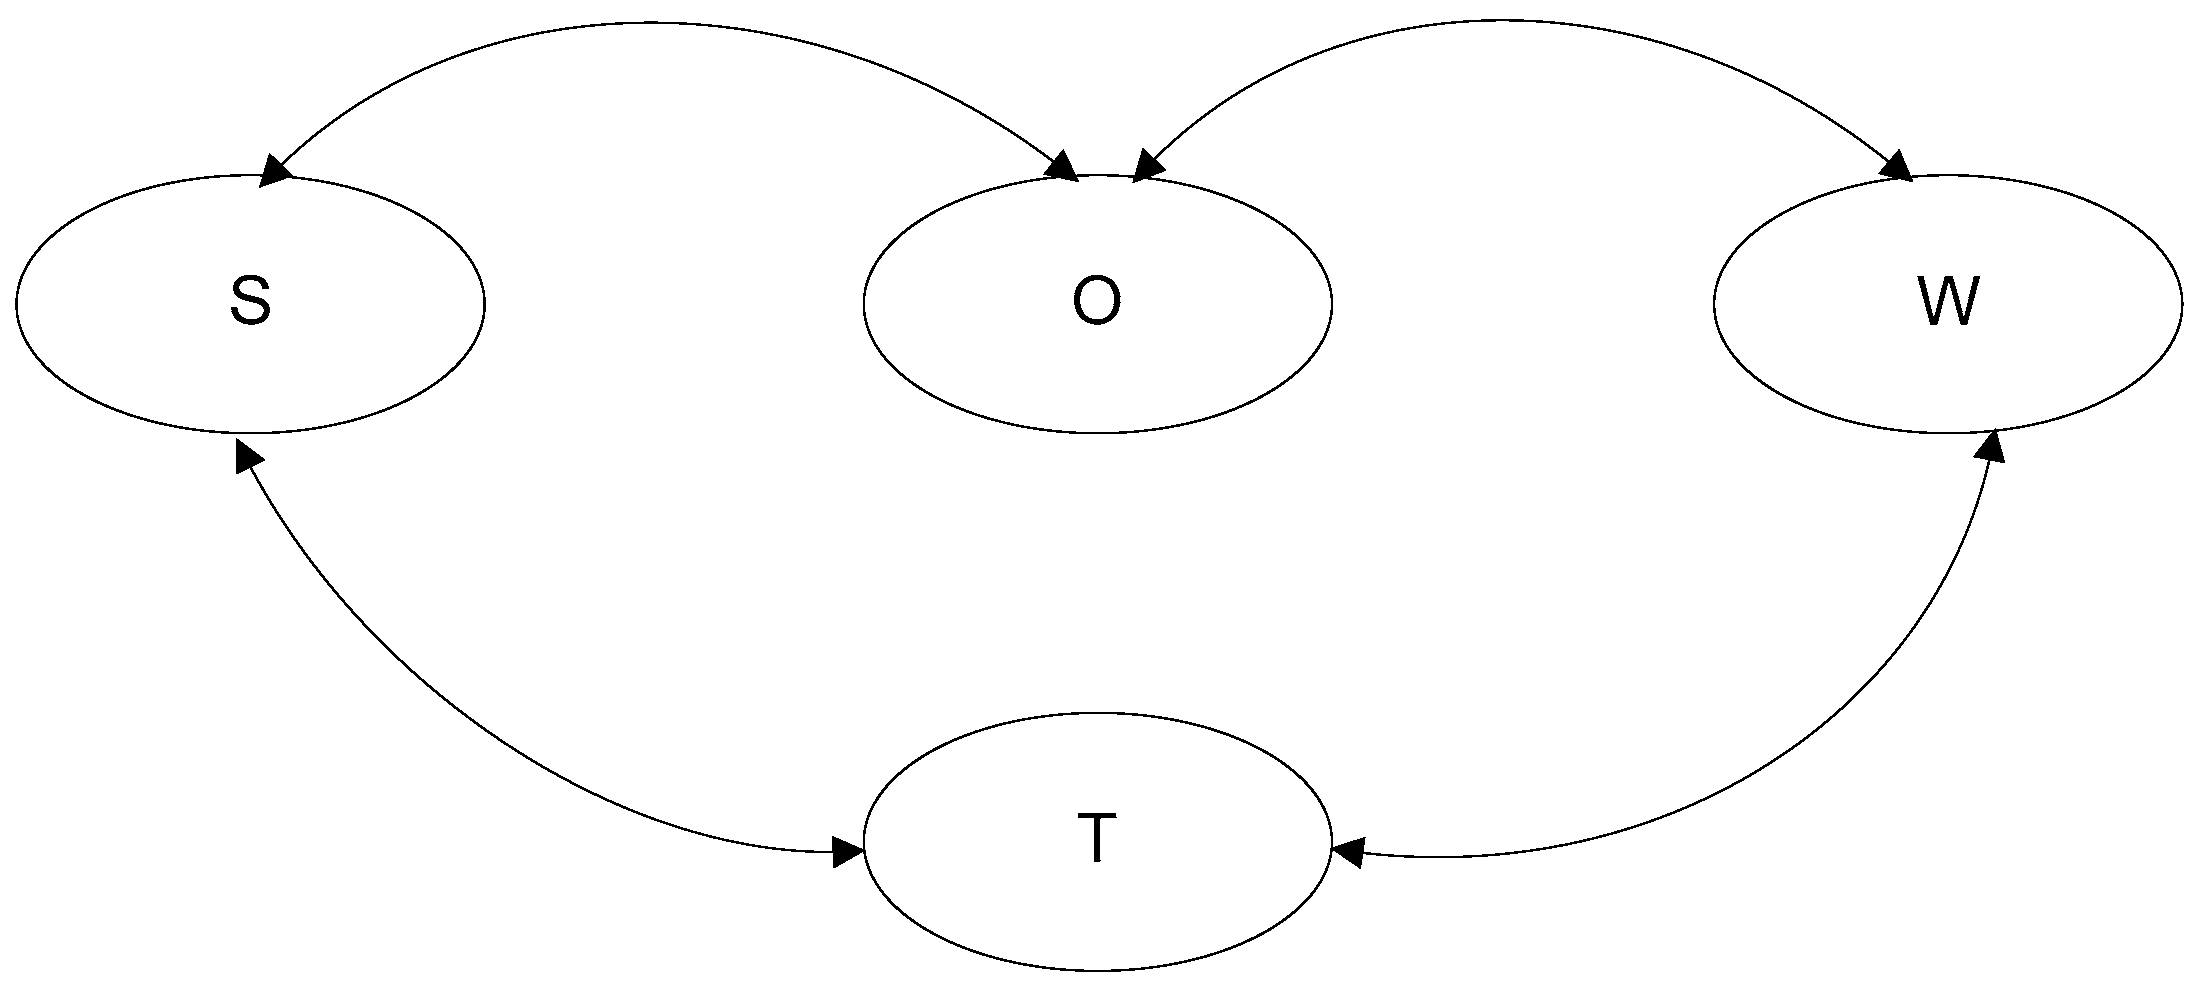
CERD is projected in the network relation map in
Figure 8, which facilitates an understanding of the model of the ANP method.
As a result of the DEMATEL application, a CERD was constructed. It is the basis of ANP application. Network relationships among criteria were defined based on calculations in matrices
and
, threshold value
α, and CERD. Understanding the network of relationships significantly aids an understanding of the ANP model, which is used to calculate criteria’s relative importance. In the first step of ANP method application, the inclusion of total-influence matrix
T in the ANP model is conducted by implementation of Equations (15)–(20), whereby an unweighted supermatrix was obtained (
Table 9). On the basis of it and by implementation of Equations (21) and (22), the elements of weighted supermatrix were calculated.
In the last step of ANP method application, the elements of the limited supermatrix are determined. Its vectors represent weighting coefficients of the model and provide us with the strategic option rank (see
Table 10).
On the basis of the results shown in
Table 10, we concluded that through DANP method application, the optimal option is
Option 4, with a weighting coefficient of 0.29.
Implementation of the selected strategy was analyzed in three scenarios. The first scenario is strategy implementation according to the presented model. The other two scenarios/models are the capability-focused strategic management model [
65] and the Balanced Scorecard based model [
66]. These two additional strategic transport management models were developed as a part of the research project VA-TT/1/15-17 supported by the Ministry of Defence, Republic of Serbia.
During the scenarios analysis of strategy implementation, transport system perspectives, performances, and their key indicators were analyzed. Four perspectives were analyzed: purpose, resources, processes, and development. For each perspective, three performances were analyzed. Performance was analyzed according to indicators of success. Scenario analysis was conducted during research work under the aforementioned project. Among the three compared models, the proposed model of strategic transport management showed the best results.
According to the current status and forecasted trends of the key indicators, set up in the strategic control phase, necessary corrective measures were identified. The following activities were suggested for improvement of the transport system:
upgrade and fully implement an integrated quality and safety management system;
provide employees with a continuing education program;
apply intelligent transport systems designed for vehicle and driver monitoring and aimed to decrease costs;
use green fuel energy and be environmentally responsible.
4. Conclusions
On the one hand, transport is one of the main factors of economic growth and quality of life; on the other hand, it is one of the main causes of environmental pollution [
23]. One of the priorities of the revised EU Sustainable Development Strategy is sustainable transport, with an overall objective of ensuring that transport systems meet the economic, social, and environmental needs of the community while minimizing their undesirable impacts on the economy, society, and environment.
The presented model of strategic transport management provides factor determination that will manifest their influence in the future, formulating possible strategic options and selecting the optimal one that enables sustainable transport strategy formulation. The model was applied to sustainable transport strategy formulation in NIS, but it is also possible to apply it in other companies that aim to establish sustainable transportation. The flexibility of this model provides an opportunity to determine industry-specific factors that can also be successfully applied in other companies and organizations.
The strategic options formulation process that is presented in this paper is based on the ideas of SWOT analysis, with specific modifications. Impact factor evaluation is conducted through fuzzy Delphi method implementation, and for strategic options formulation fuzzy SWOT analysis is implemented. At the end of this process, using a hybrid DANP model application, we selected the optimal strategic option. For sustainable transport, strategic options were formulated in applying this model, and Option 4 was selected because it includes threat mitigation from the environment relying on its own strength. By applying strategic management methods and techniques, we tried to avoid subjectivity in the formulation of strategies and make the whole process based on the scientific method. Given that experts are engaged in strategic option formulation and the selection of an optimal option, they must be competent in their particular domain. Also, the model was applied in a case study for the oil industry. For other industries it is necessary to reconsider important strategic factors and formulated strategic options.
There are few papers that observe the problem of sustainable transport strategy formulation in companies, so this paper contributes to the expansion of a theoretical framework for understanding the problems of strategic management and the establishment of sustainable development. In further analysis of this problem, the focus will be on sustainable transport strategies implementation and strategic control. Significant problems that should be considered in future works are proper treatment of subjective estimates during strategic options prioritization, the problem of consistency in DEMATEL, and the question of the model’s sensitivity analysis , especially in case of any changes in factors’ influences.
The application of the presented model completely solves the strategy implementation problem, as the largest problem in strategic management. The model also allows for monitoring of the strategic objectives of a specific company, a comprehensive assessment of its state, and quick and easy identification of key issues in order to take the appropriate corrective measures. This approach ensures the successful implementation of sustainable transport strategies.


