1. Introduction
As a mainstream idea in today’s world, sustainable development, which was first proposed in the 1980s, has already permeated into every aspect of our social lives and become a universal consensus in many countries of the world in a period of less than 40 years [
1,
2]. Cities are the primary representation and source of human civilization [
3], and also, this is where the cultural essence of human beings is concentrated. Over the past several thousand years, brilliant achievements in political, cultural and technological fields have all emerged from within the cities. In China, however, most cities have confronted unprecedented challenges along with the rapid progress of urbanization. Problems, such as continued population explosion, environmental degradation, congested traffic and severely insufficient public infrastructure, have become increasingly serious [
4]. The practice of urban planning and construction shows that the solution to these problems is to take an ecological, intensive and synergetic urban sustainable development path.
Urban sustainable development (USD) covers social, economic, resource and environmental aspects [
5,
6]. Within the social aspect, USD strives to create a society where people live a healthy and happy life by taking the slogan of “equality, vitality, harmony and stability” [
7]. In the economic aspect, efficient and intensive urban economic development by innovative and effective technological means is insisted upon [
8], so as to evenly increase the productivity of various urban economic sectors and give vitality to sustainable economic growth. In regards to the resource aspect, cities should consume natural resources in a reasonable way while providing a high-quality life for the citizens; give priority to using environment-friendly, low-carbon and recyclable resources; and strive to improve resource use efficiency [
9,
10]. On the environmental aspect, USD pays equal attention to natural environmental protection, on the one hand, and cultural heritage and development, on the other hand, with the goal of creating a healthy natural ecosystem and an abundant and harmonious cultural system [
11].
The functional optimization of urban space is one of the basic conditions of USD. In other words, USD should be safeguarded by reasonable function division, efficient land use and synergetic spatial layout. At the entire urban system level, various material elements are zoned according to different function divisions, which exert urban overall efficiency by means of effective space organization, so as to create a good environment for city operation. At a partial region level, the development of underground space provides new support for urban development. Especially in the central urban area and along the rail transit, the integration of aboveground and underground space constitutes the inseparable urban three-dimensional space, unleashing the largest potential of land resources and promoting urban space quality.
As the core of urban public traffic, rail transit not only reinforces the connection among different function divisions [
12,
13], but also promotes the joint development of aboveground and underground space along its line. Therefore, it is a key step in achieving the objectives of USD [
14,
15]. The development of urban rail transit speeds up the spatial exchange of resources, populations and economy [
16] and changes the urban spatial arrangement and land use pattern in the surrounding area. The collaborative planning of aboveground and underground space along the urban rail transit (AUSURT) also helps to create a double-layered network above and below urban ground, realize the optimal configuration of urban material elements and rational urban spatial arrangement, promote intensive and economical use of urban land [
17], improve urban space use efficiency and boost urban sustainable development [
18]. However, while many big cities in China are energetically promoting rail transit construction, the development of aboveground and underground space is lacking in rational collaborative planning due to too urgent and too hasty urban development and construction, consequently leading to a chaotic and dysfunctional urban space, disordered urban morphological structure, environmental degradation, etc. These problems increase the risks of inappropriate urban land use, causing a horrendous waste of social and natural resources, and hinder the progress of USD.
In view of the above, this paper attempts to conduct a study of the synergetic degree of AUSURT from the perspective of USD. A quantitative analysis (as this is the Introduction section, the contents aim at inducting the question and emphasizing the necessity of this study, such that we analyze problems in the subsequent sections; therefore, what is expressed here as “appropriate methods” actually refers to the “sequential synergy degree model”) is carried out using appropriate methods in order to understand its development status and tendency. On this basis, feasible measures are recommended to provide reference for future collaborative planning of AUSURT. Obviously, this study mainly focuses on the functional optimization of AUSURT, and the economic development is the topic of this paper. However, social, cultural and environmental developments, which are the important parts of USD, should be mentioned, although they are not the topics of this paper.
2. Analysis of Synergy System of AUSURT
Synergetics was founded in 1975 by the German theoretical physicist Professor Herman Hawken, which gradually developed into an important branch discipline of the self-organization theory and has been widely applied in the fields of natural science, such as physics, chemistry and biology, and the fields of economics and social sciences [
19,
20,
21,
22]. The theory studies how each component of the system cooperates to produce the space structure, time structure and function structure at the macro level. In addition, it agrees that the synergistic action of sub-systems will form the overall macroscopic movement that is better than the sum of the parts movement, which will produce the synergy effect that is “1 + 1 > 2” [
23].
The synergy theory contains not only the coordination between sub-systems in the process of evolution, but also the kinds of possible competition between sub-systems to achieve collaboration. In fact, competition is the basic premise and condition of collaboration and the most active power for the system evolution. That is because it has to achieve a certain basic condition between the system and its sub-systems in the process of collaboration, while the competition, internal and external, of the system indeed exists in the process of self-organization. As a result, the system is always in a process of unceasing evolution and constant self-organization. Even though it reaches the synergistic effect, it still keeps evolving in order to achieve a better result, which will promote the system to a higher order.
The synergy theory is an important tool and method to study systems science, and it reveals the common principle of the change in the updating process of the system development [
24]. Now, it has found more application domains, such as tourism planning [
25], logistics system [
26], traffic network [
27] and urban planning [
28,
29]. Especially in the field of urban planning, it is used to study the coordinated development of urban-rural and the synergetic development of urban agglomeration [
30,
31,
32]. However, most of these research works are about the concept, and there is no investigation to evaluate their synergy degree by a qualitative and quantitative method.
In summary, the synergy theory, taking the system made up of two or more objects interrelating with each other as its subject, studies the process and the ability of accomplishing certain tasks by cooperating and coordinating with each other. The AUSURT is such a system, which realizes its synergy through the mutual cooperation and competition between each factor. Therefore, there is a certain valuable feasibility and applicability to use the synergy theory to study the system of AUSURT.
In order to carry out this study, a synergy system of AUSURT is created firstly. This system takes society, economy, environment and other elements as the material basis for its survival and development within a specific region along the rail transit. It aims to achieve the objective of the intensive use of land resources through the interaction between these elements and gradually develops itself into a well-structured organic whole, which shows a complex time-space characteristic.
The synergy system maintains a complex multi-dimensional relationship with the external environment, and at the same time, the internal elements nonlinearly interact with one another. This study focuses on the spatial level to probe into the synergy issues of AUSURT, so these factors considered are different from those considered by urban planning and development. Once again, it is necessary to state that the function synergy of AUSURT is the focus of this study, and it is reflected in land use and traffic along the rail transit. Therefore, it is the economic value that mainly drives our inquiry, and this study can only address USD from an economic perspective. In combination with the requirements of USD, the synergy system is divided into four sub-systems: land use, traffic condition, population effect and underground space. The reasons why these factors are chosen are that: on the one hand, these factors have close relations with the research object and can show the synergic relationship of AUSURT to a certain level; on the other hand, they can also represent the human social behavior in the evolution process of AUSURT by a two-dimensional scale, which reflects the evolutionary trend and feature of AUSURT. For the rest, such as cultural and environmental concerns, they do affect the synergic evolution of AUSURT, but we could not put them into this simple mathematical equation, because they are difficult to address by this study and need a different research approach and method. In addition, the order degree of each sub-system can be, according to the sub-system characteristics, represented by means of one or more order parameters. By determining the order parameters of the sub-systems, an order parameter system of the synergy system of aboveground and underground space along the rail transit can be established.
2.1. Land Use Sub-System
Land use is the most dynamic and closely responsive sub-system of the synergy system. Urban rail transit and land use interact with and influence each other [
33,
34]. On the one hand, urban traffic demand, which impacts the traffic system pattern, depends on land development, and the intensive land development is based on demand for a big volume traffic system to meet the travel requirements of citizens. On the other hand, urban rail transit construction increases the accessibility of the surrounding areas in the vicinity of rail transit stops [
35,
36,
37], attracts more residential and commercial land use and promotes the high plot ratio development of the land along the rail transit, thus affecting other urban land use patterns and features. Apparently, the influence rule of the land value on the land use intensity is the main focus of this sub-system. As well as being quite sensitive to traffic accessibility, the service industry, the cultural and entertainment industry and commercial land use in the vicinity of rail transit stops are easily affected by rail transit construction [
38]. For example, along Shenzhen Rail Transit Line, 3390.75 hm
2 of land have renovation potential; 235.16 hm
2 of land have development potential; the existing gross construction area is 27,638,700 m
2; and after planning, the gross construction area reaches 39,313,900 m
2.
In accordance with land use indexes [
39,
40,
41,
42], the land use sub-system is divided into three components: land use intensity, land use structure and land economic benefits.
Generally speaking, 500 m within the rail transit station is the ideal walking distance; therefore, it is usually regarded as a land value dividing line. Value adding is high within this area and is gradually reduced as one moves outside the area [
43,
44]. The increase of land use within this area usually leads to highly intensive land development. In this paper, the plot ratio of the area within a 500-m distance from the rail transit station is used as the order parameter of land use intensity.
Residential density in areas along the rail transit is relatively high, and the land is also used for commercial purpose and retail service [
45,
46]. This kind of land use mode not only complies with the law of social development, but also helps to improve land use efficiency. Therefore, residential land proportion, commercial land proportion, government land proportion, industrial land proportion, warehouse land proportion and unutilized land proportion are taken as the order parameters of land use structure.
Urban rail transit exerts a great influence on the land price, and the closer to the rail transit station, the greater the influence will be [
47,
48,
49]. Therefore, the commercial and residential land prices along the rail transit line are taken as the order parameters of land economic benefits.
2.2. Traffic Condition Sub-System
The traffic condition is an important aspect of the integrated use of aboveground space in the synergy system. In recent years, the car ownership numbers have increased rapidly in the cities [
50]. China has entered an era of vigorous growth of private transportation, and as a result, the traffic flow in the city also increases with each passing year [
51,
52]. Among the travel modes, the private car proportion increases rapidly [
53], leading to a deterioration of the urban transportation system [
54]; the proportion of public transportation reduces [
55], and consequently, urban transportation structural contradictions become increasingly serious. Being characterized by large volume, fast speed, less pollution and low energy consumption, urban rail transit has become the most important transportation means in a modern metropolis [
56]. It not only optimizes the urban transportation system, but also is environment-friendly, so it plays an irreplaceable role in the progress of USD. As shown in
Figure 1 on the next page, the public transportation proportion in Shenzhen was 25% in 1999 [
57], but dropped to 19% in 2005 [
58]. Due to the construction of rail transit, the public transportation proportion increased every year and reached 47.2% in 2010 [
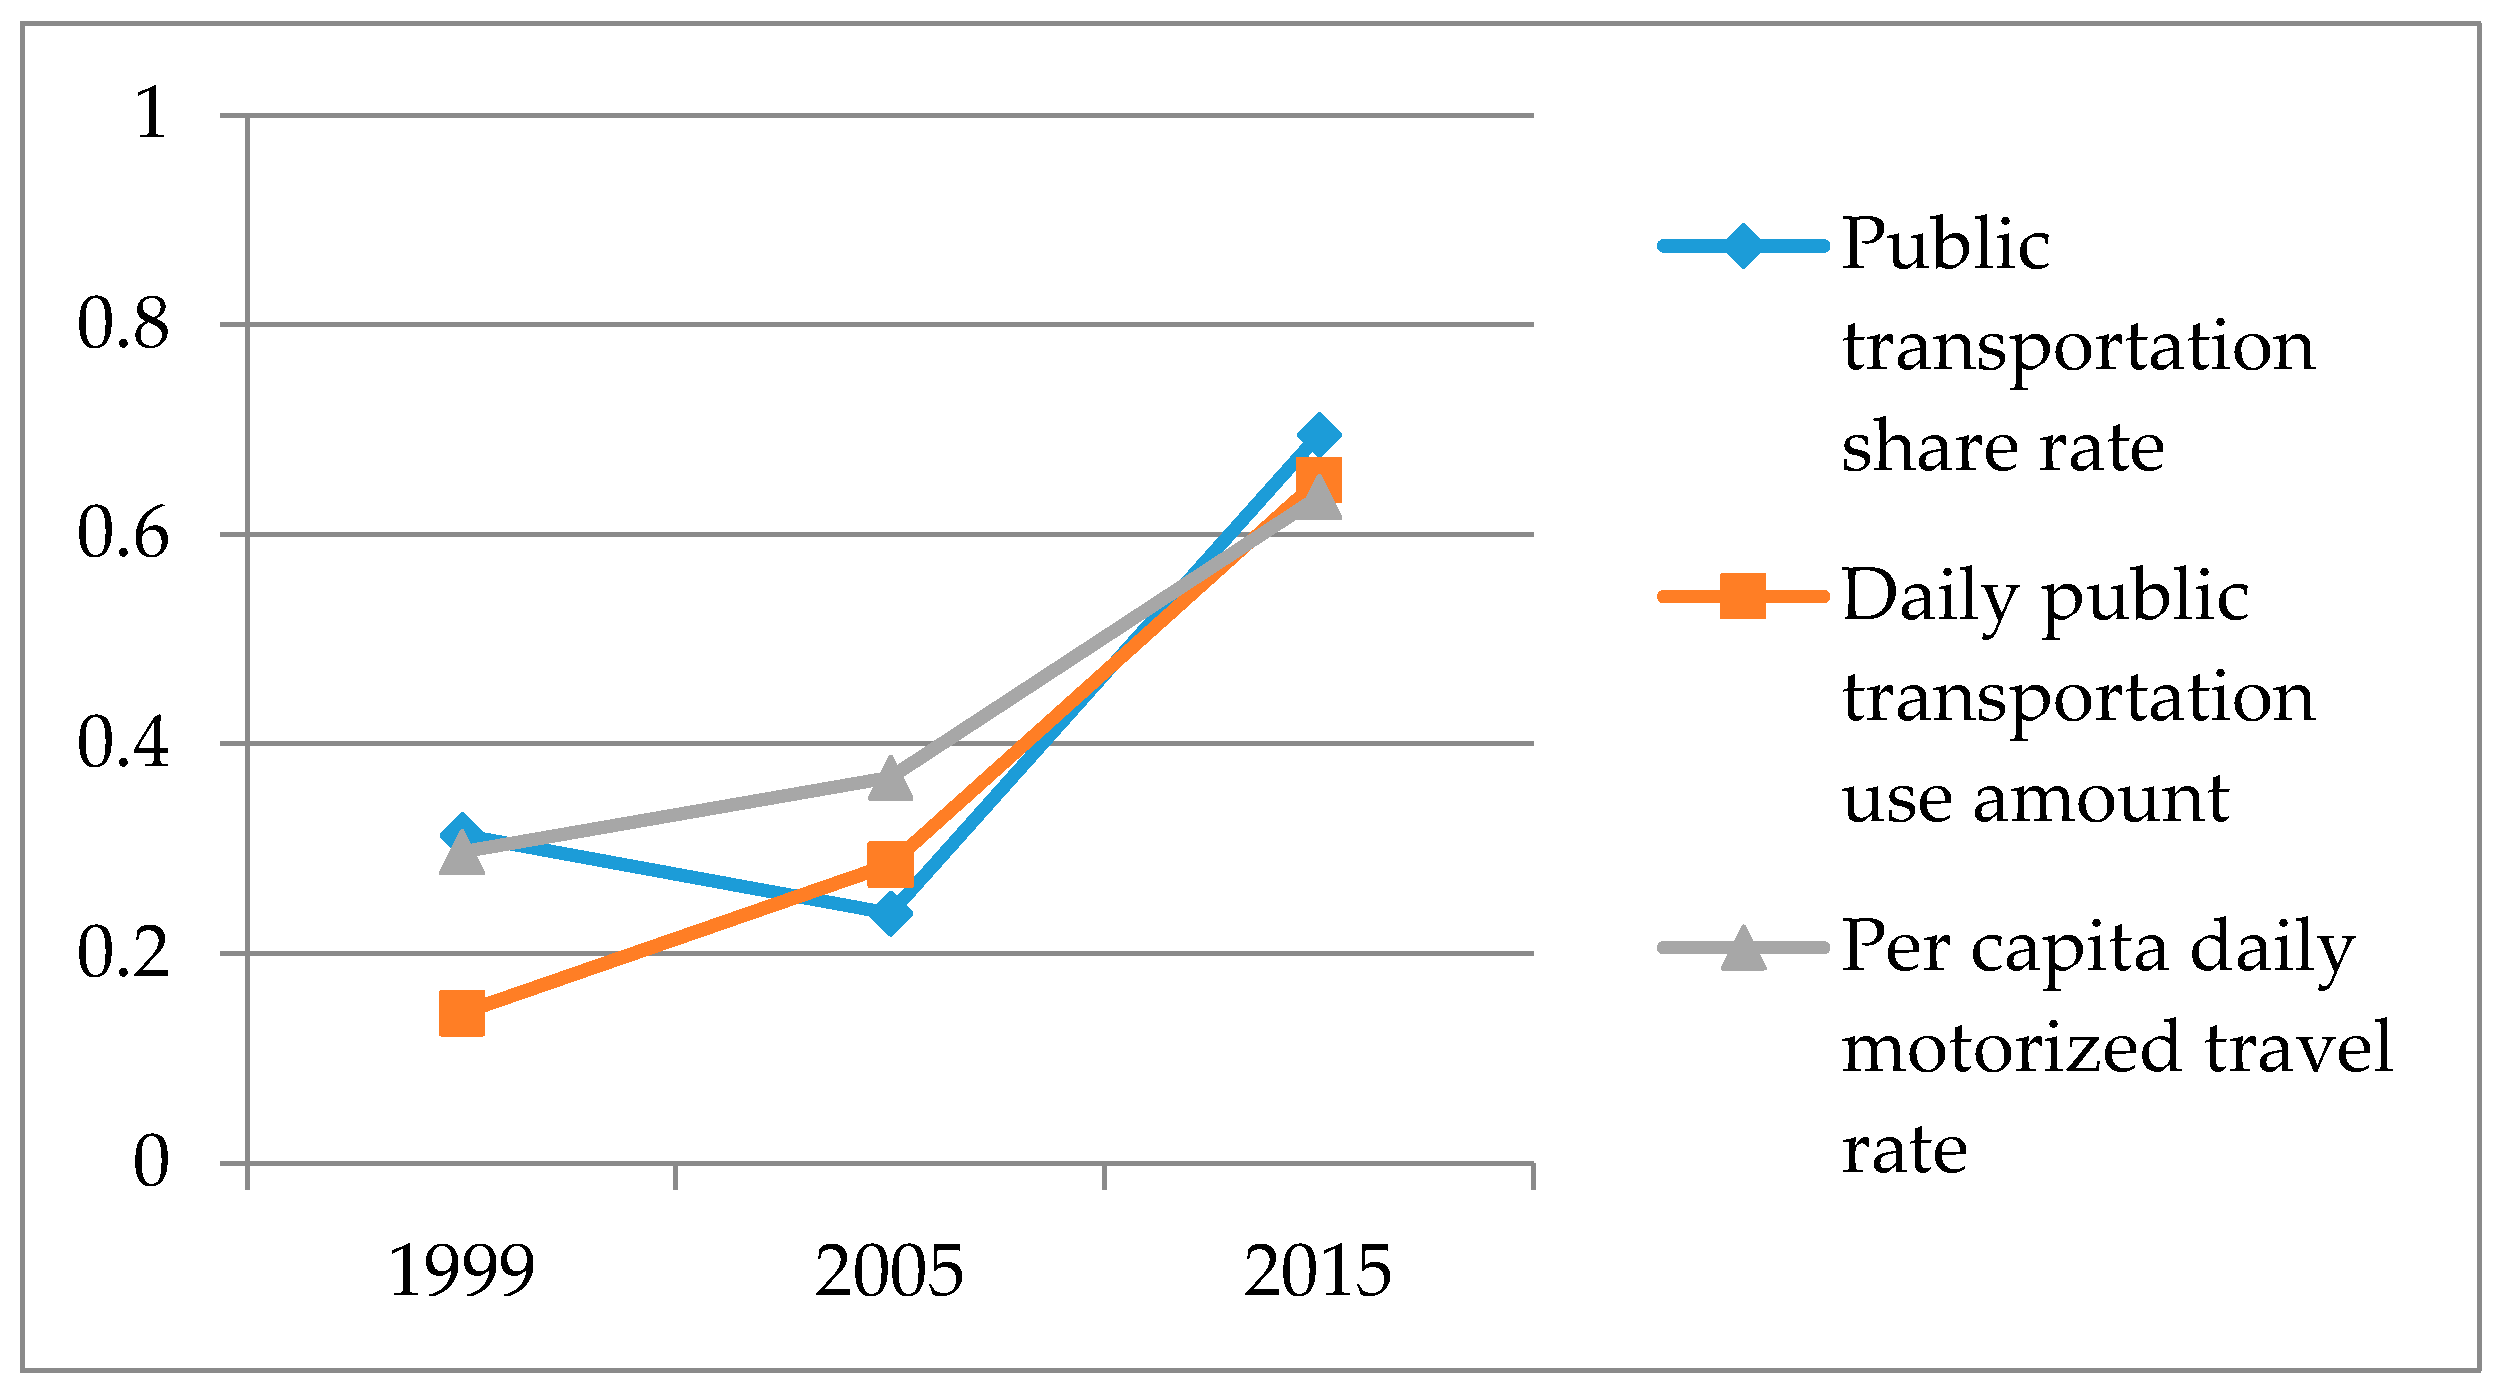
59], but rail transit accounts for only 6.6% of the public transportation. The reason for this phenomenon is that: from 1999 to 2005, the proportion of people who chose to take a bus reduced, because of the increase of private cars, the convenience of other public travel and the demands of time. However, the proportion who chose to take a bus increased from 2005 to 2010. This can be explained by the fact that the increase of private cars caused the deterioration of the traffic system structure, which increased the time and economic costs. On the contrary, rail transit and bus are more time-saving and economical; therefore, people are more likely to take public transport, and its share increases year by year.
According to the frequently-used traffic statistical index, the public transportation share rate, daily public transportation use amount and per capita daily motorized travel rate are taken as the order parameters of the traffic condition sub-system.
The public transportation share rate means the proportion of public transportation (including bus and rail transit) to total transportation [
60]. It is an important index to measure the urban public transportation and traffic structure. Public transportation share rate = total passenger number by public transportation/total passenger number × 100%.
Daily public transportation use amount is the total number of passengers who use public transportation (including bus, taxi and rail transit) for out-going (public transport of course does include taxis, and motorized transportation includes both public and private transport; “out-going” means any transportation that is leaving the area and can include things like commuting to work or visiting another area for whatever reason) every day.
The per capita daily motorized travel rate means the times each person uses motorized transportation (including public and private means) for out-going each day.
The per capita daily motorized travel rate = the times each person uses motorized transportation for out-going each day/permanent resident population × 100%.
2.3. Population Effect Sub-System
Urban rail transit sends people to the areas around specific rail transit stations, thus increasing the population density in the surrounding area [
61], causing population flow into the city, gathering more constant business to shops and effectively vitalizing the economic development within the area; in return, the promotion of economic vitality will help to increase the passenger flow volume. As shown in
Table 1, the construction of Shenzhen Rail Transit Line 3 attracts an additional 335.5 thousand persons, increasing from a previous 753.4 thousand to 1088.9 thousand. When the construction started in 1999, the total population density in the central region of the Phase-I project was 27.6 thousand persons/km
2; the total employed population along the rail transit was 557 thousand; and the total residential population was 551 thousand. After the construction was completed, the total population density increased to 47.5 thousand/km
2; the total employed population along the rail transit increased to 1166 thousand, twice as many as in 1999; and the total residential population increased to 745 thousand persons, almost 200 thousand people more than that in 1999.
Urban rail transit connects different regions of the city, brings changes in passenger flow volume and impacts the spatial structure of the city. Besides, being characterized by a large volume and fast speed, it can also change the visitor flow rates along the rail transit line, thus changing the population scale and density in the surrounding areas [
62]. In this paper, total population density, total employed population and total residential population along the rail transit line before and after the construction are taken as the order parameters of the population effect sub-system. To clarify, the total employed population means the number of people who work, but may not necessarily live in this area of AUSURT. It distinguishes another order parameter of the total residential population, but they together reflect the situation of the population flow.
2.4. Underground Space Sub-System
Underground space is most closely correlated with the rail transit. On the one hand, due to large passenger volume, rail transits require corresponding transfer spaces to facilitate passenger flow and avoid congestion. The development of underground spaces at the rail transit stations allows a vertical layout; therefore, it has advantages to improve transferring services, facilitate passengers flow and connect various commercial services. It can compensate for the spatial shortage. On the other hand, the tremendous people stream brought by urban rail transit creates great commercial opportunities and promotes the explosive growth of underground business. The underground space at the rail transit stations, due to good accessibility and being unaffected by severe weather [
63], creates a comfortable environment for shopping, catering and relaxation, which further increases the passenger flow and forms a benign circulation [
64,
65].
At present, underground space development in big cities generally goes together with the rail transit construction and extends to the areas surrounding rail transit stations [
66,
67]. By relying on the construction of urban rail transit and making full use of the passenger volume, the underground space development aims to create a multi-functional underground space that integrates transportation, civil defense, business, tourism, entertainment, warehouse storage and parking [
68]. The hub areas, which gather several rail transit lines, are usually equipped with huge underground commercial streets, thus becoming important places in the city [
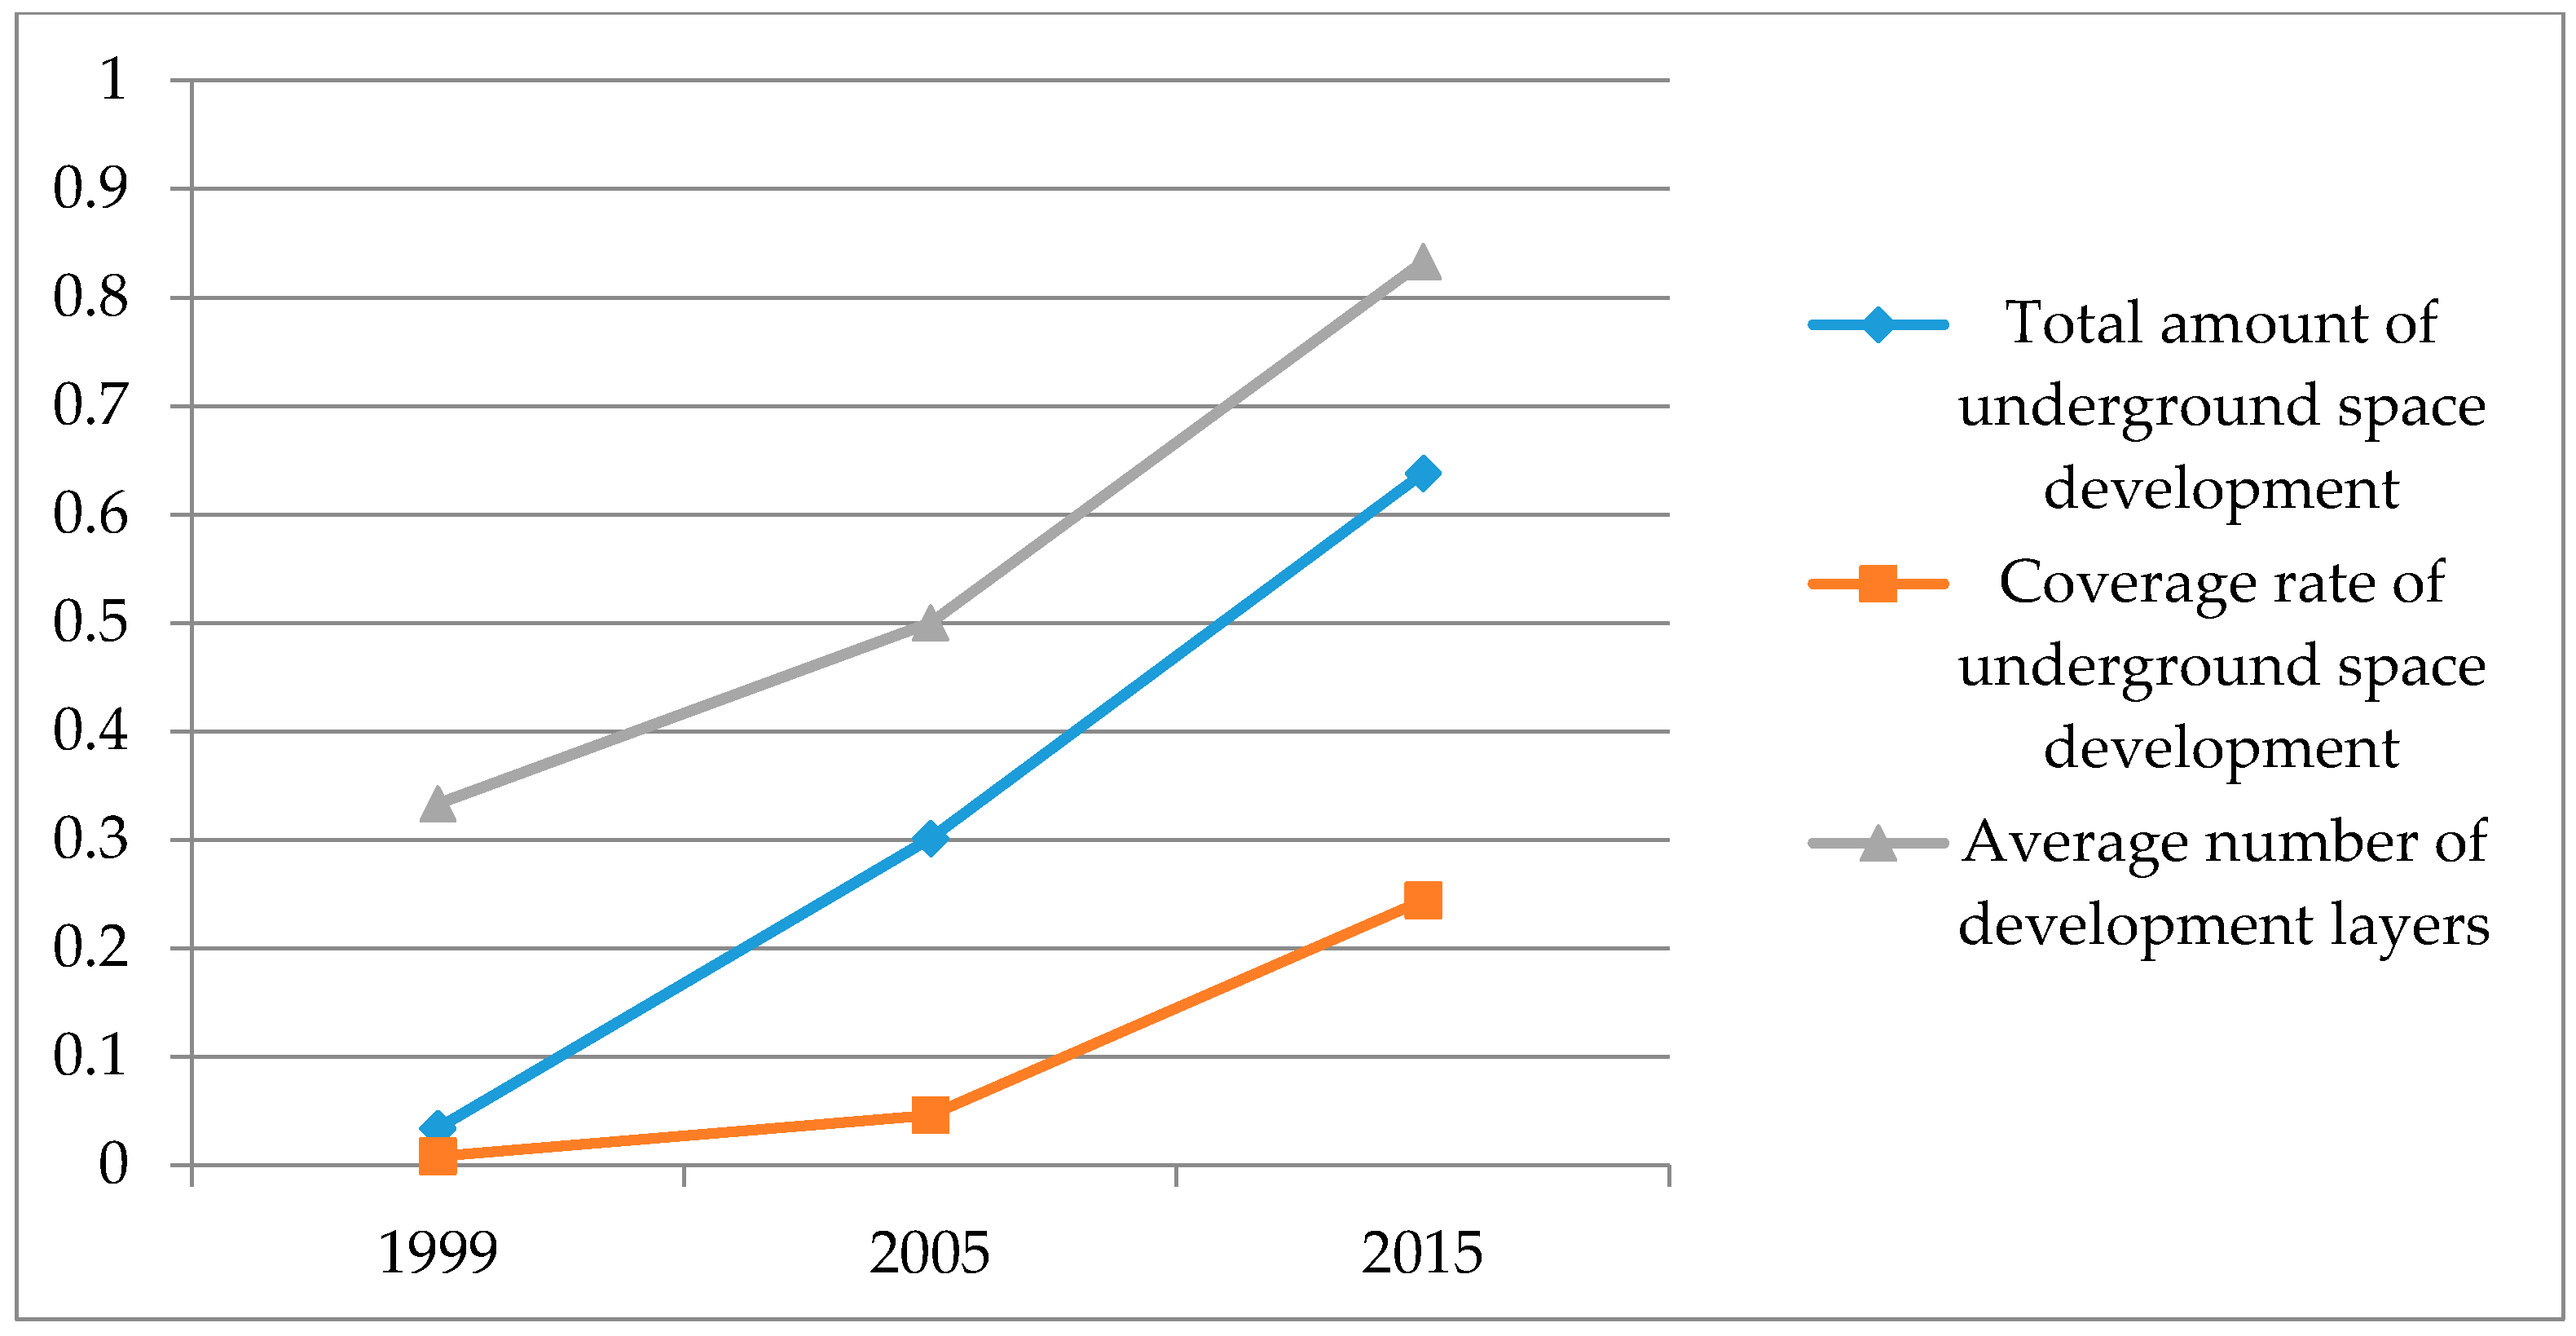
69]. In this paper, the total amount of underground space development, the coverage rate of underground space development and the average number of development layers are taken as the order parameters of the underground space sub-system.
To sum up, among the four sub-systems, the land use sub-system, the traffic condition sub-system and the population effect sub-system are more closely related to the aboveground space, so their order parameters are mainly about urban society, economy, transportation, etc. On the contrary, the underground space sub-system is more correlated with underground space development, so its order parameters are more about space resources accordingly. These four sub-systems affect and interact with each other, and their interaction influences the evolution of the entire system. The coordinated development of the four sub-systems will help to keep the entire system in an ordered and stable state, so as to promote urban space use efficiency and boost the sustainable development of the city.
Table 2 shows the order parameter system of the entire synergy system.
3. Analysis of the Sequential Synergy Degree Model of the Synergy System of Aboveground and Underground Space along the Phase-I Project of Shenzhen Rail Transit
The synergy system of AUSURT is a complex self-adaptation system. Then, will its operating environment and components evolve continuously in a particular way, developing from an out-of-order to an ordered state, from simple to complex and from low level to high class? Furthermore, will the structures and functions of the synergy system also change over time? In order to solve these questions, this paper takes the Phase-I Project of Shenzhen Rail Transit as an example, then a SSD model of the synergy system of AUSURT is developed, which will reflect the sequential development of the system, help to understand the relationship between the sub-systems and understand the evolutionary tendency of the synergy system of AUSURT.
3.1. Research Scope
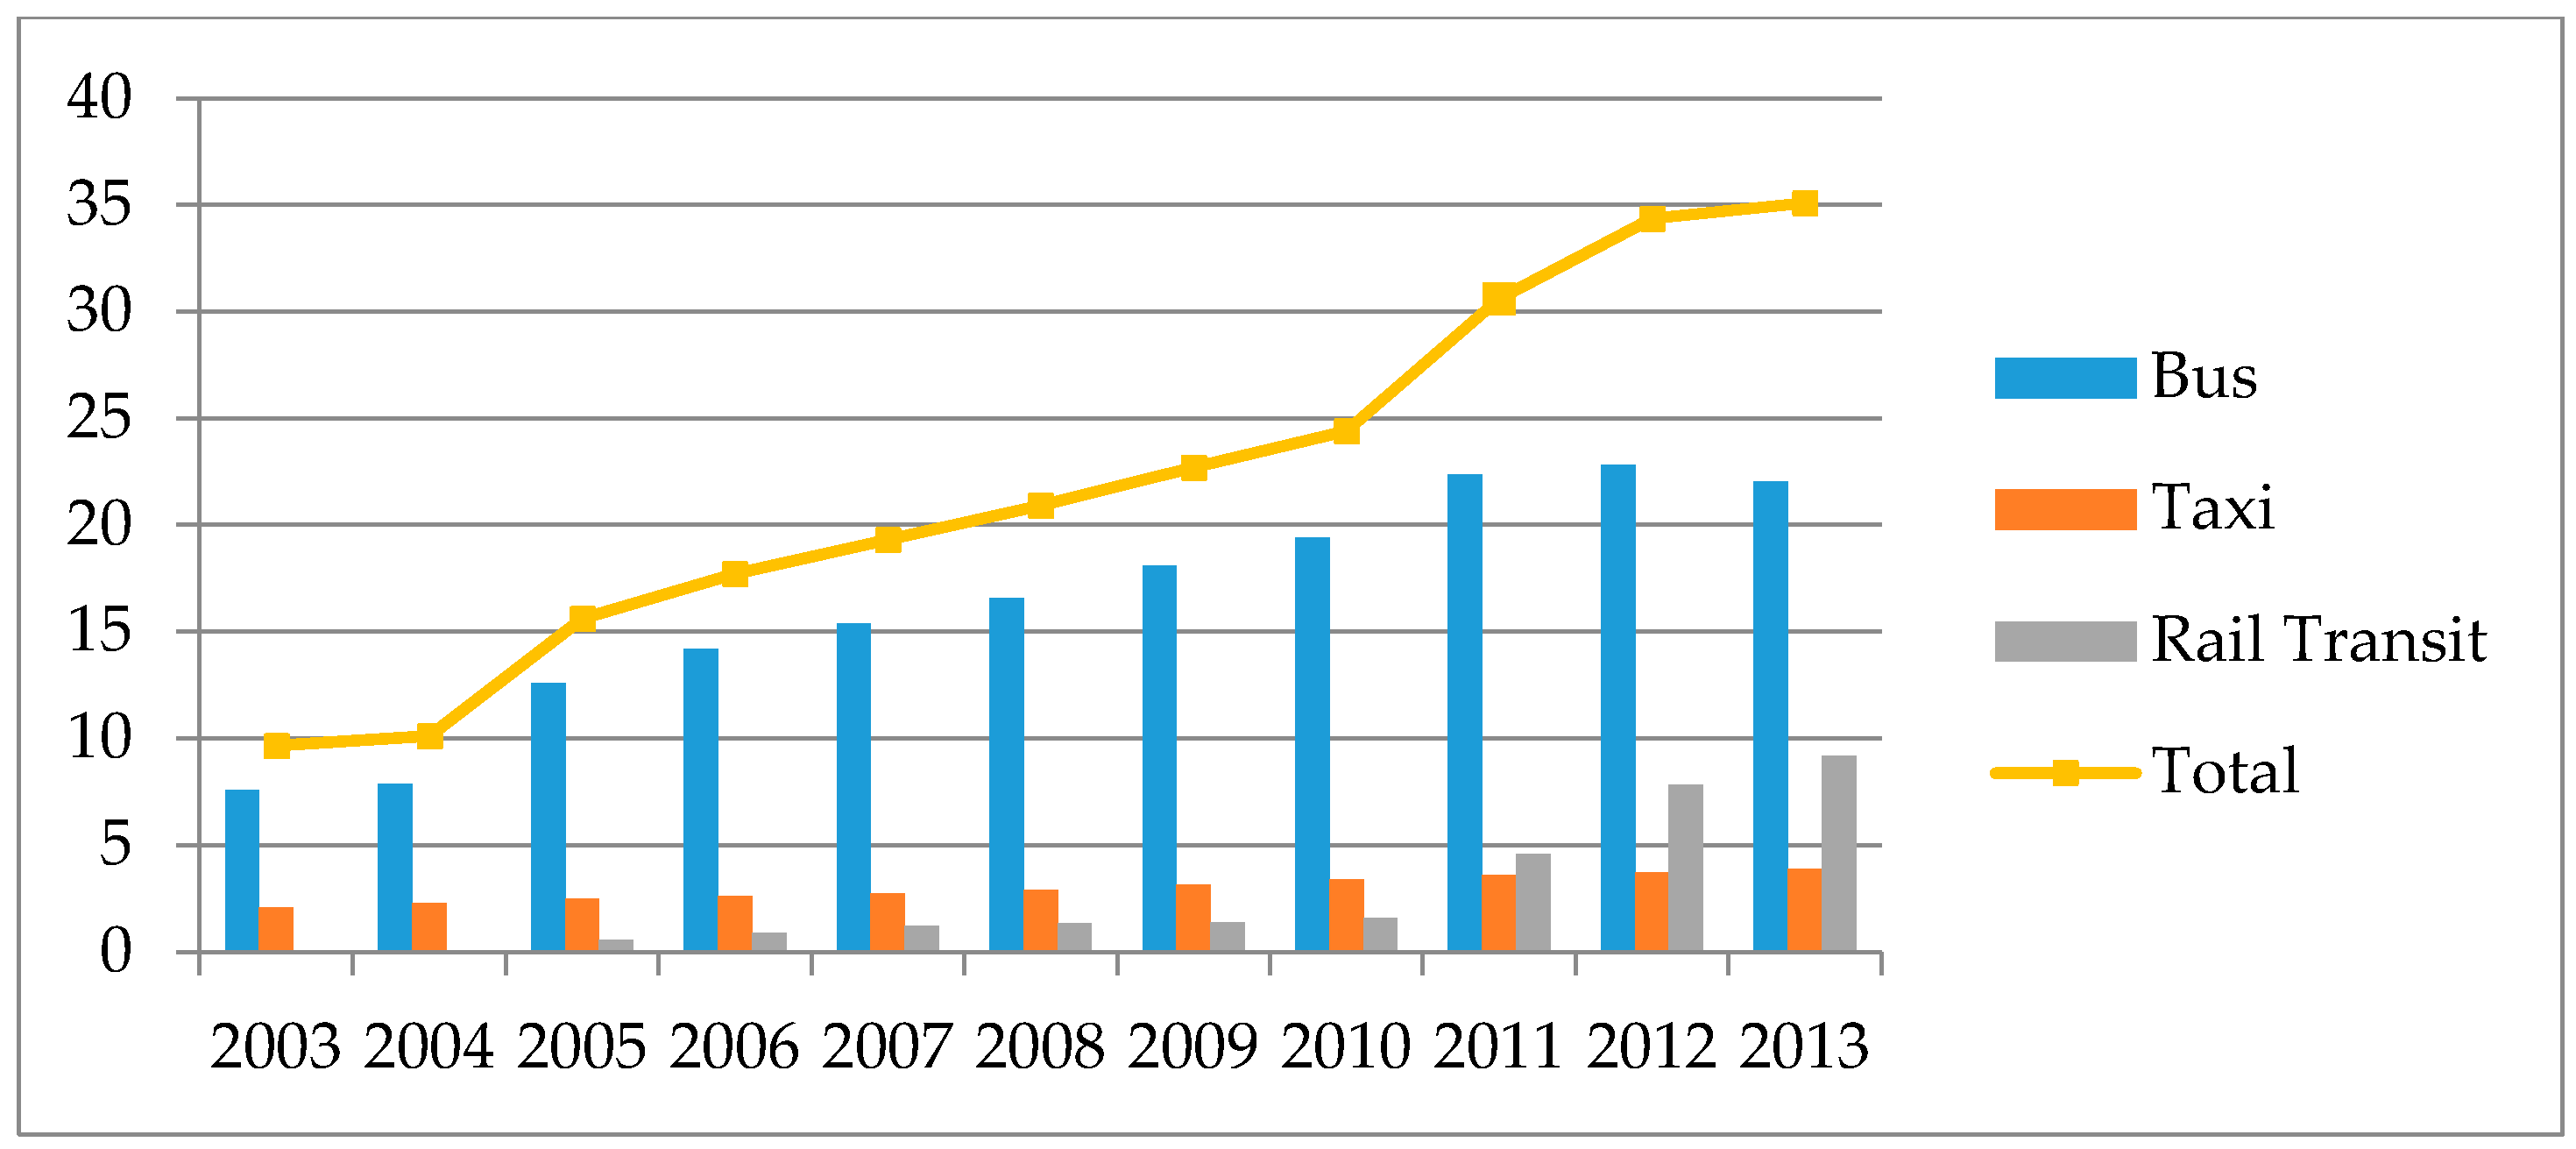
At present, the Shenzhen Rail Transit has five lines, including 131 stations, with a total length of 178.9 km, which initially forms a subway network covering five administrative districts (Luohu, Futian, Nanshan, Baoan, Longgang) and one functional zone (In Chinese urban planning, a functional zone has a variety of meanings: the first is the different functional areas of the city, such as residential, commercial, etc.; the second refers to the management area in order to achieve certain established goals. However, those management areas are different from administrative regions. Those management areas include the high-tech development zone and economic and technological development zone. Some of those areas are also called districts, such as Shaanxi West Ham District and Chongqing Liangjiang New Area. This paper refers to the second one.) (Longhua). The Shenzhen Rail Transit transported 1.12 billion passengers in 2015, with a daily passenger volume of 3.07 million. It also contributed 32% of passenger volume to the Shenzhen public transportation system, greatly improving the citizens’ out-going efficiency.
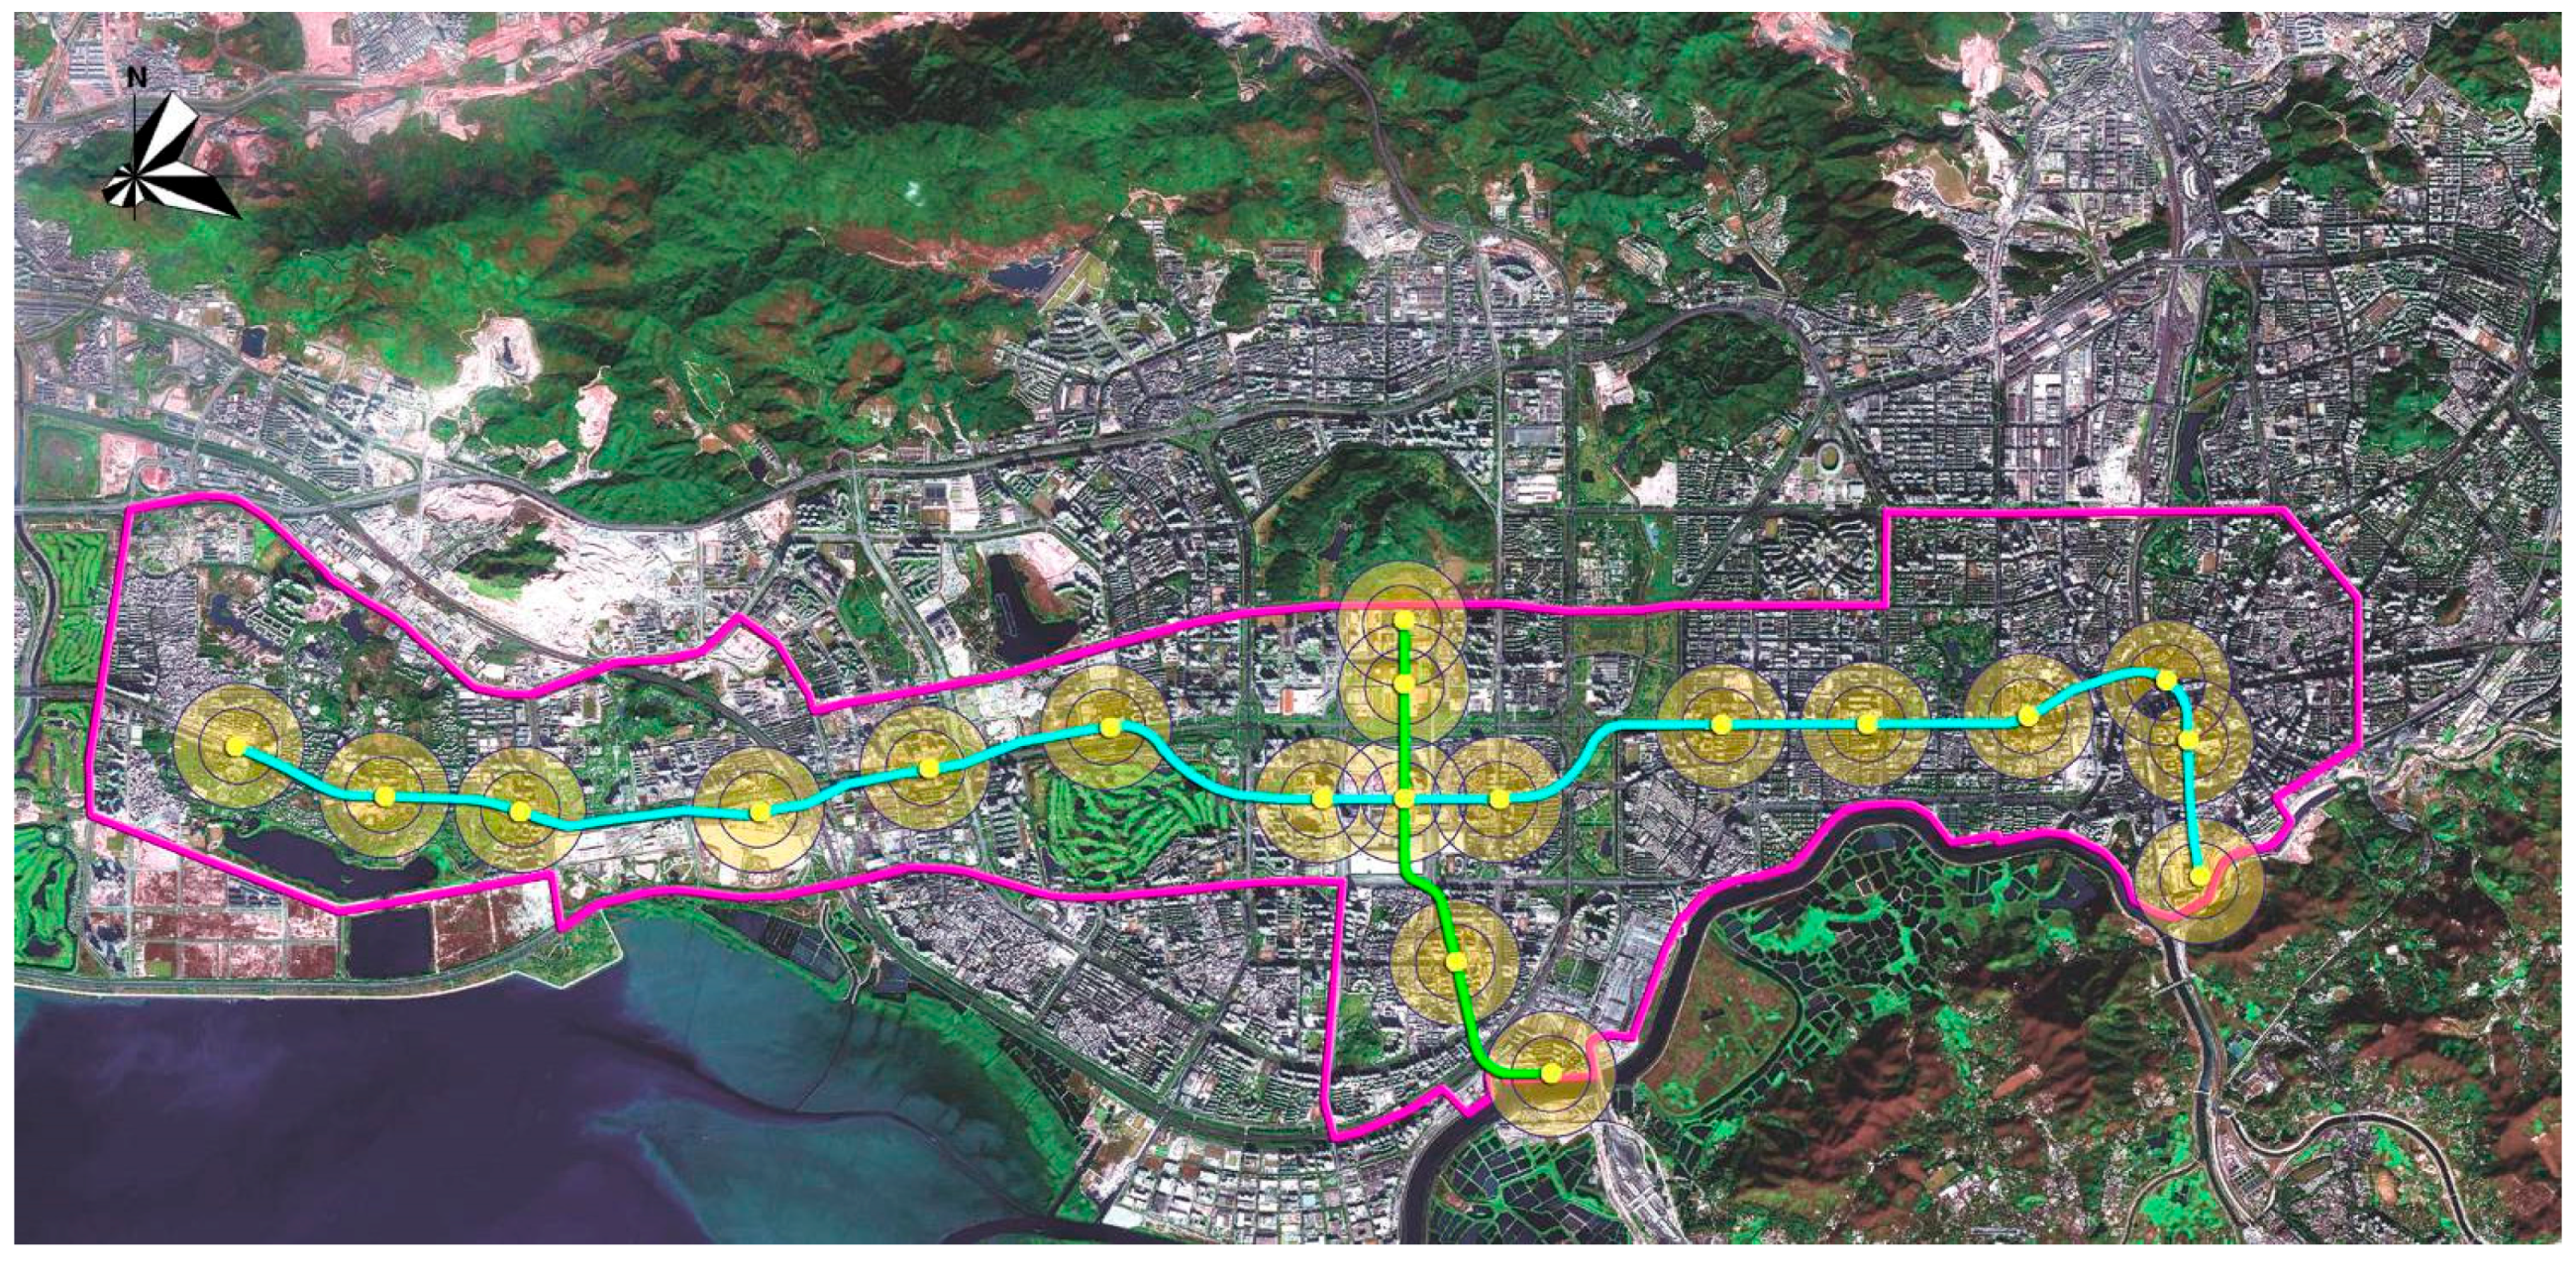
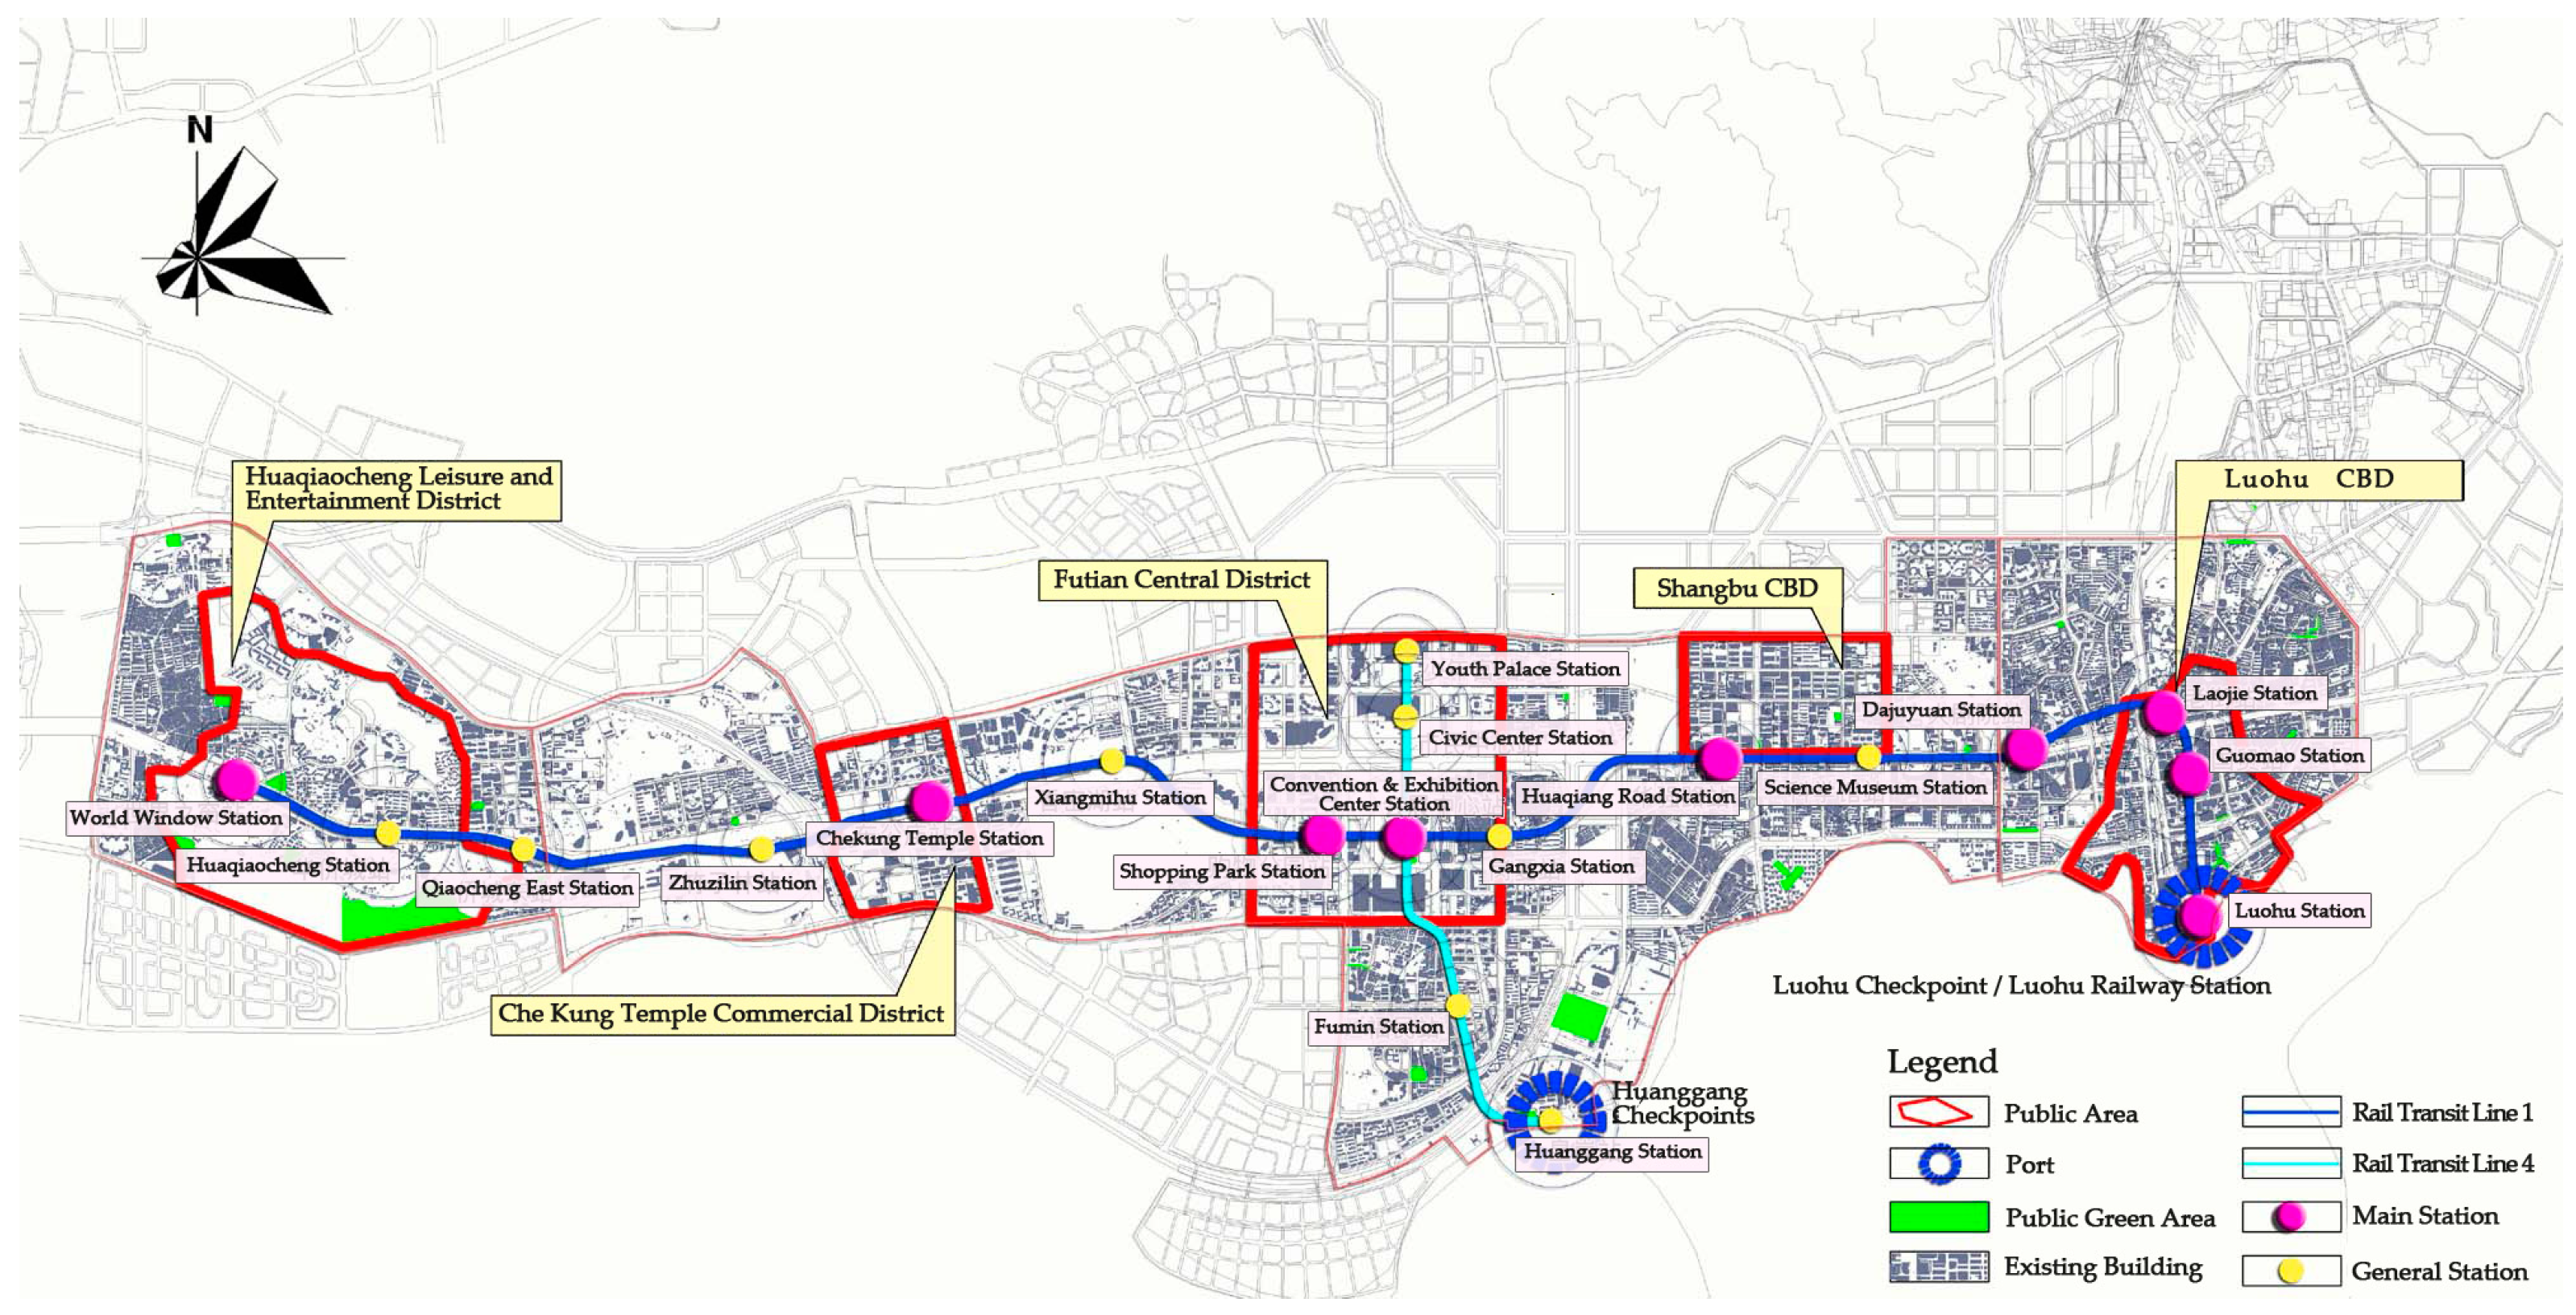
The total length of the Phase-I Project of Shenzhen Rail Transit is 21.6 km, of which Line 1 (Luobao Line) is 17.119 km long, starting from the Science Museum Station to the World Window Station and including 15 stations in total; and Line 4 (Longhua Line) is 4.479 km long, starting from Youth Palace Station to Huanggang Station (renamed the Futian Port Station in 2008), including five stations in total, meeting Line 1 at Convention Center Station. The Phase-I project, as shown in
Figure 2, is organically connected to the core areas, such as Huaqiangbei CBD (Central Business District), Che Kung Temple Commercial District, Futian Central District, Luohu CBD, Huaqiaocheng Leisure and Entertainment District, Luohu Railway Station Transportation Hub and Huanggang Port. The areas along the project are the most developed and expensive places in Shenzhen, so it is an important development axis. After the completion of the Phase-I project, Line 1 (Luobao Line) extends eastward to Luohu Station and westward to East Airport Station, with a total length of 40.979 km, including 30 stations; Line 4 (Longhua Line) extends northward to Qinghu Station, with a total length of 20.5 km, including 15 stations. The Phase-I project is selected because it traces the development of the Shenzhen Rail Transit out of nothing, and its progression is from simple to complex; therefore, it can better show the whole cooperative evolution of AUSURT. Other rail transit lines, however, have been more or less impacted by the existing lines before going into service.
Based on (Efficiency Test for Land along Phase-I Project of Shenzhen Rail Transit) [
70], (Shenzhen Comprehensive Plan (1996–2010)) [
71] and (2006 Report of Shenzhen Traffic Development) [
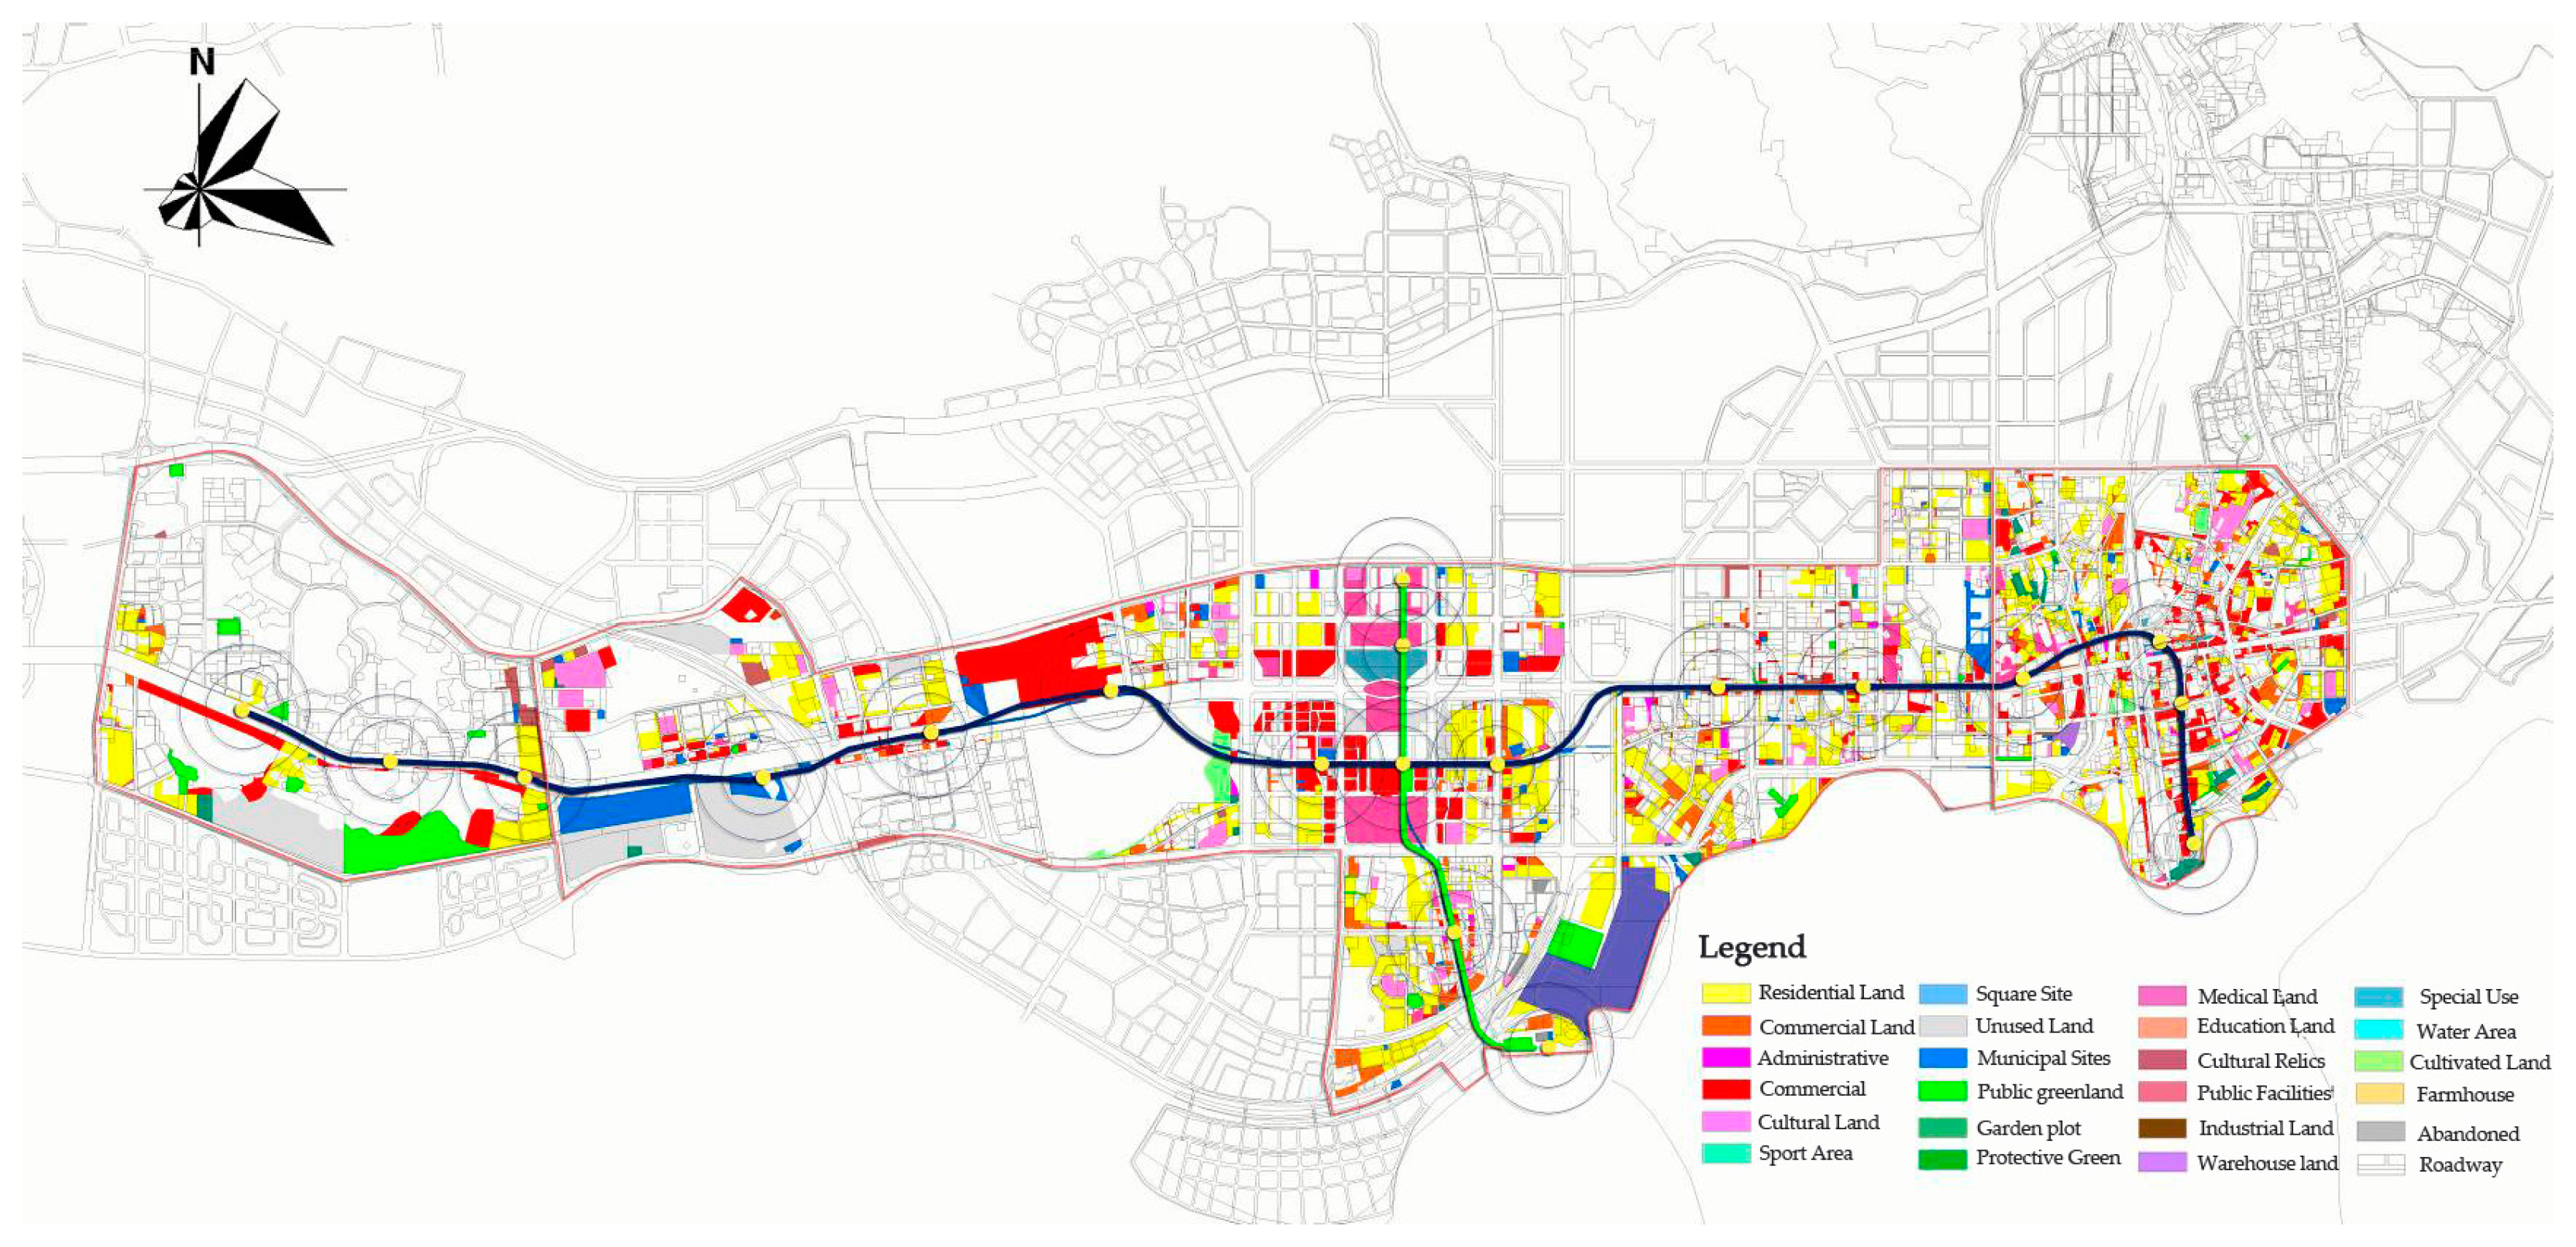
72], the research scope is defined as a 1.6-km corridor along the Phase-I Project of Shenzhen Rail Transit and 500 m within the rail transit stations. Moreover, the delimitation of the study area also combines with the urban main road in order to ensure the integrity of the research scope and the availability of research data. Finally, the study area (about 40.19 km
2) is bordered by Wenjin Road-Yanhe Road on the east side, Binhe Road-Shenzhen River-Yitian Road-Binhe Road-Baishi Road on the south side, Shahe Road on the west side and Beihuan Road-Qiaoxiang Road-Xiangmihu Road-Hongli Road-Shangbu Road-Sungang Road on the north side. The boundary of the farthest from the subway station is located in the northwest, and the distance is 1.9 km. The research scope is shown in
Figure 3.
The Phase-I Project of Shenzhen Rail Transit is the first one in Shenzhen. It brings a huge pedestrian volume, increasing the demands of commercial service facilities, underground pedestrian streets, parking lots, and so on. Because the synergy degree of AUSURT can provide convenience for residents’ travel, shopping and living, the Phase-I Project of Shenzhen Rail Transit pays attention to collaborative planning and constructing the mode of the aboveground and underground spaces along it; therefore, people can gather here, even if they have different purposes and requirements, which promotes the rapid development of AUSURT, raising the development scale and constantly improving the user functionality. The surrounding area along the rail transit often becomes a relatively comprehensively developed concentrated area of ground space and underground space.
The construction of Phase-I Project of the Shenzhen Rail Transit also promotes the large-scale development of underground space. At present, all of the stations in the research area have continued the development and utilization of underground space. The amount of underground space development is 480 thousand m2, at an average of 1.8 layers, and the coverage rate of underground space development is 20.1%; the commercial facilities account for 25% and the parking facilities 65%. According to the survey it drives the development and utilization of the surrounding underground space along the rail transit, such as: Jin Guanghua commercial plaza, Luohu port underground complexes, Huaqiang subway electronic center, Hualian and CITIC underground mall, Fuhua road underground commercial street, and so on, with a total area of development construction of about 120 thousand m2.
To study the process of the cooperative evolution of AUSURT, the synergy degree of aboveground and underground space development in three different time periods is observed in this paper: 1999 (when the Phase-I project started), 2005 (when the project was put into service) and 2015 (when initial rail transit network formed).
3.2. Establishment of the SSD Model
In synergetics, the order parameter is a macro parameter, and it can be regarded as a comprehensive movement model of a large number of sub-systems as a whole [
73]. First, the synergetic and competitive bulk movement of all sub-systems generates order parameters, which impact the evolutionary process of the entire system by governing these sub-systems. Therefore, order parameters can be used to measure the synergetic efficiency of the sub-systems and also to present the states of motion of the whole system. During the system movement, the sub-systems compete and also cooperate with each other, thus generating the order parameters, which, in return, control the sub-systems [
74].
The synergetic effect among the order parameters of each sub-system plays a vital role to help the synergetic system of AUSURT develop from an out-of-order to an ordered state, and it reflects the evolutionary law of this system. The synergy degree model is established to study the change tendency of the system’s synergy degree from pre-construction to post-construction and to the transportation network taking initial shape.
3.2.1. Compound Self-Organizing System
In a compound system S = {S1, S2, …, Sk}, Sj is a sub-system of S, j = 1, 2, …, k, and Sj itself has several “sub-sub-systems” or basic elements, namely Sj = {Sj1, Sj2, …, Sjm}. In this research, k = 4, namely, the synergetic system of aboveground and underground space along the Phase-I Project of Shenzhen Rail Transit, and contains four sub-systems: S1 is the land use sub-system; S2 is the traffic condition sub-system; S3 is the population effect sub-system; and S4 is the underground space sub-system.
The interaction of
Sj forms compound system
S, which can be abstracted as:
In Equation (1), f is a non-linear operator. It is difficult to represent f using accurate analytical methods. Only a time sequence x1, x2, …, xn is used to describe the system state at a particular period of time. xi ∈ αR, i = 1, 2, …, n, xi is the sampling value at time ti; the sampling time interval is Δt.
3.2.2. Order Degree of Self-Organizing System
In sub-system
Sj,
j ∈ [1,
k]. Suppose
ej = (
ej1,
ej2, …,
ejn) are its order parameters, where
i ∈ [1,
n],
βji ≤
eji ≤
αji,
n ≥ 1. For the order parameters
ej1,
ej2, …,
ejm,
m ≤
n, if the order degrees of the sub-systems are positively correlated along with the change of the values, then the above indexes are called positive indexes; for
ejm+1, …,
ejn, if the order degrees of the sub-systems are negatively correlated along with the change of the values, then the above indexes are called negative indexes. Therefore, the degree order of the sub-system is expressed as:
From Equation (2), it can be known that, the larger the eji value is, the more it will contribute to the system order degree, and uj(eji) ∈ [0, 1]. Besides, in practical situations, there may appear such a variable eji, whose value falls into the range within a particular point. Any big deviation (either positive or negative) will hamper the improvement of the synergy degree. In this model, the order degree of the variable is defined as:
If the
eji value approaches the standard value
eji0, then
eji can be transformed into:
It can be known that the larger the value is, the higher the order degree will be.
Generally, the “total contribution” of order parameter
ej to the order degree of sub-system
Sj is evaluated by means of
uj(
eji) integration, which is done using the geometric method, namely:
It can be seen in Equation (4), uj(ej) ∈ [0, 1], that the larger the uj(ej) value is, the more ej will contribute to the ordered evolution of sub-system Sj, consequently obtaining a higher order degree, and vice versa.
Suppose
t0 is the initial moment, and at that time, the order degree of
Sj is
uj0(
ej),
j = 1, 2, …,
k. During the evolution of the compound system, the order degree of
Sj changes to
ujm(
ej),
j = 1, 2, …,
k at time
tm; then, the synergy degree of the compound system can be defined as
cm:
where,
,
j = 1, 2, …,
k,
is change range of the
Sj order degree from
t0 to
tm. At the same time,
cm ∈ [–1, 1]; the larger it is, the higher the synergy degree will be, and vice versa.
Furthermore, it can be seen from Equation (5) that only when θ > 0, namely when ∀ j ∈ [1, k], ujm(ej) − uj0(ej) > 0, can the synergy degree be positive, indicating that the system is developing harmoniously during [t0, t1]. If cm ∈ [−1, 0), then the system is developing inharmoniously during that period of time.
The order degree as mentioned above describes the state change of the sub-system and its order parameter. If a pure number, it means nothing indeed, because it is actually different from a specific figure (such as 50%, indicating that something has been half done); therefore, it is very difficult to define what state a single number represents. By comparing the date of different periods, we can obtain the trend and the law of the synergetic evolution of AUSURT. For the same sub-system or order parameter, a higher value of the order degree is better, but for different sub-systems or order parameters, the values could not be meaningfully compared, because their own standards are different. Similarly to the order degree, the synergy degree is used to describe the synergic evolution of the entire system. It is calculated from the order degree of each sub-system, so it should combine the state change of each sub-system to analyze the synergy degree. Both the order degree and the synergy degree indicate that the process of the development of things will follow this order from out-of-order to an ordered state, despite that an erratic fluctuation may appear in the process because of the uncertainty factors.
The above model can be used to analyze the system’s synergy degree and its evolution tendency from pre-construction to post-construction and to the transportation network taking initial shape.
3.3. Calculation and Analysis of SSD
3.3.1. Obtaining the Primary Data of the Order Parameter
According to (Efficiency Test for Land along Phase-I Project of Shenzhen Rail Transit), and (Statutory Plans of Land Use in Shenzhen), the primary data of the order parameters of the population effect sub-system and land use sub-system at
t0,
t1 and
t2 can be obtained, as shown in
Table 3 and
Table 4, respectively.
According to (Annual Report of Shenzhen Traffic Development), (General Plans of Shenzhen Public Transportation) and (Shenzhen Transportation White Paper), the primary data of the order parameters of the traffic condition sub-system at
t0,
t1 and
t2 can be obtained, as shown in
Table 5.
According to (Efficiency Test for Land along Phase-I Project of Shenzhen Rail Transit) and (Plans of Underground Space Development in Shenzhen Special Economic Zone), the primary data of the order parameters of the underground space sub-system at
t0,
t1 and
t2 can be obtained, as shown in
Table 6.
3.3.2. Calculation and Analysis of the Order Degree of the Sub-system Order Parameters
From Equation (2) and the above primary data, the changes of the order degree of the sub-system order parameters in 1999, 2005 and 2015 can be obtained. Then, by using Equation (4), the development of each sub-system from pre-construction to post-construction and to the transportation network taking initial shape can be calculated.
1.
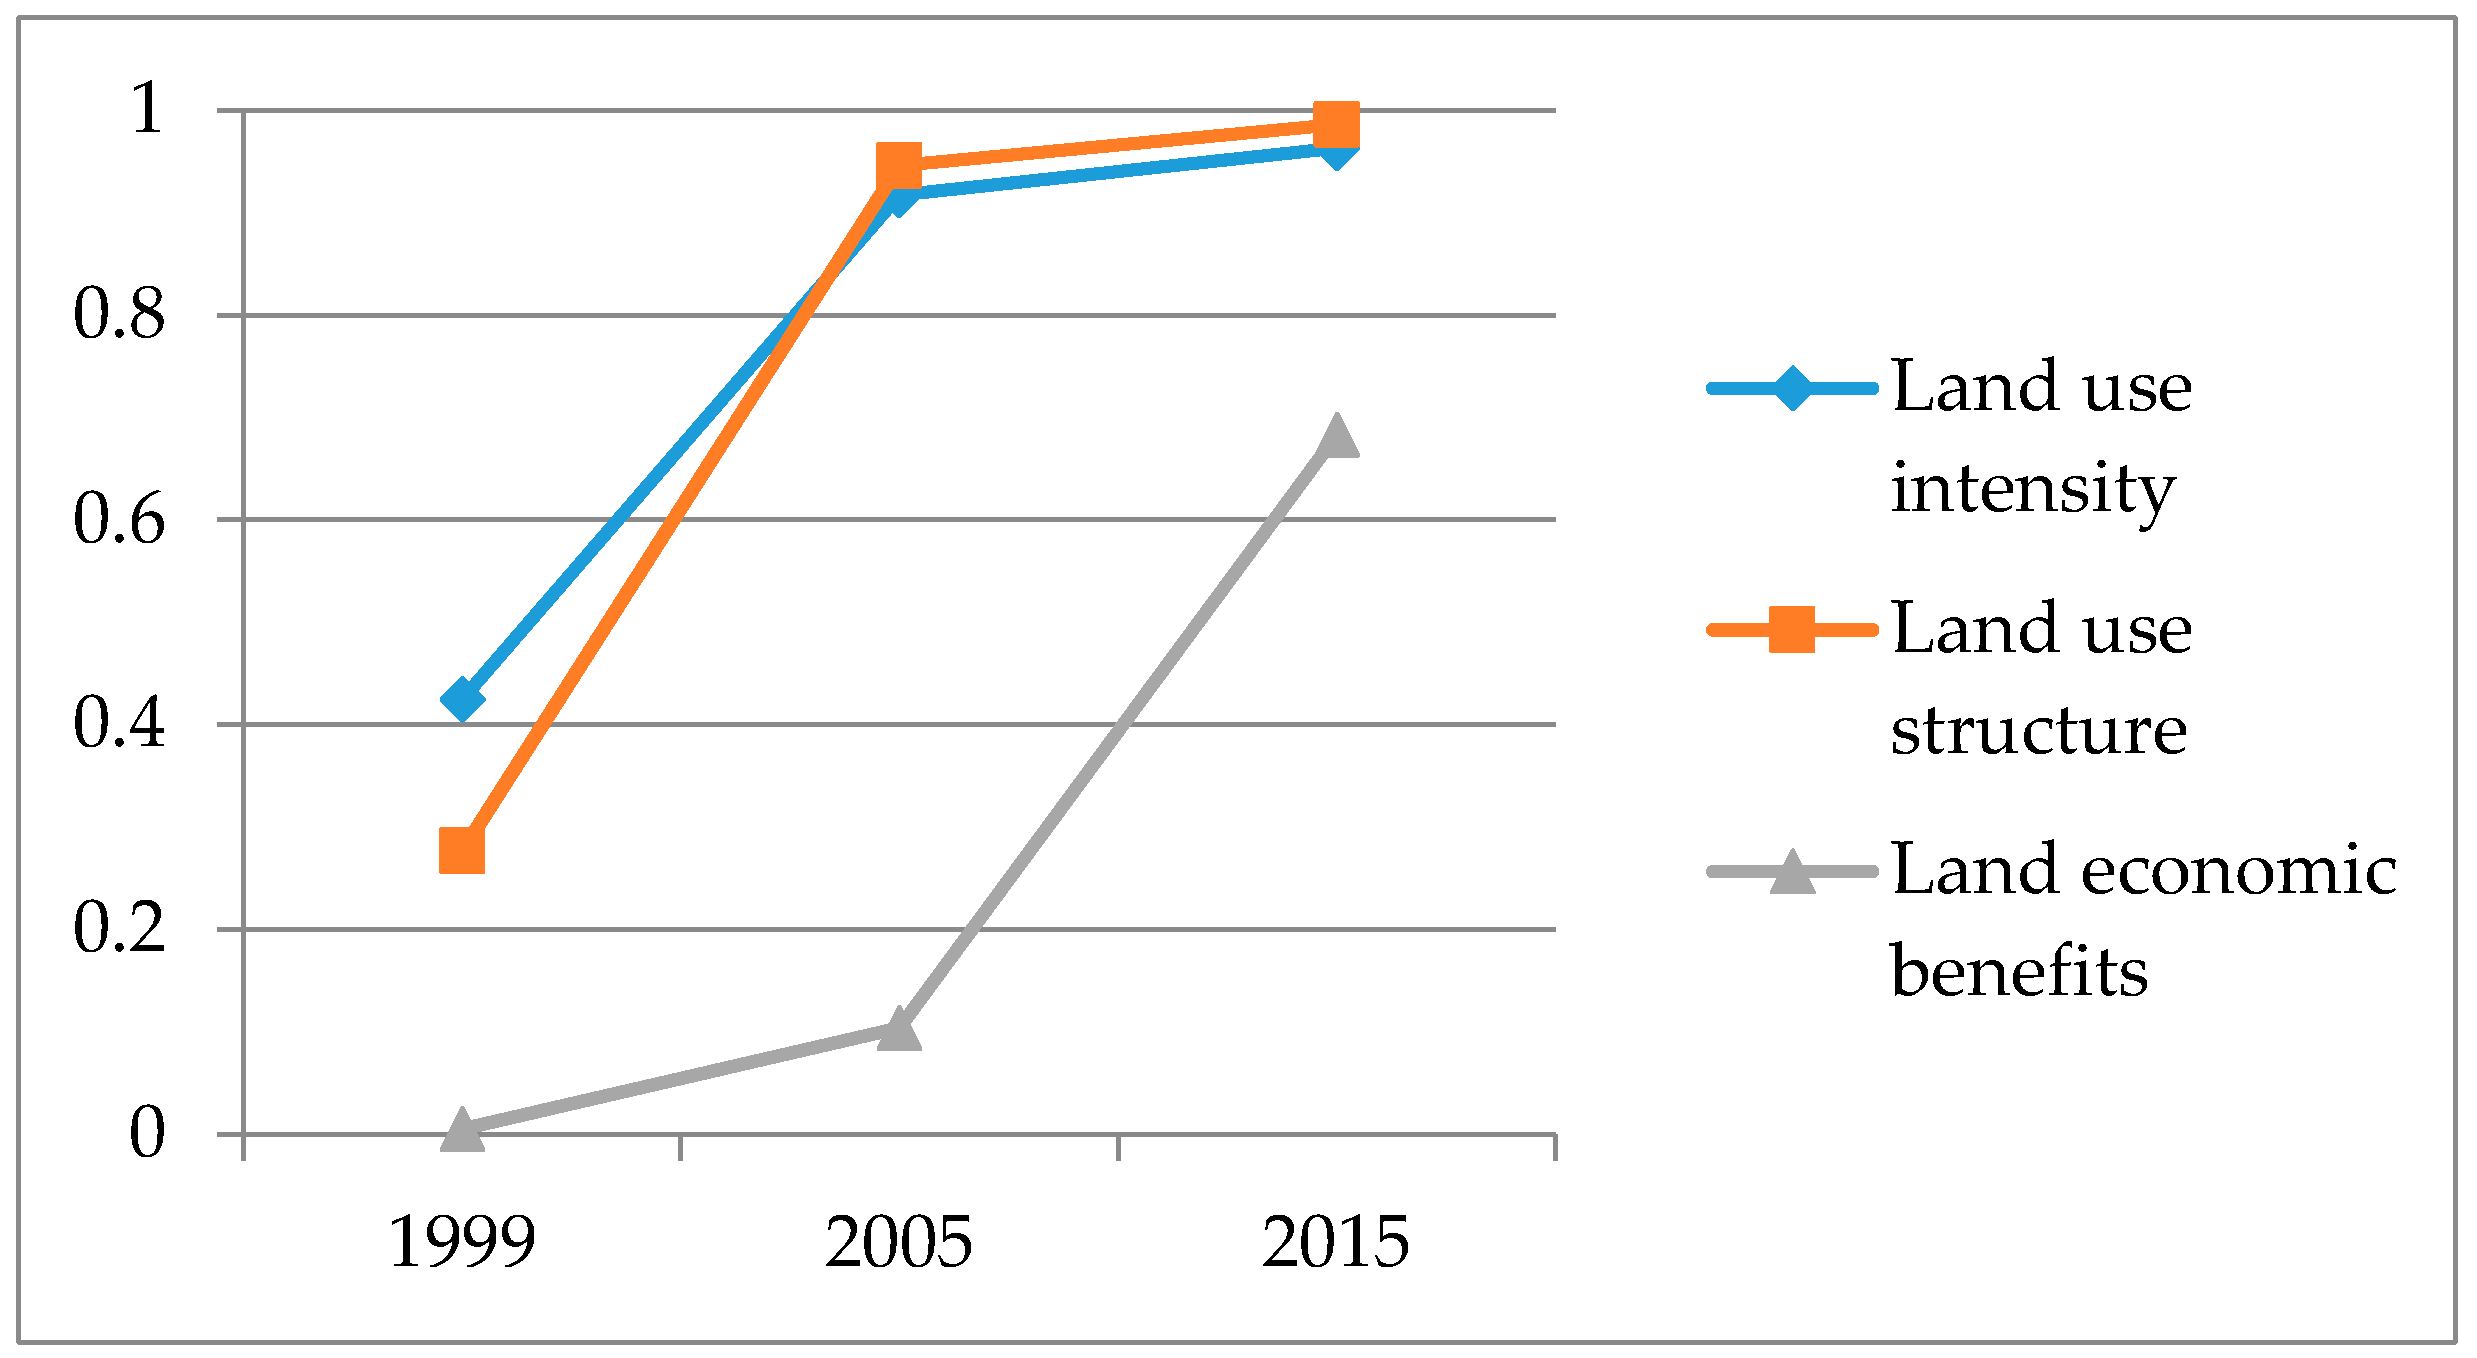
Table 7 shows the calculation results of the order degree of the order parameters of the land use sub-system, and
Figure 4 shows the change tendency.
It can be seen from
Table 7 and
Figure 4 that the order degrees of land use intensity and land use structure were greatly improved after the rail transit construction was completed. However, after the rail transit network was initially formed, there was little room for improvement, because land use intensity was close to the statutory plan (
Figure 5), and the land use structure became increasingly reasonable. In addition, rapid economic development over recent years has boosted land economic benefits, whose order degree changed very little from pre-construction to post-construction. However, after the rail transit network was initially constructed, it was remarkably improved. Compared with the above two parameters, there remains huge room for improvement.
2.
Table 8 shows the calculation results of the order degree of the order parameters of the traffic condition sub-system, and
Figure 6 shows the change tendency.
It can be seen from
Table 8 and
Figure 6 that both daily public transportation use amount and per capita daily motorized travel rate moved toward an orderly state steadily from 1999 to 2015, while the order degree of the public transportation share rate decreased after the project was completed. The primary cause is: the newly-constructed rail transit failed to provide easy transfer to buses, leading to a low residents’ out-going rate and a small business customer volume. In addition, the increase of private cars also contributed to the decline of the public transportation share rate. However, after the rail transit network was initially constructed, the convenient and fast rail transit obtained competitive advantage. The crowded aboveground traffic also motivated many people to use the public transportation, and as a result, the order degree of the public transportation share rate has tremendously improved.
3.
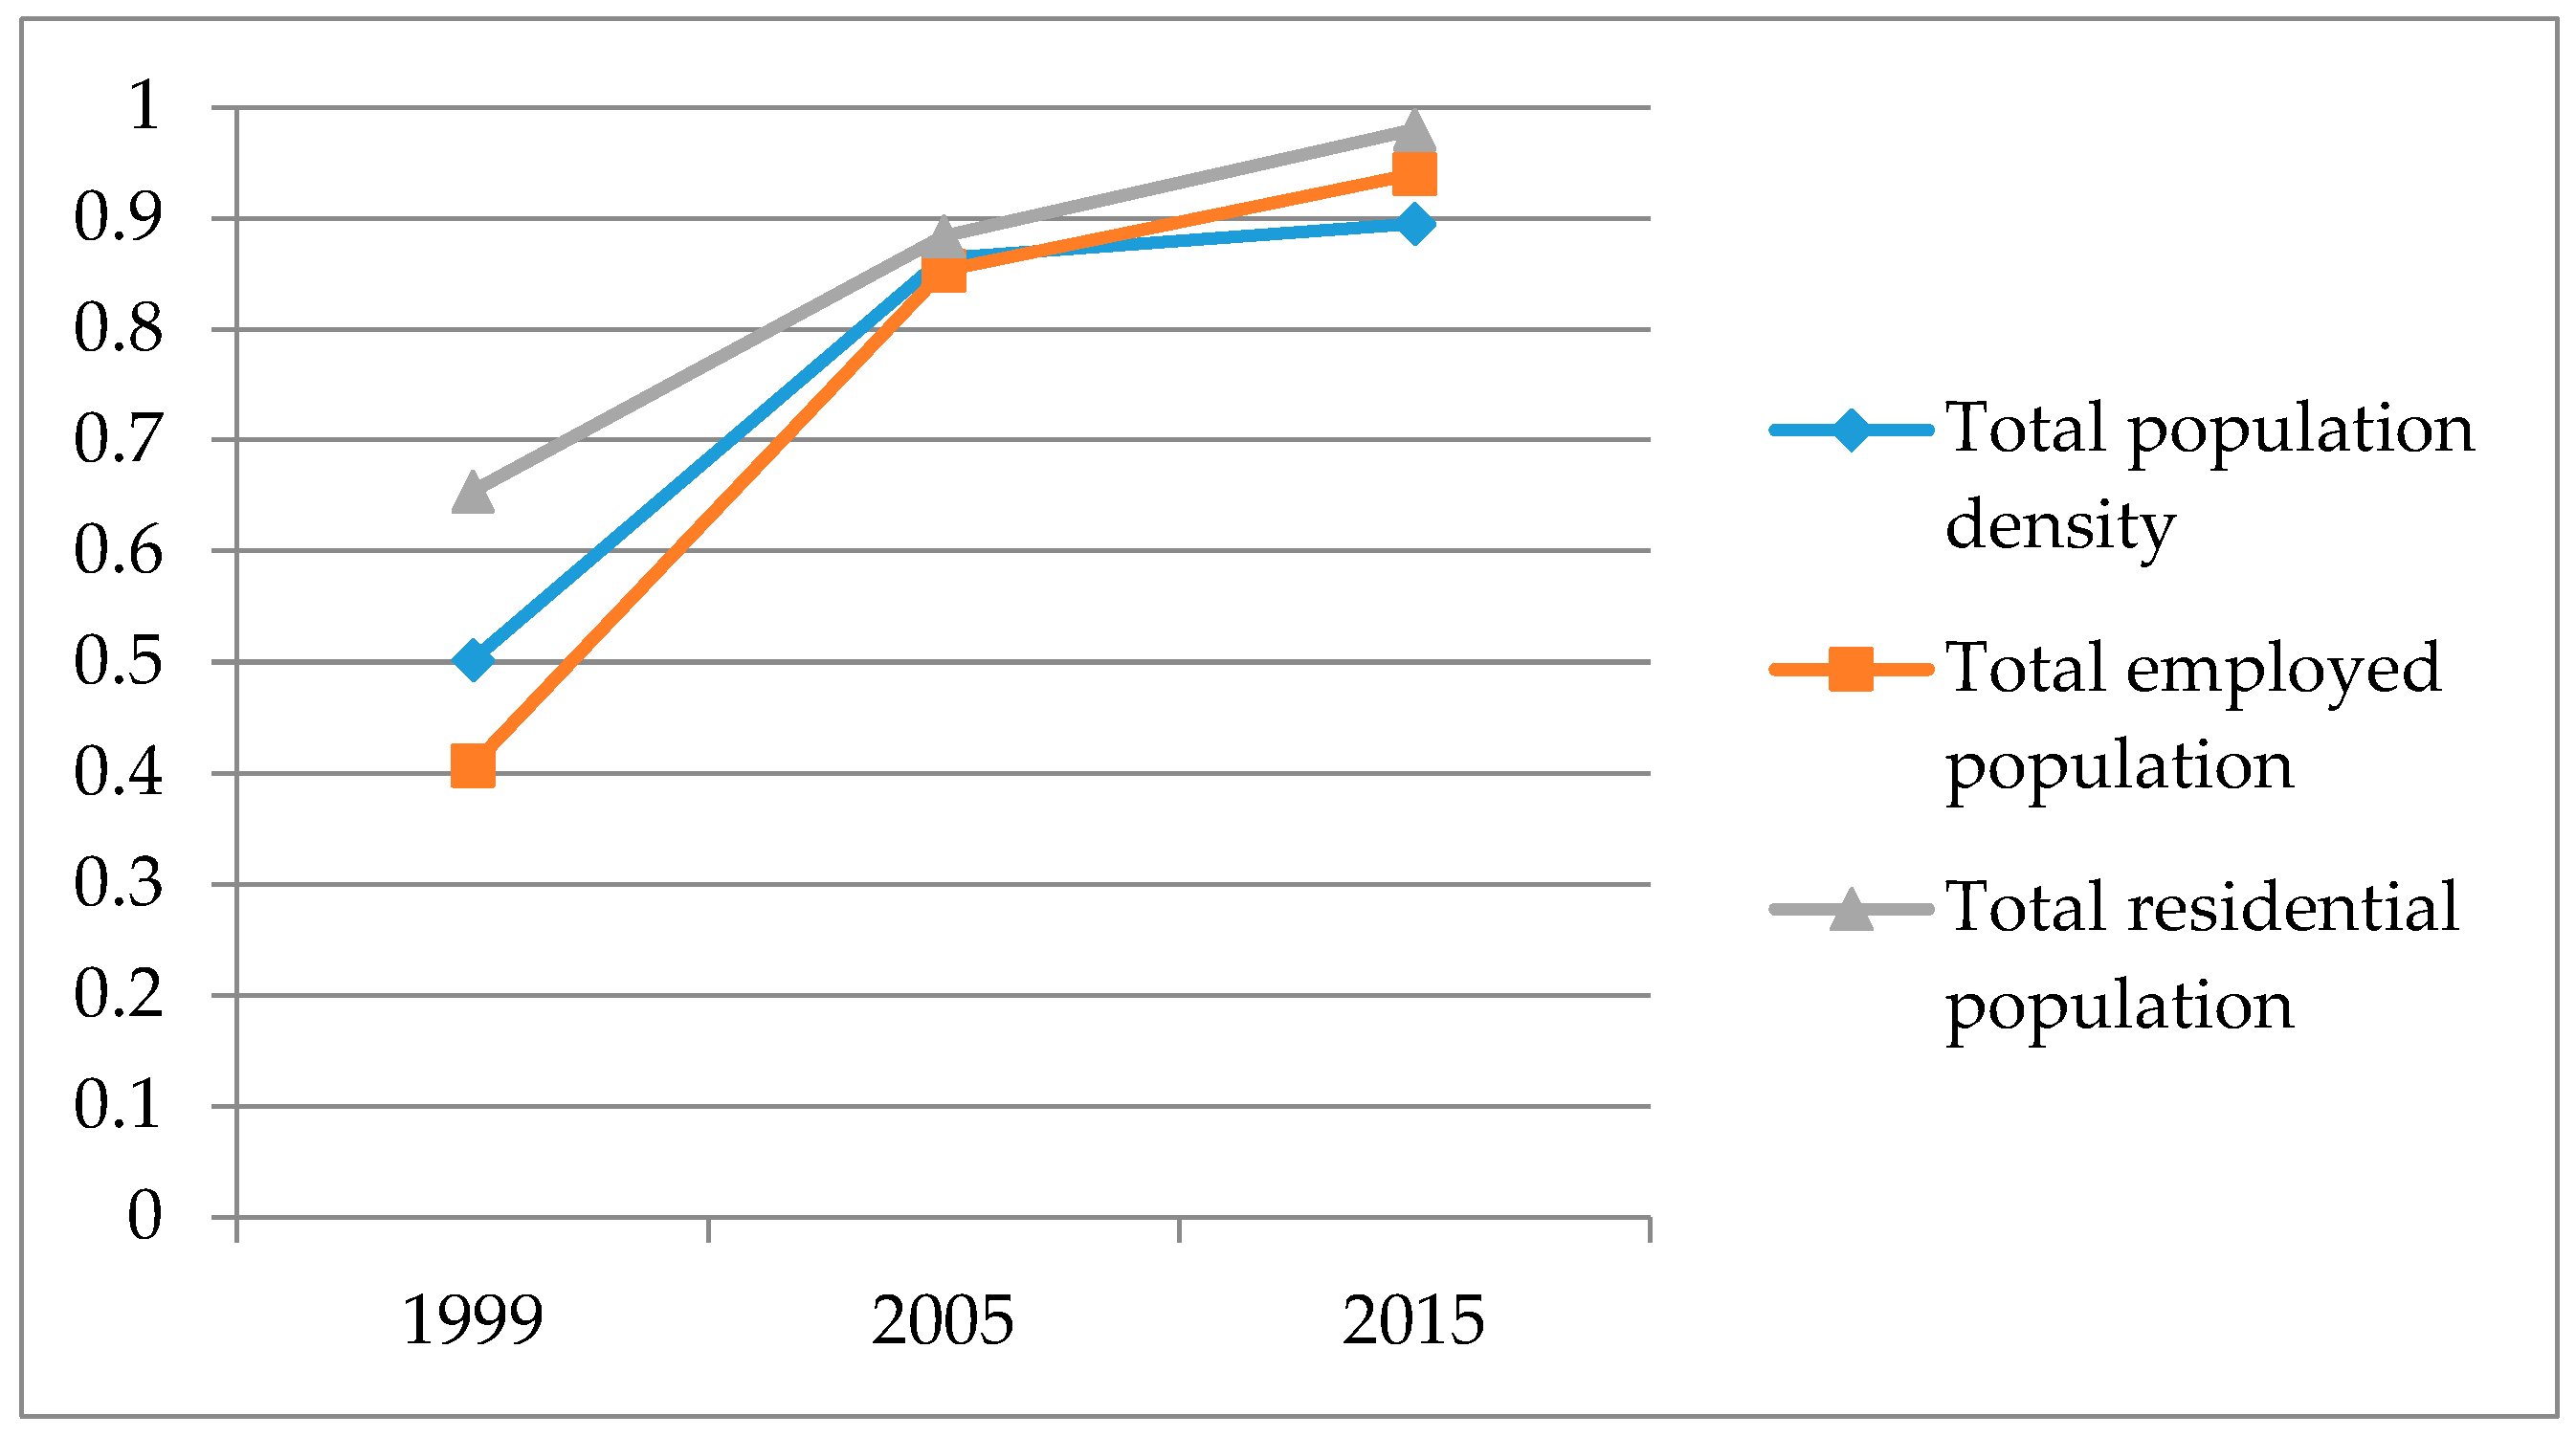
Table 9 shows the calculation results of the order degree of the order parameters of the population effect sub-system, and
Figure 7 shows the change tendency.
It can be seen from
Table 9 and
Figure 7 that, before rail transit construction, the surrounding areas were rather prosperous and bustling; therefore, the order degree of three order parameters of the sub-system was relatively high in 1999. In 2005, land use constantly increased along the rail transit line, boosting rapid commercial development and bringing huge passenger volume, so the order degree of three order parameters increased significantly. Since the total residential population was close to the statutory plan, from 2005 to 2015, the order degree of three order parameters of the sub-system increased at a very small rate, and it gradually equaled one.
4.
Table 10 shows the calculation results of the order degree of the order parameters of the underground space sub-system, and
Figure 8 shows the change tendency.
It can be seen from
Table 10 and
Figure 8 that three order parameters of this sub-system moved toward an order state steadily from 1999 to 2015. However, in 1999, the underground space along the rail transit line was rarely developed, its function being unitary; the overall plan was incomplete, and as a consequence, the order degree was very low. In 2005, the underground spaces were scattered, being unconnected to each other, which resulted in low service efficiency. From 2005 to 2015, the underground spaces along the rail transit line was remarkably developed, paying attention to their mutual connection and to the surrounding buildings, so its comprehensive benefits began to emerge. During this period of time, the order degree of the three parameters of the sub-system was greatly improved. However, compared with the other sub-systems, there remains room for further improvement.
3.3.3. Calculation and Analysis of the Sub-System Order Degree
Based on the order degrees of the order parameters of the sub-systems shown in
Table 7,
Table 8,
Table 9 and
Table 10, the order degree of each sub-system can be calculated using Equation (4), as shown in
Table 11.
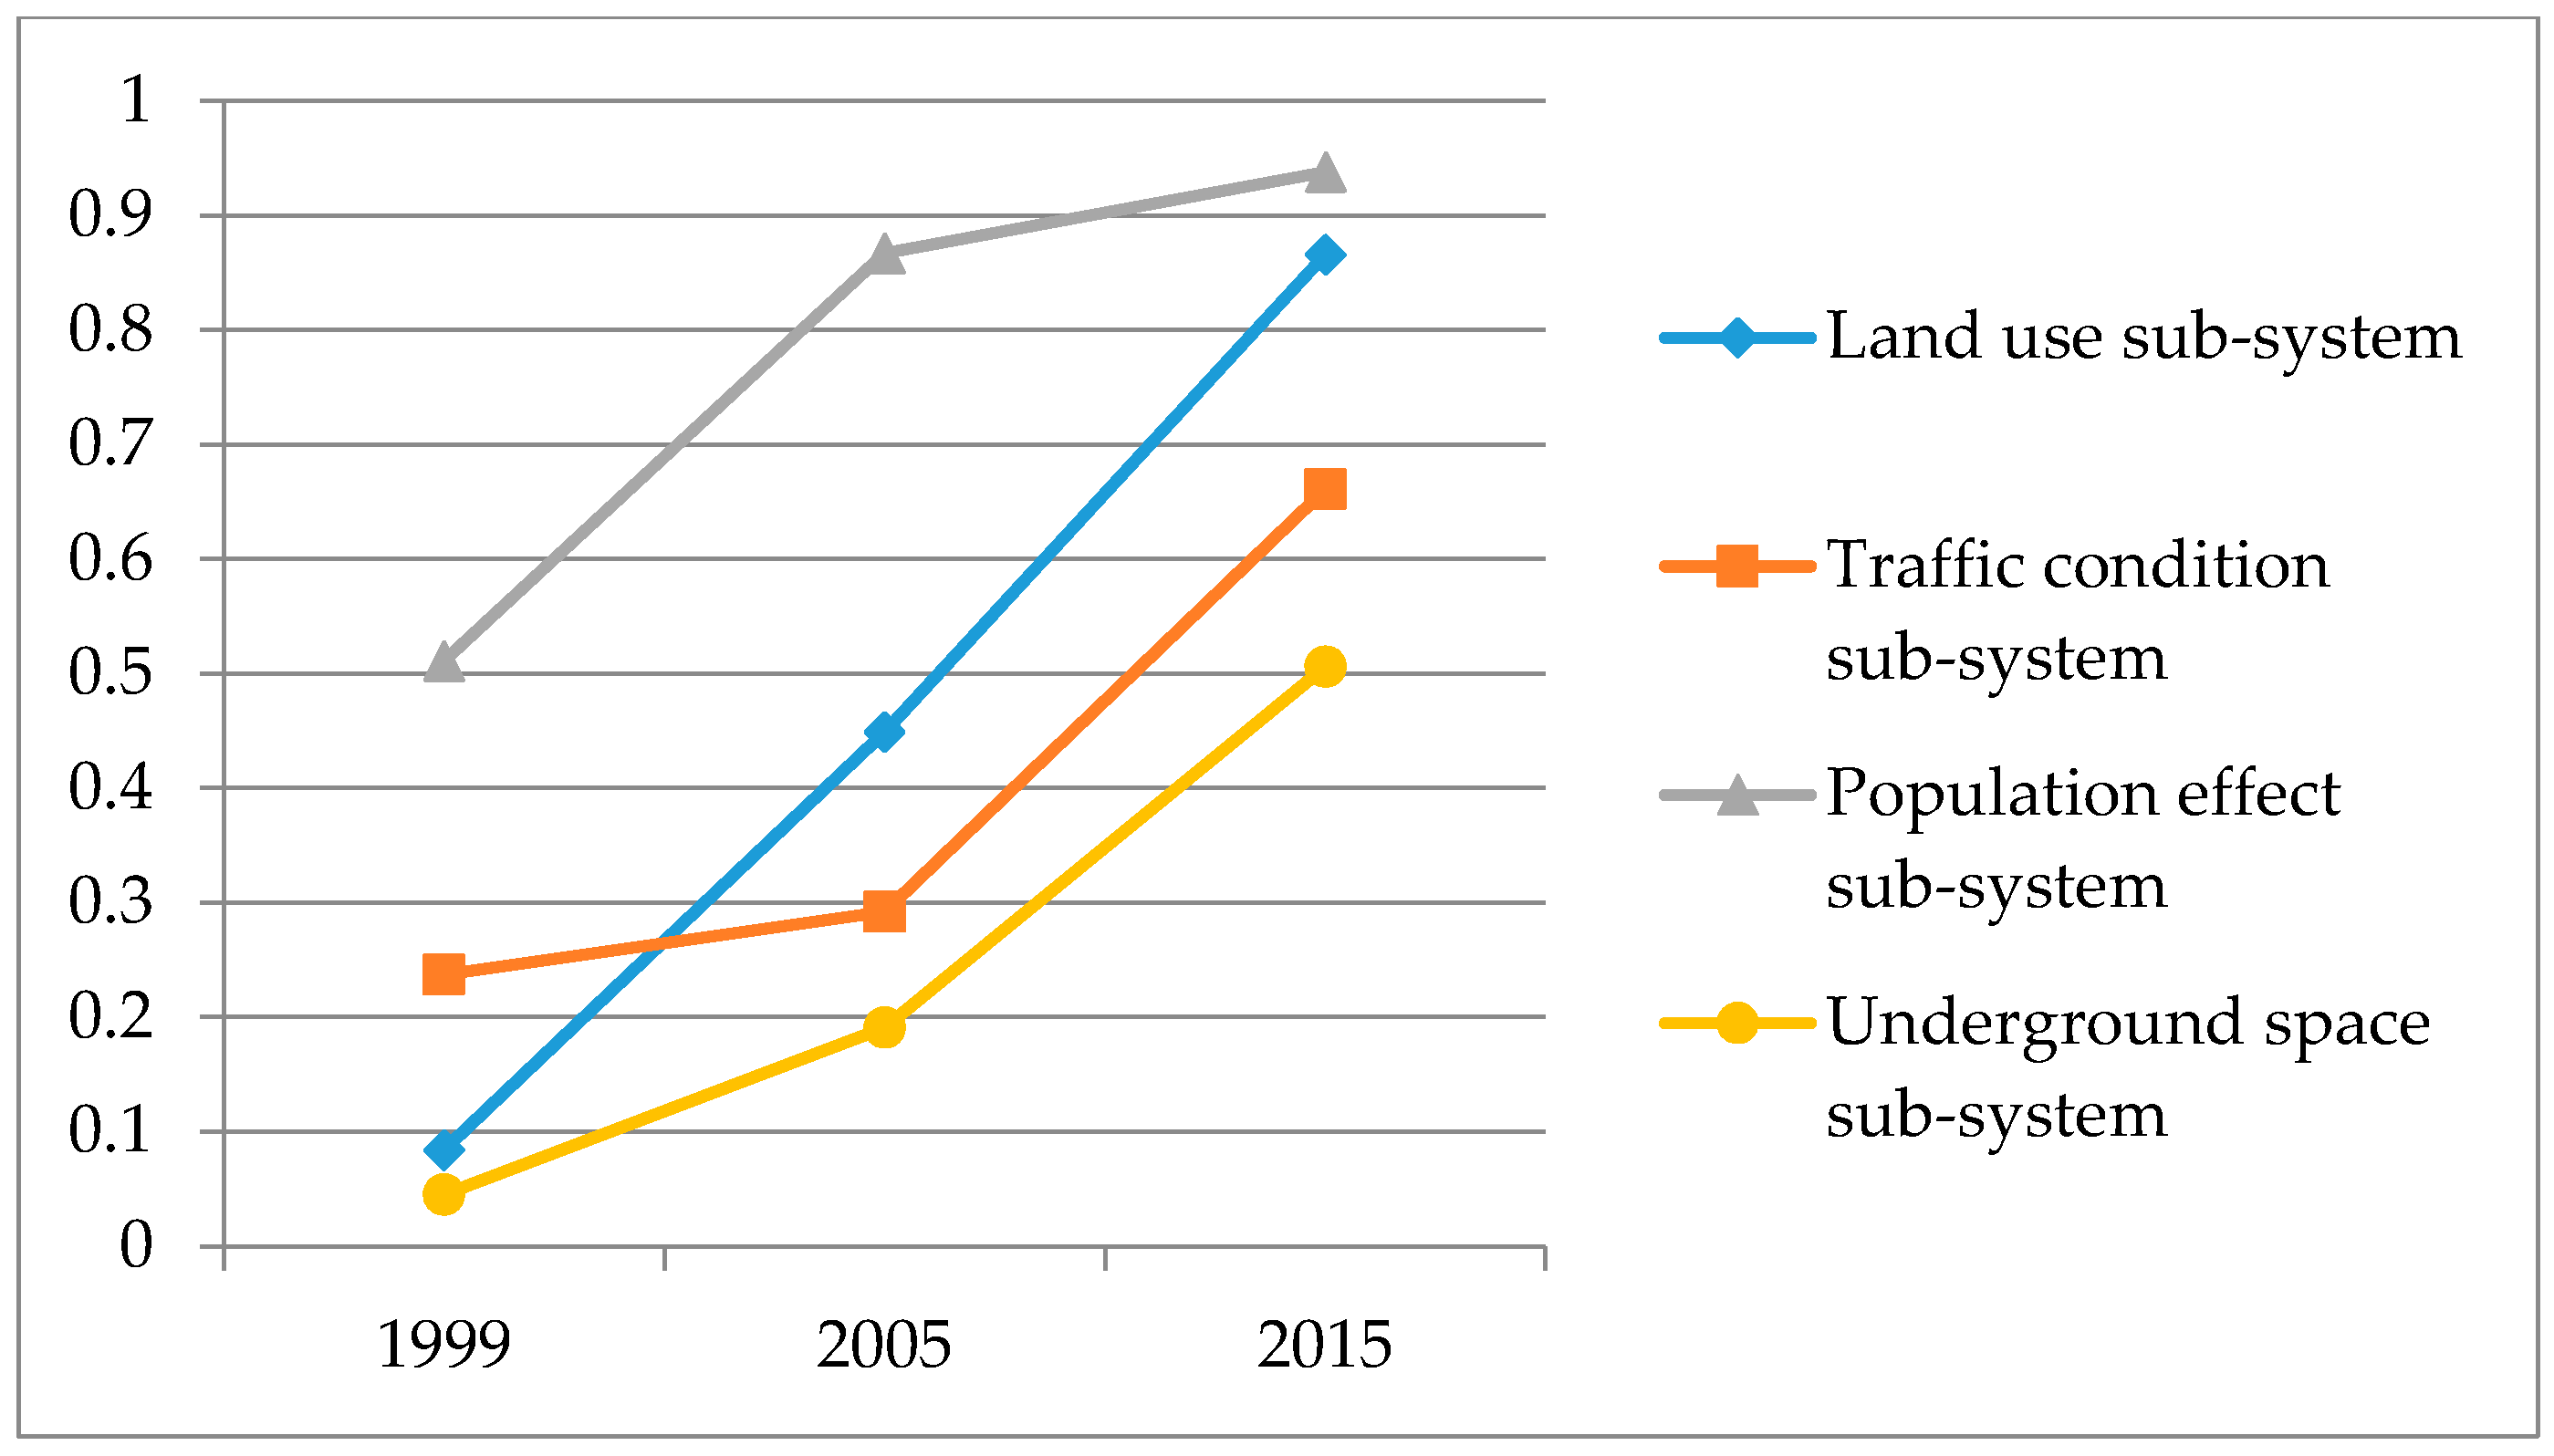
Figure 9 shows the change tendency.
It can be seen in
Table 11 and
Figure 9 that, in 2005 and 2015, the order degree of the population effect sub-system was the highest, followed by the land use sub-system and the traffic condition sub-system, and the order degree of underground space sub-system was the lowest. From 1999 to 2015, the order degrees of all of the sub-systems increased to varying degrees, among which, the improvement of the land use sub-system was the most obvious, followed by the underground space sub-system and the population effect sub-system, and the improvement of the traffic condition sub-system was the least obvious.
The order degree of the population effect sub-system remained the highest all of the time and reached 0.938 in 2015. This is because the Phase-I Project of Shenzhen Rail Transit is consistent with the urban principal axis and is connected with the busiest bus routes. It links the CBDs, entertainment districts and comprehensive transportation hubs together, making it easier for people to go out. An increasing number of people are willing to move to the surrounding areas along the rail transit line, thus increasing the population and raising the economic benefits from large passenger volumes. Presently, the residential and employed population along the rail transit line has almost reached the planned scale, so it should be appropriately controlled in the future by adjusting the aggregate land for the construction of the populated area and the commercial area.
The improvement of the order degree of the land use sub-system was the most obvious during the two time periods. The reason is: the Phase-I project links Huanggang Port, Huaqiangbei CBD, Futian Central District, Che Kung Temple Commercial District, Huaqiaocheng Leisure and Entertainment District, Luohu Railway Station Transportation Hub and Luohu CBD together. The surrounding areas along the rail transit line have the highest land price and are the most developed in Shenzhen, thus driving land use intensity to reach the statutory plan gradually and land use structure to become increasingly reasonable.
The improvement of the order degree of traffic condition from 2005 to 2015 was more obvious than that from 1999 to 2005. The primary reason is: though the Phase-I project was put into service in 2005, a comprehensive rail transit network did not come into being at that time, and as a result, a reasonable public transportation network and effective transfer between rail transit and bus were unavailable, leading to overall efficiency decline and a low share rate of public transportation. In 2015, the Shenzhen subway network took initial shape, making full use of public transportation advantages; therefore, it not only satisfied the transportation demand in the downtown area, but also benefited the surrounding regions.
The order degree of underground space remains to be promoted further. From 1999 to 2005, the development of underground space was not well integrated with the rail transit construction; consequently, the underground space was developed spontaneously in the absence of overall planning, especially in the integration between aboveground and underground space. The underground space development mainly centered on the rail transit stations by constructing sporadically-distributed commercial facilities, thus failing to be connected with the surrounding buildings. As a result, the overall coordination was insufficient, the quality of the surroundings was poor and comprehensive benefits were not fully achieved. From 2005 to 2015, great attention was paid to the development of underground space along the rail transit. Comprehensive development by centering on the rail transit stations became a common development mode, which emphasized the construction of underground passages and integration between underground space and rail transit, ensuring sufficient traffic relief capacity in the surrounding areas; therefore, the order degree of the underground space sub-system was rapidly improved.
3.4. Calculation and Analysis of the System’s SSD
Based on the data in
Table 11, the system’s synergy degrees from 1999 to 2005, from 1999 to 2015 and from 2005 to 2015 can be calculated using Equation (5). The synergy degree from 1999 to 2005 is:
The synergy degree from 1999 to 2015 is:
The synergy degree from 2005 to 2015 is:
By comparing cm1 and cm2, the overall evolution tendency of the system’s synergy degree from 1999 to 2015 can be observed. cm2 > cm1 > 0 indicates that the synergy system of the aboveground and underground space along the Phase-I Project of Shenzhen Rail Transit gradually developed to an ordered state as a whole. In 2015, the synergy degree was only 0.179, and the primary reason was: the newly-constructed rail transit began to contribute to the synergetic development of the AUSURT line, but the contribution was limited. In 2015, the synergy degree rose to 0.505, to which the land use sub-system made the most contributions. However, the formation of the urban rail transit network played an increasingly important role to boost the synergetic development of the AUSURT line.
By comparing cm1 and cm3, the improvement of the synergy degrees from 1999 to 2005 and from 2005 to 2015 can be observed. cm3 > cm1 > 0 indicates that the improvement from 2005 to 2015 is more obvious than that from 1999 to 2005, which certainly had something to do with the time length. However, it shows an important fact: before the rail transit network came into being, the synergy degree increased at a very slow speed, while after the rail transit network was formed, it increased at a faster speed.
To sum up, the synergy system of the AUSURT is a complex self-adaptation system. The order degrees of the sub-systems are different from one another and also increase at varying speeds, resulting in different evolution laws at different periods of time. Therefore, it takes time for the system to develop from out-of-order to an ordered state and from simple to complex, but one thing is sure: it constantly evolves in a particular way. Its function and structure also change over time.
4. Conclusions
The synergetic evolution of AUSURT is a complex long-term process and is subjected to the impact of many factors, such as society, economy, culture and environment. From the perspective of USD, this study focuses on the space level and selects the related factors as its sub-subsystems; then, a synergy degree model has been established to show the synergetic development of the synergy system at different periods of time: from pre-construction to post-construction and then to the rail transit network taking initial shape, thus obtaining the laws of the synergetic evolution of AUSURT. Although most of the raw data were gathered through field investigation and information research at the beginning of this study, the paper is limited to the quantitative research method. The result will be more meaningful if these qualitative research methods, such as interviews, questionnaires and participant observations, can be used in the future research. In addition, elements impacting the synergy degree during the two periods are different; for research convenience, the selection of sub-system order parameters does not take into consideration the influence from other rail transit lines, transferring stations or other elements. Therefore, in future research, if only on the space level, it is recommended to establish a more complex synergy degree model based on a comprehensive rail transit network and to consider more impacting elements, such as the superimposed effect of other rail transit lines and transferring stations, etc., so as to further promote the collaborative planning and development of AUSURT, to improve space use efficiency in cities. However, in the future, research is at the level of urban planning; many more factors should be taken into account, such as culture and environment, which then will promote urban sustainable development.


