Article

Avoiding Decline: Fostering Resilience and Sustainability in Midsize Cities

1
U.S. Geological Survey, Nebraska Cooperative Fish and Wildlife Research Unit, School of Natural Resources, University of Nebraska-Lincoln, Lincoln, NE 68583, USA
2
Nebraska Cooperative Fish and Wildlife Research Unit, School of Natural Resources, University of Nebraska-Lincoln, Lincoln, NE 68583, USA
3
Department of Civil Engineering, University of Nebraska-Lincoln, Lincoln, NE 68583, USA
4
College of Law, University of Idaho, Moscow, ID 83844, USA
5
Department of Civil and Environmental Engineering, University of Illinois, Urbana, IL 61801, USA
6
U.S. Environmental Protection Agency, National Risk Management Research Laboratory, Cincinnati, OH 45268, USA
7
United States Army Corps of Engineer, Engineer Research and Development Center, Concord, MA 01742, USA
8
Urban Design Center, University of Idaho, Boise, ID 83702, USA
9
Idaho Water Resources Research Institute, University of Idaho, Moscow, ID 83844, USA
*
Author to whom correspondence should be addressed.
Sustainability 2016, 8(9), 844; https://doi.org/10.3390/su8090844
Submission received: 23 June 2016 / Revised: 11 August 2016 / Accepted: 12 August 2016 / Published: 26 August 2016
(This article belongs to the Special Issue Sustaining the Shrinking City: Concepts, Dynamics and Management)

Abstract

:
Eighty-five percent of United States citizens live in urban areas. However, research surrounding the resilience and sustainability of complex urban systems focuses largely on coastal megacities (>1 million people). Midsize cities differ from their larger counterparts due to tight urban-rural feedbacks with their immediate natural environments that result from heavy reliance and close management of local ecosystem services. They also may be less path-dependent than larger cities due to shorter average connection length among system components, contributing to higher responsiveness among social, infrastructural, and ecological feedbacks. These distinct midsize city features call for a framework that organizes information and concepts concerning the sustainability of midsize cities specifically. We argue that an integrative approach is necessary to capture properties emergent from the complex interactions of the social, infrastructural, and ecological subsystems that comprise a city system. We suggest approaches to estimate the relative resilience of midsize cities, and include an example assessment to illustrate one such estimation approach. Resilience assessments of a midsize city can be used to examine why some cities end up on sustainable paths while others diverge to unsustainable paths, and which feedbacks may be partially responsible. They also provide insight into how city planners and decision makers can use information about the resilience of midsize cities undergoing growth or shrinkage relative to their larger and smaller counterparts, to transform them into long-term, sustainable social-ecological systems.

Graphical Abstract

1. Introduction

Urbanization is a hallmark of the Anthropocene. In the United States (U.S.), more than 85% of the population lives in urban areas. One in six of these urban inhabitants can be found in midsize cities, which are defined as incorporated areas in the conterminous U.S. with a population between 50,000 and 300,000 [1]. Yet, much research, outreach, and policy intervention are designed based on very large coastal cities, even though only nine U.S. cities have populations exceeding one million [1]. Here, we identify factors affecting the urban resilience of midsize cities, and describe the components of sustainability and resilience as they apply to midsize cities in both desirable and undesirable states. These descriptions inform the maintenance of desirable states into the future [2], in order to identify the system components that underpin undesirable or desirable states.
Midsize cities are unique relative to large cities because they are intimately coupled to their immediate suburban and rural surroundings through ecosystem service production and natural resources management, resulting in tight urban-to-rural feedbacks (Figure 1). Larger cities rely more on a “pipeline” delivery of food, water, and manufactured goods from places and watersheds far removed from the point of service [3], likely resulting in slower feedbacks between consumption and impacts of resource depletion at the source of consumption. We argue that relatively shorter feedbacks between the local ecosystem and the urban system are a hallmark of midsize cities compared to their larger counterparts, and provide a basis for our framework. Indeed, these feedbacks should be incorporated into any resilience-sustainability assessment of a midsize city.

2. Defining Midsize City Resilience and Sustainability

Resilience is an emergent system property that describes how much disturbance a system can withstand without losing essential structure and functioning [4]. A resilient system experiences disturbances without reconfiguring into an alternative state with new structures and functions. This definition contrasts with engineering resilience, which measures the return or “bounce back” time to a desirable state following disturbance. Here, we are primarily interested in resilience as a measure of a midsize city system’s capacity to maintain a sustainable (i.e., desirable) developmental trajectory through the preservation of desirable structures and functions across space and time.
The concepts of resilience and sustainability are related but not synonymous [5]. Resilience is often used in a normative context, because an unexpected reconfiguration into an alternative state is frequently associated with a persistent loss in desirable ecosystem services [6]. However, management intervention that seeks to intentionally transform a system from an undesirable to a desirable state may face considerable challenges if the current state is resilient to the intervention—in this context, resilience is an undesirable system property because it limits desired transformations [7]. Thus, assessing and quantifying relative, place-based resilience in social-ecological contexts requires careful definition of the resilience of what, to what, and for whom [8,9]. Here, we examine the resilience of mid-sized cities to unforeseen future disturbances for the well-being of its current and future inhabitants. We follow the broad definition of sustainability as the long-term reconciliation of society’s development goals with the planet’s environmental limits [10]. Resilience assessments capture concepts of disaster vulnerability and adaptive capacity while accounting for the complex interactions between humans and their environment [11]. Non-sustainable systems are ultimately vulnerable to both natural and human-induced disasters and hazards. A sustainable city is in a desirable state and is resilient to future intrinsic and extrinsic surprise; i.e., it can withstand disturbances coming from within and outside of the system while resisting reorganization into a new state.
Resilience assessments capture the integrative measure of sustainability in the context of a desirable regime characterized by ecological, infrastructural (within the built environment), and socioeconomic factors. The term “regime” explicitly refers to the key structuring processes of a given system state; when a system diverges from a regime, the system state changes. An example of alternate states (i.e., regimes) in complex urban systems is a city with an economy characterized by high upward economic mobility versus a city where poor residents are caught in a poverty trap. A threshold, or tipping point, separates these alternative states (or regimes; Figure 2) and each regime has a set of reinforcing processes and structures also referred to as “basins of attraction” that maintain the system in its current state.
Some authors (e.g., [12]) have conceptualized the change from a non-sustainable to a sustainable city as a state change (regime shift), suggesting that understanding such transitions requires knowing: “(1) the triggers that have induced change; (2) situations where crisis triggers change; (3) why cities transition toward more sustainable states on their own, in the absence of crisis; (4) what we can learn from new city transitions; and (5) how resource interactions affect urban transitions [12] (p. 320)”. Given this, solutions to urban sustainability challenges may be categorized as follows: for a city in a desirable state, resilience should be fostered to ensure a long-term sustainable trajectory, and for a city in an undesirable state, change should be transformative, meaning the resilience of the system should be deliberately exceeded to foster an alternative, desirable state.
A system in a desirable state can be resilient for a short time interval but not at larger scales; that is, despite stability in terms of basic structure and function, the system is not sustainable over longer time intervals for various reasons. Examples include cities based on short-term resource extraction, such as the numerous boom-and-bust mining towns in the western U.S., and cities in the Bakken Shale region in the northern Great Plains. For cities, the scale domains of critical structuring dynamics can be categorized in many different ways. We suggest that the desirability of a resilient state can be assessed by measuring a set of key processes and structures within and across relevant domains of scale, and the tradeoffs among different components can be explicitly identified and communicated.
Midsize cities may be more responsive to sustainable transformations than their large city counterparts due to their different scales of processes, components, and feedbacks. As a result, absolute component interaction and system response to a change (e.g., policy interventions) may be more rapid or efficient than in a larger city where there are fewer and/or more deterministic connections among components. Indeed, large cities and megacities exhibit strong path-dependency that makes altering their developmental trajectory very difficult. Inertia in social systems and infrastructure is a barrier to sustainability in urban systems [12]. For these reasons, we argue that midsize cities are best suited for the study and pursuit of transitions to sustainable states, and provide a large sample size for studies in the United States.
In any urban system, the interactions of its components affects whether the city is on a sustainable trajectory. Conceptually, we categorize the resilience of urban systems as composed of three overlapping subsystems: (1) socio-economic, (2) ecological, and (3) infrastructure. Within these subsystems, we propose measurable axes that theoretically or empirically contribute to their resilience. For the ecological system, these axes are: diversity, variability, modularity, feedbacks, capital, ecosystem services, ecological footprint, cross-scale reinforcement, green space, biogeochemical cycling, and water availability [13]. For infrastructure, they are: excess capacity, capital, diversity, transportation, investment in innovation, funding, environmental impact, bottlenecks, amenities, knowledge, reuse/recycling, and age. For the social-economic and governance systems they are: trust, wealth, education, public health, economic innovation, amenities/services, diversity, public finance, culture, system age, material flows, and population density. We consider these proposed axes as hypotheses that should be explored and tested. The importance of particular variables´ feedbacks is context dependent, and this list is not exhaustive.

3. Measuring and Assessing Resilience

The tradeoffs among individual indicators of resilience in the ecological, infrastructural, and social-economic components of mid-sized cities can be visualized as “axes of resilience” in a spider web diagram for rapid comparison. This approach allows for visualization of multiple, integrated variables (each axis represents multiple variables) but does not provide a single overall measure of resilience. That type of metric can be derived using tools of Multi-Criteria Decision Analysis (see [14,15]) or Network Science techniques [16].
We suggest deconstructing complex urban systems into component subsystems and/or individual resilience metrics (Table 1 [13]) because assessing resilience in the overall system requires quantifying resilience along multiple axes, and assessing the tradeoffs among those axes. To integrate these subsystems, a “system of systems” approach should be utilized. Quantification first occurs for each subsystem, where a collective evaluation of all subsystems within a city provides the opportunity for an explicit assessment of the resilience of the system as a whole while incorporating tradeoffs that occur amongst the subsystems (Figure 3). As an example, natural disasters such as fire may have devastating ecological and infrastructural impacts, but resilience to natural disasters may be enhanced by wealth, through more options in response and a faster recovery.
In estimating the resilience of midsize cities and other urban systems, we propose a suite of measureable factors across the three component subsystems (ecological, infrastructural, and social-economic), following an approach similar to that of the planetary boundaries. The key properties, or structuring variables, which describe the performance of the ecological, infrastructural, and social-economic subsystems are not commensurate in that they cannot be weighed against one another equally, but are useful for relative comparisons. The nine properties are also not an exhaustive list, but a starting point (Table 1). In estimating such variables within an urban system, one can draw conclusions regarding the relative resilience of midsize cities of similar geographic, demographic, and cultural extents and across the individual subsystems.

3.1. Ecological Subsystem

Human communities rely upon the goods and services provided by ecosystems [17]. Inhabitants of urban systems in the U.S. rely upon a suite of ecosystem services such as waste removal, water filtration, food provisioning, and recreation. Maintaining these goods and services for long periods of time, over the course of successive urban planning cycles, is critical. Resilient ecosystems can withstand some degree of disturbance and may continue to produce the desired services. If, however, the level of disturbance exceeds its resilience, the system will reorganize into an alternative state [18]. Often this reorganization results in significantly fewer and/or less desirable goods and services, which may be unanticipated by humans who depend upon those services to maintain quality of life standards [19]. The reorganization is also often marked by a loss of biodiversity and overall ecological integrity. This alternative state is often considered undesirable.
There are several ecological questions that relate to the sustainability and resilience of urban systems. Basic questions related to sustainability and resilience focus on the relationship between ecological systems and anthropogenic built environments, the generation of ecosystem services in urban settings, the benefits of green infrastructure and vulnerability to natural disasters. Because midsize cities are so tightly coupled to their surrounding landscape (Figure 1), changes to the urban environment can have direct, immediate consequences for the surrounding ecosystems. If an urban economy experiences a drastic change, the effect on the local ecosystem could disrupt activities that maintain essential ecosystem services. An example of the disruptive influence of economic changes in ecosystem services is the case of intense mining or agriculture extraction. While such disruptive, extractive management is likely unsustainable over long time horizons; it may be requisite for supporting human populations over a shorter period at certain quality of life standards.
Midsize cities that are truly sustainable balance the tradeoff between disruptive extractive activities and ecological resilience by fostering healthy ecosystems in desirable states with long-term sustainable economic practices. Ecological resilience offers a buffer, lest the tradeoffs between ecological integrity and economic growth occur in direct opposition. When this buffer is lost, the city becomes vulnerable to decline.

3.2. Infrastructure Subsystem

Infrastructure is a critical foundation shaping the manifestation of cities within their ecological and social contexts. Infrastructure operates at the nexus of engineering systems, the natural environment, and socioeconomic systems. Because resilience and sustainability are emergent properties of the interactions of all of these sub-systems, sustaining the combined social-engineering capacity requires understanding and managing feedbacks and interrelations among the subsystems (Figure 4) across temporal and spatial scales. Critical infrastructures underlying water supply, transportation, energy production, etc. are interdependent, especially in urban areas. This interdependence affects the overall performance of the system, as well as the sub-systems it comprises. For example, recent biofuel and shale gas/oil development (energy production) in the U.S. will create unique challenges for critical lifeline infrastructural systems including food production, energy supply, transportation, water supply and others [20], as well as for the environment and the communities. Infrastructural components related to emerging energy development are interdependent, primarily by virtue of physical proximity, operational interactions, and competition for natural and human resources at both local and regional scales [21]. Interdependencies may stabilize the overall system operation; however, damage to one infrastructure can cascade and damage connected components with system-wide consequences, impacting large geographic regions and sending ripples through the regional and national economy [22].
Infrastructure expansion and maintenance is critical for the sustainable development of midsize cities. Infrastructure development in midsize cities is closely tied to rural development in some cases (e.g., biofuel development in the Midwest can drive the growth of many small and midsize cities in the region); and existing infrastructures and future expansion can have synergistic or competitive interactions with nearby large cities (e.g., water supply expansion can compete with that existing in a nearby large city; highway and railway expansion in those cities can enlarge and/or complicate the region transportation network).
The principles of green infrastructure [23] are especially suitable for infrastructure development in midsize cities given the dependence of the urban area to the surrounding environment. However, past infrastructural system design focused on efficiency and optimization of limited key services to some human societies and ignored the needs of natural systems, and/or affected the needs of other societies (e.g., water supply), which left these systems vulnerable to change. The implementation of green infrastructures needs proper policy guidance based on both economic and environmental performance, and societal acceptance of the infrastructure development that would accompany city development purposes. The choice among various technology options that differ in their environmental costs and infrastructure requirements will be influenced by the policies adopted. Infrastructure development that prioritizes the maximization of one outcome (i.e., economic growth) at the expense of others can produce an array of effects at the community level [24], including beneficial effects (such as increased employment opportunities, landowner royalties, and new sources of tax revenue) and deleterious effects (such as overburdened municipal services, road network congestion and pavement deterioration, reduced water availability for conventional uses, economic volatility, a disruption of social and cultural patterns, and the stigma associated with environmental health risk and industrialization). It is reasonable to assume that at the scale of midsize cities, the impact of infrastructure development is more significant and more diversified [24,25].

3.3. Social-Economic Subsystem

There are several questions related to social-economic subsystems that focus on the relationship between environmental factors, measures of resilience, and the cohesion, wealth and transformability of society. Here we focus on the relation between environmental factors and social network cohesion, the relation between results of measures of resilience and property value, and the means to identify undesirable states and foster transformation.
Environmental governance serves as a bridge between nature and society, and reflects the values society places on nature. Governance structures and processes in midsize cities are the nexus for landscape-provided ecosystem services, the infrastructure that delivers the services, and the urban populace that depends on them. Thus, we propose governance as a nexus within the social-economic subsystem. In the context of midsize cities, governance refers to the means through which political actors choose the goals of urban planning, management, development and protection; the means through which they take action to achieve those goals; and the means through which planning is integrated with regional management to affect ecosystem services. Thus, governance includes the formal laws, regulations, policies, and processes of government, as well as the informal institutional frameworks in which social and political actors influence policy decisions [26,27,28,29,30,31].
Adaptive governance (and transformative governance [32]) is a key strategy for maintaining the sustainability and resilience of cities. Adaptive governance is a term used to describe system-level approaches to collective choice and action within a variety of environmental governance settings that is sufficiently flexible to allow adjustment, adaptation, and response to change in a manner that fosters the resilience of desirable regimes for social-ecological systems [33,34,35,36,37,38]. Adaptive governance warrants our attention in the context of problems that arise at the interface of nature and society, including solutions to the challenges of water scarcity and quality, the increasing loss of agricultural land to urban development in landscapes surrounding midsize urban areas.
Resilience of the social-economic system is non-normative. It describes a system property rather than how society values that property. But when we apply terms such as resilience and sustainability to social systems, we necessarily overlay normative concepts. The literature on adaptive governance thus recognizes the need for attention to legitimacy, transparency accountability and other attributes of good governance in any effort to sustain its implementation [34,38,39], and we propose that no system that ignores these issues is likely to be sustained in a developed, Western, democratic nation. Thus, our concept of the attributes of governance that will enhance the resilience and sustainability of a desired state must include legitimacy, equity, and justice as well as flexibility and the capacity to adapt.

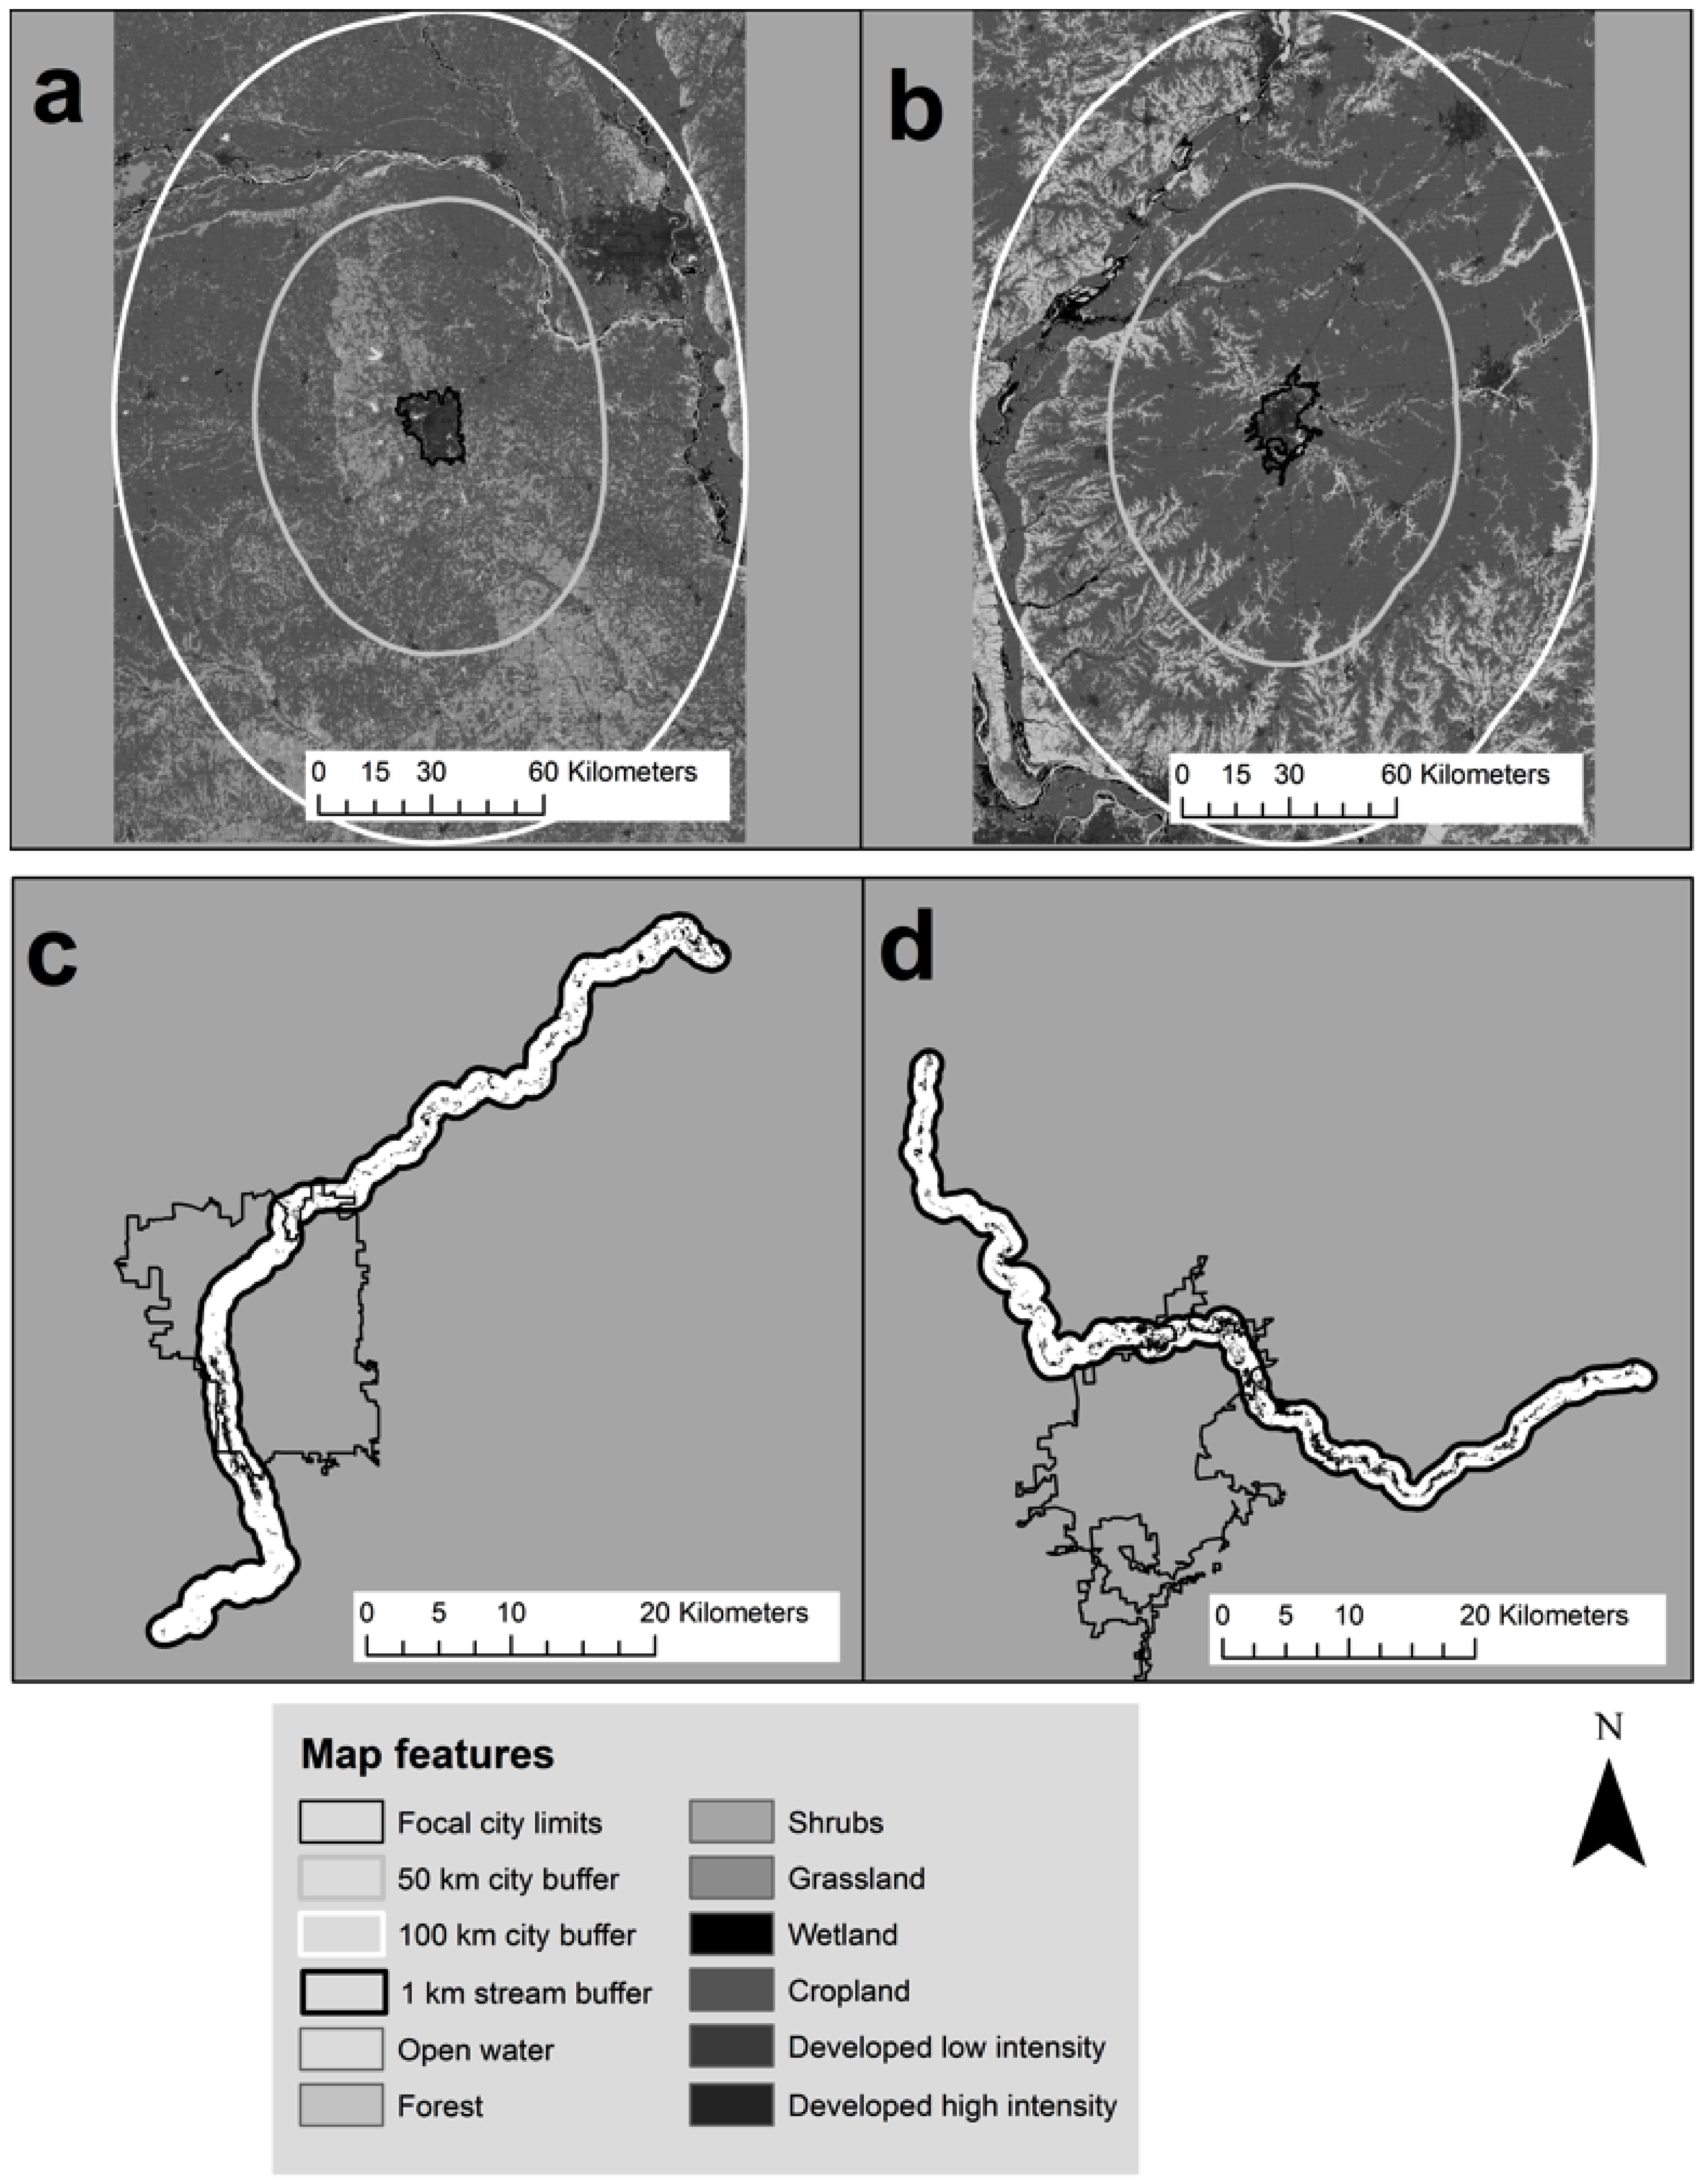
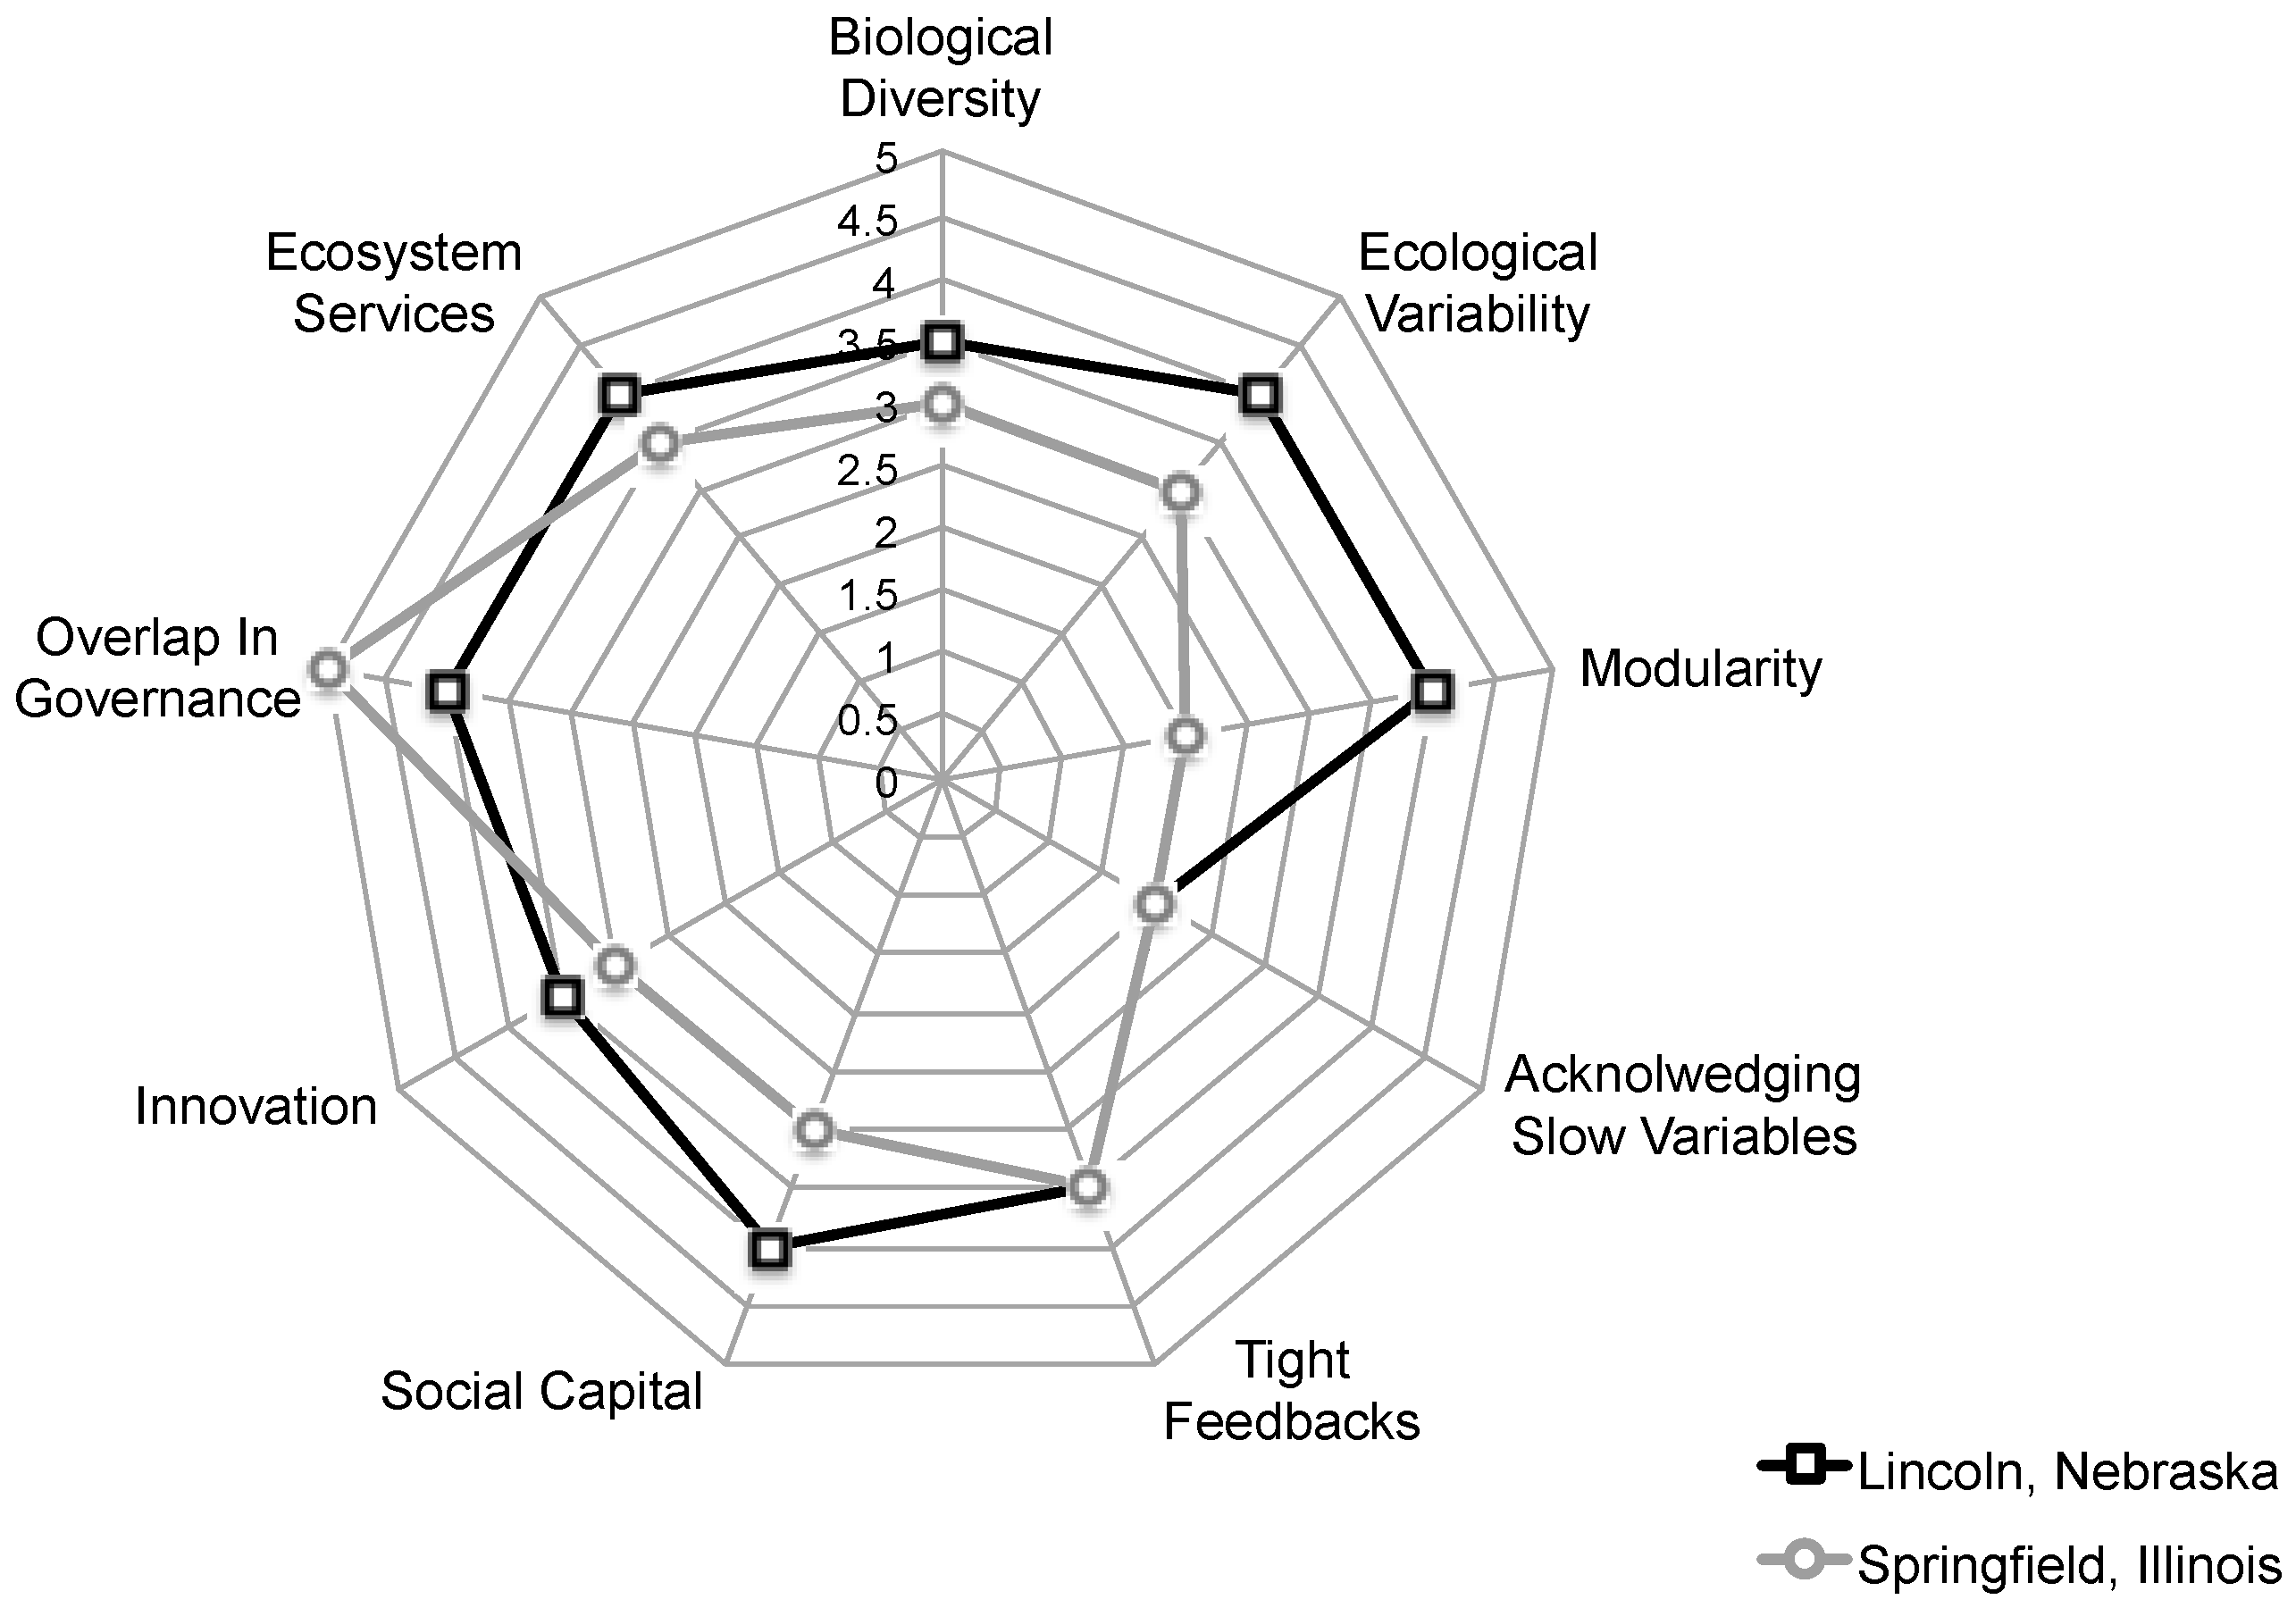
3.4. Applied Example: A Resilience Assessment of Two Midsize Cities

Several frameworks have been proposed for conducting resilience assessments [16,40], yet the applicability of these techniques for midsize cities is underdeveloped [41,42]. Here we build on existing approaches [16,40,41,42], using established social-ecological properties [13] to estimate the relative resilience of two midsize cities in the Midwestern region of the United States. These nine metrics (Table 1.) together describe the performance of the ecological, infrastructural, and social-economic subsystems. The individual properties are not commensurate with one another, but can be examined individually for weaknesses in the whole system, and across multiple systems.
The nine properties are also not an exhaustive list for each specific city, but serve as a general starting point to cover the three subsystems. They are: high (1) biological (species, response, and trait) diversity; (2) ecological variability and (3) modularity; decision makers that (4) acknowledge slow variables, but work to (5) tighten feedbacks among components that may trigger system reconfigurations; high (6) social capital; (7) innovation, and (8) overlap in critical roles, especially regarding emergency response; and finally, a reliable flow of (9) ecosystem services to society. In order to assess the relative resilience of two mid-sized cities in the Midwestern U.S., we assessed these nine properties of a resilient system in Lincoln, Nebraska and Springfield, Illinois (for detailed methods and results, see the Appendix A).
Lincoln, Nebraska (NE) and Springfield, Illinois (IL) are midsize, capital cities with similar ecological, social-economic, and demographic features located in the Midwestern region of the U.S. (US Census 2014). Lincoln, NE is experiencing economic and population growth relative to Springfield, IL (Table 2). This provides an opportunity to probe whether the nine social-ecological resilience indicators provide insight into this divergence, and whether the predicted ability to respond to a disturbance or stressor is linked to GDP and population growth, both of which carry high social and political importance.
Response diversity describes the multitude responses to a disturbance from a community of species that contribute to the same ecological function [43]. An example is the continuity of primary production in the face of an extreme drought event followed by a flood event in a relatively short period. Land cover/land use diversity is an indicator of the larger landscape’s response diversity. If one type of land cover/land use is particularly vulnerable to a social-ecological disturbance in that system (e.g., drought, economic fluctuations), monocultures of that cover type in and around a midsize city could reduce its resilience. As a result, we assume that high diversity of land covers confers a measure of resilience to the system. Our analysis of land cover diversity in Lincoln, NE, and Springfield, IL indicate slightly higher diversity in and around Lincoln, NE relative to Springfield, IL (Figure 5, panels a and b, respectively; for detailed methods see Appendix A). Our approach included buffers surrounding the cities, based on the assumption that midsize cities are tightly coupled with their immediately adjacent ecosystems. The highest land cover diversity, normalized for area, was found in the buffers surrounding Lincoln’s city center, and indicates a greater capacity for the system to absorb shocks while continuing to provide a range of ecosystem services.
Ecological variability in this assessment captures the degree to which social drivers mitigate ecological variability, which is a key structuring driver in many natural systems. Variability could include seasonal fluctuations in stream flow that maintain riverine wetlands, or small wildfires that mitigate woody encroachment into grasslands and thus prevent more dangerous forest canopy wildfires. However, ecological variability that contributes to system resilience is often sacrificed for more immediate ecosystem service production. Therefore, a resilient social-ecological system is one that balances long-term ecological variability with ecosystem services production. In this resilience assessment, we include metrics for both ecological variability and ecosystem services production.
To measure ecological variability for Lincoln, NE and Springfield, IL, we choose to measure the cover and total number of individual riverine wetlands along the two major streams running through the cities. Riverine wetlands are likely good indicators of ecological variability because periodic, minor flooding events recharge and maintain wetlands adjacent to streams [44]. As a result, flood repression and stream channelization common in midsize cities result in decreased wetland cover. Wetlands directly contribute to ecological resilience in the system, absorbing energy, water, and materials in larger flood events. They are also zones of high reactive nutrient removal, reducing the nutrient concentrations in the larger watershed and mitigating hypoxic zones downstream. While the two rivers were comparable in length through the city and total number of riverine wetlands, Springfield had nearly double the total riverine wetland area than Lincoln, NE, indicating greater potential to absorb flooding events (Figure 5, panels c and d).
Modularity of the social-economic system is a measure of how components of the system are arranged in relation to one another. A modular system is arranged tightly enough so that an input (e.g., a shock, information inputs, wealth) is communicated throughout the system evenly, but not so tightly or overly connected in one area of the system so that inputs reverberate, resulting in disproportionate effects on one area of the system. There are multiple ways to approach a modularity assessment of a midsize city. Given that in both cities the top employer is the state, we decided to determine how impactful losing this employer might be in terms of the relative amount of jobs lost. We found that the role of Lincoln’s top ten employers presents a sharp contrast to Springfield’s (Table 3). For instance, in Lincoln, NE the top employer (the state) employs only five percent of the active workforce, compared to Springfield, IL, where the top employer (the state) employs almost a quarter of the active workforce. If the top employer in each city were to lay off the same proportion (or all) of its employees, the impacts would be felt more strongly in Springfield, IL, versus Lincoln, NE, indicating a lower social-ecological resilience to this particular type of stressor.
Slow variables in social-ecological systems are the long-term outcomes that result from short-term alterations of key social-ecological feedbacks. Recognizing these slow variables in decision making is essential to protecting the long-term resilience of a midsize city. We compared the land-use and emergency preparedness plans (required by law) of both Springfield and Lincoln to assess their acknowledgment of slow variables and ability to adapt policies to reflect changes in those variables over time. While both cities had comprehensive plans, neither city had plans that addressed system-specific slow variables, such as increasingly extreme mid-latitude weather events due to climate change, or severe soil degradation. However, meaningfully assessing the acknowledgment of slow variables is subjective and difficult to report as a metric, making any meaningful resilience comparison between the cities challenging.
When system variables are connected by very short feedbacks, by contrast, changes to one part of the system triggers observable change in other parts of the system, providing immediate information regarding the effects of decision making. As a result, midsize cities with tight feedbacks have the capacity to gather, disseminate, and act on relevant data regarding city functioning. However, part of the tight feedback loop includes acting on new knowledge as it arises. For example, cities typically have water quality testing devices in place to monitor the effects of seasonal land use change, alterations to water treatment processes, new water sources, etc. When decision makers fail to monitor or incorporate new information about water quality appropriately, the value of short feedbacks is squandered. Such was the case in Flint, Michigan, where decision makers switched to a new municipal water supply without corrective measures in place to immediately detect and reverse elevated lead levels due to reactions between the more acidic water source and aging city pipes. The failure in this tight-feedback loop led to irreversible lead poisoning effects on Flint residents who consumed city water [45]. Thus, our analysis is based on both (1) the presence of tight feedbacks; and (2) the willingness to act on these feedbacks to ensure access to safe drinking water in the two cities.
Our investigation of tight feedbacks in Lincoln, NE and Springfield, IL examined the strength of water quality feedback mechanisms. We found critical infrastructures at the nexus of safe water supply, food production, and energy generation that are difficult to capture with a single point in time. Generally, however, both cities overall have apparently strong water quality mechanisms in place, including high frequency monitoring. Both have this monitoring data available to the public, and encourage participation in water quality issues with open meetings and water quality concern hotlines. It is not immediately evident how a major disturbance, such as suddenly elevated nitrate levels in drinking water, would be addressed or handled.
Social capital in this context is the net sum of benefits generated from relationships among components in a system’s social network. High social capital in the system contributes to knowledge generation and diffusion and facilitates actors in the system to conduct complex problem solving [46]. This may bolster the ability of the social system to respond to disturbances, therefore contributing to the system’s overall social-ecological resilience. In our investigation of social capital, we use a combination of social-economic and governance factors to present a general overview of social capital in the two midsize cities. Differences in gross domestic product, funding for the arts and education, and unemployment rates may indicate slightly higher social capital in Lincoln, NE. However, this metric (similar to “acknowledges slow variables”) is subjective and difficult to reliably assess for comparison.
Innovation is a measure of how well the social system learns, embraces change, and develops local rules to address problems as they arise. This requires a diverse, educated workforce with high social mobility to allow everyone equal access to decision-making roles. For this evenly represented workforce to innovate, it must have access to high-tech jobs. The technology created can be used to test solutions to existing problems or generate new ideas in the midsize city system. Overall, we found that the two cities are nearly identical in the comparative measures of innovation we chose (see Appendix A), with the exception of high-tech employment. Lincoln, NE has a larger high-tech economic sector than Springfield, IL, indicating greater capacity to innovate and thus withstand unforeseen disturbances.
Governance overlap describes the degree to which critical services provided by government in the social-ecological systems are provided by multiple entities/institutions. If a single institution is responsible for a critical service, that service may be vulnerable to loss or damage in the event of a disturbance, reducing the system’s overall resilience. We examined governance overlap of critical services by reviewing both cities’ disaster response plans. Both had high overlap in essential services, ensuring continuity in services in the face of a variety of natural and human emergencies. Due to the especially structured nature of Springfield’s disaster response plan as compared to Lincoln, a clear framework of responsibilities can be assumed by a number of different persons or agencies under multiple contingencies. This could confer slightly higher city resilience against disasters for Springfield, IL relative to Lincoln, NE.
Ecosystem services are the essential and nonessential and benefits obtained by humans from ecosystems. They include tangibles, like agricultural products, and intangibles, like the spiritual value gained from recreational spaces. In modernizing and expanding cities, ecosystem services, like water and food provisioning or air purification, are increasingly generated remotely. Midsize cities, however, remain reliant on their immediate landscape for many ecosystem services. A major disturbance or disaster event that severs the pipeline delivering these ecosystem services into a city could cut off access to food supplies, water or access to remote recreation spaces. Therefore, we assessed land cover information from within and immediately surrounding the midsize cities to determine the flow of ecosystem services to each city. These assessments include information about land cover diversity, land uses that generate valuable agricultural and mining products, wetland cover, access to hunting and fishing, and green space. Due largely to differences in biodiversity and green space, there is some evidence that Lincoln, NE may have higher ecosystem service production from the landscape within and surrounding the city, contributing to overall system resilience.

3.5. Resilience Assessment Synthesis

These nine aspects of resilient systems are interdependent and represent a holistic approach to describing systems and their tradeoffs (Figure 6). They do not capture every aspect of Lincoln, NE’s or Springfield, IL’s whole system resilience to each type of disturbance, but instead provide an overview of these complex social-ecological midsize city systems’ resilience. From this, a comparison of where the systems diverge can emerge to inform practitioners and provide targeted areas for transformation to more sustainable paths.
While attempting to quantify resilience is operationally dependent and system specific, and thus relative rather than absolute, our approach provides one way to visualize and pinpoint areas where resilience may be deficient. This type of approach can serve as a starting point for other practitioners interested in examining the resilience of their system, by tailoring their investigation to their specific question, finding a comparable midsize city on a path that should be emulated/avoided, and then assessing a set of a priori resilience indicators to gain new insights into the inner workings of their midsize cities.

4. Discussion

As there is no absolute measure of resilience, we proposed a general framework for assessing relative resilience of midsize cities. In addition to the assessment example provided above, measures of subsystem resilience can be combined into an integrative measure of resilience using tools such as Multi-Criteria Decision Analysis (see [12]), which allows city stakeholders to integrate scientific data and value tradeoffs inherent in resilience and sustainability. Where longitudinal data is available, one can compare relative resilience within a system over time.
Relevant questions that can be addressed with such approaches include: How do we achieve sustainable societal goals that accommodate ecological complexity and uncertainty (i.e., adaptive governance) [36]? What are the sustainable prospects for these cities, and how do we assess their relative resilience over time? What are the conditions and processes that gave rise in some cases to adaptation and resilience? Where, and when, should resilience be fostered, and under what conditions might more basic transformative change be necessary? How do we measure the preconditions, structures, processes, and outcomes in order to generalize variables and indicators? How do we address impending challenges related to water quality and quantity? What is the role of these cities’ agricultural or public land watersheds? What is the role of infrastructure development in resilient cities?
Governance capacity and response to the science of vulnerable systems is a critical limiting factor in urban systems, shaping the response of midsize cities to challenges arising in both the ecological and infrastructural subsystems. Social-economic decisions affecting infrastructure viability and decisions regarding tradeoffs between development and the maintenance of ecosystem services are made through the process, authority, and norms of governance. Thus, we hypothesize that the adaptive capacity of governance structures and processes is a key factor in predicting the sustainability of midsize city systems.
The integration of concepts of social-ecological resilience and governance uses five components to analyze the legal and institutional aspects of governance: (1) structure, including redundancy, polycentricity, and networks among urban decision makers and stakeholders and the managers of the surrounding landscape and watershed; (2) scale, including the ability to respond across jurisdictional boundaries at the scale of a disturbance; (3) adaptive capacity, including both the capacity to experiment, learn, and adjust, and the capacity of a diverse array of local actors to participate in the decision-making process; (4) legitimacy in the process and substance of decision making; and (5) power, considering both the distribution and balance of power as indicators of the sustainability and desirability of the governance regime [47].
In the context of midsize cities, the key governance factors affecting resilience are likely to include the capacity to participate and adapt, the enhancement of that capacity through networks and access to resources at scales above and below regional governance, and the legitimacy of urban planning and decision making as identified through the participatory processes. In addition, understanding the feedbacks between the ecosystem and urban decision making, is key in assessing the adaptive capacity of local and regional governance.

4.1. Scale

The components and processes that compose a midsize city represent a vast array of scales, both in size and time horizon (e.g., building life spans, gentrification and poverty cycles in neighborhoods, etc.). While the city itself may experience fluctuations in its desirability, so too do its component parts. Panarchy theory is a lens through which we can conceptualize these fluctuations occurring at different scales in a complex system [48,49]. For example, a single neighborhood in an urban system could experience fluctuations between high and low crime and unemployment rates without affecting the overall rates of the whole city. Alternatively, some combination of internal system dynamics and/or an external stressor could result in synchronous high crime and unemployment rates among a threshold plurality of neighborhoods. Then, the undesirable state of these small components scale up, putting larger scales, or the entire system, at risk of reorganizing into an undesirable state, even if other system components at other scales are desirable and resilient.
This contrasts with the more conventional view that posits top-down or external disturbances as the greatest threats to maintaining a desirable system state. In complex systems, both may occur, and the result of these cross-scale dynamics cannot be ignored in resilience assessments. Thus, the integrative approach to measuring system city resilience that we detail above is somewhat incomplete without a consideration of the state of each of the subsystems, their individual scales, and the potential for these components to scale up and affect collapse.

4.2. Identifying Undesirable States and Fostering Transformation

Midsize cities exist along a continuum of sustainability, crossing key thresholds into persistent, unsustainable states at some point along the spectrum. Management efforts should focus on enhancing the desirability of the current state, and ensuring that the desirable state is resilient and on the sustainable side of thresholds. However, some cities are in undesirable states. Here, we encounter a basic problem: for cities in undesirable states, how do we lessen the resilience of the current undesirable state, foster a transformation to a desirable state, and enhance the resilience of the desirable state when achieved? We wish to understand and identify indicators of a negative shift in resilience for midsize cities. Are there leading indicators that presage the loss of resilience in a city? If so, what are those leading indicators? Indicators currently identified in the literature include increasing variance in key parameters or processes, critical slowing, Fisher Information [50], spatial variance [51], and other variance indices. For cities that have shifted into an undesirable state, longitudinal data can be used to assess the potential to identify leading indicators of those regime changes post hoc. This is a critical research area in need of further development so that resilience assessments can be used as predictive—and not just descriptive—tools for sustainable urban planning and development.

5. Conclusions

In midsize cities, the major ecological, infrastructure, and social-economic subsystems have distinctive characteristics. They are also interdependent, influencing one another at multiple scales in ways that are often not apparent until closer examination. An integrative approach is therefore necessary for capturing properties that emerge from the complex interactions of these subsystems and their component parts. Here, we suggested such an approach, using Walker and Salt’s nine “properties of a resilient world” [13] to operationalize comparisons of midsize cities with similar cultural, demographic and geographic settings. From this, a visualization of comparative system resilience indicators emerges that allows us to ask how one midsize city can be on sustainable trajectory while a seemingly analogous city is on an unsustainable path. It also provides us with valuable insight into how we can use midsize cities’ flexibility and stability relative to their larger and smaller counterparts, respectively, to transform more of our urban areas into long-term, sustainable systems. From this, we can begin to avoid critical thresholds in order to preserve these valuable social-ecological systems so many of us call home.

Acknowledgments

The Nebraska Cooperative Fish and Wildlife Research Unit is jointly supported by a cooperative agreement between the United States Geological Survey, the Nebraska Game and Parks Commission, the University of Nebraska−Lincoln, the United States Fish and Wildlife Service, and the Wildlife Management Institute.

Author Contributions

Craig R. Allen, Shannon Bartlett-Hunt, Hannah E. Birge, Barbara A. Cosens, Ximing Cai, Igor Linkov, Elizabeth A. Scott, and Mark D. Solomon conceived the content and contributed to writing; Craig R. Allen, Rebecca A. Bevans, Hannah E. Birge, Jessica L. Burnett Barbara A. Cosens, Ahjond S. Garmestani, and Daniel R. Uden contributed to writing. Hannah E. Birge, Rebecca A. Bevans, and Daniel R. Uden contributed to the data analysis in the resilience assessment.

Conflicts of Interest

The authors declare no conflict of interest.

Appendix A

The following contains detail methods for the applied resilience assessment example and metric results used to construct the spider web diagram (Figure 6).

Appendix A.1. Demographic Information

With a population of 272,996, Lincoln, Nebraska (NE) is larger than the Springfield, Illinois (IL) population of 116,809 (US Census, 2015). However, relative to the U.S. national population percent change of +3.3%, Springfield is growing at a rate of 0.4%, while Lincoln is growing at a rate of 5.6%. The state government is the largest employer in both cities, and the unemployment rate in Lincoln is lower than that of Springfield (2.1% and 4.6%; US Census 2014). In 2013, Lincoln reported a gross domestic product (GDP) change of +2.6%, while Springfield’s GDP was −0.8% (US Department of Commerce, 2014). Nebraska’s overall GDP was also larger, at 15,482 millions of (2009) dollars, versus Springfield 8714 (US Department of Commerce, 2014). Lincoln, Nebraska is experiencing economic and population growth, relative to Springfield, IL.

Appendix A.2. Biodiversity

We calculated Shannon-Weiner diversity of land cover using FRAGSTATS within the city limits, and within 50 km and 100 km buffers around Lincoln and Springfield (Table 2, Figure 6). This diversity index encompasses both the amount and evenness of cover types in the system. By using percent cover of both the city limits, and a buffer around the city, we attempted to reduce the effects of city size on our biological diversity calculation (area of land within city limits of Lincoln and Springfield are 237.68 km2 and 170 km2, respectively). This index is contingent of the number of types present, so there is no absolute range from which to compare all mid-sized cities; this is a range unique to our analysis and should not be used for comparisons to cities in different settings. The Shannon-Weiner index of cover types is lower in Lincoln city limits relative to Springfield; however Lincoln’s surrounding environment is much more diverse at the 50 km buffer and slightly more diverse at the 100 km buffer. We expect with greater area (the city limits, 50 km, and then 100 km beltways contain progressively higher amounts of cover) to have similarly increasing Shannon’s diversity. However, agricultural land cover dominated both Lincoln and Springfield 50 km and 100 km buffers, a phenomenon captured by relatively low increases in evenness scores (0.47 and 0.48 in Lincoln, and 0.30 and 0.45 in Springfield) at increasing scales. Diversity scores within city limits were 0.533 and 0.6267 for Lincoln and Springfield, respectively. This resulted in a resilience axis biodiversity score of 3.5 for Lincoln, and 3 for Springfield.

Appendix A.3. Variability

We calculated riverine wetlands within a 10 km buffer along a 50 km length of Salt Creek (Lincoln) and Sangamon River (Springfield), with the middle of the transect at the closest distance from city center. Both are small, somewhat channelized streams that run partly through the city limits, and are roughly analogous to one another. The length and upstream and downstream sections were chosen to acknowledge the importance of upstream and downstream effects of wetlands on flooding events in the city itself. Salt Creek (Lincoln) had a total of 331 riverine wetland patches along the study length, while Springfield similarly had 327 patches. However, these patches differed considerably in size. The mean patch area of Salt Creek riverine wetlands is 2.75 m2 versus 6.09 m2 for along the Sangamon River. The total area of Sangamon’s riverine wetlands along the study length was 1992.78 m2, more than twice the area of Salt Creek’s 909 m2. This resulted in resilience axis scores of 3 for Lincoln and 4 for Springfield.

Appendix A.4. Modularity

To operationalize modularity, we use current employment numbers to calculate the relative share of workers employed by the top ten employers in the city. Within those employed by the top ten employers, we then examined the majority of workers the top firm employed relative to those in the 2nd through 10th slots. Both (1) a disproportionate share of all employable city residents employed by the top employers cumulatively, and (2) single or few top ten employers responsible for a large plurality/majority of employment of those working for a top ten firm would lead to low modularity score. Similarly, a lack of any strong employer (i.e., lack of connectedness) in a city would also lead to a low modularity score. Ideally, the top ten employers in a city would employ a large number of workers, with no one employer responsible for a large plurality or majority. This would ensure that the loss of any top firm would not lead to a loss of economic and emotional well-being in city residents relative to the loss of another firm in the city. A handful of large firms also ensure that, if smaller businesses fail, there is adequate opportunity for employment.
Lincoln and Springfield have a similar absolute number of residents employed by their top ten employers, at approximately 40,000 and 36,000, respectively (Table 3.). However, Springfield has a smaller population overall, and thus a top ten employer employs a much higher proportion of its overall population. Sixty-five percent of Springfield’s 116,365 residents are active in the workforce, of which nearly half rely on one of the top ten employers, and a quarter are employed by the State of Illinois. Of those employees working for a top ten employer, nearly half work for the State of Illinois. The next largest employer in the city, Memorial Hospital, employs a much smaller fraction of the overall populace. In other words, employment in Springfield could be negatively affected by the loss or decline of employment by the State of Illinois, with no other major player available to absorb employees. However, this is also conditional on the resilience of the institution itself, an assessment that is beyond the scope of this study. Workforce in Lincoln is comprised of 71.8% of its 272,996 population. Top ten employers in the city employ 20% of the total workforce, and the top employer (the State of Nebraska) only employs 5% of Lincoln residents. It is important to note that using this approach specifically to measure modularity is not a perfect fit, but rather an indicator. For example, if the university of Nebraska-Lincoln closed and all employees lost their jobs, a professor in the history department may not find their skills as transferable to the St. Elizabeth Regional Medical Center as a University administrator, and vice versa. This is simply a measure of shock the system will sustain should a single, highly connected economic component fails or experience damage. The resilience scores of this assessment are 4 for Lincoln and 2 for Springfield.

Appendix A.5. Slow Variables

Springfield has a city-wide land-use plan written in 2000, projected to 2020 [52] as part of a county-wide strategic plan [53], finished in 2014 and projected out to 2030. These are described as working documents, and the city land use plan has been amended multiple times between 2001 and 2007 [52,53]. Both address the major issues of urban sprawl, haphazard development, and lack of unification amongst developing areas that lead to losses of valuable natural resources, including open spaces, croplands, parks, and natural buffer zones. The county planning document was developed in association with twenty regional municipalities and highlights a “vital growth” cycle of intentional growth, resource preservation, collaborative vision, and capacity building that will enable the region to grow sustainably over the long term. They denote specific implementation strategies to address the main issues of transportation, land use patterns, unincorporated developing areas, agriculture, and declining open space networks that are recognized as long-term trends in the region that must be addressed through a comprehensive planning document. The plan acknowledges changes to the region that have the capacity to create major system shifts, but the relatively short temporal scale of the document (only sixteen years) makes it less effective at incorporating more slowly changing variables including demographic shifts or climate change, giving Springfield a resilience score of 2.
The city of Lincoln developed a city-county planning document in 2010 that projects to the year 2040 and includes a regional transportation plan. The document is updated every ten years, and the transportation plan updated every five. In their document, the planning commission acknowledges the “interconnectedness of economic, environmental, and socio-cultural domains,” and explicitly states some of the key long-term variables that may affect its viability in the future, including continued growth rates of 10% or more, climate change and increased variability in weather patterns, energy and food production, and advances in technology affecting strategic decisions [54]. The city notes specifically that a 30-year time projection cannot sufficiently incorporate these variables, and offers vision statements for the future of the city beyond 2040, with 2040 merely being a conceivable stepping-stone towards the long-term goal. By developing vision statements, noting specific long-term variables affecting city sustainability, and planning growth strategies mindful of the longer-term nature of the city’s life, Lincoln attempts to craft a living document that will guide the city beyond the 30-year span of its scope.
Lincoln’s slightly longer time projection for their plan and inclusion of specific revision cycles allow the document to be both broad in scope and flexible in strategy, which may enable it to better address long-term trends affecting the city’s sustainability. The overall time-scale of the planning documents for both cities is still on the scale of a few decades, which may fail to incorporate truly slow variables and render either city’s strategy unmanageable. Therefore, we also give Lincoln a resilience score of 2 in the acknowledgment of slow variables.

Appendix A.6. Tight Feedbacks

Drinking water in Lincoln is monitored by the city water utility (Lincoln Water Service) and results of testing are published yearly on the city’s website (Lincoln.ne.gov). Additional data regarding ground and surface water quality are gathered by the USGS, the Nebraska Natural Resource Districts, and the Nebraska Department of Environmental Quality, each of which publishes data on their respective websites. Springfield also follows US Environmental Protection Agency guidelines for water quality testing and publishes a yearly report on contaminants found in the drinking water. Additional data regarding surface and ground water quality are gathered and published by the Illinois EPA on their website. Lincoln holds weekly city council meetings where citizens are encouraged to bring up water quality concerns, and Springfield holds bi-weekly meetings. Both cities offer hotlines for concerned citizens to call regarding water quality questions, and offer programs to educate citizens about sources of contaminants (e.g., agricultural runoff, a major source of pollutants for both cities), leaching from mineral deposits). Both cities maintain the infrastructure and communication portals necessary to encourage citizen involvement and incorporate new information into their planning; however, the efficacy with which this information is utilized is not immediately clear and likely would not become apparent unless a major disruption in services occurs. Therefore, both cities receive a resilience score of 3.5 in their ability to maintain tight feedbacks.

Appendix A.7. Social Capital

Economic well-being is a major contributor to social well-being. However, we used gross domestic product (GDP) growth rate in part to select the cities Lincoln and Springfield for our comparison. As a result, we will only use two small aspects of total GDP—(1) education services, health care, and social assistance; and (2) arts, entertainment, recreation, accommodation and food service—to derive a social capital resilience score. These aspects of GDP reflect a measure of well-being that can be used to compare the two cities. Lincoln’s percent GDP growth in the education, health and social assistance was 0.21%. For arts, entertainment and recreation is 0.17%. Springfield’s growth was not disclosed for education, health care, and social assistance. Springfield’s percent GDP contribution of arts, entertainment, recreation, accommodation and food services was 0.04% [55]. Lincoln also has higher job growth (1.6% versus Springfield 0.8% in 2014), and lower unemployment (2.3% versus Springfield 5.6% in 2015). In all, the cities appear very closely matched in most of the measures of social capital we chose. They both lack fatal violence as a result of police-citizen interactions, and share similar business attractiveness rankings from Forbes. Springfield has slightly higher crime rates, a lower contribution of GDP growth from the entertainment and arts sector, and ranked lower on most quality of life indicators. Overall, we give Springfield a social capital resilience score of 3, and Lincoln a score of 4.

Appendix A.8. Innovation

Here, we measure the innovation of the cities by examining the proportion of woman, minority, and veteran business owners relative to their proportions in the overall population [56], average education level obtained, and the amount of high-tech jobs in each city. We assume that when a commensurate proportion of these typically underrepresented groups own businesses, it represents social mobility, and the ability of all citizens to contribute equitably to governance and city-wide problem solving. Our analysis reveals high underrepresentation of female and especially minority business ownership in Lincoln and Springfield (Table A1). Our finding of slight overrepresentation of veteran business owners is potentially attributable to men comprising the majority of both the US Military (84%; [56,57]) and business owners in Lincoln and Springfield.
We used Forbes and US Census data [58,59,60] to compare the percent of the population with high school, college, and graduate degrees, with the assumption that specialized knowledge aids in collaborative problem solving of complex ideas that require expert knowledge. Springfield has 92.3% high school attainment, 34% college attainment, and 13.2% of the population holding graduate degrees [60]. Lincoln values are nearly identical, with 93.1% high school attainment, 36.3% college attainment, and 12.6% of the population holding graduate degrees. High-tech employment is roughly twice as high in Lincoln (3% versus Springfield, IL’s 1.6%), increasing the innovation potential and potentially attracting more innovators to the system.
Lincoln and Springfield have nearly identically skewed representation in business ownership, and the proportion of citizens attending high school, college, and post-graduate institutions are also very similar. As a result, Lincoln receives a resilience innovation score of 3.5, and Springfield a sore of 3. Lincoln leads by 0.5 points due only to greater opportunities in the high tech sector.
Table A1. Percent of Lincoln, NE, USA, and Springfield, IL, USA, businesses owned by women, minority and veteran residents relative to their representation in the overall city population. A representation of 100% of business ownership is an index of proportionate representation of women, minority, or veteran business owners relative to their proportions in the general population. Less than 100% translates to underrepresentation in business ownership.
Lincoln, NE, USASpringfield, IL, USA
% of Business Owners% of Population% Representation of Business Ownership% of Business Owners% of Population% Representation of Business Ownership
Women38.2650.0076.5238.9052.873.68
Minorities7.4714.0053.3214.2524.258.88
Veterans10.806.40168.6211.987.63156.98

Appendix A.9. Overlap in Governance

We analyzed the official city disaster response plans of Lincoln and Springfield to determine whether each city’s post-disturbance services are resilient to the loss of one or more institutions that provide those services. The disaster response plan for Lincoln includes response protocols for pandemic disease outbreaks, severe weather, suspicious packages, domestic response to terrorism, and shelter-in-place emergencies. The plan also designates a unique agency, the Lincoln-Lancaster County Emergency Management Agency, to coordinate emergency response operations. Emergency management headquarters has a separate power, air, and water supply to ensure continued operations in the face of major losses to public utilities. During normal operations the agency coordinates and trains businesses, hospitals, and Community Emergency Response Teams (CERTs), maintains alert systems, and educates the public. During emergencies the agency coordinates county, city, and private agencies, as well as volunteers and groups with CERTs training. Because the emergency response program includes multiple organizations at both local and federal (i.e., Federal Emergency Management Agency) all U.S. cities can coordinate beyond their local scales to perform similar functions in a disaster situation (including relatively independent groups who may operate independently even if the coordinating agency is unavailable).
Springfield has an emergency response plan coordinated by the city’s Office of Emergency Management. This response plan covers a much broader list of potential disaster situations, including resource management, legal procedures, and fiscal management during disasters, evacuation, weapons of mass destruction, public health emergencies, search and rescue operations, and welfare, among others. Vulnerability assessments for an exhaustive list of known hazards were completed in 2008, and actors responsible for each emergency response function in the case of a disaster are named and contact information listed. Multiple layers of actors and response teams are embedded within the responsibility matrix, so if a single actor is unavailable others may take their place. The response plan is highly organized and publicly accessible. The Springfield-Sangamon County Office of Emergency Management also maintains volunteer emergency response teams, the Sangamon County Rescue Squad, with weekly trainings at various locations across the county. Due to the structured nature of Springfield’s disaster response plan, a clear framework of responsibilities can be assumed by a number of different persons or agencies under various contingencies. As a result, we give Springfield a score of 5 and Lincoln a score of 4 for overlapping governance because the latter does not quite capture the latitude of potential disasters Springfield contemplates.

Appendix A.10. Ecosystem Services

To measure ecosystem services from the landscape surround the midsize city, we analyzed agricultural and mining lands, green spaces, proximity to open access hunting areas and water for fishing, and amount of wetland cover. To do this, we included biological diversity [61] scores from above, to analyze the relative cover of agricultural lands (rowcrop agriculture, orchards, etc.), mining, and wetlands, both within city limits, and within a 50 km buffer. While grasslands and forests provide key ecosystem services, wetlands provide disproportionate flow of ecosystem services per unit area than many other ecosystem types [62]. We also included agricultural and mining land cover in our analysis, as an indicator of agroecosystem and mining ecosystem service production. Lincoln has 125 city parks, half of which are located within city blocks and neighborhoods [63]. The city’s parks comprise over 6000 acres, seven recreation centers, nine public pools and over 130 miles of maintained recreation trails. Throughout these areas are over 60 pieces of public art. Springfield encompasses a smaller area, but the Springfield Park District includes the greater metropolitan area in its jurisdiction. It has 43 parks totaling an area of 2500 acres, 13 miles of multiuse trails, a pool, and four golf courses [64].
An analysis of hunting and fishing access show that Lincoln and Springfield vary drastically, but this could be attributable to different cultural value systems driving demand for hunting and fishing, so we omitted this analysis, rather than skew the resilience score in favor of Lincoln due to factors that might not alter resilience. This results in an ecosystem services resilience score of 4 for Lincoln and 3.5 for Springfield.

References

  1. US Census Bureau American Fact Finder. 2014. Available online: http://factfinder.census.gov/faces/nav/jsf/pages/index.xhtml (accessed on 10 January 2016).
  2. Craig, R.K. ‘Stationarity is dead’ long live transformation: Five principles for climate adaptation law. Harv. Environ. Law Rev. 2010, 573, 9–74. [Google Scholar]
  3. Alfsen-Norodom, C.; Boehme, S.E.; Clemants, S.; Corry, M.; Imbruce, V.; Lane, B.D.; Miller, R.B.; Padoch, C.; Panero, M.; Peters, C.M.; et al. Managing the megacity for global sustainability: The New York metropolitan region as an urban biosphere reserve. Ann. N. Y. Acad. Sci. 2004, 1023, 125–141. [Google Scholar] [CrossRef] [PubMed]
  4. Gunderson, L.H.; Allen, C.R.; Holling, C.S. Foundations of Ecological Resilience; Island Press: New York, NY, USA, 2010. [Google Scholar]
  5. Pickett, S.T.A.; Cadenasso, M.L.; McGrath, B.P. (Eds.) Resilience in Ecology and Urban Design: Linking Theory and Practice for Sustainable Cities; Springer: New York, NY, USA, 2012.
  6. Birge, H.E.; Allen, C.R.; Garmestani, A.S.; Pope, K.L. Adaptive management for ecosystem services. J. Environ. Manag. 2016, in press. [Google Scholar] [CrossRef] [PubMed]
  7. Lake, P.S. Resistance, resilience and restoration. Ecol. Manag. Restor. 2013, 14, 20–24. [Google Scholar] [CrossRef]
  8. Carpenter, S.; Walker, B.; Anderies, J.M.; Abel, A. From Metaphor to Measurement: Resilience of What to What? Ecosystems 2004, 4, 765–781. [Google Scholar] [CrossRef]
  9. Lebel, L.; Anderies, J.M.; Campbell, B.; Folke, C.; Hatfield-Dodds, S.; Hughes, T.P.; Wilson, J. Governance and the capacity to manage resilience in regional social-ecological systems. Ecol. Soc. 2006, 11, 19. [Google Scholar]
  10. Clark, W.C.; Dickson, N.M. Sustainability science: The emerging research program. Proc Nat. Acad. Sci. USA 2003. [Google Scholar] [CrossRef] [PubMed]
  11. Turner, B.L.; Kasperson, R.E.; Matson, P.A.; McCarthy, J.J.; Corell, R.W.; Christensen, L.; Eckley, N.; Kasperson, J.X.; Luers, A.; Martello, M.L. A framework for vulnerability analysis in sustainability science. Proc. Nat. Acad. Sci. USA 2003, 100, 8074–8079. [Google Scholar] [CrossRef] [PubMed]
  12. Childers, D.L.; Pickett, S.T.A.; Grove, J.M.; Ogden, L.; Whitmer, A. Advancing urban sustainability theory and action: Challenges and opportunities. Landsc. Urban Plan. 2014, 125, 320–328. [Google Scholar] [CrossRef]
  13. Walker, B.; Salt, D. Resilience Thinking: Sustaining Ecosystems and People in a Changing World; Island Press: Washington, DC, USA, 2006. [Google Scholar]
  14. Linkov, I. Sustainable Cities and Military Installations; Springer: Amsterdam, The Netherlands, 2014. [Google Scholar]
  15. Fox-Lent, C.; Bates, M.; Linkov, I. A matrix approach to community resilience assessment: An illustrative case at rockaway peninsula. Environ. Syst. Dec. 2015, 35, 209–218. [Google Scholar] [CrossRef]
  16. Ganin, A.A.; Massaro, E.; Gutfrain, A.; Steen, N.; Keisler, J.M.; Kott, A.; Mangoubi, R.; Linkov, I. Operational resilience: Concepts, design and analysis. Sci. Rep. 2016, 6, 19540. [Google Scholar] [CrossRef] [PubMed]
  17. Chapin, F.S., III; Kofinas, G.P.; Folke, C. Principles of Ecosystem Stewardship: Resilience-Based Natural Resource Management in a Changing World; Springer: New York, NY, USA, 2009. [Google Scholar]
  18. Holling, C.S. Resilience and stability of ecological systems. Annu. Rev. Ecol. Syst. 1973, 4, 1–23. [Google Scholar] [CrossRef]
  19. Birgé, H.E.; Bevans, R.A.; Angeler, D.R.; Allen, C.R.; Baer, S.G.; Wall, D.H. Adaptive management for soil ecosystem services. J. Environ. Manag. 2016, in press. [Google Scholar]
  20. Perlack, R.D.; Wright, L.L.; Turhollow, A.F.; Graham, R.L.; Stokes, B.J.; Erbach, D.C. Biomass as a Feedstock for Bioenergy and Bioproducts Industry: The Technical Feasibility of a Billion-Ton Annual Supply; Technical Report; Oak Ridge National Laboratory: Oak Ridge, TN, USA, 2005.
  21. Housh, M.; Cai, X.; Ng, T.L.; McIsaac, G.; Ouyang, Y.; Khanna, M.; Sivapalan, M.; Jain, A.; Eckhooff, S.; Gasteyer, S.; et al. System of systems model for biofuel development analysis of Infrastructure Systems. J. Infrastruct. Syst. 2014. [Google Scholar] [CrossRef]
  22. Rigole, T.; Vanthournout, K.; Deconinck, G. Interdependencies between an electric power infrastructure with distributed control, and the underlying ICT infrastructure. In Proceedings of the International Workshop on Complex Network and Infrastructure Protection, Rome, Italy, 28–29 March 2006; pp. 428–440.
  23. Pötz, H.; Bluezé, P. Urban Green-Blue Grids for Sustainable and Dynamic Cities; Coop for Life: Delft, The Netherlands, 2012. [Google Scholar]
  24. Jacquet, J.B. Review of risks to communities from shale energy development. Environ. Sci. Technol. 2014, 48, 8321–8333. [Google Scholar] [CrossRef] [PubMed]
  25. Magis, K. Community Resilience: An Indicator of Social Sustainability. Soc. Nat. Resour. 2010, 23, 401–416. [Google Scholar] [CrossRef]
  26. Wondolleck, J.M.; Yaffee, S.L. Making Collaboration Work: Lessons from Innovation in Natural Resource Management; Island Press: Washington, DC, USA, 2000. [Google Scholar]
  27. Rogers, P.; Hall, A.W. Effective Water Governance; TEC Background Papers; Elanders Novum: Stockholm, Sweden, 2003. [Google Scholar]
  28. Healey, P. Transforming governance: Challenges of institutional adaptation and a new politics of space. Eur. Plan Stud. 2006, 14, 299–320. [Google Scholar] [CrossRef]
  29. Huitema, D.; Mostert, E.; Egas, W.; Moellenkamp, S.; Pahl-Wostl, C.; Yalcin, R. Adaptive water governance: Assessing the institutional prescriptions of adaptive (co-)management from a governance perspective and defining a research agenda. Ecol. Soc. 2009, 14, 26–45. [Google Scholar]
  30. United Nations Task Team. 2012. Available online: http://www.un.org/en/development/desa/policy/untaskteam_undf/ (accessed on 21 January 2016).
  31. Swaffield, S.R.; Primdahl, J.; Hoversten, M. Discursive relationships between landscape science, policy and practice: Concepts, issues and examples. In Landscape Ecology for Sustainable Environment and Culture; Jones, B., Fu, B., Eds.; Springer: Dordrecht, The Netherlands, 2013; pp. 225–248. [Google Scholar]
  32. Rijke, J.; Farrelly, M.; Brown, R.; Zevenbergen, C. Configuring transformative governance to enhance resilient urban water systems. Environ. Sci. Policy 2013, 25, 62–72. [Google Scholar] [CrossRef]
  33. Ostrom, E. Governing the Commons; Cambridge University Press: Cambridge, UK, 1990. [Google Scholar]
  34. Dietz, T.; Ostrom, E.; Stern, P.C. The struggle to govern the commons. Science 2003, 302, 1907–1912. [Google Scholar] [CrossRef] [PubMed]
  35. Folke, C.; Hahn, T.; Olsson, P.; Norberg, J. Adaptive governance of social-ecological systems. Annu. Rev. Environ. Resour. 2005, 30, 441–473. [Google Scholar] [CrossRef]
  36. Chaffin, B.C.; Gosnell, H.; Cosens, B.A. A decade of adaptive governance scholarship: synthesis and future directions. Ecol. Soc. 2014, 19, 56. [Google Scholar] [CrossRef]
  37. Delmas, M.A.; Young, O.R. Governance for the Environment: New Perspectives; Cambridge University Press: Cambridge, UK, 2009. [Google Scholar]
  38. Lockwood, M.; Davidson, J.; Curtis, A.; Stratford, E.; Griffith, R. Governance principles for natural resource management. Soc. Nat. Resour. 2010, 23, 986–1001. [Google Scholar] [CrossRef]
  39. Cosens, B.; Gunderson, L. Social-ecological System Resilience, Climate Change, & Adaptive Water Governance: A Project Supported by the National Socio-Environmental Synthesis Center (SESYNC) under Funding from the National Science Foundation DBI-1052875, 2013–2016. Available online: http://www.sesync.org/project/water-people-ecosystems/adaptive-water-governance (accessed on 10 January 2016).
  40. Resilience Alliance. Assessing Resilience in Social-Ecological Systems: Workbook for Practitioners. Version 2.0. 2010. Available online: http://www.resalliance.org/3871.php (accessed on 2 January 2016).
  41. Walker, B.; Carpenter, S.; Anderies, J.; Abel, N.; Cumming, G.S.; Janssen, M.; Lebel, L.; Norberg, J.; Peterson, G.D.; Pritchard, R. Resilience management in social-ecological systems: A working hypothesis for a participatory approach. Conserv. Ecol. 2002, 6, 14. [Google Scholar]
  42. Berkes, F.; Folke, C. Linking Sociological and Ecological Systems: Management Practices and Social Mechanisms for Building Resilience; Cambridge University Press: Cambridge, UK, 1998. [Google Scholar]
  43. Elmqvist, T.; Folke, C.; Nyström, M.; Peterson, G.; Bengtsson, J.; Walker, B.; Norberg, J. Response Diversity, Ecosystem Change and Resilience. Front. Ecol. Environ. 2003, 1, 488–494. [Google Scholar] [CrossRef]
  44. Poff, N.L.; Allan, J.D.; Bain, M.B.; Karr, J.R.; Prestegaard, K.L.; Richter, B.D.; Sparks, R.E.; Stromberg, J.C. The Natural Flow Regime: A Paradigm for River Conservation and Restoration. BioScience 1997, 47, 769–784. [Google Scholar] [CrossRef]
  45. Smith, M. Emergency Declared over Flint’s Water. New York Times. 5 January 2016. Available online: http://www.nytimes.com/2016/01/06/us/michigan-emergency-declared-over-flints-water.html?_r=0 (accessed on 15 January 2016).
  46. Portes, A. Social capital: Its origins and applications in modern sociology. In Knowledge and Social Capital: Foundations and Applications; Lesser, E.L., Ed.; Elsevier: Oxford, UK, 2000; pp. 43–68. [Google Scholar]
  47. Cosens, B.; Gunderson, L.; Allen, C.R.; Benson, M.H. Identifying legal, ecological and governance obstacles, and opportunities for adapting to climate change. Sustainability 2014, 6, 2338–2356. [Google Scholar] [CrossRef]
  48. Gunderson, L.H.; Holling, C.S. Understanding Transformations in Human and Natural Systems; Panarchy: Washington, DC, USA, 2009. [Google Scholar]
  49. Allen, C.R.; Angeler, D.G.; Garmestani, A.S.; Gunderson, L.H.; Holling, C.S. Panarchy: Theory and application. Ecosystems 2014, 17, 578–589. [Google Scholar] [CrossRef]
  50. Spanbauer, T.L.; Allen, C.R.; Angeler, D.G.; Eason, T.; Fritz, S.C.; Garmestani, A.S.; Nash, K.L.; Stone, J.R. Prolonged Instability Prior to a Regime Shift. PLoS ONE 2014, 9. [Google Scholar] [CrossRef] [PubMed]
  51. Angeler, D.G.; Allen, C.R.; Uden, D.R.; Johnson, R.K. Spatial Scaling Patterns and Functional Redundancies in Changing Boreal Lake Landscape. Ecosystems 2015, 18, 889–902. [Google Scholar] [CrossRef]
  52. Springfield-Sangamon County Regional Planning Commission (SSCRPC). Regional Planning Commission. 2007. Available online: http://co.sangamon.il.us/departments/m-r/regional-planning-commission (accessed on 13 February 2016).
  53. Springfield-Sangamon County Regional Planning Commission (SSCRPC). Strategic & Comprehensive Planning. 2014. Available online: http://co.sangamon.il.us/departments/m-r/regional-planning-commission/program-areas/strategic-comprehensive-planning (accessed on 10 February 2016).
  54. Lincoln/Lancaster County Comprehensive Plan (Nebraska). 2011. Available online: https://lincoln.ne.gov/city/plan/ (accessed on 20 February 2016).
  55. United States Department of Commerce’s Bureau of Economic Analysis. 2014. Available online: https://www.bea.gov/newsreleases/regional/gdp_metro/2014/pdf/gdp_metro0914.pdf (accessed on 20 February 2016).
  56. United States Department of Defense. Demographics: Profile of the Military Community 2012. Available online: http://download.militaryonesource.mil/12038/MOS/Reports/2012_Demographics_Report.pdf (accessed on 20 February 2016).
  57. U.S. Census Bureau. 2011. Available online: http://www.census.gov/data/2011 (accessed on 20 February 2016).
  58. Forbes’ Best Places for Business and Careers, Lincoln, NE. 2015 Ranking. Available online: http://www.forbes.com/places/ne/lincoln/ (accessed on 25 February 2016).
  59. Forbes’ Best Places for Business and Careers, Springfield, IL. 2015 Ranking. Available online: http://www.forbes.com/places/il/Springfieldingfield/ (accessed on 25 February 2016).
  60. U.S. Census Bureau. 2007. Available online: http://www.census.gov/data/2007 (accessed on 20 February 2016).
  61. Worm, B.; Barbier, E.B.; Beaumont, N.; Duffy, J.E.; Folke, C.; Halpern, B.S.; Jackson, J.B.C.; Lotze1, H.L.; Micheli, F.; Palumbi, S.R.; et al. Impacts of Biodiversity Loss on Ocean Ecosystem Services. Science 2006, 314, 787–790. [Google Scholar] [CrossRef] [PubMed]
  62. Zedler, J.B.; Kercher, S. Wetland Resources: Status, Trends, Ecosystem Services, and Restorability. Annu. Rev. Environ. Resour. 2005, 30, 39–74. [Google Scholar] [CrossRef]
  63. Lincoln Parks & Recreation. 2016. Available online: http://lincoln.ne.gov/city/parks/ (accessed on 15 February 2016).
  64. Springfield Park District. 2016. Available online: http://www.springfieldparks.org/ (accessed on 15 February 2016).
Figure 1. Midsize cities are tightly coupled with their watersheds.
Sustainability 08 00844 g001
Figure 2. A conceptual diagram of the basins of attraction for two possible system states (or regimes). The position of the ball in the left basin of the upper diagram represents the current state of the system. One measures the resilience of the system as the amount of disturbance required to push the system from one basin of attraction to another (bottom diagram).
Sustainability 08 00844 g002
Figure 3. Estimating tradeoffs among sub-systems is often difficult, and should be carefully considered. Resilience of what, to what, and for whom should be determined prior to estimation.
Sustainability 08 00844 g003
Figure 4. Interdependence of infrastructures and interactions with the society and environment.
Sustainability 08 00844 g004
Figure 5. Raster maps of Lincoln, NE (panels a, c) and Springfield, IL (panels b, d). The diversity of land cover in and around the cities are shown in panels a and b, with water, shrublands, wetlands, grasslands, forested lands, and all other classes (developed, barren and all agricultural lands) in grey scale. The city limits are shown in black, with 50 km and 100 km buffers around the city in white. In Panels c and d, riverine wetlands are indicated by the grey areas within the buffered white space surrounding Salt Creek (Lincoln, NE, USA) and Sangamon River (Springfield, IL, USA). Data source: USGS Land Cover Institute (LCI).
Sustainability 08 00844 g005
Figure 6. A spider web diagram illustrating the relative system resilience of Lincoln, Nebraska, USA, and Springfield, Illinois, USA, according to the nine attributes of resilience from Walker and Salt [13] (represented by the axes): biological diversity, ecological variability modularity, acknowledgement of slow variables, tight feedbacks, social capital, innovation, overlap in governance, and ecosystem services. Values used to generate the figure are reported in the Appendix A.
Sustainability 08 00844 g006
Table 1. The nine properties of a resilient system according to Walker and Salt [13], along with definitions, and possible assessment metrics for a midsize city social-ecological system.
PropertyDefinitionAssessment Metrics
Biological DiversityThe number and evenness of species, functional groups, and response to disturbance in the ecosystemDiversity of native land covers, and rate land use change within city limits and around the city
Ecological VariabilityNatural variability and fluctuations in ecological processes, structures, and populationsPresence of wetlands, which may indicate flood repression
ModularitySystem components are connected to one another so that information is transferred effectively, but not so overly connected that shocks cause disproportionate damageThe degree to which the damage/loss of a single institution affects the city
Acknowledging Slow VariablesIncorporation of information about long-term outcomes that result from near-term decision makingUse of long-term time horizons in city planning; acknowledgement of system-specific slow variables in these plans
Tight FeedbacksFeedbacks among critical system components respond quickly, allowing practitioners to avoid dangerous thresholdsInfrastructure and planning that ensures essential services, like water quality, is continuously maintained
Social CapitalThe net sum of benefits generated from relationships among components in a system’s social networkUnemployment rate, poverty levels, voter participation, public servant approval ratings
InnovationDegree of learning, experimentation, education, and locally developed rules in order to embrace change and creatively improve conditionsWhat proportion of the economy is due to new technology; ethnic, racial and gender diversity in business ownership and governance
Overlap in GovernanceInstitutions have redundancy in their roles and responsibilitiesMultiple institutions are authorized to provide essential services in the case of natural and human disasters
Ecosystem ServicesEssential and nonessential benefits people obtain from ecosystemsAccessibility to local agricultural lands, hunting and fishing, green spaces, wetlands
Table 2. Demographic and economic data for Lincoln, Nebraska and Springfield, Illinois, USA, according to 2014 U.S. Census data.
VariableLincoln, NE, USASpringfield, IL, USANational
Population272,996116,809318,900,000
Population Annual % Change5.60%0.40%3.30%
Unemployment Rate2.10%4.60%6.2%
Gross Domestic Product (millions of USD)15,482871417.914 × 1012
Gross Domestic Product Annual % Change2.60%−0.80%2.40%
Table 3. The top ten employers in Lincoln, NE, USA, and Springfield, IL, USA (“Top Ten Employer”), the number of workers they employ (“# Employees”), and the percent of the workers employed by a top ten employer that the company employs (“% of Workers Employed”. Data presented is only based on workers employed by a top ten employer.
Lincoln, NE, USASpringfield, IL, USA
Top Ten Employer# Employees% of Workers EmployedTop Ten Employer# Employees% of Workers Employed
State of Nebraska898822.54State of Illinois17,50048.77
Lincoln Public Schools797520.00Memorial Hospital443312.35
University of Nebraska-Lincoln617915.50St. John’s Hospital30738.56
Bryan Health37969.52Springfield Public Schools21896.10
US Government32068.04Springfield Clinic19535.44
City of Lincoln25896.49City of Springfield15104.21
St. Elizabeth Regional Medical Center23505.89Southern Illinois University School of Medicine14854.14
Burlington Northern Railroad20005.02University of Illinois at Springfield14354.00
Madonna Rehabilitation Hospital14003.51BlueCross BlueShield12563.50
B&R Stores13913.49Horace Mann10502.93
Total # Employed by a Top 10 Employer39,874-Total # Employed by a Top 10 Employer35,884--

