
A MODIS-Based Retrieval Model of Suspended Particulate Matter Concentration for the Two Largest Freshwater Lakes in China


Abstract
:1. Introduction
2. Methods
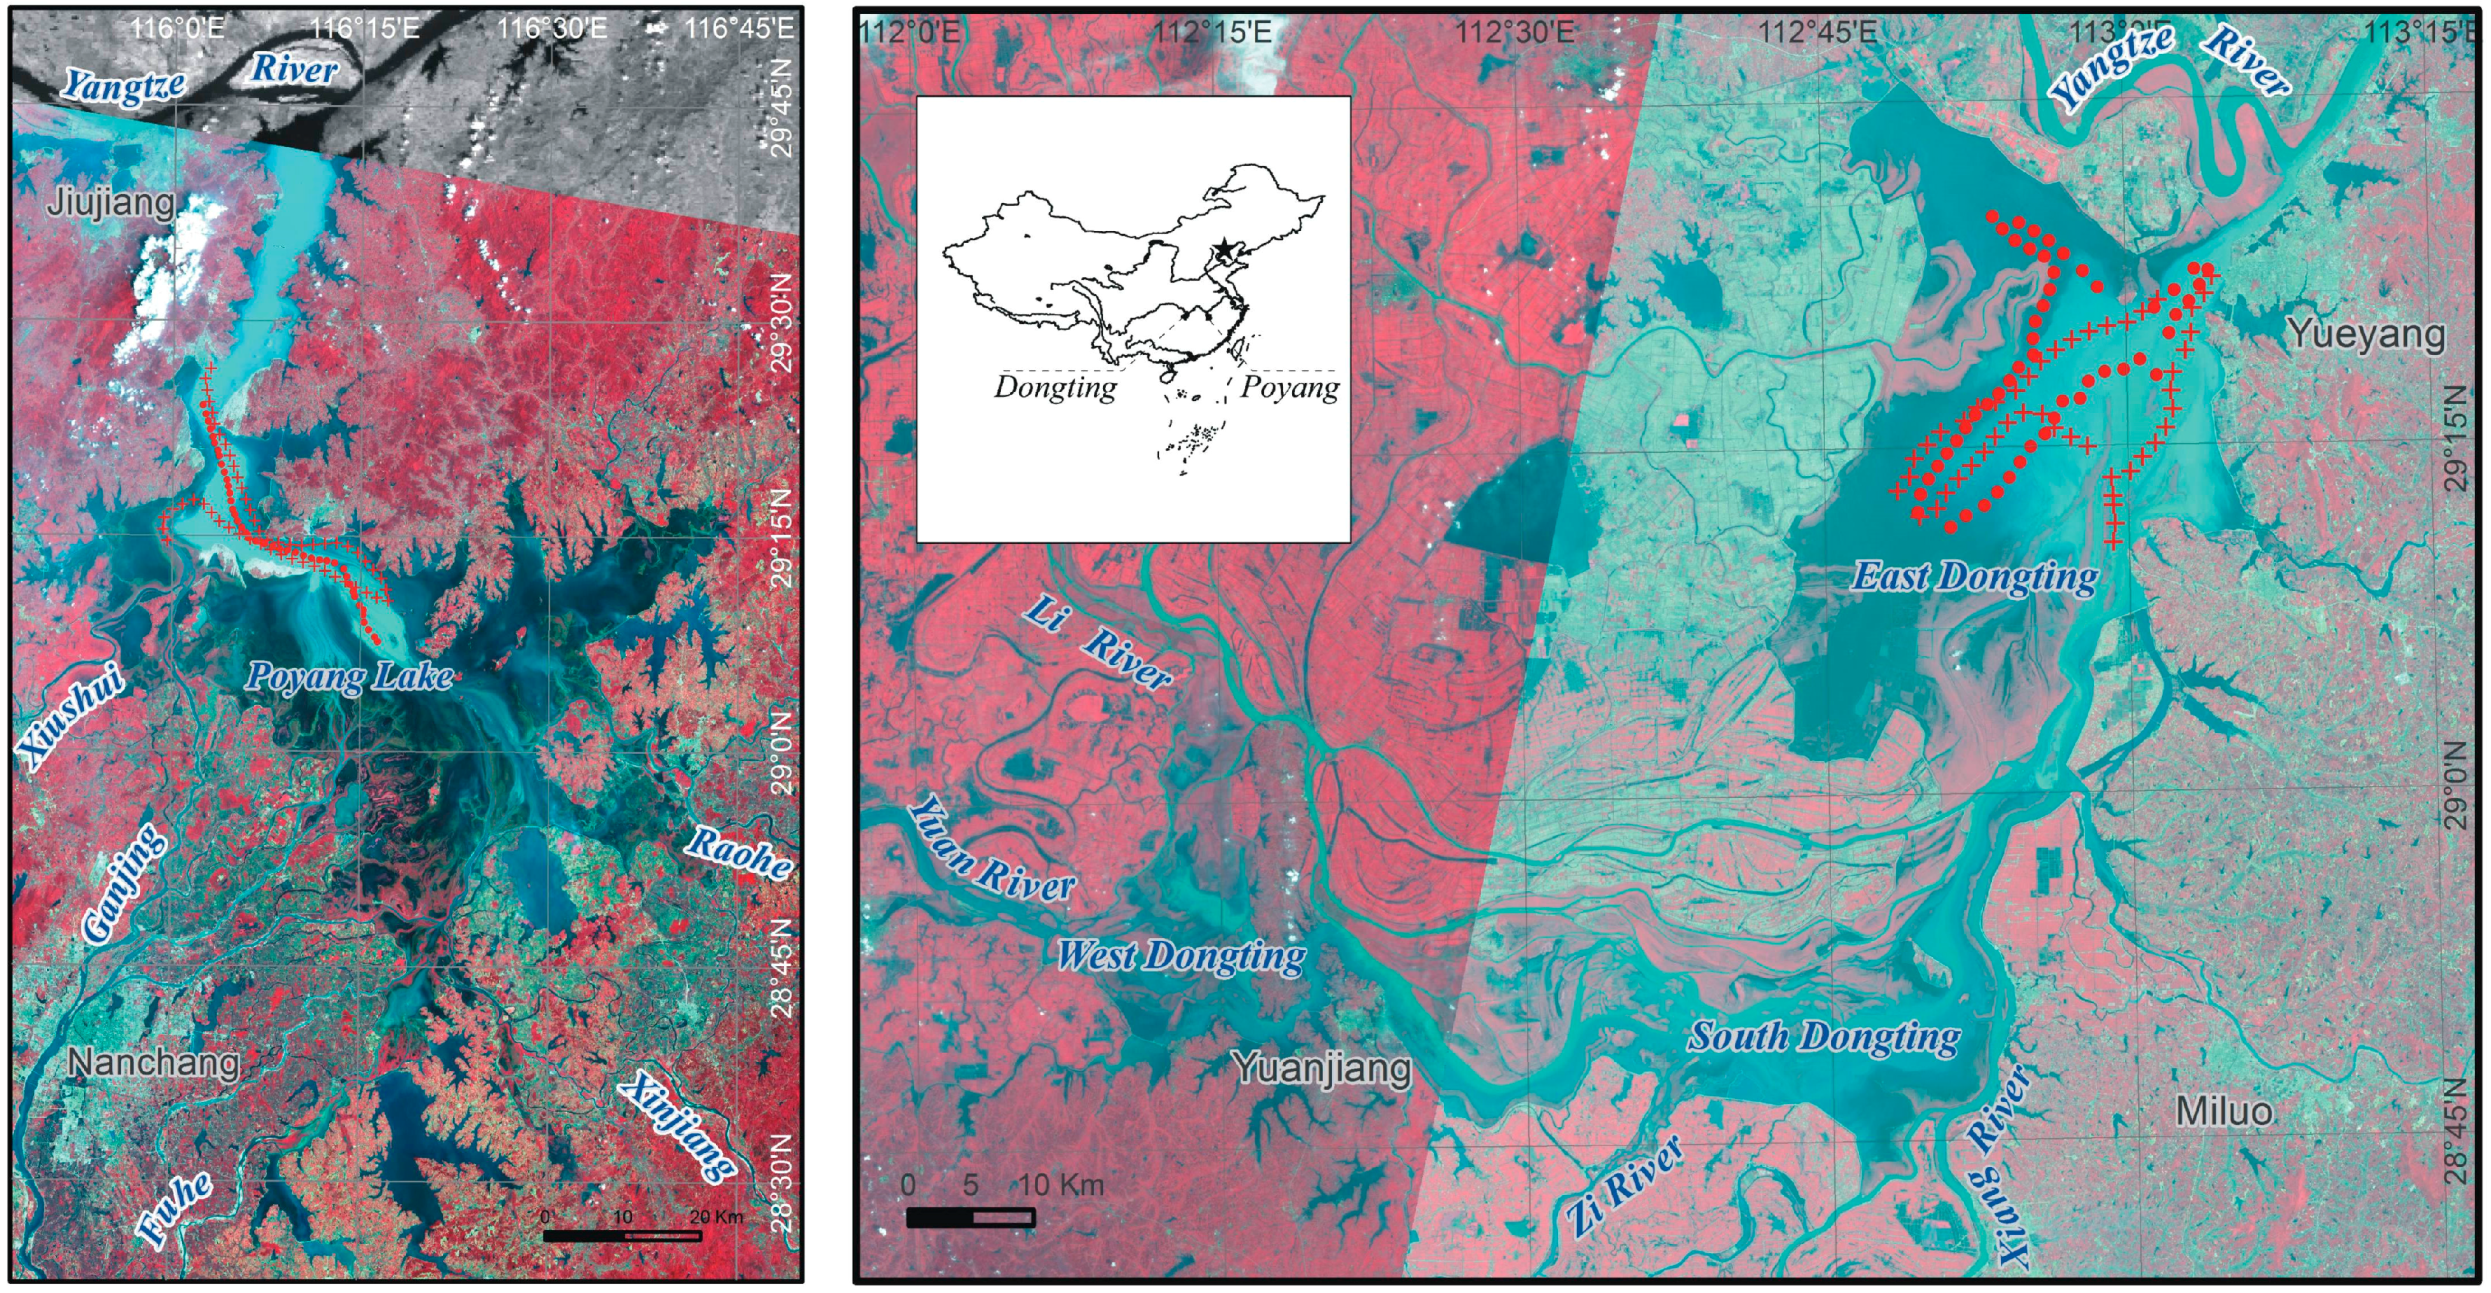
2.1. Study Area
2.2. Fieldwork and CSPM Measurement
2.3. Image Acquisition and Pre-Processing
2.4. Model Development
2.5. Model Application
3. Results
3.1. CSPM Measurement
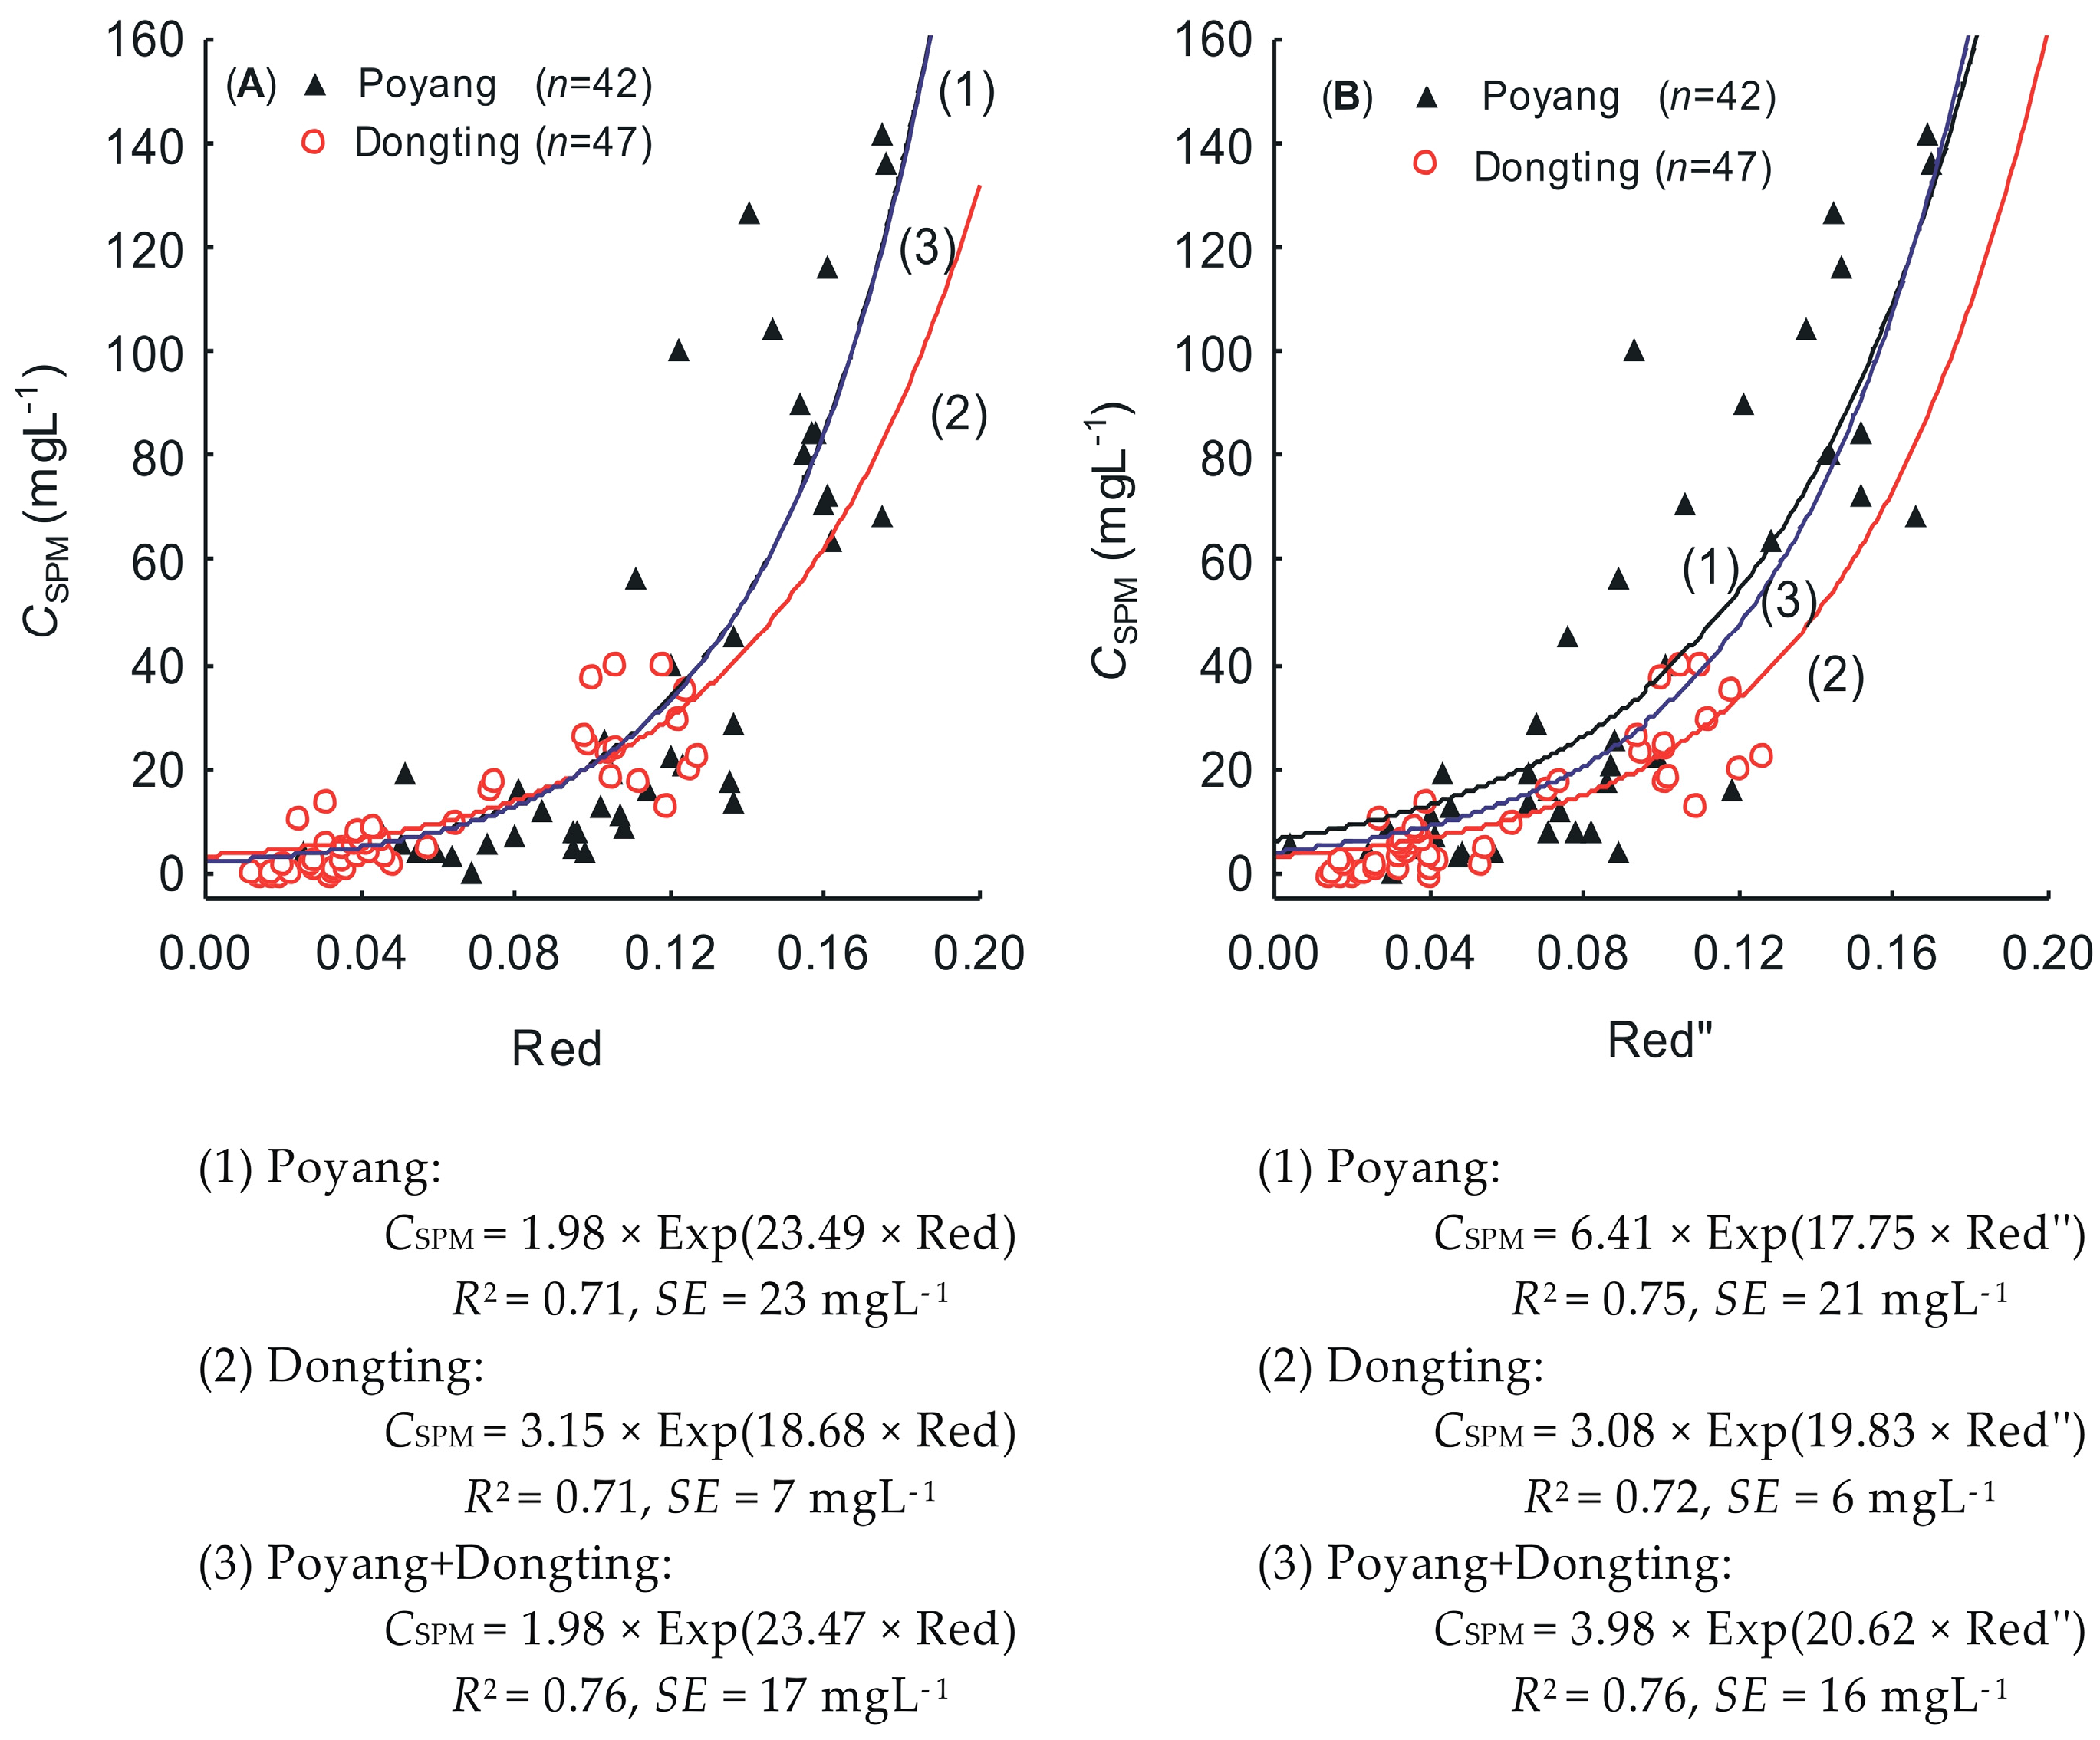
3.2. Model Development
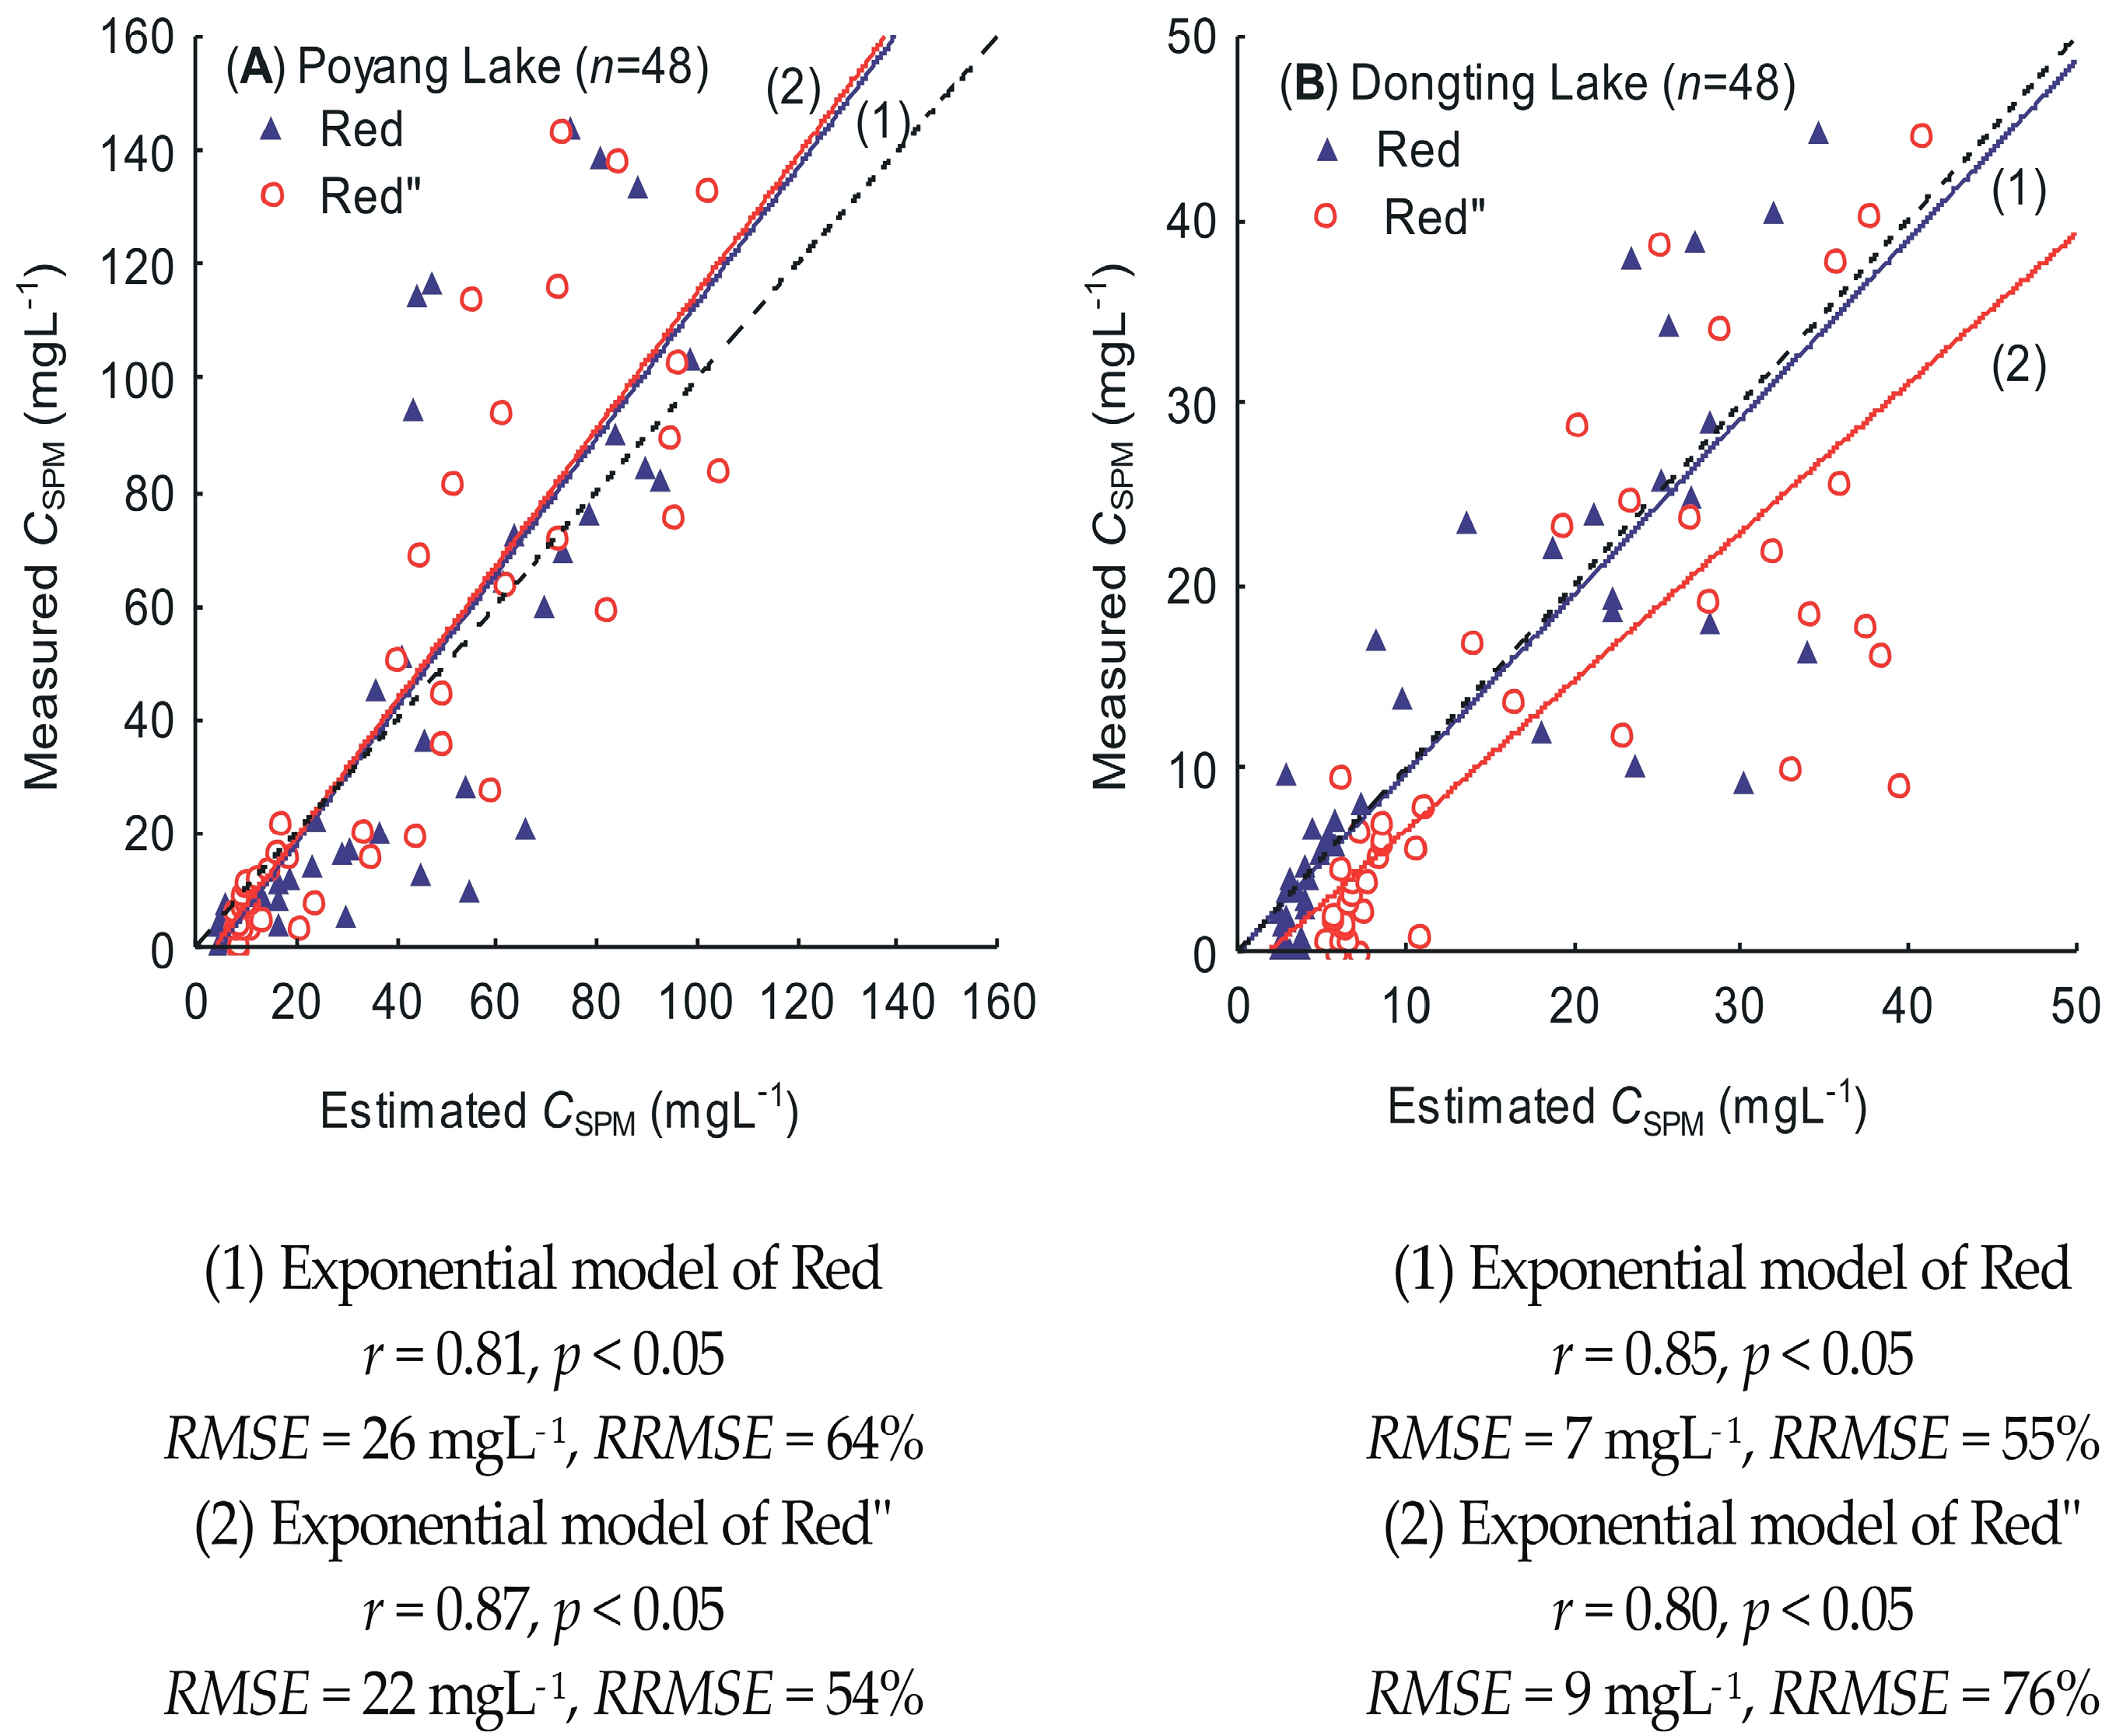
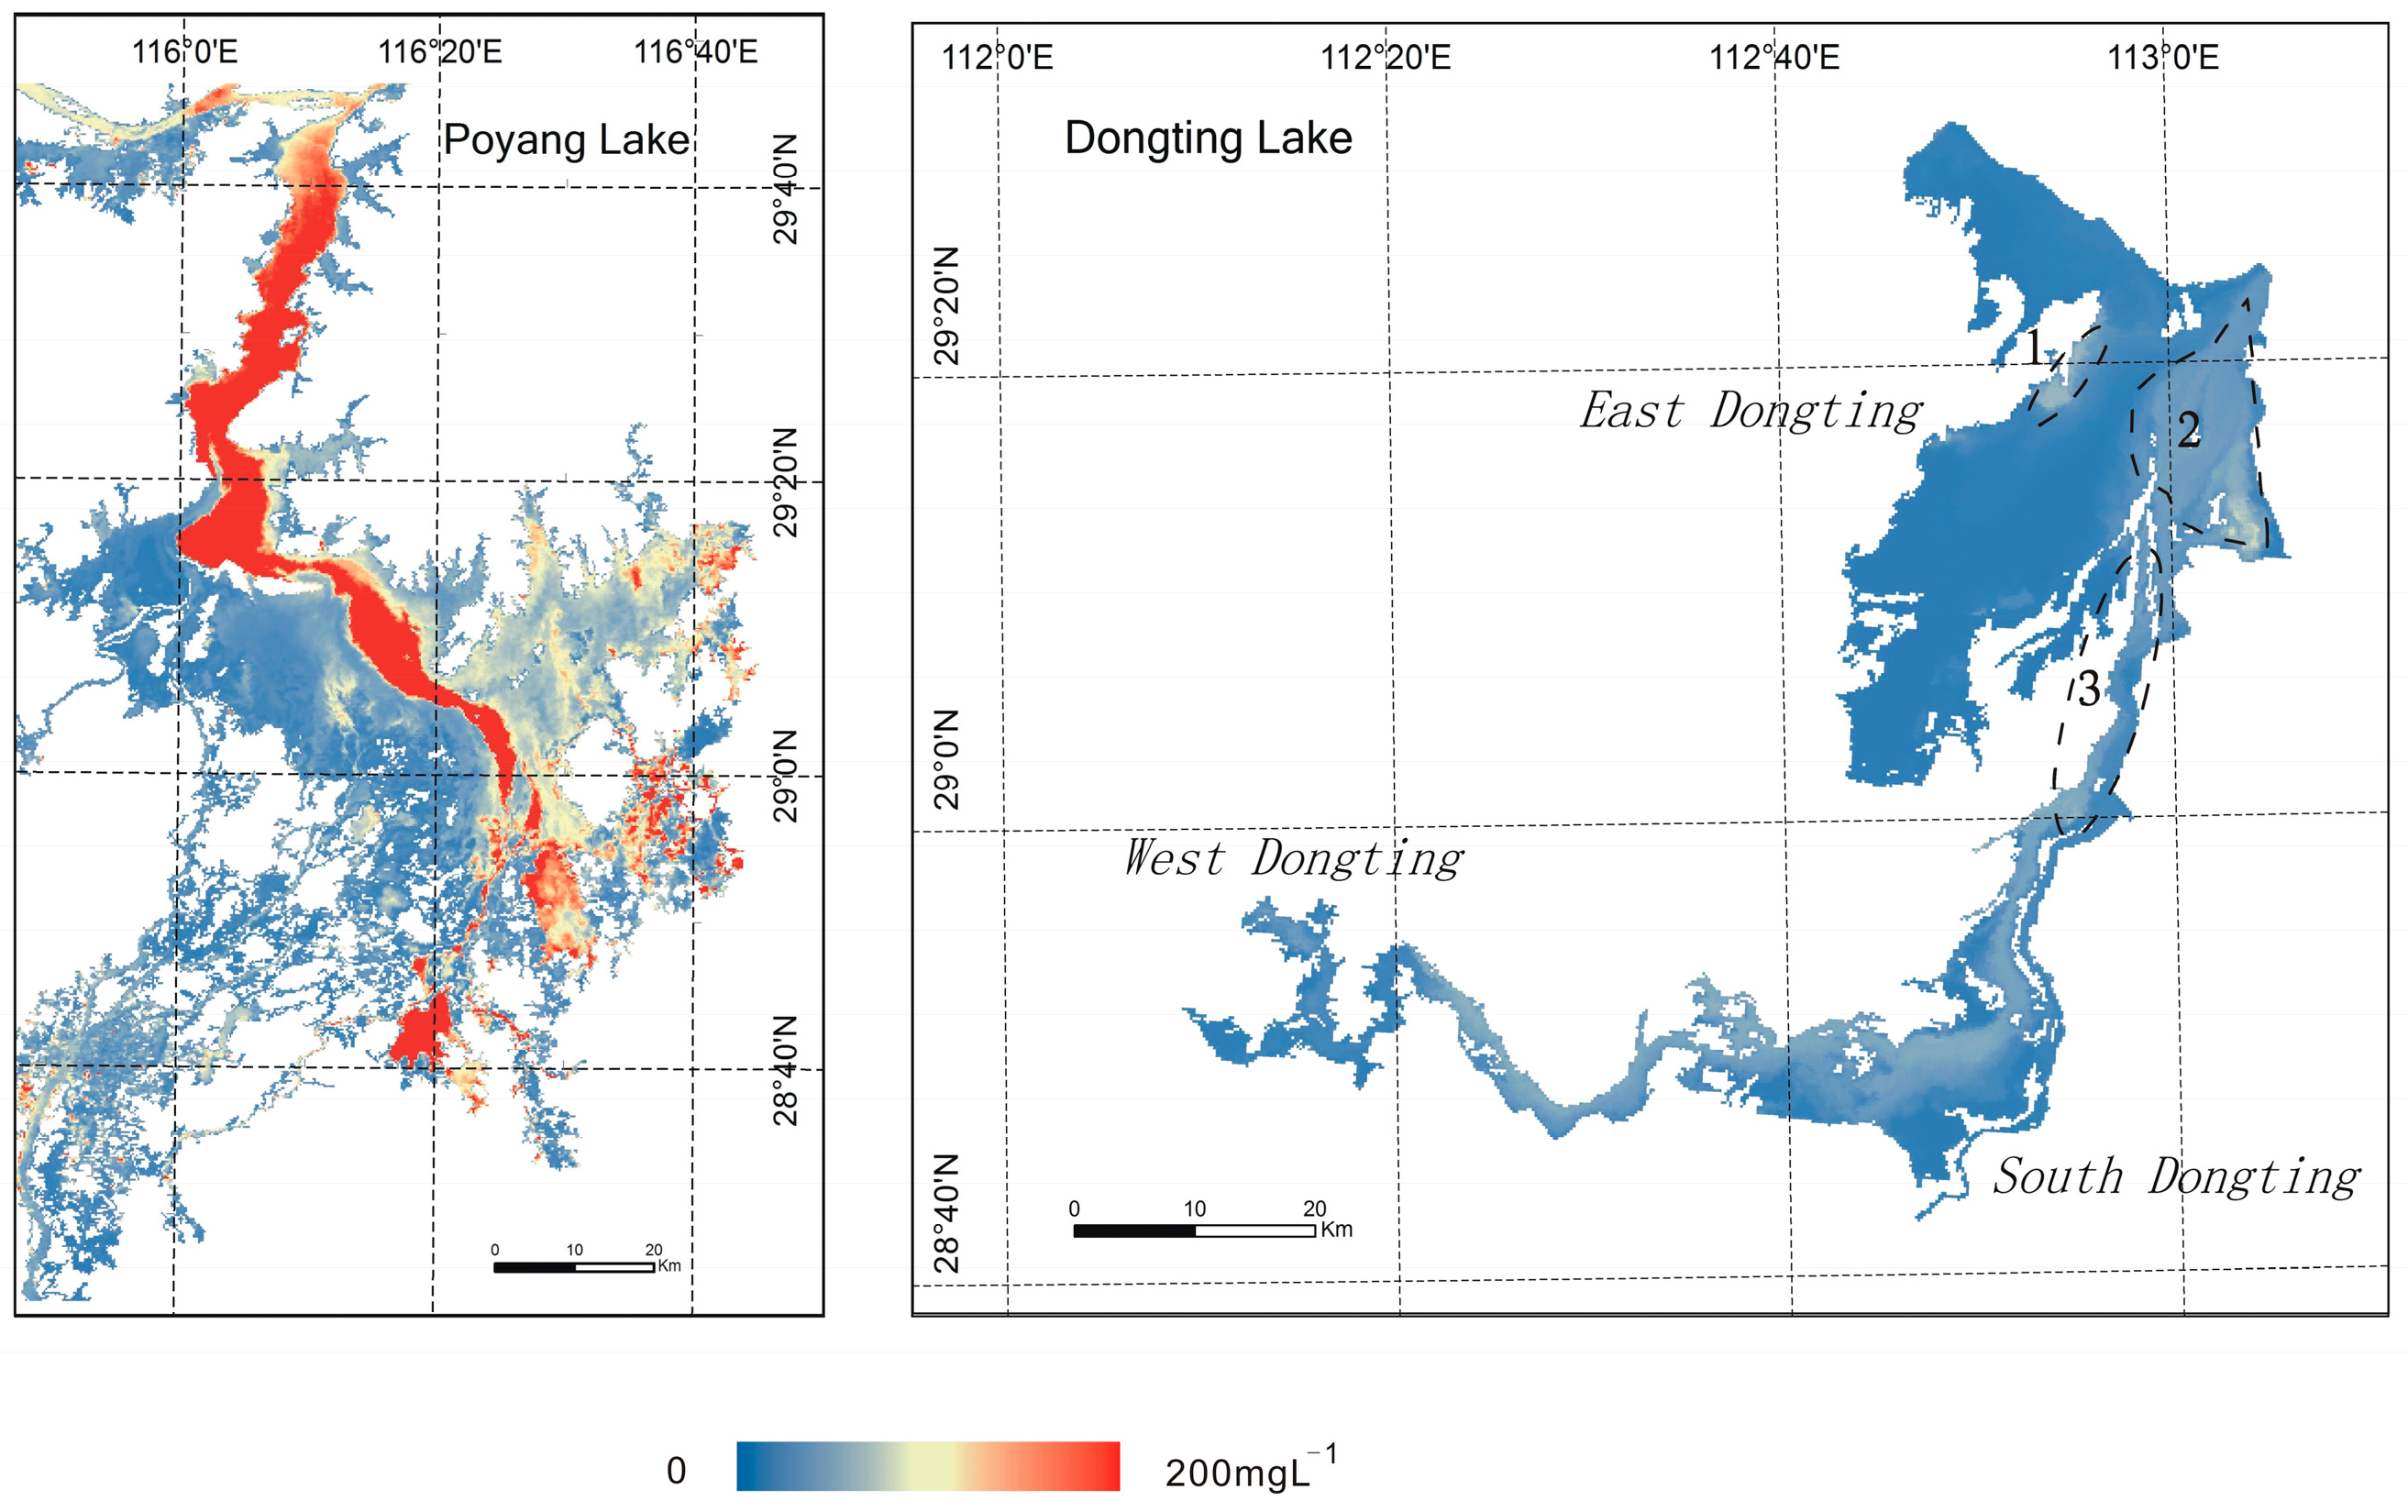
3.3. Model Application
4. Discussion
5. Conclusions
Acknowledgments
Author Contributions
Conflicts of Interest
References
- Kirk, J.T.O. Light and Photosynthesis in Aquatic Ecosystems; Cambridge University Press: New York, NY, USA, 1994; p. 400. [Google Scholar]
- Giardino, C.; Oggioni, A.; Bresciani, M.; Yan, H.M. Remote Sensing of Suspended Particulate Matter in Himalayan Lakes A Case Study of Alpine Lakes in the Mount Everest Region. Mt. Res. Dev. 2010, 30, 157–168. [Google Scholar] [CrossRef]
- Xing, Q.G.; Lou, M.J.; Chen, C.Q.; Shi, P. Using in situ and Satellite Hyperspectral Data to Estimate the Surface Suspended Sediments Concentrations in the Pearl River Estuary. IEEE J. Sel. Top. Appl. Earth Obs. Remote Sens. 2013, 6, 731–738. [Google Scholar] [CrossRef]
- Pozdnyakov, D.; Shuchman, R.; Korosov, A.; Hatt, C. Operational algorithm for the retrieval of water quality in the Great Lakes. Remote Sens. Environ. 2005, 97, 352–370. [Google Scholar] [CrossRef]
- Uddin, S.; Al-Ghadban, A.N.; Gevao, B.; Al-Shamroukh, D.; Al-Khabbaz, A. Estimation of suspended particulate matter in Gulf using MODIS data. Aquat. Ecosyst. Health Manag. 2012, 15, 41–44. [Google Scholar]
- Tarrant, P.E.; Amacher, J.A.; Neuer, S. Assessing the potential of Medium-Resolution Imaging Spectrometer (MERIS) and Moderate-Resolution Imaging Spectroradiometer (MODIS) data for monitoring total suspended matter in small and intermediate sized lakes and reservoirs. Water Resour. Res. 2010, 46. [Google Scholar] [CrossRef]
- Ondrusek, M.; Stengel, E.; Kinkade, C.S.; Vogel, R.L.; Keegstra, P.; Hunter, C.; Kim, C. The development of a new optical total suspended matter algorithm for the Chesapeake Bay. Remote Sens. Environ. 2012, 119, 243–254. [Google Scholar] [CrossRef]
- Son, S.; Wang, M. Water properties in Chesapeake Bay from MODIS-Aqua measurements. Remote Sens. Environ. 2012, 123, 163–174. [Google Scholar] [CrossRef]
- Sipelgas, L.; Raudsepp, U.; Kouts, T. Operational monitoring of suspended matter distribution using MODIS images and numerical modelling. Adv. Space Res. 2006, 38, 2182–2188. [Google Scholar] [CrossRef]
- Zhang, Z.; He, G.; Wang, X. A practical DOS model-based atmospheric correction algorithm. Int. J. Remote Sens. 2010, 31, 2837–2852. [Google Scholar] [CrossRef]
- Zhang, Y.; Lin, S.; Liu, J.; Qian, X.; Ge, Y. Time-series MODIS image-based retrieval and distribution analysis of total suspended matter concentrations in Lake Taihu (China). Int. J. Environ. Res. Public Health 2010, 7, 3545–3560. [Google Scholar] [CrossRef] [PubMed]
- Jiang, X.W.; Tang, J.W.; Zhang, M.W.; Ma, R.H.; Ding, J. Application of MODIS data in monitoring suspended sediment of Taihu Lake, China. Chin. J. Oceanol. Limnol. 2009, 27, 614–620. [Google Scholar] [CrossRef]
- Wu, G.; Cui, L.; He, J.; Duan, H.; Fei, T.; Liu, Y. Comparison of MODIS-based models for retrieving suspended particulate matter concentrations in Poyang Lake, China. Int. J. Appl. Earth Obs. Geoinform. 2013, 24, 63–72. [Google Scholar] [CrossRef]
- Ody, A.; Doxaran, D.; Vanhellemont, Q.; Nechad, B.; Novoa, S.; Many, G.; Bourrin, F.; Verney, R.; Pairaud, I.; Gentili, B. Potential of High Spatial and Temporal Ocean Color Satellite Data to Study the Dynamics of Suspended Particles in a Micro-Tidal River Plume. Remote Sens. 2016, 8, 245. [Google Scholar] [CrossRef] [Green Version]
- Chen, S.; Han, L.; Chen, X.; Li, D.; Sun, L.; Li, Y. Estimating wide range Total Suspended Solids concentrations from MODIS 250-m imageries: An improved method. ISPRS J. Photogramm. Remote Sens. 2015, 99, 58–69. [Google Scholar] [CrossRef]
- Wu, G.; Liu, L.; Chen, F.; Fei, T. Developing MODIS-based retrieval models of suspended particulate matter concentration in Dongting Lake, China. Int. J. Appl. Earth Obs. Geoinform. 2014, 32, 46–53. [Google Scholar] [CrossRef]
- Qiu, Z.F. A simple optical model to estimate suspended particulate matter in Yellow River Estuary. Opt. Express 2013, 21, 27891–27904. [Google Scholar] [CrossRef] [PubMed]
- Espinoza Villar, R.; Martinez, J.-M.; Le Texier, M.; Guyot, J.-L.; Fraizy, P.; Meneses, P.R.; Oliveira, E.D. A study of sediment transport in the Madeira River, Brazil, using MODIS remote-sensing images. J. South Am. Earth Sci. 2013, 44, 45–54. [Google Scholar] [CrossRef]
- Long, C.M.; Pavelsky, T.M. Remote sensing of suspended sediment concentration and hydrologic connectivity in a complex wetland environment. Remote Sens. Environ. 2013, 129, 197–209. [Google Scholar] [CrossRef]
- Feng, L.; Hu, C.; Chen, X.; Tian, L.; Chen, L. Human induced turbidity changes in Poyang Lake between 2000 and 2010: Observations from MODIS. J. Geophys. Res. 2012, 117. [Google Scholar] [CrossRef]
- Jiang, H.; Liu, Y. Monitoring of TSS concentration in Poyang Lake based on MODIS data. Yangtze River 2011, 42, 87–90. (In Chinese) [Google Scholar]
- Chen, S.; Huang, W.; Chen, W.; Chen, X. An enhanced MODIS remote sensing model for detecting rainfall effects on sediment plume in the coastal waters of Apalachicola Bay. Mar. Environ. Res. 2011, 72, 265–272. [Google Scholar] [CrossRef] [PubMed]
- Zhao, H.H.; Chen, Q.; Walker, N.D.; Zheng, Q.A.; MacIntyre, H.L. A study of sediment transport in a shallow estuary using MODIS imagery and particle tracking simulation. Int. J. Remote Sens. 2011, 32, 6653–6671. [Google Scholar] [CrossRef]
- Wang, J.J.; Lu, X.X. Estimation of suspended sediment concentrations using Terra MODIS: An example from the Lower Yangtze River, China. Sci. Total Environ. 2010, 408, 1131–1138. [Google Scholar] [CrossRef] [PubMed]
- Wang, H.; Hladik, C.M.; Huang, W.; Milla, K.; Edmiston, L.; Harwell, M.A.; Schalles, J.F. Detecting the spatial and temporal variability of chlorophyll—A concentration and total suspended solids in Apalachicola Bay, Florida using MODIS imagery. Int. J. Remote Sens. 2010, 31, 439–453. [Google Scholar] [CrossRef]
- Doxaran, D.; Froidefond, J.-M.; Castaing, P.; Babin, M. Dynamics of the turbidity maximum zone in a macrotidal estuary (the Gironde, France): Observations from field and MODIS satellite data. Estuar. Coast. Shelf Sci. 2009, 81, 321–332. [Google Scholar] [CrossRef]
- Wu, G.; Cui, L. Time-series MODIS images-based retrieval and change analysis of suspended sediment concentration during flood period in Poyang Lake. J. Lake Sci. 2008, 28, 6113–6120. (In Chinese) [Google Scholar]
- Liu, C.-D.; He, B.-Y.; Li, M.-T.; Ren, X.-Y. Quantitative modeling of suspended sediment in middle Changjiang River from modis. Chin. Geogr. Sci. 2006, 16, 79–82. [Google Scholar] [CrossRef]
- Hu, C.; Chen, Z.; Clayton, T.D.; Swarzenski, P.; Brock, J.C.; Muller-Karger, F.E. Assessment of estuarine water-quality indicators using MODIS medium-resolution bands: Initial results from Tampa Bay, FL. Remote Sens. Environ. 2004, 93, 423–441. [Google Scholar] [CrossRef]
- Ma, R.; Duan, H.; Tang, J.; Chen, Z. Remote Sensing of Lake Water Environment; Science Press: Beijing, China, 2010; p. 536. (In Chinese) [Google Scholar]
- Giardino, C.; Brando, V.E.; Dekker, A.G.; Strombeck, N.; Candiani, G. Assessment of water quality in Lake Garda (Italy) using Hyperion. Remote Sens. Environ. 2007, 109, 183–195. [Google Scholar] [CrossRef]
- Cui, L.; Qiu, Y.; Fei, T.; Liu, Y.; Wu, G. Using remotely sensed suspended sediment concentration variation to improve management of Poyang Lake, China. Lake Reserv. Manag. 2013, 29, 47–60. [Google Scholar] [CrossRef]
- Xu, D.; Xiong, M.; Zhang, J. Analysis on hydrologic characteristics of Poyang Lake. Yangtze River 2001, 32, 21–27. [Google Scholar]
- Shankman, D.; Keim, B.D.; Song, J. Flood frequency in China’s Poyang lake region: Trends and teleconnections. Int. J. Climatol. 2006, 26, 1255–1266. [Google Scholar] [CrossRef]
- Wu, Y.; Ji, W. Study on Jiangxi Poyang Lake National Nature Reserve; Forest Publishing House: Beijing, China, 2002; p. 231. [Google Scholar]
- Wu, G.; De Leeuw, J.; Skidmore, A.K.; Prins, H.H.H.; Liu, Y. Concurrent monitoring of vessels and water turbidity enhances the strength of evidence in remotely sensed dredging impact assessment. Water Res. 2007, 41, 3271–3280. [Google Scholar] [CrossRef] [PubMed]
- Huang, S.F.; Li, J.G.; Xu, M. Water surface variations monitoring and flood hazard analysis in Dongting Lake area using long-term Terra/MODIS data time series. Nat. Hazards 2012, 62, 93–100. [Google Scholar] [CrossRef]
- Wang, Y.X.; Cheng, S.; Ju, H.B.; Zhang, H.Q.; Jiang, D.; Zhuang, D.F. Evaluating sustainability of wetland system: A case study in East Dongting Lake Area, China. Afr. J. Agric. Res. 2011, 6, 6167–6176. [Google Scholar]
- World Lake Database. Available online: http://wldb.ilec.or.jp/data/databook_html/asi/asi-11.html (accessed on 27 April 2016).
- Huang, X. Eco-Investigation, Observation and Analysis of Lakes; Standard Press of China: Beijing, China, 1999. (In Chinese) [Google Scholar]
- NASA. TERRA The EOS Flagship. Available online: http://terra.nasa.gov/about (accessed on 22 July 2016).
- Kotchenova, S.Y.; Vermote, E.F.; Matarrese, R.; Klemm, J.F.J. Validation of a vector version of the 6S radiative transfer code for atmospheric correction of satellite data. Part I: Path radiance. Appl. Opt. 2006, 45, 6762–6774. [Google Scholar] [CrossRef] [PubMed]
- Kotchenova, S.Y.; Vermote, E.F. Validation of a vector version of the 6S radiative transfer code for atmospheric correction of satellite data. Part II. Homogeneous Lambertian and anisotropic surfaces. Appl. Opt. 2007, 46, 4455–4464. [Google Scholar] [CrossRef] [PubMed]
- Vermote, E.F.; Saleous, N. Operational Atmospheric Correction of MODIS Visible to Middle Infrared Land Surface Data in the Case of an Infinite Lambertian Target. In Earth Science Satellite Remote Sensing: Vol. 1: Science and Instruments; Qu, J.J., Gao, W., Kafatos, M., Murphy, R.E., Salomonson, V.V., Eds.; Springer Berlin Heidelberg: Berlin/Heidelberg, Germany, 2006; pp. 123–153. [Google Scholar]
- USGS. LPDAAC MODIS Products Table. Available online: https://lpdaac.usgs.gov/dataset_discovery/modis/modis_products_table (accessed on 27 April 2016).
- Wang, J.L.; Zhang, Y.J.; Yang, F.; Cao, X.M.; Bai, Z.Q.; Zhu, J.X.; Chen, E.Y.; Li, Y.F.; Ran, Y.Y. Spatial and temporal variations of chlorophyll—A concentration from 2009 to 2012 in Poyang Lake, China. Environ. Earth Sci. 2015, 73, 4063–4075. [Google Scholar] [CrossRef]
- Ayana, E.K.; Worqlul, A.W.; Steenhuis, T.S. Evaluation of stream water quality data generated from MODIS images in modeling total suspended solid emission to a freshwater lake. Sci. Total Environ. 2015, 523, 170–177. [Google Scholar] [CrossRef] [PubMed]
- Alcântara, E.; Barbosa, C.; Stech, J.; Novo, E.; Shimabukuro, Y. Improving the spectral unmixing algorithm to map water turbidity Distributions. Environ. Model. Softw. 2009, 24, 1051–1061. [Google Scholar] [CrossRef]
- USGS. LPDAAC Data Pool. Available online: https://lpdaac.usgs.gov/data_access/data_pool (accessed on 27 April 2016).
- Dell Software. Available online: https://www.statsoft.com (accessed on 27 April 2016).
- Wang, M.; Tang, J.; Shi, W. MODIS-derived ocean color products along the China east coastal region. Geophys. Res. Lett. 2007, 34, L06611. [Google Scholar] [CrossRef]
- Cui, L.; Zhai, Y.; Wu, G. Dredging being moved southward enlarges the impacted region in Poyang Lake—The evidences from multi-remote sensing images. Acta Ecol. Sin. 2013, 11, 3520–3525. (In Chinese) [Google Scholar]
- Wu, G.; Cui, L.; Duan, H.; Fei, T.; Liu, Y. Specific absorption and backscattering coefficients of the main water constituents in Poyang Lake, China. Environ. Monit. Assess. 2013, 185, 4191–4206. [Google Scholar] [CrossRef] [PubMed]
- Doxaran, D.; Cherukuru, N.; Lavender, S.J. Apparent and inherent optical properties of turbid estuarine waters: measurements, empirical quantification relationships, and modeling. Appl. Opt. 2006, 45, 2310–2324. [Google Scholar] [CrossRef] [PubMed]
- Lee, Z.P.; Carder, K.L.; Arnone, R.A. Deriving inherent optical properties from water color: A multiband quasi-analytical algorithm for optically deep waters. Appl. Opt. 2002, 41, 5755–5772. [Google Scholar] [CrossRef] [PubMed]
- Ma, R.; Tang, J.; Dai, J. Bio-optical model with optimal parameter suitable for Taihu Lake in water colour remote sensing. Int. J. Remote Sens. 2006, 27, 4305–4328. [Google Scholar] [CrossRef]
- Shi, W.; Wang, M. An assessment of the black ocean pixel assumption for MODIS SWIR bands. Remote Sens. Environ. 2009, 113, 1587–1597. [Google Scholar] [CrossRef]
- Wang, M.H.; Shi, W. The NIR-SWIR combined atmospheric correction approach for MODIS ocean color data processing. Opt. Express 2007, 15, 15722–15733. [Google Scholar] [CrossRef] [PubMed]
- Wang, M.H.; Son, S.; Shi, W. Evaluation of MODIS SWIR and NIR-SWIR atmospheric correction algorithms using SeaBASS data. Remote Sens. Environ. 2009, 113, 635–644. [Google Scholar] [CrossRef]
- Wang, M.H.; Shi, W.; Jiang, L.D. Atmospheric correction using near-infrared bands for satellite ocean color data processing in the turbid western Pacific region. Opt. Express 2012, 20, 741–753. [Google Scholar] [CrossRef] [PubMed]
- Zheng, Z.B.; Li, Y.M.; Guo, Y.L.; Xu, Y.F.; Liu, G.; Du, C.G. Landsat-Based Long-Term Monitoring of Total Suspended Matter Concentration Pattern Change in the Wet Season for Dongting Lake, China. Remote Sens. 2015, 7, 13975–13999. [Google Scholar] [CrossRef]


| Author(s) | Model | R2 | n | CSPM Range | Location |
|---|---|---|---|---|---|
| Ody et al. (2016) [14] | CSPM = 1400 Rrs(645) | 0.61 | 27 | 3–60 | Rhone River, France |
| Chen et al. (2015) [15] | log10(Rrs(859))/log10(Rrs(645)) = −0.334 log10(CSPM)2 + 1.0046 log10(CSPM) + 0.8251 | 0.75 | 60 | 5.8–577.2 | Etuary of Yangtze River and Xuwen Coral Reef Protection Zone, China |
| Wu et al. (2014) [16] | CSPM = 3.04 exp(20.23 (Rrs(645) − Rrs(1240))) | 0.68 | 48 | 0.1–40.4 | Dongting Lake, China |
| Qiu (2013) [17] | log10(CSPM) = 1.932 exp(0.875 Rrs(678)/Rrs(551)) | 0.95 | 122 | 1.9–1896.5 | Yellow River Estuary, China |
| Villar et al. (2013) [18] | CSPM = 1020 (Rrs(859)/Rrs(645))2.94 | 0.62 | 282 | 25–622 | Maderia River, Brazil |
| Long and Pavelsky (2013) [19] | CSPM = 12.996 exp(Rrs(859)/(0.189Rrs(645))) | 0.94 | 147 | 3.9–3602 | Peace-Athabasca Delta, Canada |
| Wu et al. (2013) [13] | CSPM = 0.0365 exp(63.2 (Rrs(645) − Rrs(1240))) | 0.76 | 42 | 0–141.9 | Poyang Lake, China |
| Feng et al. (2012) [20] | CSPM = 0.6786 exp(34.366 (Rrs(645) − Rrs(nearest1240))) | 0.87 | 38 | 3–200 | Poyang Lake, China |
| Jiang and Liu (2011) [21] | CSPM = 1365.5 (Rrs(470) + Rrs(555))2 − 369.08 (Rrs(470) + Rrs(555)) + 27.216 | 0.81 | 27 | 0–40 | Poyang Lake, China |
| Chen et al. (2011) [22] | log10(Rrs(859))/log10(Rrs(645)) = −0.1325 log10(CSPM)2 + 0.7429 log10(CSPM) + 0.6768 | 0.86 | 32 | 1.29–208 | Apalachicola Bay, United States |
| Zhao et al. (2011) [23] | CSPM = 2.12 exp(45.92 Rrs(645)) | 0.78 | 63 | 0–87.8 | Mobile Bay Estuary, Alabama |
| Tarrant et al. (2010) [6] | CSPM = 0.0213 (Rrs(645) − Rrs(859)) + 0.232 | 0.82 | 105 | 0.30–13.4 | Roosevelt, Bartlett Pleasant Lake, United States |
| Zhang et al. (2010) [11] | ln(CSPM) = 0.015 (Rrs(645)) + 0.003 (Rrs(645))2 − 0.282 | 0.87 | 166 | 4.32–311.4 | Taihu Lake, China |
| ln(CSPM) = 166.960/(Rrs(470) − Rrs(645)) − 2.192 | 0.79 | ||||
| ln(CSPM) = –16.997 Rrs(470)/Rrs(645) + 3.326 (Rrs(470)/Rrs(645))2 + 23.681 | 0.87 | ||||
| ln(CSPM) = –29.707 (Rrs(470) − Rrs(645))/(Rrs(470) + Rrs(645)) + 41.886 (Rrs(470) − Rrs(645))/(Rrs(470) + Rrs(645))2 + 11.358 | 0.87 | ||||
| Wang and Lu (2010) [24] | ln(CSPM) = 0.262 (Rrs(859) − Rrs(1240)) + 4.117 | 0.78 | 35 | 74–881 | Lower Yangtze River, China |
| Wang et al. (2010) [25] | log10(CSPM) = 1.5144 log10(Rrs(859))/ log10(Rrs(645)) − 0.5755 | 0.72 | 16 | 1–64 | Apalachicola Bay, United States |
| log10(CSPM) = 0.1497 exp(1.5859 log10(Rrs(859))/log10(Rrs(645))) | 0.61 | 11 | |||
| Jiang et al. (2009) [12] | log10(CSPM) = 0.3568 ln(Rrs(859)) + 3.3431 | 0.81 | 56 | 0–170 | Taihu Lake, China |
| Doxaran et al. (2009) [26] | CSPM = 12.996 exp(Rrs(859)/(0.189Rrs(645))) | 0.89 | 204 | 0–2250 | Gironde Estuary, France |
| Wu and Cui (2008) [27] | CSPM = 86236.23 Rrs(645)3 − 15858.70 Rrs(645)2 + 1005.29 Rrs(645) − 15.67 | 0.92 | 42 | 0–142 | Poyang Lake, China |
| Liu et al. (2006) [28] | ln(CSPM) = 2.495 (Rrs(645) − Rrs(859))/(Rrs(645) + Rrs(859)) + 1.810 | 0.72 | 41 | 23.4–61.2 | Middle Yangtze River, China |
| Sipelgas et al. (2006) [9] | CSPM = 110.3 Rrs(645) + 2 | 0.58 | 48 | 3–10 | Pakri Bay, Finland |
| Hu et al. (2004) [29] | CSPM = 0.00522 exp(1002 (Rrs(645) − Rrs(859))) | 0.90 | 31 | 2–11 | Tampa Bay, United States |
| Lake | Fieldwork Date | Original Sampling Number | Employed Sampling Number | MODIS Date |
|---|---|---|---|---|
| Poyang Lake | 27 September 2007 | 42 | 42 | 27 September 2007 |
| 31 August 2012 | 54 | 48 | 30 August 2012 | |
| Dongting Lake | 31 August 2012 | 48 | 47 | 30 August 2012 |
| 14 June 2013 | 53 | 48 | 14 June 2013 |
| CSPM | Poyang Lake | Dongting Lake | ||
|---|---|---|---|---|
| 27 September 2007 (n = 42) | 31 August 2012 (n = 48) | 31 August 2012 (n = 47) | 14 June 2013 (n = 48) | |
| Minimum | 0.0 | 0.0 | 0.0 | 0.7 |
| Maximum | 141.9 | 144.0 | 40.4 | 44.8 |
| Mean | 38.2 | 42.3 | 12.6 | 10.8 |
| Standard deviation | 42.0 | 43.3 | 13.8 | 10.4 |
| Variation coefficient | 110.1 | 102.3 | 109.6 | 96.2 |
| Intercept (a) | Slope (b) | |||||
|---|---|---|---|---|---|---|
| a ± SE | t | p | b ± SE | t | p | |
| (A)-(1) | −5.470 ± 6.470 | −0.845 | 0.403 | 1.186 ± 0.132 | 1.405 | 0.160 |
| (A)-(2) | −4.660 ± 5.019 | −0.928 | 0.358 | 1.196 ± 0.101 | 1.936 | 0.053 |
| (B)-(1) | −0.029 ± 1.447 | −0.020 | 0.984 | 0.975 ± 0.089 | −0.284 | 0.776 |
| (B)-(2) | −1.554 ± 1.840 | −0.844 | 0.403 | 0.816 ± 0.090 | −2.035 | 0.042 |
© 2016 by the authors; licensee MDPI, Basel, Switzerland. This article is an open access article distributed under the terms and conditions of the Creative Commons Attribution (CC-BY) license (http://creativecommons.org/licenses/by/4.0/).
Share and Cite
Chen, F.; Wu, G.; Wang, J.; He, J.; Wang, Y. A MODIS-Based Retrieval Model of Suspended Particulate Matter Concentration for the Two Largest Freshwater Lakes in China. Sustainability 2016, 8, 832. https://doi.org/10.3390/su8080832
Chen F, Wu G, Wang J, He J, Wang Y. A MODIS-Based Retrieval Model of Suspended Particulate Matter Concentration for the Two Largest Freshwater Lakes in China. Sustainability. 2016; 8(8):832. https://doi.org/10.3390/su8080832
Chicago/Turabian StyleChen, Fangyuan, Guofeng Wu, Junjie Wang, Junjun He, and Yihan Wang. 2016. "A MODIS-Based Retrieval Model of Suspended Particulate Matter Concentration for the Two Largest Freshwater Lakes in China" Sustainability 8, no. 8: 832. https://doi.org/10.3390/su8080832