1. Introduction
Many countries are attempting to balance economic development and cultivated land preservation (or broadly used as farmland preservation in developed countries). The underlying reasons may include environment protection, landscape protection, improvement of soil quality, and cultural preservation [
1,
2,
3,
4,
5]. However, it is comparatively difficult to achieve such a balance due to complicated interests, in practice. China’s experience is a good illustration of such challenges during rapid economic development and urbanization. Cultivated land loss has been a serious concern for both the government and academic researchers since the 1990s. The total area of the annual conversion from cultivated land into construction land was reportedly 203.5 thousand hectares, and high-quality cultivated land occupied only one-third of the converted land [
6]. The conversion of large areas of cultivated land into construction land is driven by the considerable increase in population brought about by rapid urbanization [
7,
8,
9]. Construction land is necessary for infrastructure and real estate development, indicating that economic growth and industrialization are the main drivers of cultivated land loss [
6,
10,
11]. Striving for political achievements, local governments tend to rely on the land market to attract investments and generate sufficient funding for urban development. Specifically, local governments convert cultivated land to construction land, and this practice is commonly known as land financing [
12,
13]. Another major driver of cultivated land loss is the disorganized rural housing construction in recent years [
8,
14], as evidenced by the continual increase in rural housing areas even though many hollow villages exist. Such irrational land use exacerbates cultivated land loss and hinders sustainable urbanization and food security [
15,
16,
17]. The central government of China therefore implemented cultivated land preservation in order to ensure food security, which is linked by grain production. The State Council of PRC (1996) formulated the “White Book for Chinese Food Security” in 1996 and emphasized that the self-sufficiency ratio of grain should not be less than 95% by considering the political security, employment of farmers, and stability of international grain market [
18]. Although other tools like scientific measures and market reform are emphasized, cultivated land preservation is still emphasized as the most important measure to ensure food security in the “Long-term Planning for Chinese Food Security (2008–2020)” formulated by the State Council of PRC [
19]. Specified in this planning, the area of cultivated land should not be less than 120,000,000 hectares until 2020.
Various measures have been used to preserve farmland. In the western countries, the common measures include zoning and planning, tax preferences, purchase of development rights, and transferrable development rights trading besides law regulations [
20,
21]. In China, the central government has mainly relied strict land management measures to protect cultivated land since 1998 [
22,
23,
24,
25]. The core issues of the strict land management measures can be found in
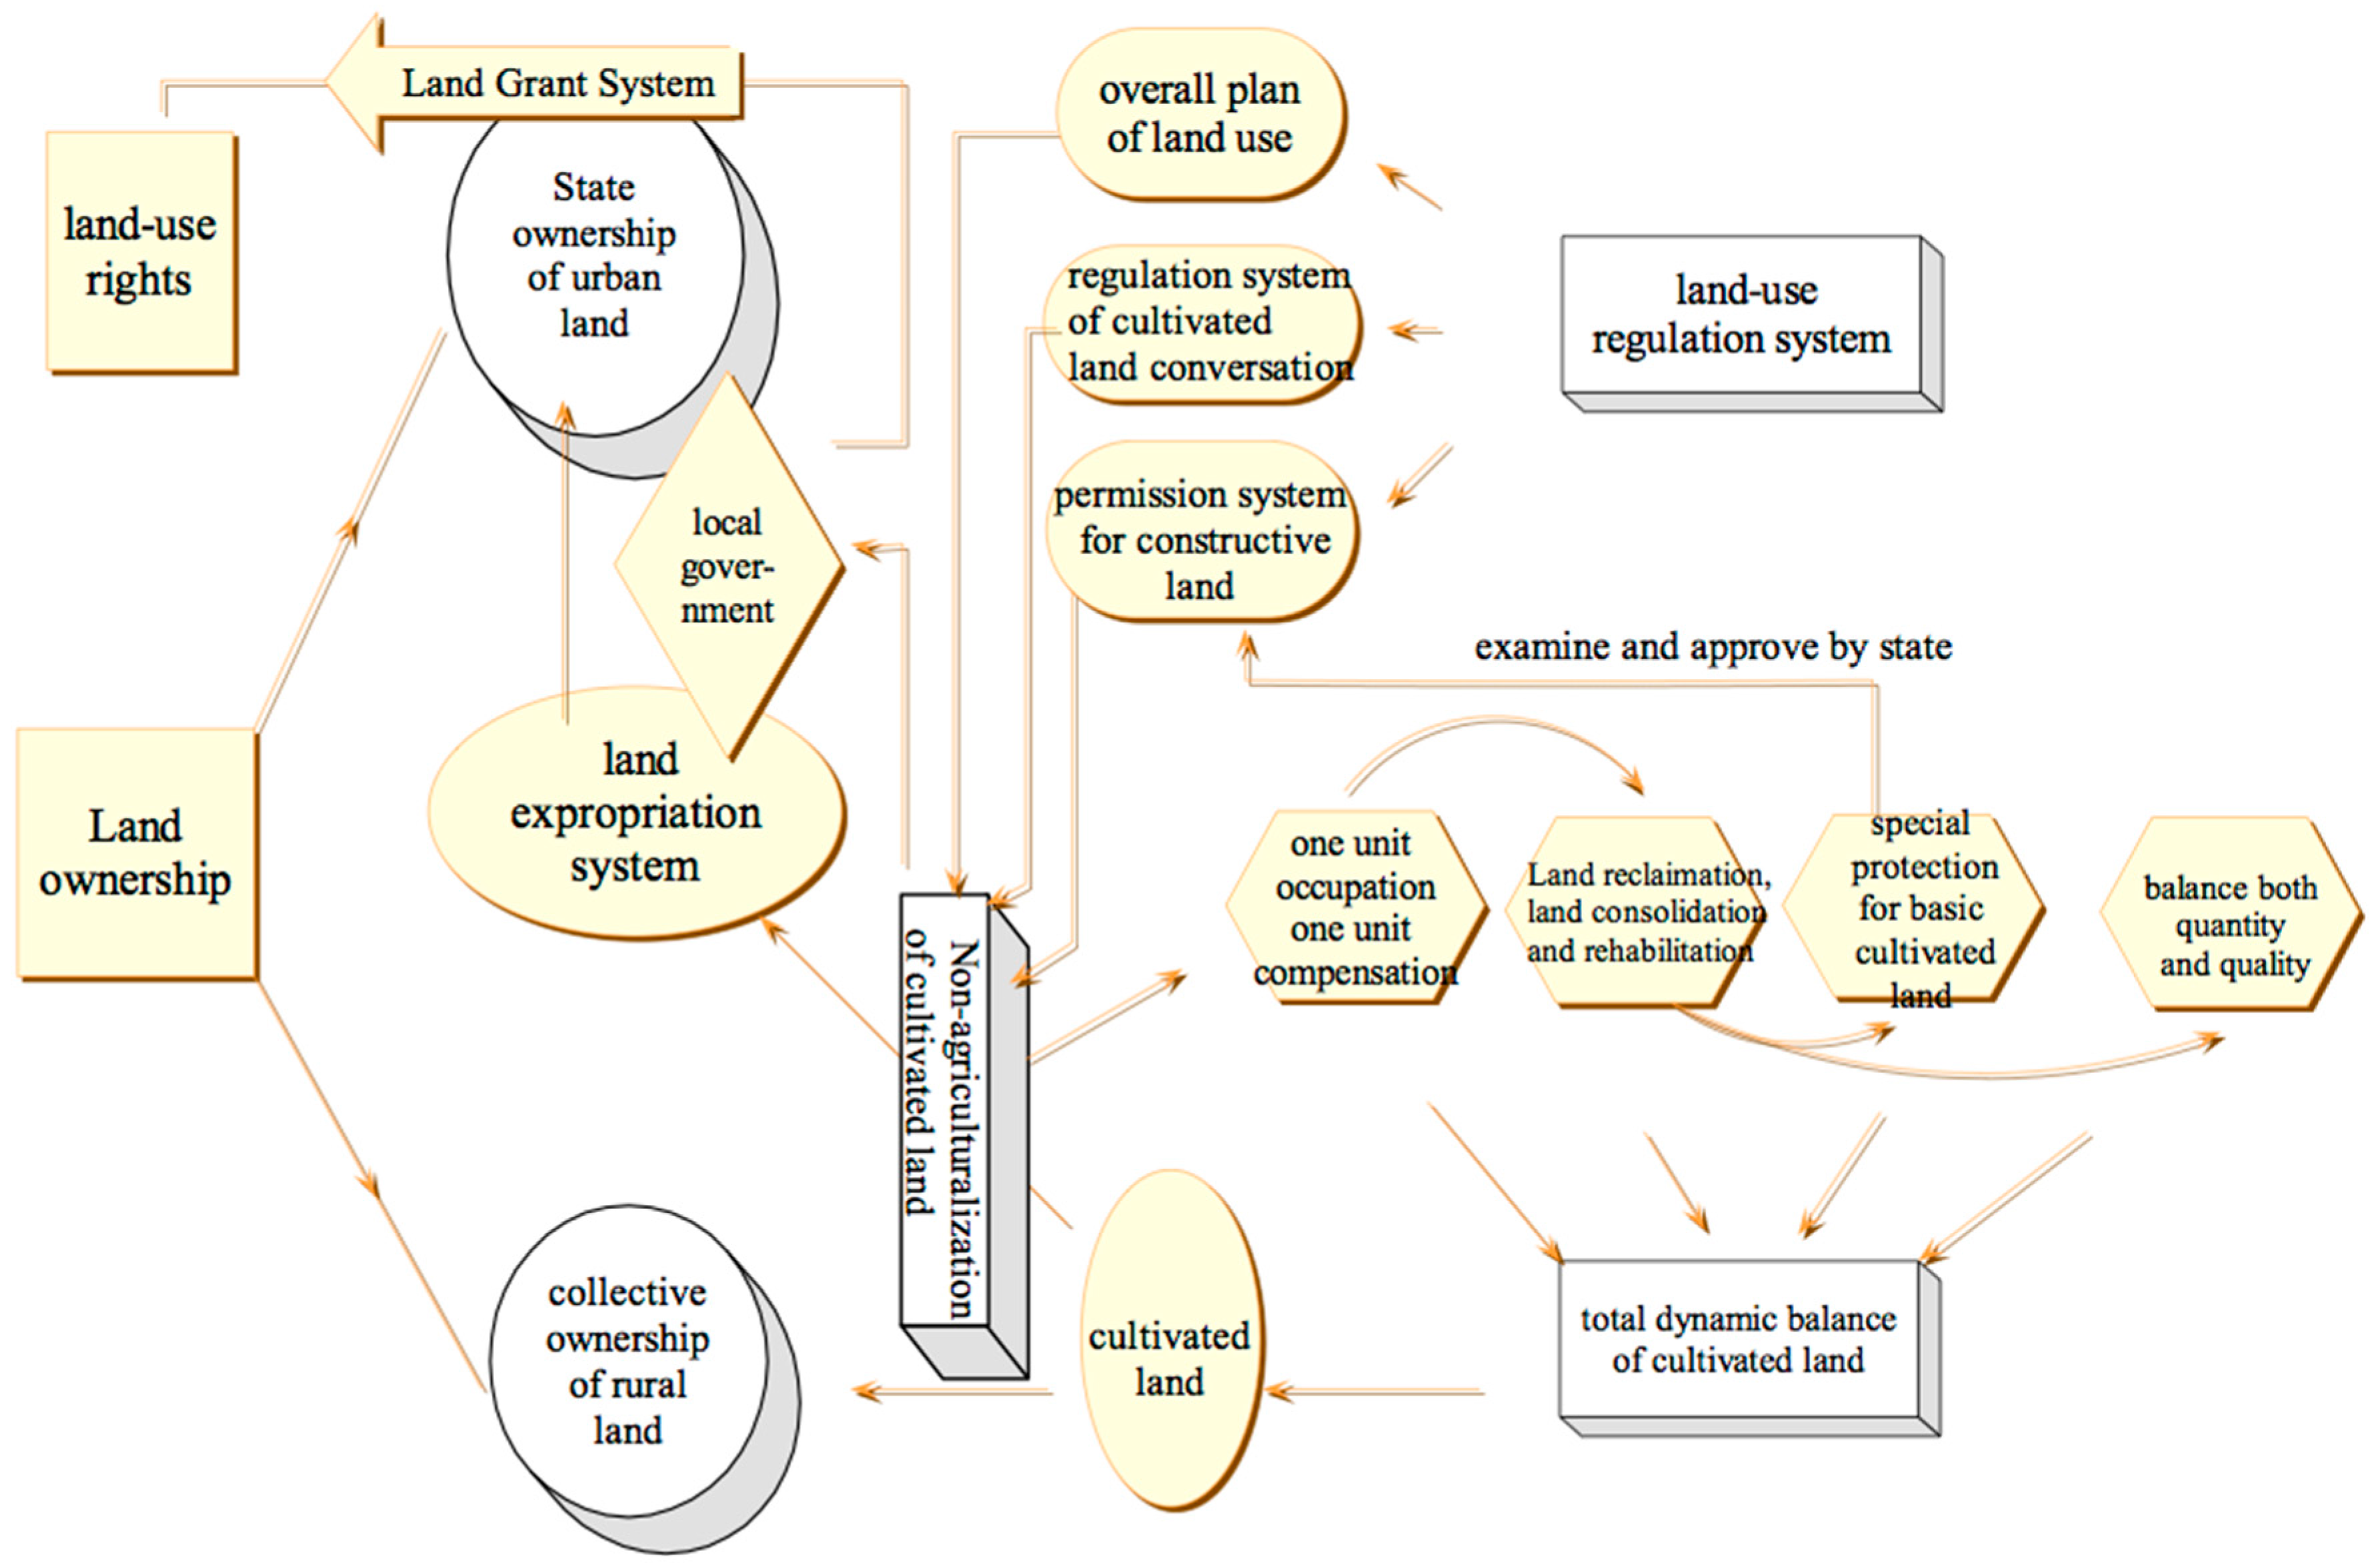
Figure 1. Put into effect on January 1st, 1999, the revised Land Administration Law of the People’s Republic of China allowed the central government to devise a comprehensive land use plan (tu di li yong zong ti gui hua, CLUP) to set a long-term agenda for both the area and location of cultivated land in a locality to be converted into construction (non-agricultural) use. The CLUP is implemented through the annual land use plan (tu di li yong nian du ji hua, ALUP) established by the central government. The ALUP breaks down the long-term objectives into land use quotas for each year. Accordingly, all levels of sub-national governments, including provincial, prefectural, county, and township governments, must formulate and abide by their own comprehensive plans of land use. Therefore, the CLUP and the ALUP for each level of government regulate the land conversion from agricultural use to other uses in both the long term and for each year, respectively. In addition to “planning quotas”, cultivated land conversion is controlled by another stringent land regulation: the Basic Cultivated land Protection Regulation (ji ben nong tian bao hu tiao li). This directive stipulates that the convertible cultivated land approved by land use plans must be located outside of the delineated zone of the basic cultivated land, which generally accounts for 80%–85% of the total cultivated land in each jurisdiction. This regulation aims to create a “dynamic balance” (i.e., no net loss) of the total cultivated land by requiring local governments to allocate the same amount of cultivated land to offset the land loss caused by construction, including land reclamation, consolidation, and rehabilitation (zhan duo shao, bu duo shao). Aside from conversion control, other policies have also been enacted to promote the supplementing of cultivated land; such policies include “increasing vs. decreasing balance of urban-rural built land” and “rural land consolidation and economical and intensive land use” [
26,
27,
28].
However, the effectiveness of cultivated land preservation remains unclear at the national scale. On the one hand, the academy claims that cultivated land preservation policies have been considered vital in reducing the rate of cultivated land loss [
29]. The nationwide cultivated land loss has declined significantly from an average annual decline of 930 thousand hectares between 1999 and 2005 to 67 thousand hectares since 2006 [
30]. During 1999–2008, 21,011 km
2 of cultivated land was lost, whereas 27,677 km
2 of cultivated land was gained by land exploitation, consolidation, and rehabilitation, thereby indicating that a quantity balance was realized [
31]. Nonetheless, on the other hand, the researchers find that policies for controlling construction land growth and preventing cultivated land loss have been proven to be double failures [
9]. Existing policy practices create incentives for both insufficient cultivated land retention and excessive cultivated land conversion, resulting in significant inefficiencies in land use [
32]. Illegal cultivated land conversion commonly occurs in major cities [
33]. Cultivated land increase mainly relies on reclamation, but reclaimed land has poor quality and the environment is sacrificed [
22]. Thus, a quality balance of cultivated land was difficult to realize because of the loss of highly productive cultivated land and the flawed approach for adding new cultivated land [
22,
31].
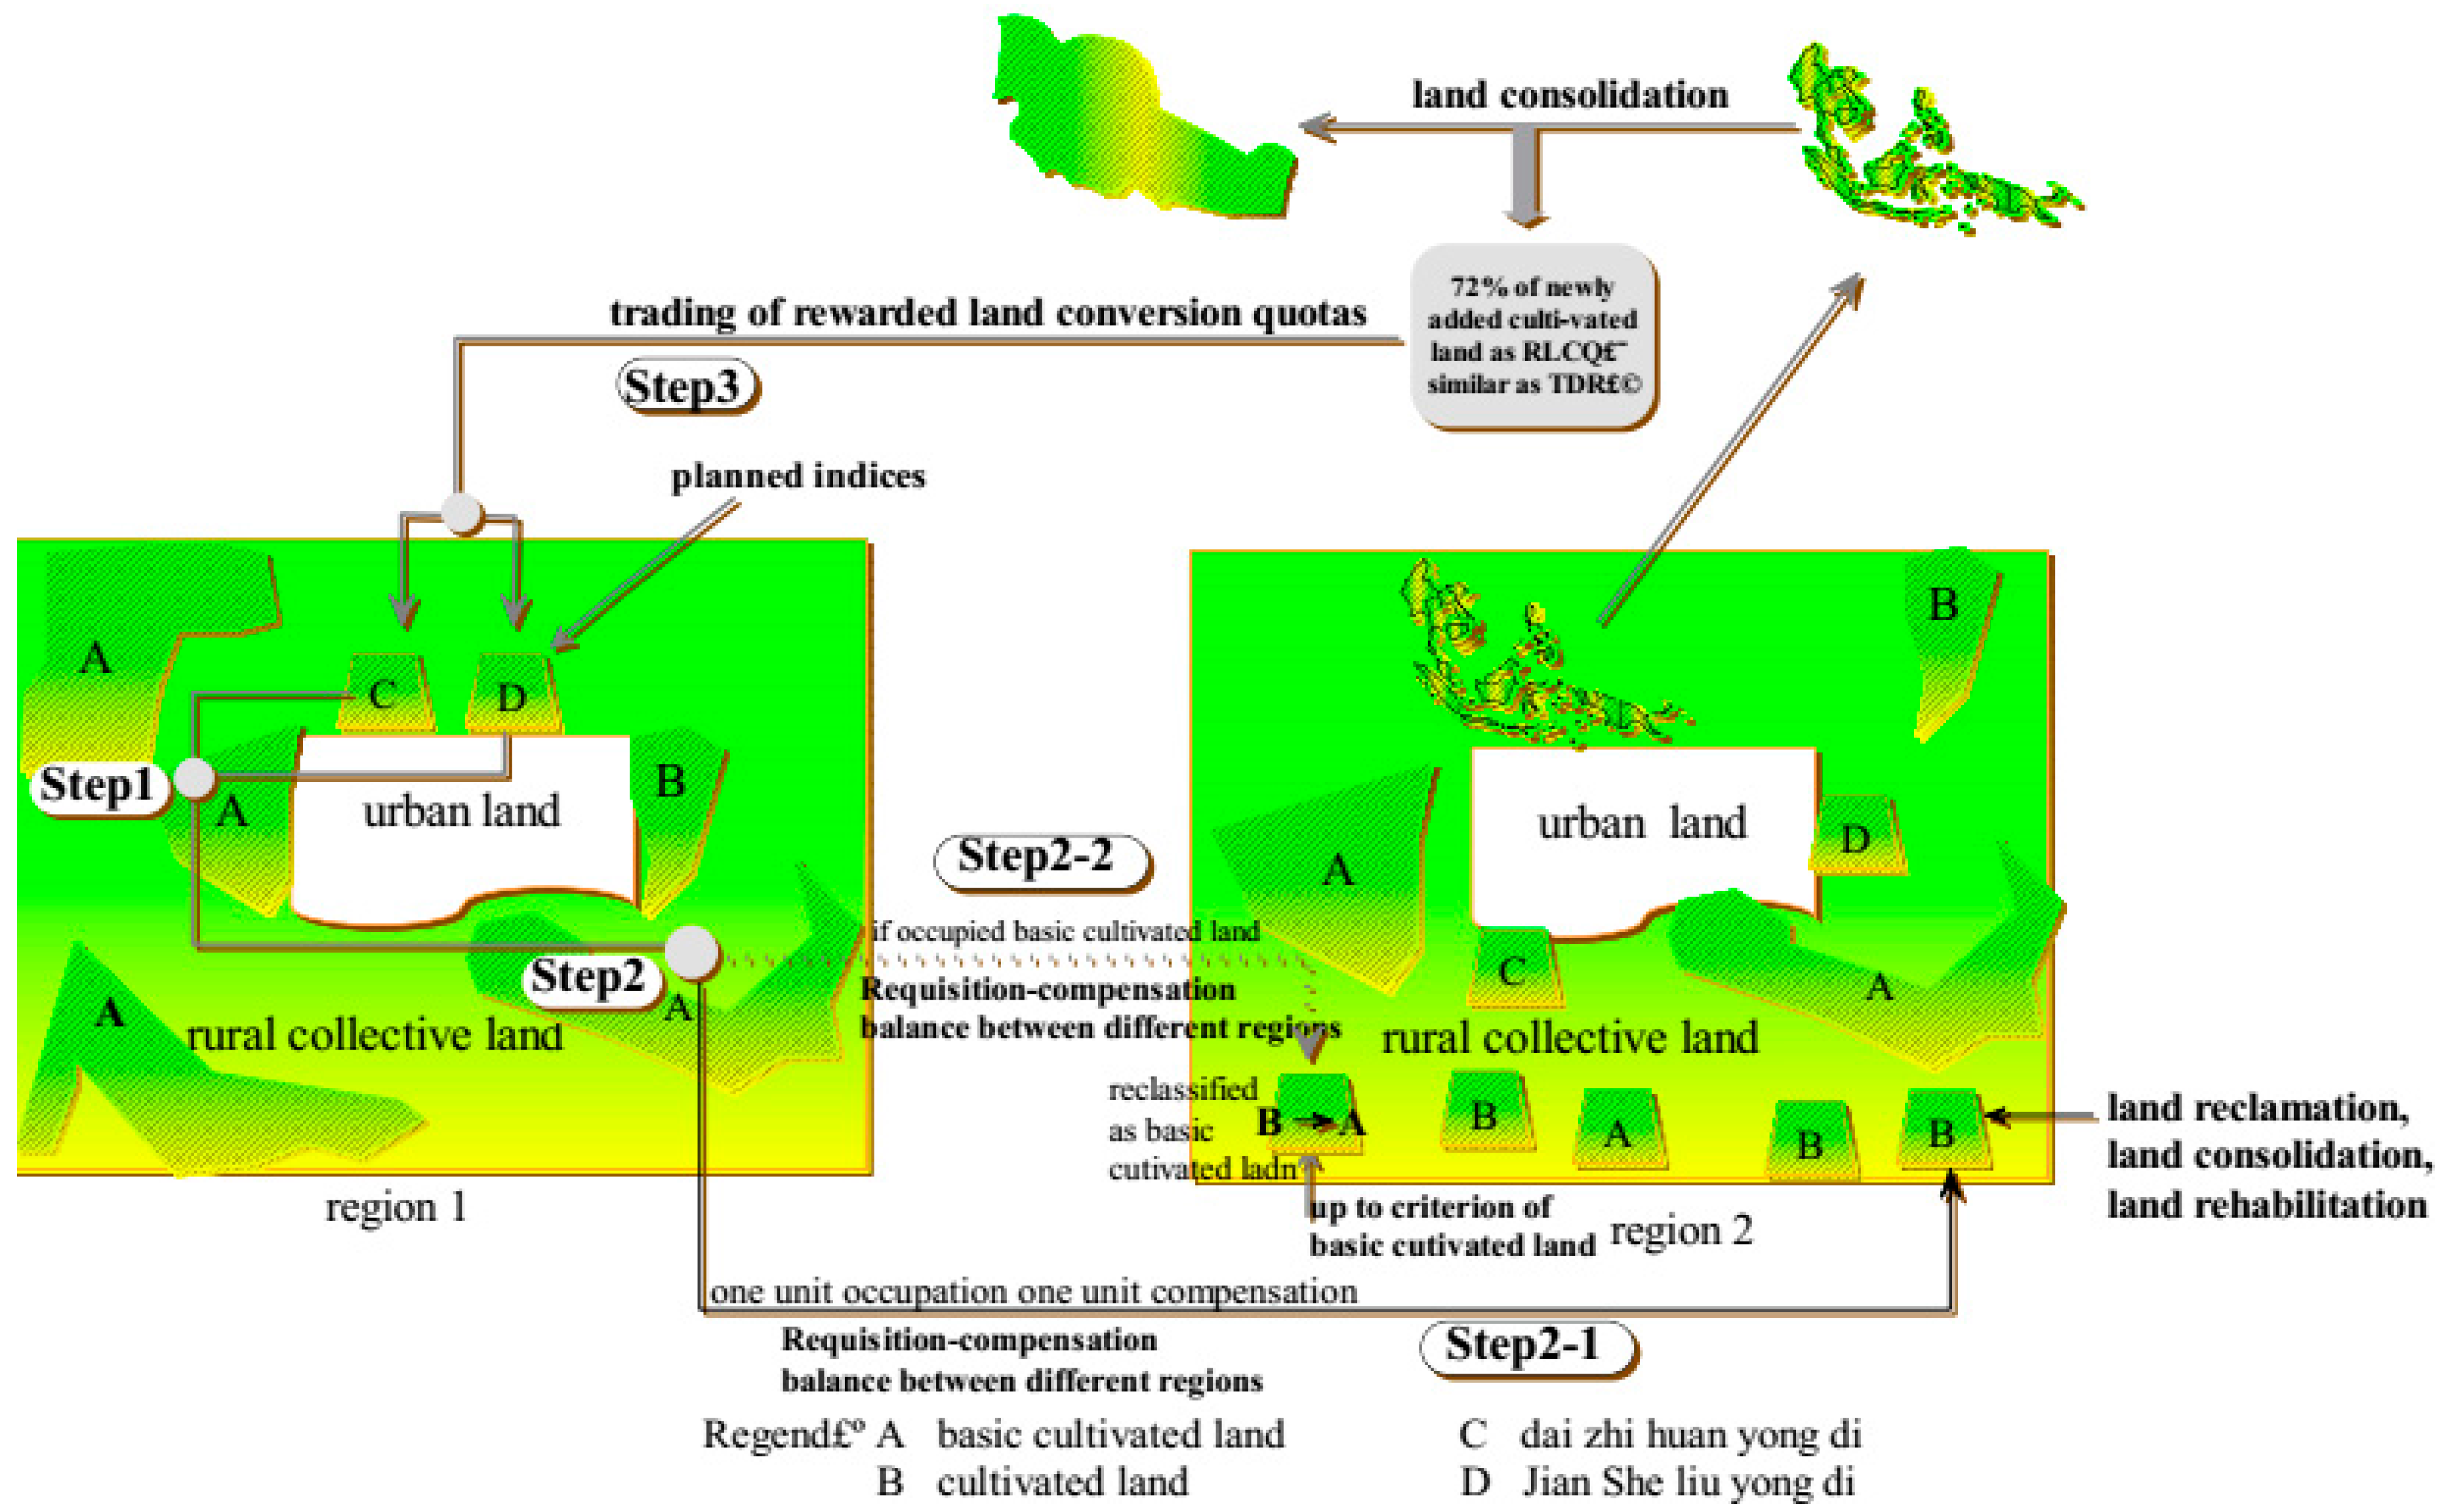
Alternative practices have been proposed by local governments to satisfy the construction demand under the existing strict cultivated land preservation measures. Such innovation was a natural response to seek development opportunities while satisfying the central government’s cultivated land regulation. One such practice is the market for rewarded land conversion quotas (RLCQ) trading established in Zhejiang Province. In such a market, developed areas buy quotas from less-developed areas for urban development, while less-developed areas trade quotas for financial compensation. With this market operation, land is more reasonably allocated, and the total amount of cultivated land preservation can be realized [
34]. An illustrative description of the RLCQ trading scheme is illustrated in
Figure 2. More details of the trading operation can be found in the pilot studies on the RLCQ trading in Zhejiang Province [
34,
35]. Wang et al. (2010) [
34] systematically introduced policy operation and qualitatively claimed that this policy facilitated both cultivated land preservation and development. Zhang et al. (2014) [
35] performed econometric analysis to assess the impact of RLCQ policy on economic development. However, no empirical studies have been conducted to investigate the impact of RLCQ on grain output, which is the central government’s critical concern regarding cultivated land preservation.
This study aims to assess the impact of the RLCQ trading policy on grain output in Zhejiang Province. The findings can provide an in-depth understanding on the innovative practices in Zhejiang Province. A difference-in-differences (DID) model is used to estimate the impacts. This paper is organized as follows.
Section 2 introduces the context and practice of RLCQ trading in Zhejiang Province.
Section 3 presents the hypotheses and the estimation model. The variables and the data source are well explained in this section.
Section 4 describes the findings of the estimation.
Section 5 presents in-depth discussion and conclusion of this research. Possible research directions in future studies are also provided in this section.
2. RLCQ Trading Policy in Zhejiang Province
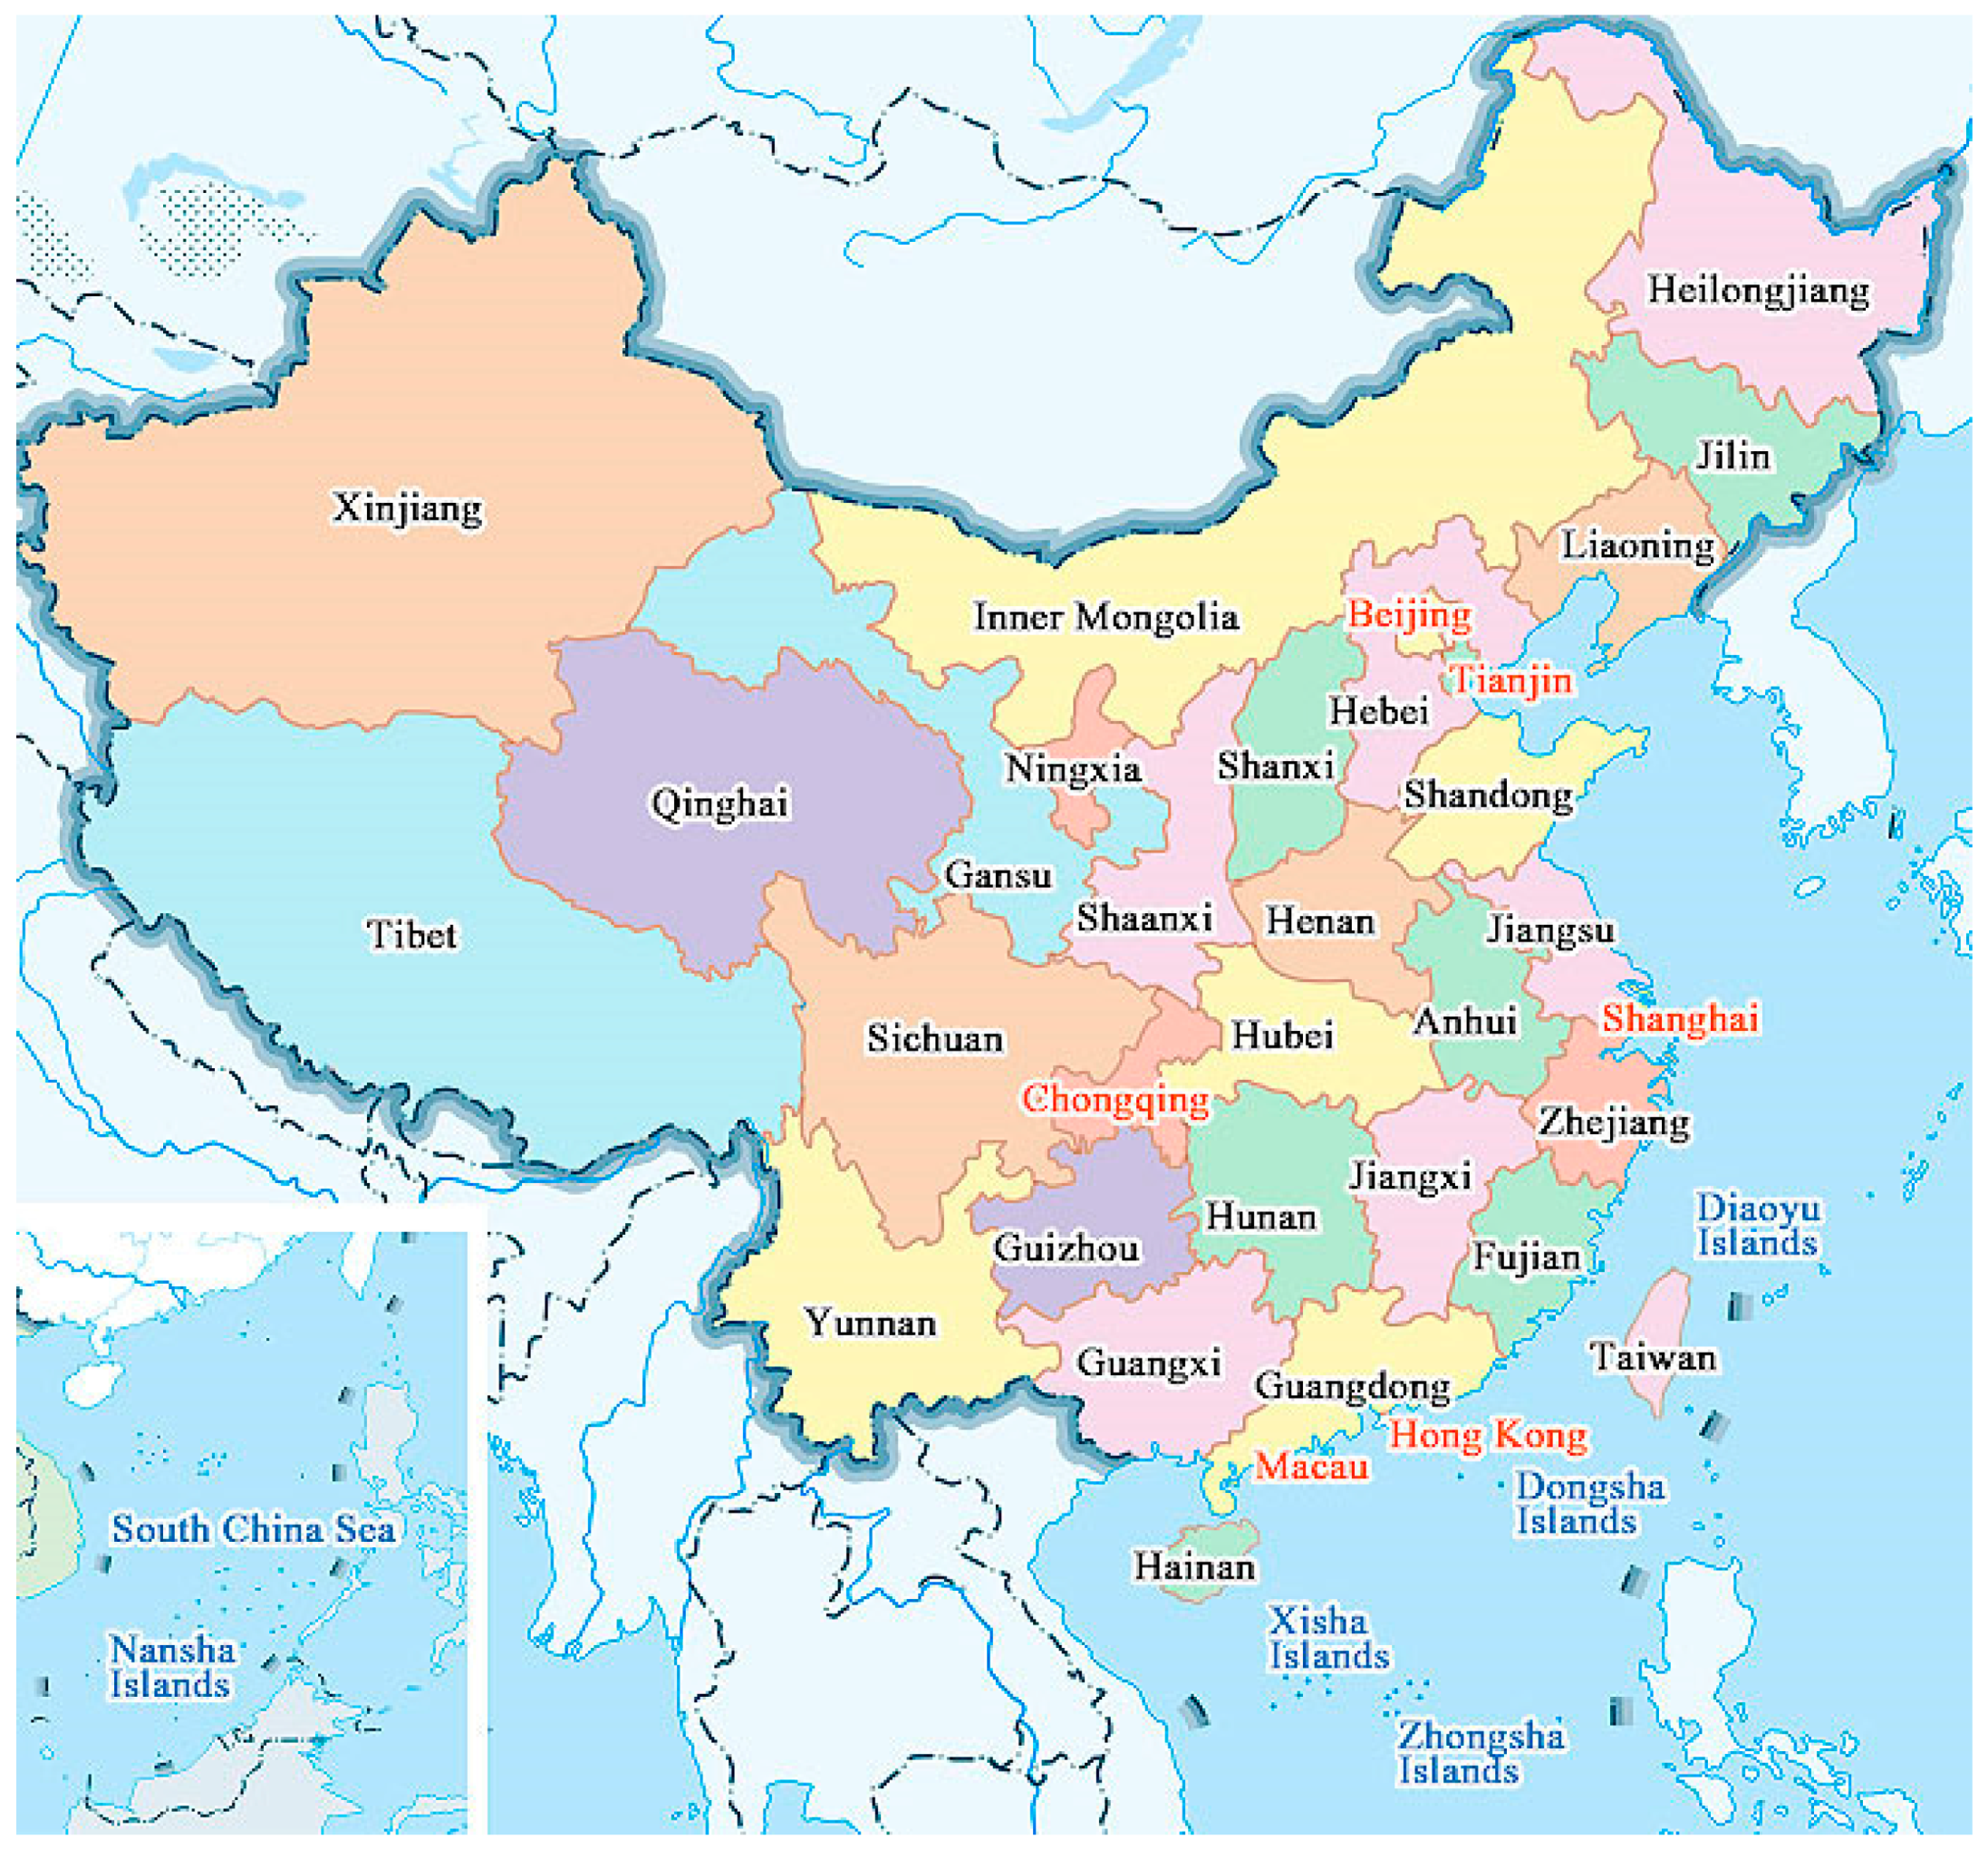
Zhejiang Province is located in the eastern part of China close to Shanghai (as shown in
Figure 3) [
36]. Zhejiang Province occupies a land area of 101.8 thousand km
2, with 81.7% of the total land being agricultural land, 12% construction land, and 6.3% ecological land at the end of 2014 [
37]. Zhejiang Province includes various types of topography, including plain, hill, basin, mountain, and costal island. The area of cultivated land is 20 thousand km
2 while the spatial distribution of cultivated land in Zhejiang Province is uneven, with 36% of the cultivated land concentrating in the plain areas of Northern Zhejiang Province [
38]. According to the second round of land surveying, Zhejiang only has 0.037 ha of cultivated land per capita, which is approximately one-third of the national average at the end of 2009 [
39]. At the end of 2015, the total number of population is 55.39 million with a urbanization rate of 65.8% in Zhejiang Province. Meanwhile, the GDP of Zhejiang Province is CNY 4288.6 billion with the first industry as CNY 183.3 billion, the second industry as CNY 1970.7 billion, and the tertiary industry as CNY 2134.7 billion at the end of 2015. Although Zhejiang Province is one of the most rapidly developing areas, its economic development has always been hindered by the mismatch between the high demand for land and the severe shortage of land supply. According to the CLUP of Zhejiang Province from 1997 to 2010, 85% of its cultivated land was classified as basic farmland, and only a portion of the remaining 15%, which was approximately 66,667 ha, can be converted into construction land. In reality, the planning quotas for the construction land stipulated in the comprehensive and annual plans were smaller than Zhejiang’s actual demand for land in the period of 1997–2010. Zhejiang’s case is worsened by the “dynamic balance” principle, which requires the province Zhejiang to generate 77,333 ha of cultivated land by land exploitation and consolidation in this period to offset the cultivated land loss caused by various non-agricultural construction uses.
Confronted by the dilemma between the strict land conversion constraint imposed by the centrally mandated land policy and the huge demand for construction land in reality, the Zhejiang provincial government initiated the Rewarded Land Conversion Quotas (RLCQ) trading scheme in 1998 to accommodate the needs for both economic development and land preservation. According to Article 18 of the Regulations on the Implementation of the Land Administration Law of the People’s Republic of China (1999), “60% of the area of the newly-added cultivated land through land consolidation may be used to compensate for the cultivated land occupied for construction”. In reality, on the basis of a flexible interpretation of this Article, the Zhejiang provincial government stipulated that 30% of the total expected area of the newly increased cultivated land can be used as construction land in advance, and 60% of the remaining part can also be used as construction land after the land consolidation projects are accomplished. Thus, if land quality is improved and cultivated land quantity is increased after land consolidation, an equivalent area of 72% of the newly added cultivated land can be added to the land conversion quotas for non-agricultural construction use. The remaining 28% will be allocated as basic farmland. This RLCQ trading scheme greatly aroused the enthusiasm of local governments to promote land consolidation and consequently earn “rewarded” land conversion quotas for construction use, thus mitigating the shortage of construction land supply.
However, in reality, because of the differences in land endowment and economic development level, a number of more economically advanced regions, such as Hangzhou and Ningbo, can hardly meet their demands for construction land even with the rewarded quotas obtained by land consolidation within their own jurisdictions. Meanwhile, in less-developed regions, such as Lishui and Quzhou, the rewarded quotas obtained by land consolidation cannot be fully utilized. Therefore, to create a win-win situation in which developed regions could purchase additional construction land quotas and under-developed regions can earn additional fiscal revenues by selling rewarded quotas, the Zhejiang provincial government stipulated in September 1999 that the rewarded land conversion quotas (RLCQ) obtained by land consolidation can be traded between localities on a voluntary basis. Since then, the RLCQ trading policy, a market-based land management tool, had been widely adopted by local governments in Zhejiang Province. In 1999, the first year after the market was established, only 18 of 101 jurisdictions in Zhejiang Province participated in trading. Nonetheless, since 2000, nearly all of the county-level localities in Zhejiang Province had taken part in trading at least once either as buyers or sellers of RLCQ. The total areas of land quotas traded have amounted to approximately 50,000 ha, and the total amount of trading has reached more than CNY 14 billion.
This policy provides a useful tool for advancing urbanization and industrialization. However, existing results demonstrate that while a quantity balance can be easily attained, a quality balance is difficult to maintain for cultivated land preservation. The quantity and quality of cultivated land is directly related to grain production, and the purpose of China’s cultivated land preservation is to ensure that the country can provide its people with adequate grain. Therefore, investigating cultivated land preservation from a perspective of grain output is reasonable. If RLCQ trading exerts a great impact on grain production, then its negative impact should be evaluated with respect to the positive impact claimed by its supporters [
34]. Whether RLCQ trading decreases or increases grain output remains unknown. Therefore, this empirical study aims to assess the impact of RLCQ trading on grain output to gain a better understanding on this policy.
3. Research Methods
3.1. Hypotheses
Although RLCQ trading has been proven successful in promoting economic development, its implementation raises two main questions in terms of grain output. First, the central government adopted a very strict limitation for basic farmland occupation, that is, high-quality cultivated land, to prevent them from being easily converted into construction land. However, under the RLCQ trading scheme, local governments can circumvent the central government’s limitation through a created land policy: the “Dai zhi huan yong di qu”. Thus, many basic farmland are still occupied by local governments provided that they have a land quota. If the quality of supplementary cultivated land is not as good as that of the occupied cultivated land, then grain output would decline. Second, to absorb capital investment and thus promote local economic development under a “competition for growth” among jurisdictions, the local governments of counties must offer more attractive conditions and low industrial land prices. A “zero” land price is in fact most frequently used. Thus, the land would not be valued adequately because of its low cost leading to further occupation of high-quality cultivated land, according to economics theory. Therefore, when a county buys land quotas for economic development, that county would only experience a more severe grain reduction. Furthermore, when a region buys more land quotas, more cultivated land would be occupied for economic development, ultimately resulting in less grain output.
In view of the abovementioned questions, we formulate three hypotheses to analyze how RLCQ trading policy might affect cultivated land preservation.
Hypotheses 1: Both buyers and sellers of quotas contribute to the decrease in total grain output and grain output per hectare.
Hypotheses 2: Buyers of land quotas experience a more severe grain reduction than sellers, and when buyers and sellers are both specified as county, the gap of grain reduction is larger.
Hypotheses 3: Buying more quotas result in decreased total grain output and grain output per hectare in the region.
3.2. Model Specification, Variables, and Data
This study uses difference-in-differences (DID) methods to estimate the impacts. Some of the districts involved in RLCQ trading match either as buyers or as sellers, whereas some of the districts did not match in a certain year. We regard the former as the treatment group, and the latter as the control group. Thus, the analysis is similar to a quasi-experiment. For a real experiment, the treatment and control groups must be randomly sampled. However, for a quasi-experiment, the treatment and control groups may change depending on the specific policy. Therefore, to control the system differences between the control and treatment groups, we need data from two periods: the pretreatment stage (pre-treatment), which is the period before a policy is implemented, and the post-processing stage (post-treatment). In this way, we can measure the difference between the treatment and control groups before and after policy implementation to evaluate the effect of the policy. The basic model is specified as follows:
where
represents the agricultural production for concerned area
given time
in our case.
and
are dummy variables.
represents the sample in the control group, and
represents the sample in the treatment group.
indicates that the time is before policy implementation, and
indicates that the time is after policy implementation. The interactive item
is a dummy variable indicating treatment status. The meaning of corresponding parameters is listed as follows:
However, the model requires further extensions so that it can be applied in this study. The districts involved in RLCQ trading that match, either as buyers or as sellers, can be considered as a whole. However, the impact on grain output for buyers in a trading match may differ from that for sellers. Thus, we investigate their effects separately. In addition, control variables must be added to ensure that the treatment effect is pure. The extended DID equation is listed as follows:
where
represents the C-D production function. Compared with other production functions, the C-D production function is more suitable for agricultural production because it has a simpler structure and is easier to analyze. Under the condition of constant technology, all kinds of factors in this function hold the law of diminishing marginal productivity, whereas the input proportion of factors determine the marginal contribution of each factor on the output. Technology progress is neglected because of the limited time span in our cases. We believe that the above characteristics can accurately reflect the relationship between the input and output of agricultural production.
stands for a number of key dummy variables as follows:
dt implies whether concerned area
i has participated in quota trading in year
t (1 for participation while 0 for no participation);
quota_buyer explains whether concerned area
i has bought quota in year
t (1 for buying while 0 for not buying);
quota_seller explains whether concerned area
i has sold quota in year
t (1 for selling while 0 for not selling);
county_in explains whether the quota buying area is a county (1 for a county while 0 for not a county);
county_out explains whether the quota selling area is a county (1 for a county while 0 for not a county). In addition, the demand of occupying cultivated land will be large if the area buys a large number of quotas. Therefore, this study also includes the number of buying quotas for concerned area
i in year
t as a key independent variable in order to check its influence on grain output and grain output per hectare.
represents a series of agricultural production factors, including agricultural labor force, agricultural capital investment, and cultivated land input. It should be noticed that all control variables are measured in total amount when investigating the impacts on grain output while measured in unit of per hectare when investigating the impacts on grain output per hectare.
The variables used in this study and their detailed descriptions are summarized in
Table 1 and
Table 2.
The data includes two parts. The data on RLCQ trading were obtained from internal statistics offered by the Zhejiang Provincial Department of Land and Resources. The data on control variables, such as agricultural labor force, agricultural capital investment, and cultivated land input, were collected from Zhejiang Statistical Yearbooks. Thus, a panel dataset is formed for the local jurisdictions in Zhejiang Province, including 11 urban districts (shiqu) as well as 57 counties and county-level cities, for the period of 1990–2013. It should be noticed that one of the counties, Shensi county is excluded for analysis due to data missing. Given that the RLCQ trading policy was started in 1999 and ended in 2008, both the periods of 1990–1998 and 2009–2013 can be considered control periods.
Table 3 presents the descriptive statistics of the variables in the models.
4. Empirical Results
Three methods are generally used to estimate the panel data model. Pooled OLS method is suitable for no obvious individual effect. Fixed effect method is suitable for the individual effect associated with other explanatory variables. Random effect method is suitable when the individual effect has no correlation with the other explanatory variables. Therefore, we first test the individual effect, and if an individual effect exists, we then test whether the individual effect is fixed or random.
The test results indicate that the individual effect is statistically significant, as shown in
Table 4. The result of the Hausman test supports fixed effect method. In addition, we tested for heteroscedasticity and autocorrelation, and the results indicate that there exist problems of heteroscedasticity and autocorrelation.
To adjust the bias caused by heteroscedasticity and autocorrelation, we used the Driscoll-Kraay robust standard error with heteroscedasticity and AR(1) in the fixed effect model.
Table 5 and
Table 6 presents the regression results with total grain output and grain output per hectare as dependent variable, respectively.
The first column of
Table 5 and
Table 6 prove Hypothesis 1. Our key variable,
dt’s coefficient, is negative and strongly significant (at 1% level). Given the use of the logarithmic linearization model, the interpretation of the coefficient is different from linear equations; rather, it is interpreted as either elastic or semi-elastic. That is, on average, the total grain output of the localities that participated in land quota trading declined by 29.6% compared to those that did not, and the grain output per hectare declined by 29.4%. These findings suggest that the participation of localities in land quota trading either as buyers or as sellers leads to decreased total grain output and grain output per hectare.
In the second column of
Table 5 and
Table 6, we separated buyers and sellers into two dummy variables to investigate whether they exert different effects. The coefficients of both buyers and sellers are statistically significant at the 1% or 5% levels, and have the expected negative signs. However, evidence of the magnitude of their effects on grain output is somewhat weaker. Although the total grain output and grain output per hectare of the buyers indeed declined a bit more than that of the sellers, no substantial difference was observed. However, when buyers and sellers are both specified as county, the gap of grain reduction is indeed larger. Although the coefficient for sellers as county is not significant, its value is negative. The total grain output of the buyers as county decreased by 18.3%, which is more than that of the sellers as county by 0.2%; and the grain output per hectare decreased by 27.6%, which is more than that of the sellers as county by 0.4%. Therefore, empirical evidence supports Hypothesis 2 to some extent. It is easy to understand why the total grain output and grain output per hectare decrease for buyers, as such regions intend to occupy more cultivated land for development through buying quotas. However, it is a little difficult to comprehend why the total grain output and grain output per hectare decrease for sellers. Such results are echoed with the real practice. In practice, land arrangement, reclamation and exploitation are usually conducted for obtaining quotas for exchange, and therefore, the quality of new cultivated land obtained through such ways is usually lower than that of occupied for construction. Hence, although the quantity of cultivated land may remain unchanged or even little increase, the total grain output and grain output per hectare would decrease due to decreased quality of cultivated land. In addition, compared with the coefficient of
quota_buyer and
county_in, we could find that the decrease of total grain output and grain output per hectare for buyers as country is 6% and 5% higher than those for quota buyer respectively. These results are also consistent with the practices. County is usually taken as undeveloped areas, however, it is undergoing rapid development if the county demands large amount of quotas or even buys quotas from other areas. During the rapid development process, much more cultivated land with high quality in sub-urban areas would be occupied. Therefore, the total grain output and grain output per hectare would rapidly decreas compared with other regions. On the other hand, compared with the coefficient of
quota_seller and
county_out, we could find that the decrease of total grain output and grain output per hectare for sellers as county is insignificant than those of quota seller. For county demands comparatively few quotas or even sells quotas for other regions, it is usually in slow development process or given with large amount of cultivated land. Due to slow development, comparatively few amount of cultivated land is occupied for construction, and therefore the impacts of quota trading is comparatively smaller than other regions.
The third column of
Table 5 and
Table 6 proves Hypothesis 3. The estimated coefficients suggest that when a region buys more land quota, total grain output and grain output per hectare would decrease. In detail, a 1-hectare increase in buying land quota decreased the total grain output and grain output per hectare by 0.036% and 0.035%, respectively. Although the magnitudes of the coefficients are relatively small, they are statistically significant at the 1% level.
Robustness analysis is conducted to ensure the reliability of the findings. Firstly, all key independent variables are put into one regression model to investigate whether the results would be changed. Second, one-year-lag is used for key independent variables as using the trading quotas to occupy cultivated land may be lagged in practice. For investigating the impacts on total grain output,
Table 5 demonstrates that the coefficient of
quota_buyer,
quota_seller, and
tradein_area are still negative with even little change of the value, although the significance reduces a little. The change remains the same for the regression with one-year-lag. For investigating the impacts on grain output per hectare,
Table 6 demonstrates that the coefficient of
quota_seller, and
tradein_area are insignificant. The change remains the same for the regression with one-year-lag. Such findings suggest that selling quota or buying quota may have none influence on the grain output per hectare, which needs more detailed investigations in future studies. Overall, the results have a good reliability in the robustness analysis.
In addition, the results for other control variables in all of the ten models are highly consistent. Moreover, the models fit the data well as a whole. Nearly all of the other coefficients are significantly different from zero and have the expected signs, except for rural power and rural power per hectare. For agricultural labor force, the coefficients are statistically significant at the 1% level, and a 1% increase in agricultural labor force or labor force per hectare resulted in a 15.9% increase in total grain output and a 19.4% increase in grain output per hectare, respectively. Three proxy variables are available for agricultural capital investment: general agriculture machine, chemical fertilizer, and rural power. Although the coefficients of general agriculture machine are not statistically significant, they have the expected positive signs. The coefficients of chemical fertilizer are statistically significant at the 5% level and also have the expected positive signs, indicating that chemical fertilizer is still important for increasing grain production. Surprisingly, the coefficients of rural power have negative signs and are statistically significant at the 1% level. One possible explanation is that a large number of rural power was not used for agriculture production and was wasted for other purposes. For cultivated land input, the four proxy variables are sown area, ploughed area by tractors, irrigated area, and stable yields ensured despite disasters. All of them have the expected positive signs and part of them are statistically significant at the 5% or 10% level. In sum, the regression results of the control variables are consistent with the theory of agricultural production.
5. Discussions and Conclusions
RLCQ trading results in decreased agricultural production, measured in both total grain output and grain output per hectare, for both buyers and sellers. This finding contradicts Wang et al. (2010)’s [
34] claim that RLCQ trading facilitates cultivated land preservation in terms of grain production. Our empirical study has higher reliability than that of Wang et al. (2010) [
34], as their conclusion is merely based on cultivated land quantity. Existing studies emphasized that quality of cultivated land plays a more important role than quantity of cultivated land in cultivated land protection. Therefore, total grain output and grain output per hectare, which consider both quality and quantity of cultivated land, are more adequate variables for assessing the impacts on cultivated land preservation. The results imply that specific measures should be designed if we intend to use RLCQ trading for cultivated land preservation.
Buyers of land quotas would experience a more severe grain reduction than sellers. Buyers are in a better position for industrialization and urban development, which demand much more construction land preset by the ALUP and the CLUP. The core issue is that these areas also have more high-quality cultivated land in and around the cities. Occupation of such high-quality cultivated land is generally inevitable for economic development. Therefore, with RLCQ trading, much more high-quality cultivated land would be converted for construction use, as more land-use quotas would be obtained through RLCQ trading. The empirical finding also implies that the purchase of more land quota corresponds to a greater loss in grain output and grain output per hectare. This echoes with our observation in the field study that cultivated land increase usually results from land exploitation with lower quality. These findings suggest that RLCQ trading is not successful in cultivated land preservation and the central government ceased RLCQ trading in Zhejiang Province in 2008. However, the academy and local government of Zhejiang Province are still concerned about the possibility of restarting RLCQ trading in Zhejiang Province, while some similar practices are implemented in other provinces. Therefore, it is still important to comprehensively assess the impacts of the RLCQ trading in Zhejiang Province.
Cultivated land loss is a typical consequence of economic development and rapid urbanization. Innovative measures, such as dynamic balance and RLCQ trading, contribute little to cultivated land preservation, as these schemes are mainly targeted toward economic development rather than cultivated land preservation. If we insist on cultivated land preservation for food security, due attention should be paid to the intensive use of existing construction land and the consolidation for improving the quality of cultivated land. However, within a certain space, the potential of consolidation is generally also limited. Recognizing this dilemma, local governments should improve the land market mechanism by encouraging better allocation of land use for intensive use and consolidation. In addition, this research has certain implications for cultivated preservation in other countries or regions. It is usually difficult to balance the demand of construction occupation and grain production on cultivated land, especially for rapid developing countries. The quality rather than mere quantity of cultivated land should be emphasized in any cultivated preservation practices. As well, by learning the foreign lessons, local practices should be developed to better fit the local context. More importantly, any practices should be assessed to better understand its claimed objectives and real impacts.
This study assessed the impact of RLCQ trading on grain output in Zhejiang Province. The empirical results demonstrate that RLCQ trading decreases both total grain output and grain output per hectare for both buyers and sellers. Therefore, RLCQ trading contributes little to cultivated land preservation for grain production and food security, in contrast to the claims of other researchers. Future studies should examine the impacts of RLCQ trading on the environment and social development. With such systematic analysis, both the benefits and drawbacks of RLCQ trading can be comprehensively understood. In this way, appropriate market rules can be designed for cultivated land preservation rather than merely relying on administrative instruction. Such careful investigation is useful to make effective policies to ensure grain production and food security in China.


