Article

Urban Green Infrastructure Impacts on Climate Regulation Services in Sydney, Australia

1
CSIRO Land & Water, PMB 1, Aspendale VIC 3195, Australia
2
CSIRO Land & Water, Clunies Ross St., Black Mountain ACT 2601, Australia
*
Author to whom correspondence should be addressed.
Sustainability 2016, 8(8), 788; https://doi.org/10.3390/su8080788
Submission received: 1 April 2016 / Revised: 31 July 2016 / Accepted: 6 August 2016 / Published: 11 August 2016
(This article belongs to the Special Issue Maintaining Ecosystem Services to Support Urban Needs)

Abstract

:
In many parts of the world, urban planning has a renewed focus on addressing the multiple challenges associated with population growth and climate change. Focused on local needs and priorities, these planning processes are raising tensions between more compact and dense urban form to reduce energy use and associated emissions and the provision of urban green infrastructure for ecosystem services and climate adaptation. In this study, we investigated the spatial distribution of green infrastructure at the neighbourhood scale in Sydney, Australia and examined how a mix of landscape types (pavement, bare soil/dry grass, green grass, and tree cover) affect temperature variation in three important locations for urban residents—around the home, in the roads and footpaths where people walk, and in parkland areas. Considering that residential and parkland areas contribute to the majority of green space in Sydney, it is important to understand how changes in landscape mix within these three neighbourhood areas will affect local temperature for urban residents. For residential houses, it was found that the percentage of tree canopy cover around the house had a significant negative relationship (p = 0.002) with surface temperatures of rooftops where greater tree cover led to lower rooftop temperatures. In streetscapes, both the percentage of tree cover (p < 0.0001) and the percentage of green grass (p < 0.0001) within the road segment had a significant negative relationship with the surface temperature of the road pavement. In the parks, the percentage of pavement (p < 0.0001) and the percentage of bare soil/dry grass (p < 0.0001) showed a significantly positive trend with land surface temperatures where greater land cover in the form of pavement and bare soil/dry grass led to higher temperatures. Collectively, these findings highlight the importance of promoting or reducing certain landscape covers depending on the land use type in order to maximise the cooling potential of green infrastructure.

1. Introduction

In response to the dual global challenges of climate change and urbanisation, many cities around the world are placing renewed emphasis on urban planning and design processes to drive the transition towards a more sustainable and climate resilient future [1,2,3]. Cities are proving more willing and able to act on climate change, with many having already assessed their climate risks, formulated plans, and commenced mitigation and adaptation actions [4].
One of the main climate change challenges in urban centres is the interaction of high-density human habitation with increased urban heat patterns, especially that of the urban heat island. Cities tend to have higher air and surface temperatures than their rural surroundings because urban form and materials store and trap heat. This is a phenomenon known as urban heat island [5], and it has been highlighted as a factor in exacerbating several health problems within urban areas—including cardiovascular disease and diabetes [6,7]. Additionally, heatwaves have been identified as having a major climate impact and are typically associated with high human morbidity and mortality [8,9,10].
Green infrastructure typically refers to an interconnected network of multifunctional green spaces, strategically planned and managed to provide a range of ecological, social, and economic benefits [11,12]. Development of green infrastructure has been driven by changes in local demand and urban form over time, but in the past decade it has attracted burgeoning interest, including notably its potential as a climate change intervention [13]. The benefits of green infrastructure have been widely expounded [14,15,16], particularly in the context of climate adaptation to reduce the impact of rising temperatures and more frequent and severe heatwaves [17,18,19]. In this regard, green infrastructure has a key role to play in reducing the amount of solar radiation that is absorbed into building materials such as walls, roofs, and pavements during the day and released at night [20]. For example, modelling studies show that increasing the proportion of tree canopy cover in the urban environment can reduce both surface and air temperatures [18,21,22], and modelling of green infrastructure impacts on future climate change scenarios show that a 20% increase in green cover could reduce surface temperatures by 2 °C in 2050 [23]. Furthermore, strategically located trees adjacent to residential buildings can reduce the energy required for household cooling during hot weather [24,25,26,27,28].
Green infrastructure, thus, constitutes an important local response to a pressing urban problem [13]. This issue is particularly pertinent in Sydney, Australia, where the major planning paradigm is for increased residential densities through more compact urban form [29,30,31]. The population of Sydney is projected to grow from 4.3 million to 5.6 million people by 2031, requiring an additional 545,000 homes and associated urban infrastructure [32]. The majority of this growth is expected to occur within existing urban areas through urban consolidation. As such, there is growing interest in the processes for transforming Australian suburbs [33], which typically are of low density and characterised by single detached houses on large blocks of land [34].
However, with increasing urban growth, houses are being built on smaller blocks of land, leading to smaller yards and less area for green space around homes [35]. There are clearly many questions around the compatibility of strategies to increase green infrastructure in urban areas to reduce the urban heat island effect, given the trend for more compact and dense urban form. It would seem that existing urban vegetation will be under increasing threat from urban infill [36], while new urban development often has little space for vegetation [27]. Of course, it must also be acknowledged that green space on private residential land is difficult for governments to manage or incentivise [36,37].
Yet, private yards are important because they provide city residents with immediately available urban green space [38,39]. In fact, like many other cities, residential land use comprises more than half (52%) of the land area within urban Sydney, which is more than double that of the next largest land use, parkland (23%) [40]. There have been suggestions that as urban densities are increased, any subsequent loss of private residential green space may be offset by better public green infrastructure, such as parkland [41], but there is little evidence these offsets are occurring in reality [42].
Here, we present an analysis undertaken in Sydney, Australia, where decision-makers are grappling with these issues of how to adapt to the likely impacts of climate change, while at the same time planning for a growing population. Although green space is noted as a potential urban form that can reduce heat extremes for urban residents, we use remotely sensed hyperspectral data and thermal imagery to evaluate how vegetation cover at the neighbourhood scale affects climate regulation in three important spaces within the city—roof tops, streetscapes, and parklands.

2. Materials and Methods
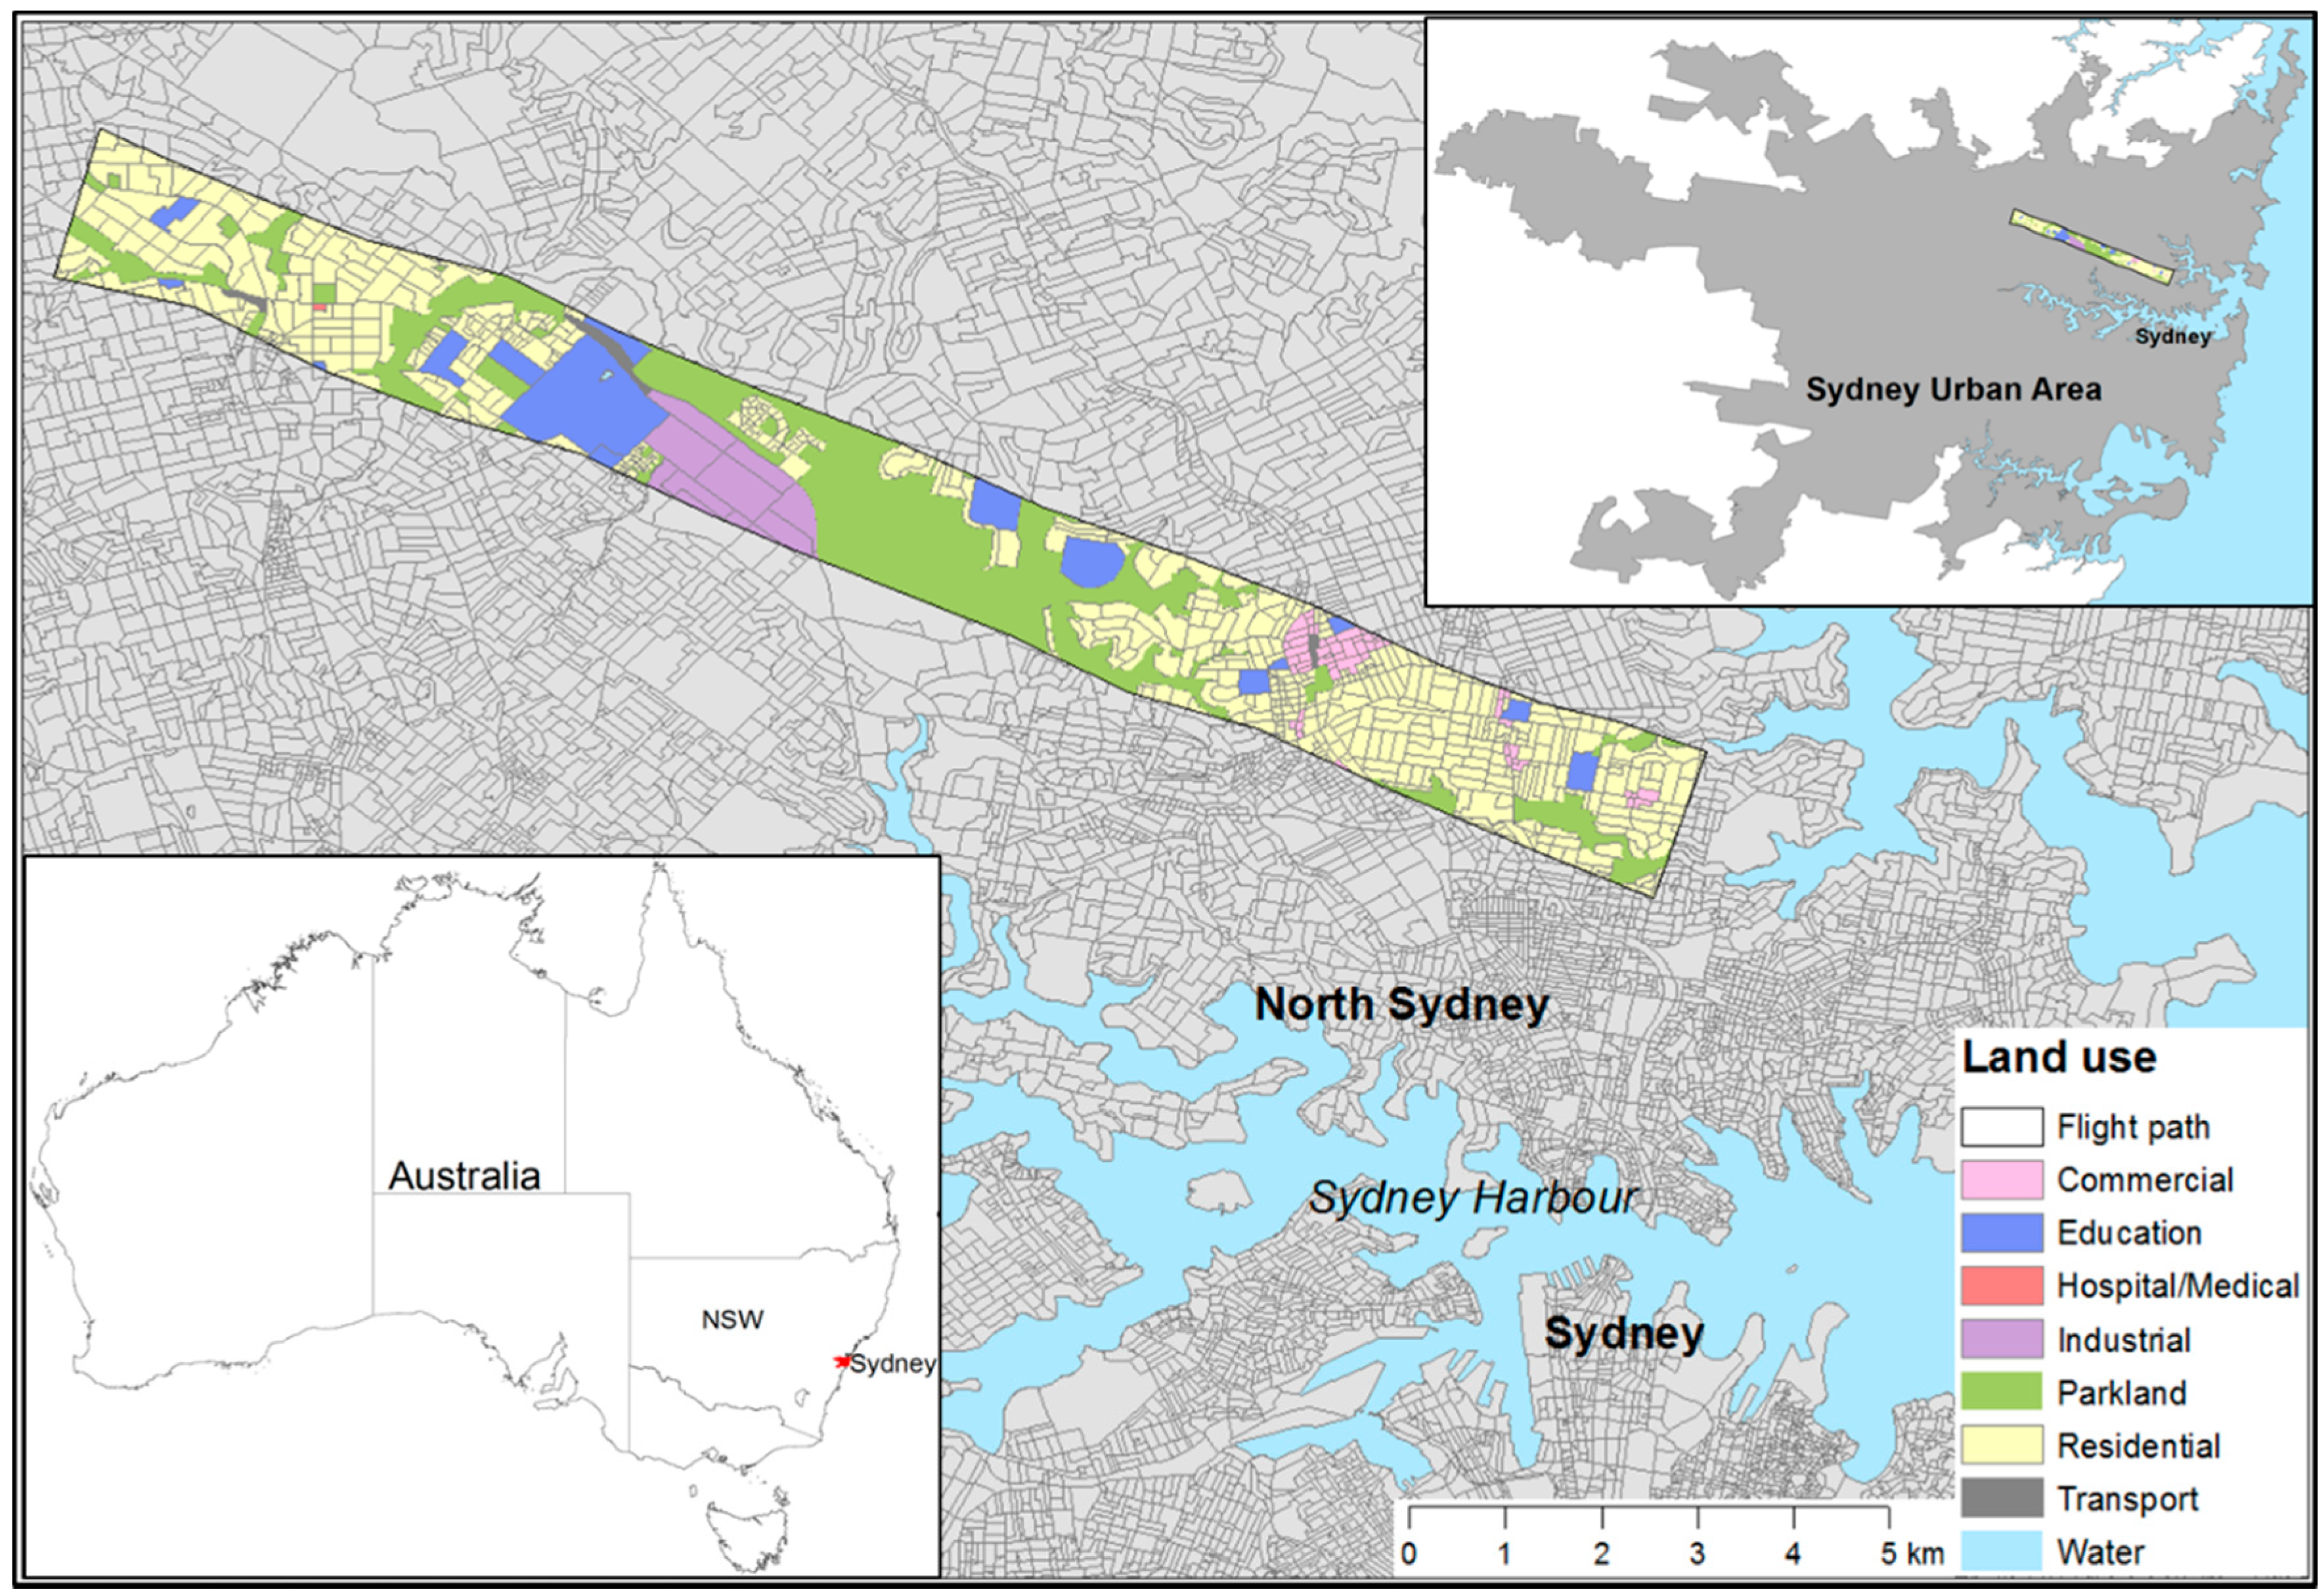
2.1. Study Area

Sydney is the capital of New South Wales (NSW) and is the largest and most densely populated city in Australia. It is located on the east coast at latitude 34°S and experiences a temperate oceanic climate with generally mild winters and warm summers [43]. The Sydney urban area identified by the Australian Statistical Geography Standard [44] restricts the boundary of Sydney to the contiguous, built up areas of the city, thereby excluding the surrounding peri-urban areas and national parks that make up the Greater Sydney Region. The Sydney urban area comprises 2037 km2, extending 70 km from the coast in the east to the Blue Mountains in the west (Figure 1).

2.2. Transect and Data Collection

A case study transect was identified in the northern suburbs to sample climate and vegetation gradients typical of Sydney (Figure 1). The company Dimap Australia Pty Ltd. (Perth, Australia) was commissioned to collect hyperspectral and thermal airborne remote sensing imagery as well as LiDAR data for the transect using a fixed wing aircraft. A data-collecting flight was flown on 6 August 2012, between 12:00 p.m. and 2:00 p.m. The aircraft departed from Sydney (Kingsford Smith) Airport, capturing data for a swath approximately 1.4 km wide and 15 km long in the northern suburbs of Sydney (Figure 1).
Hyperspectral data were captured using a Hyspex VNIR1600 camera that collected the light intensity (radiance) values for 160 spectral bands at a spatial resolution of 2 m. Thermal data were captured simultaneously using a FLIR SC series camera measuring surface temperatures at 0.5 m spatial resolution. These datasets were corrected for atmospheric influences using the ATCOR 4 software [45]. Orthorectification and geometric corrections were implemented using a digital terrain model and the PARGE software [46].
The flight transect covered a land area of just over 21 km2 with the dwelling density of residential Mesh Blocks ranging from 1 to 488 dwellings per hectare. A Mesh Block is the smallest geographical area defined by the Australian Bureau of Statistics [44]. The variation in size of residential land parcels was assessed using cadastral data provided by the NSW Department of Finance and Services, Land and Property Information. Residential land parcels within the flight transect ranged from 230 to 4000 m2 with a median parcel size of 689 m2.
A simple land cover classification at 1 m2 resolution was developed based on the airborne hyperspectral imagery and LiDAR data. Five basic land cover classes were identified: (1) pavement; (2) buildings; (3) bare ground/dry grass; (4) green grass and (5) tree canopy. The classification was undertaken using the hyperspectral data to differentiate impervious land surfaces from bare ground and vegetated areas. The LiDAR data were used to create a ground mask to distinguish between features at or above ground level (i.e., pavement from buildings or grass from trees). The tree canopy class provided a high resolution estimate of canopy cover. Accuracy of the land cover classification was evaluated by comparing the results with land cover observed in aerial photography (Google Earth) at 400 randomly selected points [47]. This indicated an overall accuracy of 82% of positive identifications, which is comparable with the classification accuracy in studies using a similar approach [27].

2.3. The Influence of Vegetation Cover on Surface Temperatures

An analysis was undertaken examining the cooling effects of adjacent land cover classes (% pavement, % bare ground/dry grass, % green grass, % tree cover) on the average surface temperatures of house roofs, road surfaces, and parkland. All GIS analyses were performed using ArcGIS 10.1 [48]. Statistical analyses were undertaken using the software program R v2.13.0 [49].

2.3.1. Roof Temperatures

A total of 37 houses were selected for the analysis of roof surface temperatures. To control for variation in the size of residential land parcels, properties were selected from within a range of 650–750 m2, approximately the median parcel size within the transect. Google Earth [50] was then used to perform a visual assessment, identifying houses with similar roof colour (grey-brown) and roof construction material (tile). We were unable to control for roof pitch based on the data collected and on the imagery from Google Earth, however, houses in Australia generally have a roof pitch of 15°–22.5°. The houses were selected because they are of a similar size, with similar roof types, and are of similar development style. Houses with varying amounts of tree canopy cover located on the north and northwestern sides of the house were selected for inclusion in the analysis. This enabled a comparison of roof temperatures for houses with varying amounts of canopy cover, ensuring consistent tree shadow given the direction of the sun during the time of the data collection flight (from true north the sun was 358° at 12:00 p.m. and 317.5° at 2:00 p.m.). The average surface temperatures of each roof top, as identified by the buildings class within the land cover classification dataset, was calculated for each selected house. This excluded areas of the roof that were covered by canopy.
A 10 m buffer was created around the northwestern corner of each house, and the % pavement, % bare ground/dry grass, % green grass, and % tree cover were calculated within the buffer. The relationship between the various land use classes within the 10 m buffer and the average rooftop temperatures was analysed using multiple regression models and tested for statistical significance.

2.3.2. Road Temperatures

Road corridors represent another dominant feature at the neighbourhood scale. Road corridors not only comprise roads, but also a significant amount of road verge which is utilised for footpaths and street tree plantings. Road corridor boundaries for 2012 were obtained from the NSW Department of Finance and Services, Land and Property Information. These data were clipped to the transect boundary creating road segments to be used for analysis. For consistency, laneways and intersections were excluded from the data by only including road segments that were larger than 0.1 ha in size. Mean road temperatures were first assessed in relation to road orientation. Then, like the house data, we wanted to ensure consistent tree shadow patterns given the direction of the sun during the time of the data collection, thus, we selected only north–south orientated road segments for inclusion in this study. This yielded a total of 145 road segments to be included for analysis.
The surface temperatures of the road corridors were determined using the airborne thermal imagery. To ensure there was no spectral mixing associated with potential overhanging tree canopy cover, the road surface temperatures were only measured where bare pavement was identified based on the land use classification dataset. Thus, the percentage of pavement within the road segment was not used as an explanatory variable within the analysis. The effect of the various other land use classes (% bare ground/dry grass, % green grass, % tree cover) on road surface temperatures was then tested using a multiple regression analysis.

2.3.3. Park Temperatures

The objective of the park analysis was to determine the influence of vegetation structure on land surface temperature (LST) within parkland. To perform this analysis, 938 random points were selected within parklands located in the transect area. The selection criteria for locating the points were that each point could be no closer than 20 m apart and that each park could have a maximum of 20 points. This helped ensure that small parks were not unduly weighted in the analysis.
At each point, a 10 m buffer was created in order to sample the percent cover of the various land use classes around each point as well as calculate an average surface temperature for the point. A multiple regression model was then used to test the significance of the relationship between average park temperature at each point and percent cover of the land use classes.

3. Results

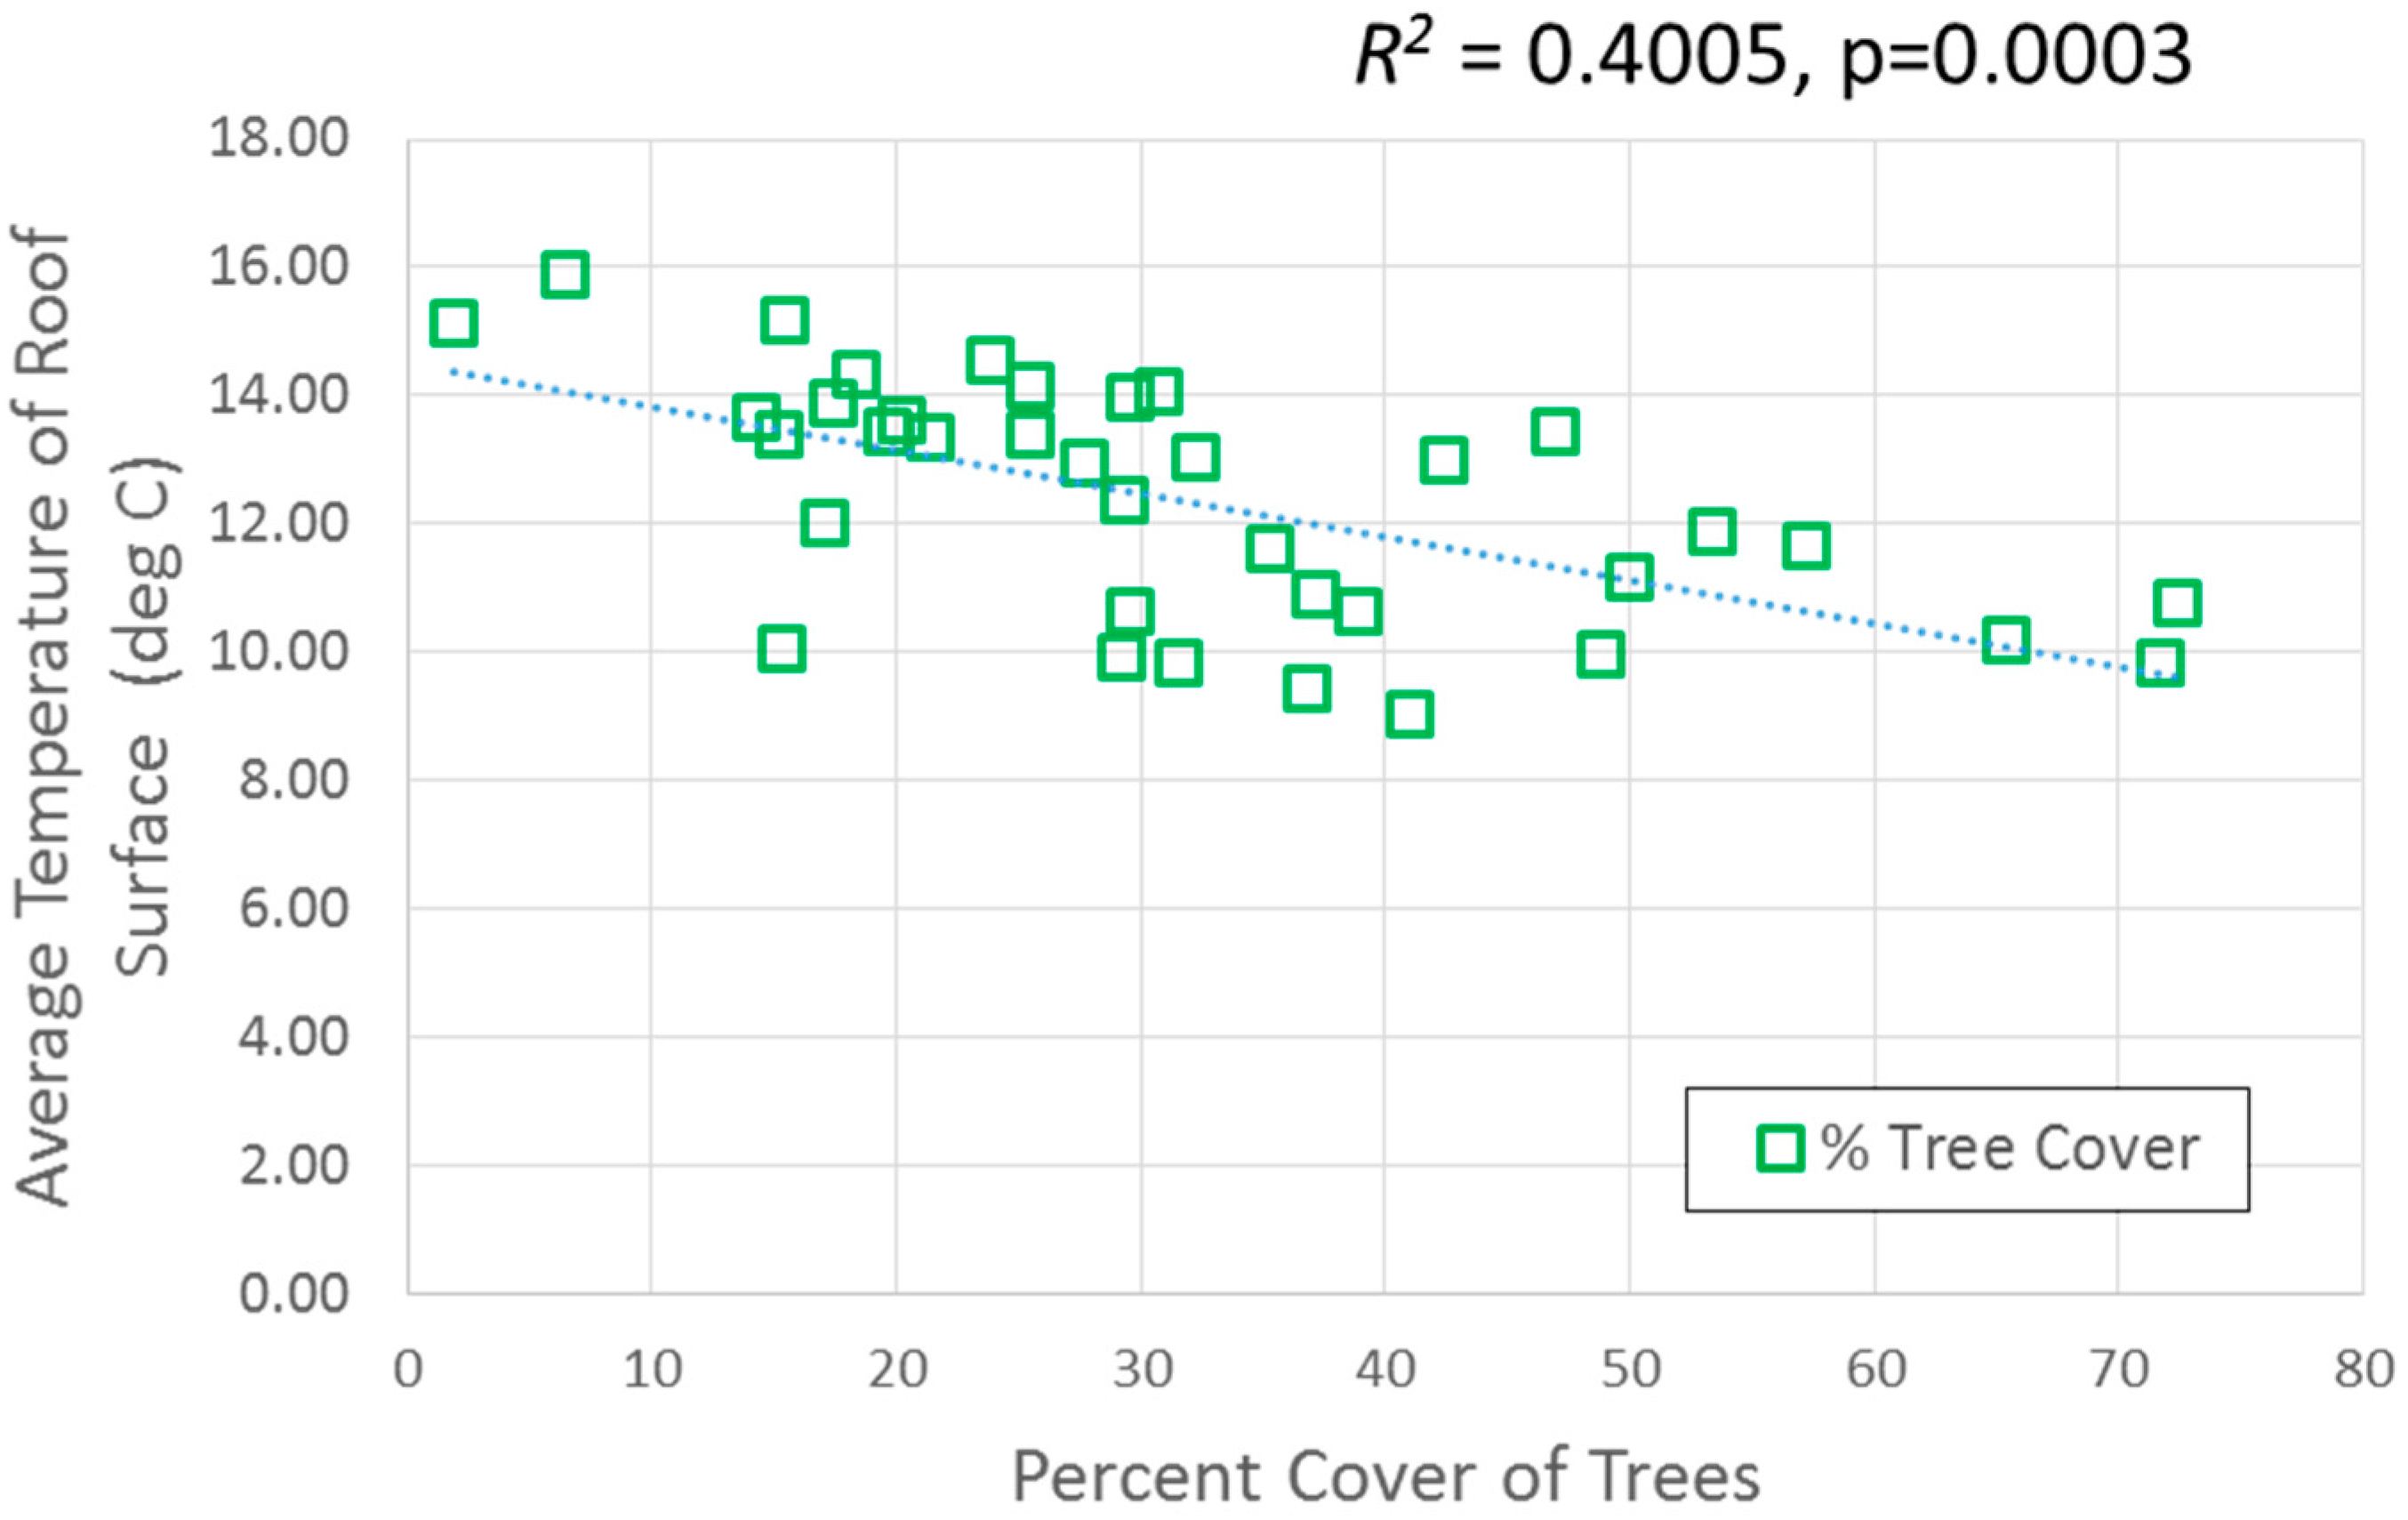
3.1. Effect of Tree Cover on Roof Top Temperatures

The model result comparing the average roof temperature of the 37 houses sampled within the transect to the various land use classes (% pavement, % bare ground/dry; % green grass; % trees) within the 10 m buffer was highly significant (Figure 2: p = 0.0003, R2 = 0.4005). Results showed that percentage of tree cover within the buffer area had a significant negative relationship with the average roof temperature of the house (p = 0.002) such that increasing tree cover leads to a drop in roof temperatures (Figure 2). The percentage of green grass within the same buffer area also showed marginal significance (p = 0.063).

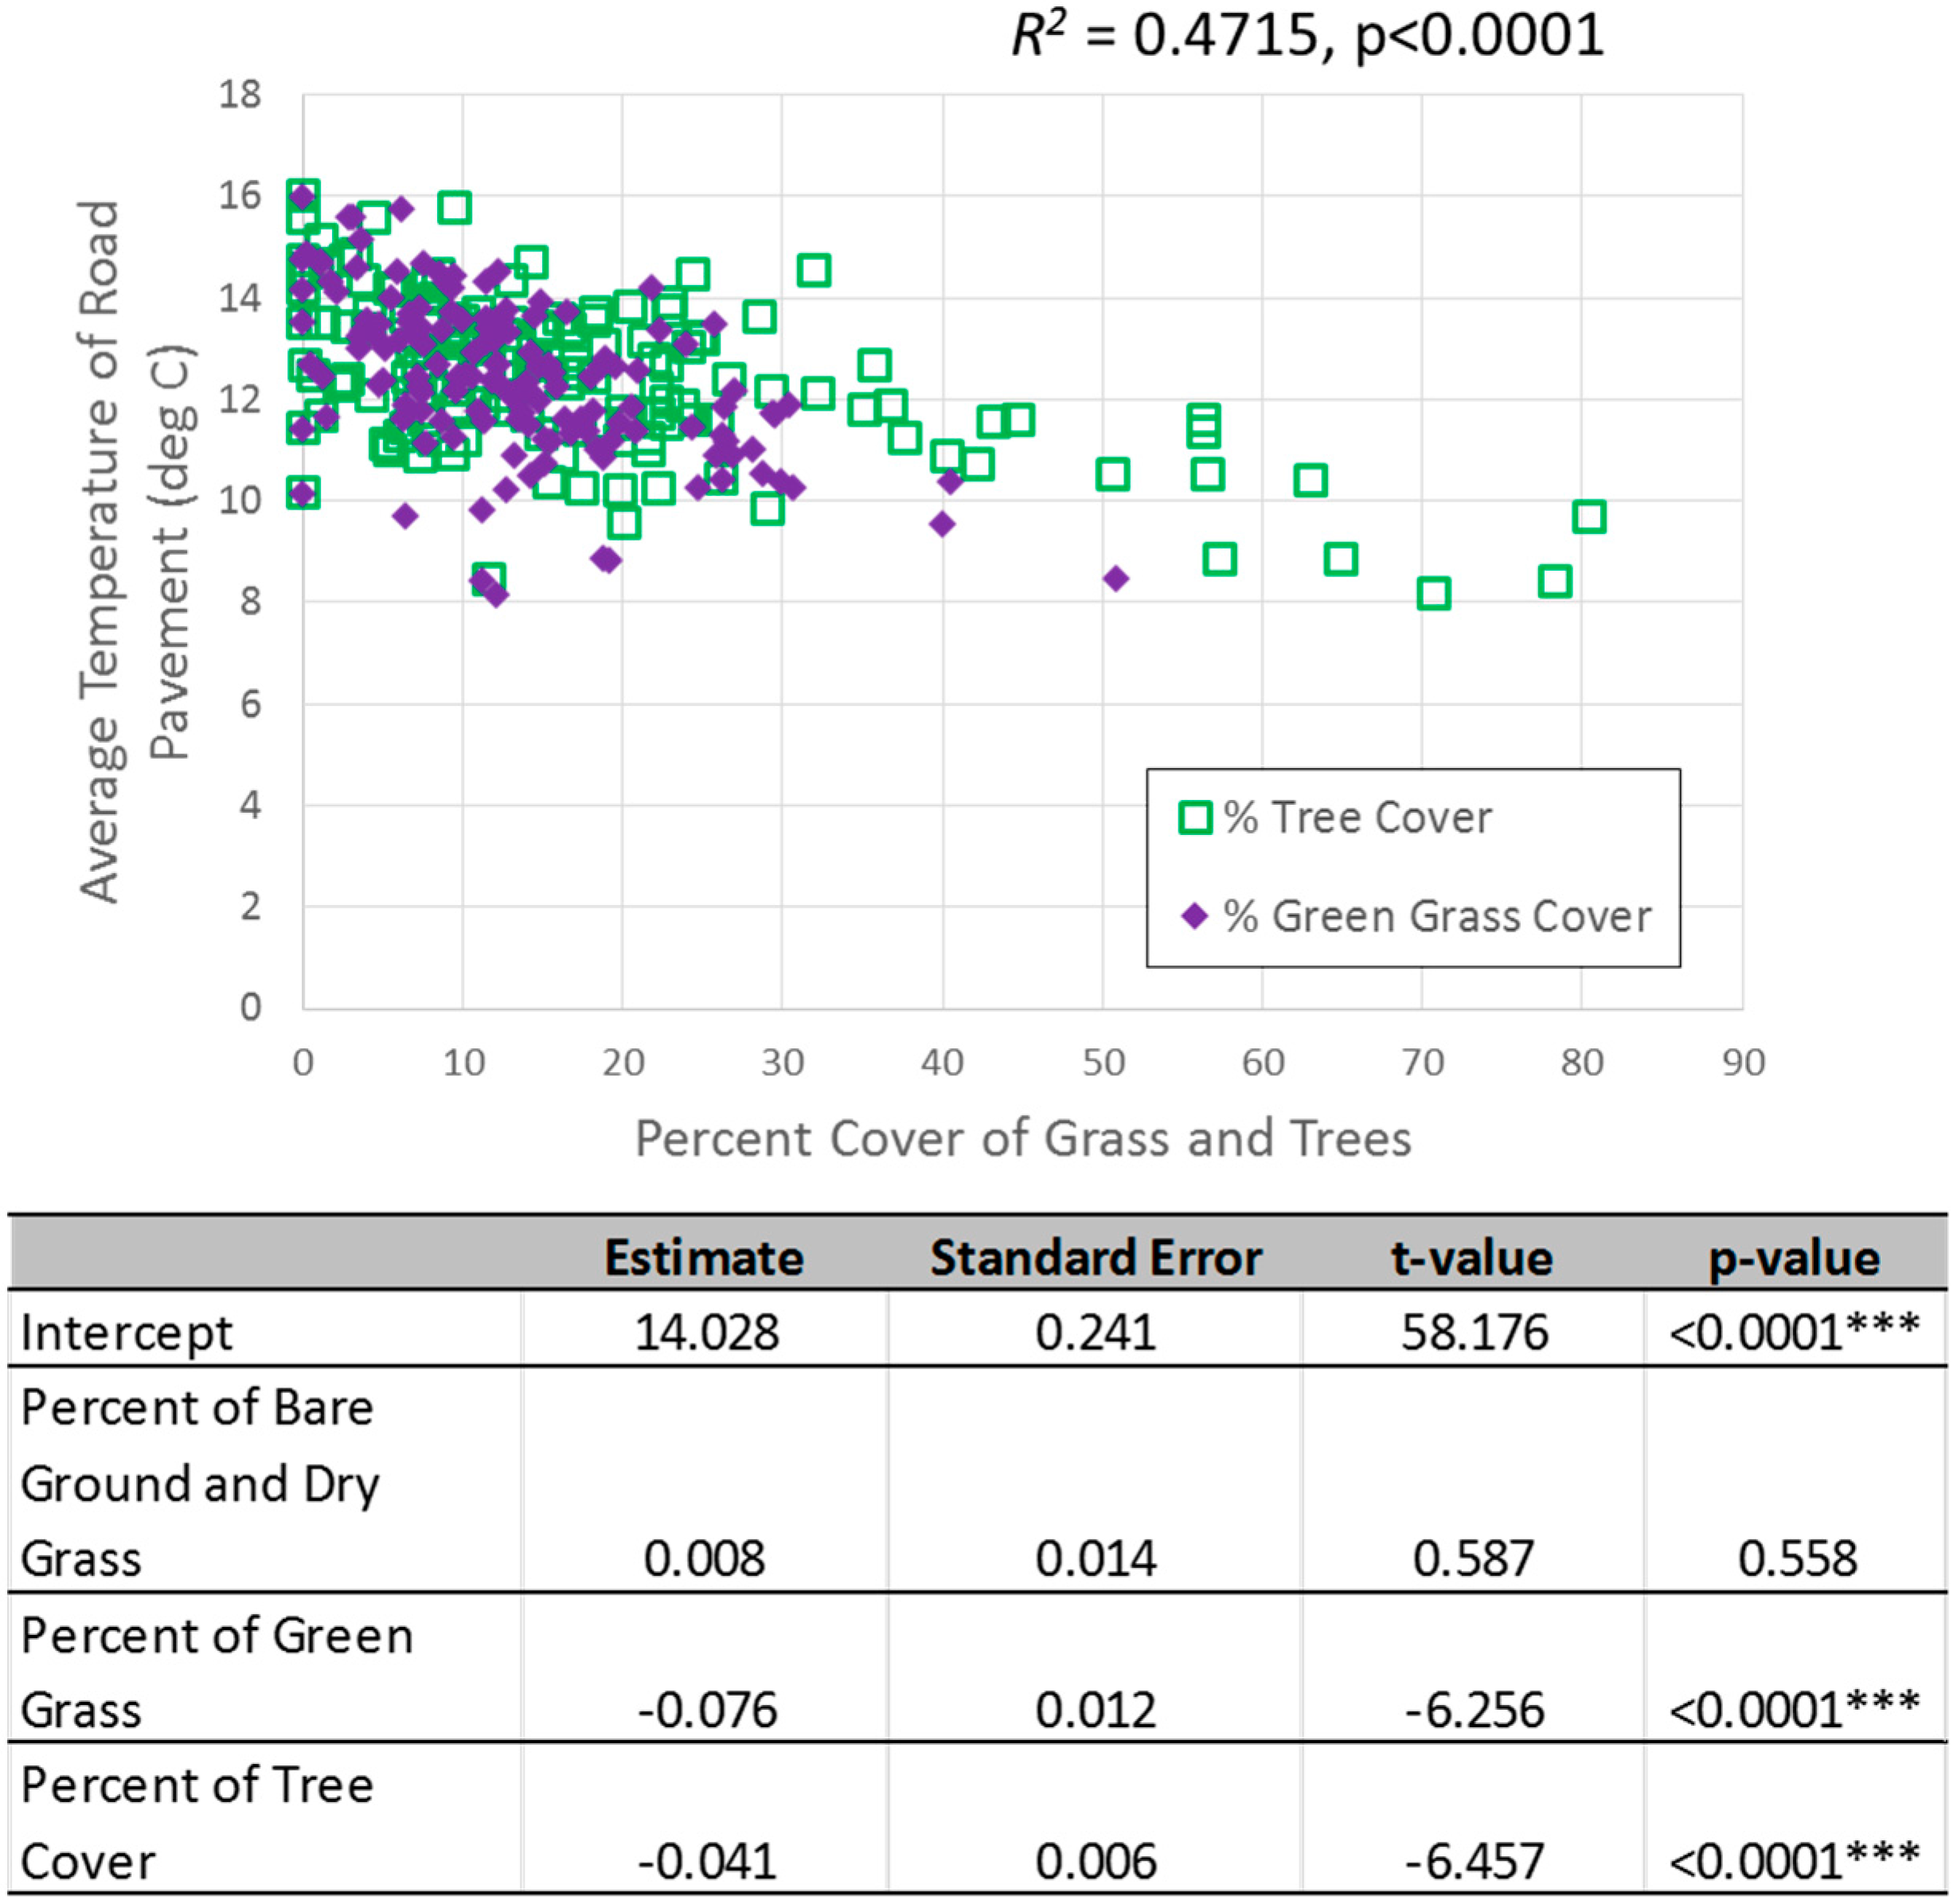
3.2. Effect of Tree Cover on Road Temperatures

When looking at the road corridor analyses for north–south road segments (n = 145), the overall model estimating the effect of the various land use classes (% bare ground/dry grass, % green grass, % trees) on average road temperature was highly significant (Figure 3: p < 0.0001, R2 = 0.4715). Both the percentage of green grass (p < 0.0001) and the percentage of tree cover (p < 0.0001) were highly significant predictor variables showing a negative relationship with road temperatures, that is, greater levels of green grass and tree cover area were associated with a decrease in road and pavement temperatures.

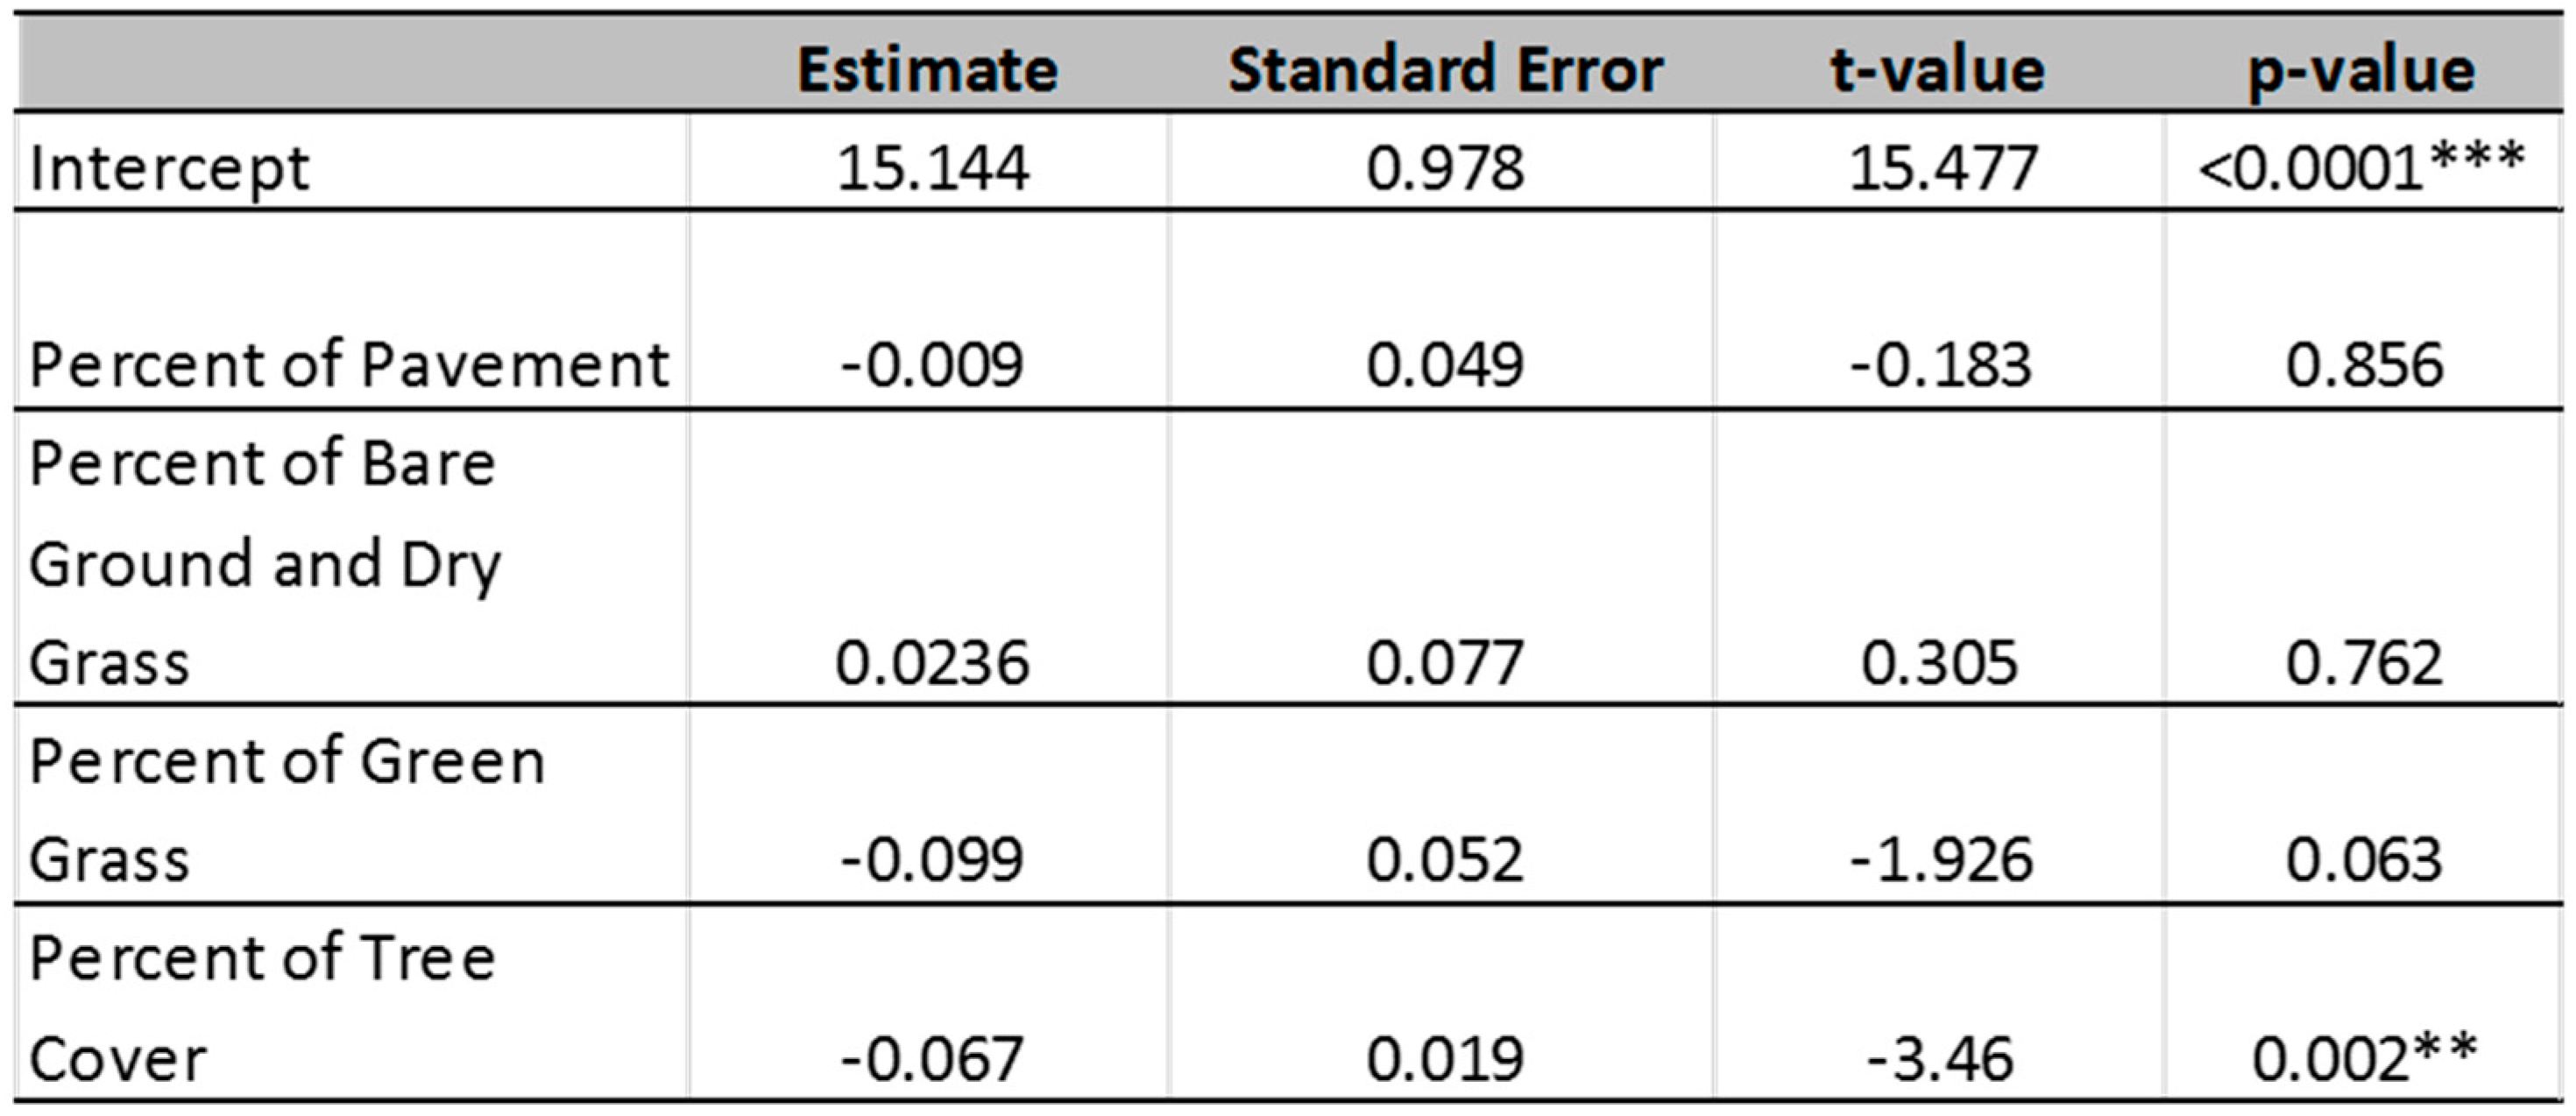
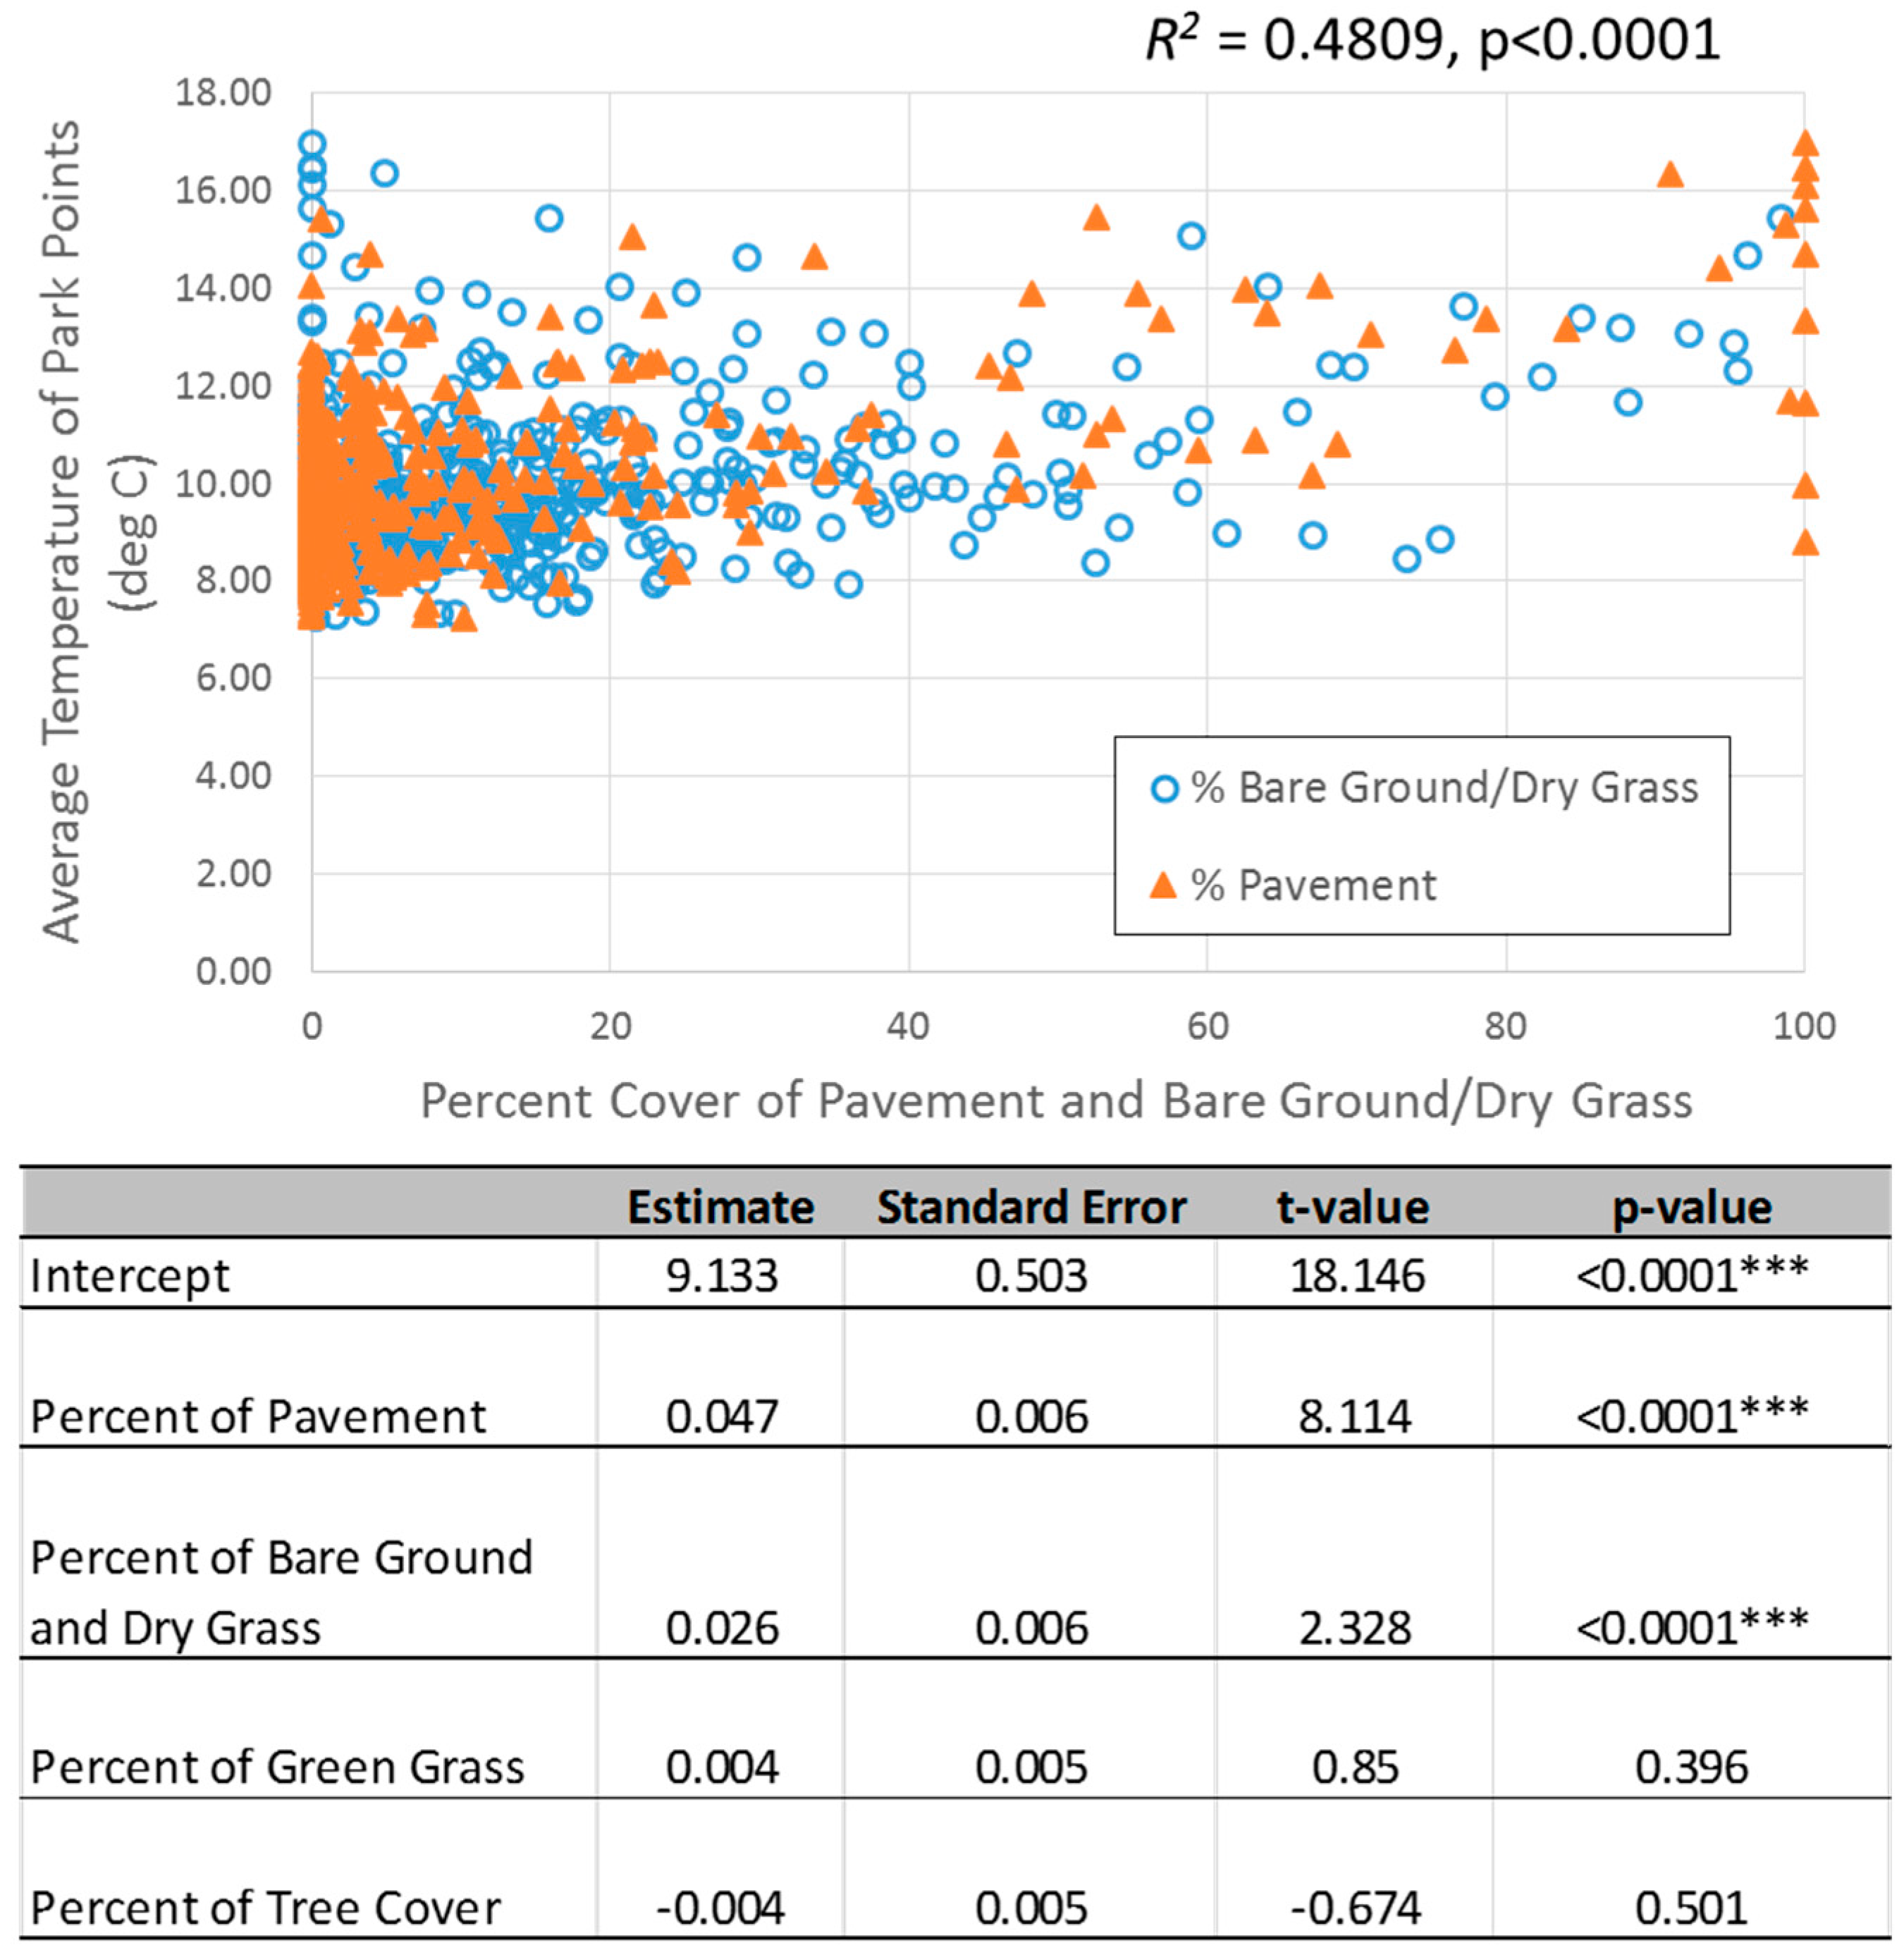
3.3. Effect of Tree Cover on Park Temperatures

Examination of the relationship between the various land use classes (% pavement, % bare ground/ dry grass, % green grass, % trees) and the surface temperature within parks, revealed that the overall model was highly significant (Figure 4: p < 0.0001, R2 = 0.4809). However, the results were different from that of the rooftop and road temperature models in that the percentage of pavement (p < 0.0001) and percentage of bare ground (p < 0.0001) were the highly significant predictor variables in this model showing a positive relationship with average park temperatures at each point, such that greater pavement and bare ground cover led to higher temperatures.

4. Discussion

This study examined the ability of vegetation cover to contribute to urban cooling in three important land use spaces within Sydney neighbourhoods—housing, streetscapes, and in parks. More than half of urban Sydney is devoted to residential land use, representing the single largest contribution to Sydney’s green infrastructure, which may be largely unrecognised and is under growing threat from urban consolidation [40]. This finding is consistent with McPherson et al. [29] who found vegetation cover in Los Angeles, USA, was highest in low-density residential areas and decreased as density and urban land use intensified. Parkland vegetation cover also tends to decrease with increasing urban consolidation, threatening the second largest green infrastructure contributor in Sydney [40].
Clearly, greater vegetation cover in both public and private areas across urban Sydney has the potential to provide important shade and shelter benefits when managed strategically. However, as temperatures increase with climate change [51], there will be an increasing need to prioritise and target green infrastructure investment. The results of our neighbourhood analysis are useful in this regard as they identify the effect of vegetation cover on the temperature of house rooftops, road surfaces, and parkland, providing an indication of the value of local green space. The use of high-resolution hyperspectral (2 m pixels) and thermal (0.5 m pixels) imagery to develop a land use classification (1 m pixel), has enabled a comparison of specific types of vegetation cover with building, road, and parkland surface temperatures. The maximum daily temperature at the closest weather station during the remote sensing data capture was 19.1 °C [52].
Based on the rooftop temperature model developed in this study (Figure 2), we found that tree cover around the house, specifically on the northern and western sides of the house due to sun angle at the time of data capture and time of year, was a highly significant variable for average roof temperature, with increased tree cover leading to lower temperatures (p = 0.002). The rooftop study highlights the importance of strategic placement of vegetation adjacent to residential buildings, to achieve cooling benefits. Greater cooling benefits are likely to be achieved on warmer days, but additional sampling would be required to test the extent of this difference. However, the benefits of rooftop shade will depend on building quality, and tree shade will be most effective where there is limited ceiling insulation to dampen the transfer of heat. Thus, the benefits of tree cover for climate regulation around homes must be considered in light of building quality as well.
In Sydney, tree canopies cast their longest shadows when the sun is from the east (morning) and west (afternoon). The cooling benefits will be greatest in summer, but the shadows cast during the middle part of the day are shorter, so this needs to be a consideration for strategic tree placement. As noted by Pandit and Laband [28], not all shade is created equal. Their study shows that dense tree shade, as opposed to light or moderate shade, was the most significant for reducing summertime residential energy consumption. There was no consideration of the density of tree canopy cover in our roof analysis or the different canopy and leaf architecture of different tree species, which may explain some of the variability in the results. In a previous investigation by Kirkpatrick et al. [53], it was estimated that 7% of garden trees in Sydney were deciduous. It should also be recognised there are important trade-offs to be considered, with several studies in the northern hemisphere investigating the interactions between tree shade and solar access for rooftop photovoltaic systems [54,55,56]. This is a clear case where climate mitigation and adaptation actions may be in potential conflict.
The investigation of vegetation cover effects on the surface temperature of roads and footpaths showed that as the percentage of tree canopy cover (p < 0.0001) and green grass (p < 0.0001) increased, the temperatures of the road pavement surfaces were reduced (Figure 3). The results support another recent study of street trees in the Netherlands, where researchers found that street users appreciated both the microclimatic and aesthetic benefits of increased street cover [57]. Road orientation and the placement of trees along sidewalks will influence road and pavement temperatures, and the amount of shading will vary according to the time of year and the time of day. We limited the analysis to road corridors that were orientated north–south because of the angle of the sun. In Sydney, roads with a north–south orientation had the highest mean average road temperatures (12.4 °C, n = 145), followed by northeast–southwest roads (12.1 °C, n = 95) and northwest–southeast roads (11.9 °C, n = 102). East–west orientated roads had the coolest mean road surface temperatures (11.7 °C, n = 161), as shadows are cast across the roads and pavements throughout much of the day. Because the results of this study are based on thermal data captured in late winter, the opportunity was provided to capture the shade effects of tree canopy with low sun angle and long shadows. It is expected that larger temperature differentials between surfaces with and without tree shade would be observed with summer data capture, but the general trends would remain consistent.
In the analysis of vegetation cover effects on temperature within parkland, it was found that percentage of pavement (p < 0.0001) and bare soil/dry grass (p < 0.0001) had the largest effect, with greater cover of pavement and bare soil/dry grass leading to higher temperatures (Figure 4). This finding is different from previous research. A previous study by Bowler et al. [17] found that the structure of park vegetation is important in conferring cooling effects, with key factors being the size of the park and presence of trees. Additionally, more recent research has shown that tree cover that can intercept solar radiation and reduce air temperature is the most effective way to design parks that reduce the heat load on people during heatwaves [58]. However, concrete and bare soil have been shown to have significantly higher temperatures than green grass [59], and paved surfaces are shown to be a large contributor to urban heat island [60]. The reduction of pavement and bare soil/dry grass would most likely be replaced by green grass or tree cover, thus vegetation cover still has an important role to play in reducing park temperatures.
There has been no attempt in this study to infer the benefits for human health and well-being, but we know from other studies such as that of Takano et al. [61] that the provision of walkable green spaces within residential areas can increase the longevity of the senior citizen population. There is also some evidence that the presence of vegetation and shade trees in the vicinity of the home may create a cooling effect that can reduce heat-related health impacts [62,63]. Yet an Australian study on heat-related deaths in Sydney found there was no significant contribution from the proportion of vegetation [43].
When considering the climate regulation and health benefits that could come with increasing urban tree cover, it is also important to consider the potential disbenefits that urban trees bring with them. The physical presence of vegetation around the home may contribute to lower indoor temperatures, provide benefits of privacy, and reduce noise pollution from unwanted sources [14]. However, in some locations fear of increased potential for bushfires in hot and dry conditions, such as Sydney, can discourage planting around the home [64]. Although street trees have been shown to increase walkability of neighbourhoods [61], vegetation around homes or near roads can also cause root damage or threaten other infrastructure with fallen limbs, creating safety issues [65,66]. Furthermore, the presence of urban vegetation that blocks views or prevents access or egress can be associated with increased fear of crime [67,68]. Thus, choice of species, placement, and management and care of trees are essential in order to limit negative outcomes and maximise the positive benefits.

5. Conclusions

As urban Sydney continues to grow in size and complexity there is an increasing focus on more compact urban form to constrain future urban sprawl and revitalise existing Sydney suburbs. At the same time, the impacts of climate change—particularly rising temperatures and more frequent and severe heatwaves—serve to highlight the important role for urban green infrastructure in this process. Investigation of the current patterns of green infrastructure in urban Sydney reveals that as the dwelling density in suburbs increases, the amount of tree cover decreases. Thus, we see that urban consolidation, higher density housing, and larger houses on smaller blocks all influence the amount of space available for vegetation in residential areas. Although it would be beneficial to increase vegetation, especially tree cover, in cities in order to combat urban heat island and extreme heatwaves, any future development strategy would have to balance the climate benefits that can be gained by increasing vegetation cover with potential disbenefits such as increasing fire danger or damage to infrastructure caused by tree roots. To provide a way forward and develop win–win management strategies, several actions should be considered: (1) optimization modelling of tree species, canopy cover, and tree placement; (2) changes in pavement and bare soil/dry grass placement within local and landscape scale scenarios; and (3) implementation of mesoscale atmospheric models to develop a range of future climate scenarios for urban vegetation. Consequently, decisions for public and private green infrastructure investment must be made carefully, taking into account whole systems thinking and a more interdisciplinary approach in order to ensure that green infrastructure is being maintained and managed for maximum impact for urban dwellers.

Acknowledgments

We would like to thank Michael Doherty and Andrew Higgins for their comments on earlier versions of this manuscript and Matthias Irger (UNSW) for assistance with hyperspectral data. The project received assistance from the New South Wales Government through its Environmental Trust. There are no competing financial interests associated with the publication of this manuscript.

Author Contributions

Brenda B. Lin, Jacqui Meyers and Guy B. Barnett conceived and designed the experiments; Brenda B. Lin and Jacqui Meyers performed the experiments; Brenda B. Lin, Jacqui Meyers and R. Matthew Beaty analyzed the data; Brenda B. Lin was the lead author with assistance from Jacqui Meyers and Guy B Barnett.

Conflicts of Interest

The authors declare no conflict of interest.

Abbreviations

The following abbreviations are used in this manuscript:
UCLUrban Centre and Locality
ABSAustralian Bureau of Statistics
FPCFoliage Projection Cover
NDVINormalised Difference Vegetation Index (NDVI)
GISGeographic Information Systems
LSTLand Surface Temperature

References

  1. Bulkeley, H.; Betsill, M.M. Revisiting the urban politics of climate change. Environ. Politic. 2013, 22, 136–154. [Google Scholar] [CrossRef] [Green Version]
  2. Newton, P.W. Liveable and sustainable? Socio-technical challenges for twenty-first-century cities. J. Urban Technol. 2012, 19, 81–102. [Google Scholar] [CrossRef]
  3. Pickett, S.T.A.; Boone, C.G.; McGrath, B.P.; Cadenasso, M.L.; Childers, D.L.; Ogden, L.A.; McHale, M.; Grove, J.M. Ecological science and transformation to the sustainable city. Cities 2013, 32, S10–S20. [Google Scholar] [CrossRef]
  4. Rosenzweig, C.; Solecki, W.; Hammer, S.A.; Mehrotra, S. Cities lead the way in climate-change action. Nature 2010, 467, 909–911. [Google Scholar] [CrossRef] [PubMed]
  5. Oke, T.R. Urban Climates and Global Environmental Change. In Applied climatology: principles and practice; Thompson, R.D., Perry, A.H., Eds.; Routledge: New York, NY, USA, 1997; pp. 273–287. [Google Scholar]
  6. Kovats, R.S.; Hajat, S. Heat stress and public health: A critical review. Annu. Rev. Public Health 2008, 29, 41–55. [Google Scholar] [CrossRef] [PubMed]
  7. Luber, G.; McGeehin, M. Climate change and extreme heat events. Am. J. Prev. Med. 2008, 35, 429–435. [Google Scholar] [CrossRef] [PubMed]
  8. Bambrick, H.J.; Capon, A.G.; Barnett, G.B.; Beaty, R.M.; Burton, A.J. Climate change and health in the urban environment: adaptation opportunities in Australian cities. Asia-Pacific J. Public Health 2011, 23, 67S–79S. [Google Scholar] [CrossRef] [PubMed]
  9. Stott, P.A.; Stone, D.A.; Allen, M.R. Human contribution to the European heatwave of 2003. Nature 2004, 432, 610–614. [Google Scholar] [CrossRef] [PubMed]
  10. Tan, J.; Zheng, Y.; Song, G.; Kalkstein, L.S.; Kalkstein, A.J.; Tang, X. Heat wave impacts on mortality in Shanghai, 1998 and 2003. Int. J. Biometeoro. 2007, 51, 193–200. [Google Scholar] [CrossRef] [PubMed]
  11. Benedict, M.A.; McMahon, E.T. Green Infrastructure: Linking Landscapes and Communities; Island Press: Washington, DC, USA, 2006. [Google Scholar]
  12. Wright, H. Understanding green infrastructure: The development of a contested concept in England. Local Environ. 2011, 16, 1003–1019. [Google Scholar] [CrossRef]
  13. Jim, C.Y.; Lo, A.Y.; Byrne, J.A. Charting the green and climate-adaptive city. Landsc. Urban Plan. 2015, 138, 51–53. [Google Scholar] [CrossRef] [Green Version]
  14. Bolund, P.; Hunhammar, S. Ecosystem services in urban areas. Ecol. Econ. 1999, 29, 293–301. [Google Scholar] [CrossRef]
  15. Tratalos, J.; Fuller, R.A.; Warren, P.H.; Davies, R.G.; Gaston, K.J. Urban form, biodiversity potential and ecosystem services. Landsc. Urban Plan. 2007, 83, 308–317. [Google Scholar] [CrossRef]
  16. Tzoulas, K.; Korpela, K.; Venn, S.; Yli-Pelkonen, V.; Kaźmierczak, A.; Niemela, J.; James, P. Promoting ecosystem and human health in urban areas using green infrastructure: A literature review. Landsc. Urban Plan. 2007, 81, 167–178. [Google Scholar] [CrossRef]
  17. Bowler, D.E.; Buyung-Ali, L.; Knight, T.M.; Pullin, A.S. Urban greening to cool towns and cities: A systematic review of the empirical evidence. Landsc. Urban Plan. 2010, 97, 147–155. [Google Scholar] [CrossRef]
  18. Gill, S.E.; Handley, J.F.; Ennos, A.R.; Pauleit, S. Adapting cities for climate change: The role of the green infrastructure. Built Environ. 2007, 33, 115–133. [Google Scholar] [CrossRef]
  19. Shashua-Bar, L.; Pearlmutter, D.; Erell, E. The cooling efficiency of urban landscape strategies in a hot dry climate. Landsc. Urban Plan. 2009, 92, 179–186. [Google Scholar] [CrossRef]
  20. Rizwan, A.M.; Dennis, Y.C.L.; Liu, C.H. A review on the generation, determination and mitigation of Urban Heat Island. J. Environ. Sci. China 2008, 20, 120–128. [Google Scholar] [CrossRef]
  21. Alexandri, E.; Jones, P. Temperature decreases in an urban canyon due to green walls and green roofs in diverse climates. Build. Environ. 2008, 43, 480–493. [Google Scholar] [CrossRef]
  22. Huang, L.; Li, H.; Zha, D.; Zhu, J. A fieldwork study on the diurnal changes of urban microclimate in four types of ground cover and urban heat island of Nanjing, China. Build. Environ. 2008, 43, 7–17. [Google Scholar] [CrossRef]
  23. Emmanuel, R.; Loconsole, A. Green infrastructure as an adaptation approach to tackling urban overheating in the Glasgow Clyde Valley Region, UK. Landsc. Urban Plan. 2015, 138, 71–86. [Google Scholar] [CrossRef]
  24. Akbari, H. Shade trees reduce building energy use and CO2 emissions from power plants. Environ. Pollut. 2002, 116, S119–S126. [Google Scholar] [CrossRef]
  25. Akbari, H.; Kurn, D.M.; Bretz, S.E.; Hanford, J.W. Peak power and cooling energy savings of shade trees. Energy Build. 1997, 25, 139–148. [Google Scholar] [CrossRef]
  26. Donovan, G.H.; Butry, D.T. The value of shade: Estimating the effect of urban trees on summertime electricity use. Energy Build. 2009, 41, 662–668. [Google Scholar] [CrossRef]
  27. McPherson, E.G.; Simpson, J.R.; Xiao, Q.; Wu, C. Million trees Los Angeles canopy cover and benefit assessment. Landsc. Urban Plan. 2011, 99, 40–50. [Google Scholar] [CrossRef]
  28. Pandit, R.; Laband, D.N. Energy savings from tree shade. Ecol. Econ. 2010, 69, 1324–1329. [Google Scholar] [CrossRef]
  29. Bunker, R.; Holloway, D.; Randolph, B. The expansion of urban consolidation in Sydney: Social impacts and implications. Aust. Plan. 2005, 42, 16–25. [Google Scholar] [CrossRef]
  30. Gray, R.; Gleeson, B.; Burke, M. Urban consolidation, household greenhouse emissions and the role of planning. Urban Policy Res. 2010, 28, 335–346. [Google Scholar] [CrossRef]
  31. Holloway, D.; Bunker, R. Planning, housing and energy use: A review. Urban Policy Res. 2006, 24, 115–126. [Google Scholar] [CrossRef]
  32. NSW Government. Draft Metropolitan Strategy for Sydney to 2013; NSW Department of Planning and Infrastructure: Sydney, Australia, 2013.
  33. Newton, P.W. Regenerating cities: Technological and design innovation for Australian suburbs. Build. Res. Inf. 2013, 41, 575–588. [Google Scholar] [CrossRef]
  34. Bunker, R.; Searle, G. Theory and practice in metropolitan strategy: Situating recent Australian planning. Urban Policy Res. 2009, 27, 101–116. [Google Scholar] [CrossRef]
  35. Hall, T. Goodbye to the backyard?—The minimisation of private open space in the Australian outer-suburban estate. Urban Policy Res. 2010, 28, 411–433. [Google Scholar] [CrossRef]
  36. Cameron, R.W.F.; Blanusa, T.; Taylor, J.E.; Salisbury, A.; Halstead, A.J.; Henricot, B.; Thompson, K. The domestic garden—Its contribution to urban green infrastructure. Urban For. Urban Green. 2012, 11, 129–137. [Google Scholar] [CrossRef]
  37. Andersson, E.; Barthel, S.; Ahrné, K. Measuring social-ecological dynamics behind the generation of ecosystem services. Ecol. Appl. 2007, 17, 1267–1278. [Google Scholar] [CrossRef] [PubMed]
  38. Gaston, K.J.; Warren, P.H.; Thompson, K.; Smith, R.M. Urban domestic gardens (IV): The extent of the resource and its associated features. Biodivers. Conserv. 2005, 14, 3327–3349. [Google Scholar] [CrossRef]
  39. Shanahan, D.F.; Lin, B.B.; Gaston, K.J.; Bush, R.; Fuller, R.A. Socio-economic inequalities in access to nature on public and private lands: A case study from Brisbane, Australia. Landsc. Urban Plan. 2014, 130, 14–23. [Google Scholar] [CrossRef]
  40. Lin, B.B.; Barnett, G.; Meyers, J. Understanding the loss and inequities of green space distribution with unban densification. Urban For. Urban Green. 2015, 14, 952–958. [Google Scholar] [CrossRef]
  41. Maat, K.; de Vries, P. The influence of the residential environment on green-space travel: Testing the compensation hypothesis. Environ. Plan. A 2006, 38, 2111–2127. [Google Scholar] [CrossRef]
  42. Byrne, J.; Sipe, N.; Searle, G. Green around the gills? The challenge of density for urban greenspace planning in SEQ. Aust. Plan. 2010, 47, 162–177. [Google Scholar] [CrossRef]
  43. Vaneckova, P.; Beggs, P.J.; Jacobson, C.R. Spatial analysis of heat-related mortality among the elderly between 1993 and 2004 in Sydney, Australia. Soc. Sci. Med. 2010, 70, 293–304. [Google Scholar] [CrossRef] [PubMed]
  44. Australian Bureau of Statistics. Australian Statistical Geography Standard (ASGS): Volume 4—Significant Urban Areas, Urban Centres and Localities, Section of State; Australian Bureau of Statistics: Canberra, Australia, 2012.
  45. Richter, R.; Schläpfer, D. Atmospheric/Topographic Correction for Airborne Imagery—ATCOR 4 User Guide; DLR/ReSe: Wessling, Germany, 2011. [Google Scholar]
  46. Schläpfer, D. Parametric Geocoding, PARGE User Guide, Version 3.1; ReSe Applications Schläpfer: Wessling, Germany, 2012. [Google Scholar]
  47. Lillesand, T.; Kiefer, R.W.; Chipman, J. Remote Sensing and Image Interpretation 6th ed; Wiley: New York, NY, USA, 2007. [Google Scholar]
  48. ESRI. ArcGIS 10.1; ESRI: Redlands, CA, USA, 2012. [Google Scholar]
  49. R Core Team. R: A Language and Environment for Statistical Computing; R Foundation for Statistical Computing: Vienna, Austria, 2012. [Google Scholar]
  50. Google Inc. Google Earth, Mountain View; Google Inc.: Menlo Park, CA, USA, 2013. [Google Scholar]
  51. Stone, B.; Hess, J.J.; Frumkin, H. Urban form and extreme heat events: Are sprawling cities more vulnerable to climate change than compact cities? Environ. Health Perspect. 2010, 118, 1425–1428. [Google Scholar] [CrossRef] [PubMed]
  52. BOM Climate Data. Daily Maximum Temperature: Sydney (Observatory Hill); Bureau of Meteorology: Canberra, Australia, 2012.
  53. Kirkpatrick, J.B.; Daniels, G.D.; Davison, A. Temporal and spatial variation in garden and street trees in six eastern Australian cities. Landsc. Urban Plan. 2011, 101, 244–252. [Google Scholar] [CrossRef]
  54. Levinson, R.; Akbari, H.; Pomerantz, M.; Gupta, S. Solar access of residential rooftops in four California cities. Sol. Energy 2009, 83, 2120–2135. [Google Scholar] [CrossRef]
  55. Tooke, T.R.; Coops, N.C.; Voogt, J.A.; Meitner, M.J. Tree structure influences on rooftop-received solar radiation. Landsc. Urban Plan. 2011, 102, 73–81. [Google Scholar] [CrossRef]
  56. Wiginton, L.K.; Nguyen, H.T.; Pearce, J.M. Quantifying rooftop solar photovoltaic potential for regional renewable energy policy. Comput. Environ. Urban Syst. 2010, 34, 345–357. [Google Scholar] [CrossRef]
  57. Klemm, W.; Heusinkveld, B.G.; Lenzholzer, S.; van Hove, B. Street greenery and its physical and psychological impact on thermal comfort. Landsc. Urban Plan. 2015, 138, 87–98. [Google Scholar] [CrossRef]
  58. Brown, R.D.; Vanos, J.; Kenny, N.; Lenzholzer, S. Designing urban parks that ameliorate the effects of climate change. Landsc. Urban Plan. 2015, 138, 118–131. [Google Scholar] [CrossRef]
  59. Wu, J.H.; Tang, C.S.; Shi, B.; Gao, L.; Jiang, H.T.; Daniels, J.L. Effect of ground covers on soil temperature in urban and rural areas. Environ. Eng. Geosci. 2014, 20, 225–237. [Google Scholar] [CrossRef]
  60. Phelan, P.E.; Kaloush, K.; Miner, M.; Golden, J.; Phelan, B.; Silva III, H.; Taylor, R.A. Urban heat island: mechanisms, implications, and possible remedies. Annu. Rev. Environ. Resour. 2015, 40, 285–307. [Google Scholar] [CrossRef]
  61. Takano, T.; Nakamura, K.; Watanabe, M. Urban residential environments and senior citizens’ longevity in megacity areas: The importance of walkable green spaces. J. Epidemiol. Commun. Health 2002, 56, 913–918. [Google Scholar] [CrossRef]
  62. Kilbourne, E.M.; Choi, K.; Jones, T.S.; Thacker, S.B. Risk factors for heatstroke. JAMA 1982, 247, 3332–3334. [Google Scholar] [CrossRef] [PubMed]
  63. Vandentorren, S.; Bretin, P.; Zeghnoun, A.; Mandereau-Bruno, L.; Croisier, A.; Cochet, C.; Ribéron, J.; Siberan, I.; Declercq, B.; Ledrans, M. August 2003 heat wave in France: Risk factors for death of elderly people living at home. Eur. J. Public Health 2006, 16, 583–591. [Google Scholar] [CrossRef] [PubMed]
  64. Gilbert, M.; Brack, C.L. Changes in public requests to remove significant urban trees after severe bushfires in Canberra, Australia. Urban For. Urban Green. 2007, 6, 41–48. [Google Scholar] [CrossRef]
  65. Head, L.; Muir, P. Living with trees—Perspectives from the suburbs. In Proceedings of the 6th National Conference of the Australian Forest History Society, Augusta, Western Australia, 12–17 September 2004.
  66. Nowak, D.J.; Dwyer, J.F. Understanding the benefits and costs of urban forest ecosystems. In Urban and Community Forestry in the Northeast; Springer: New York, NY, USA, 2007; pp. 25–46. [Google Scholar]
  67. Gobster, P.H.; Westphal, L.M. The human dimensions of urban greenways: Planning for recreation and related experiences. Landsc. Urban Plan. 2004, 68, 147–165. [Google Scholar] [CrossRef]
  68. Nasar, J.L.; Jones, K.M. Landscapes of fear and stress. Environ. Behav. 1997, 29, 291–323. [Google Scholar] [CrossRef]
Figure 1. The location of the Sydney Urban Centre (inset) and the flight transect across northern Sydney, Australia on 6 August 2012 between 12:00 p.m. and 2:00 p.m., and showing the Mesh Block land use classification identified in the Australian Statistical Geography Standard [44].
Sustainability 08 00788 g001
Figure 2. For the analysis of rooftop temperatures, the overall model comparing the average roof temperature to the percentage of the four land use classes (pavement, bare ground/dry grass, green grass, tree cover) was highly significant. The percentage of tree cover within the 10 m buffer had a negative relationship with roof temperature and was significant at a p = 0.002 level (** 0.001, *** 0.0001).
Sustainability 08 00788 g002aSustainability 08 00788 g002b
Figure 3. For the analysis of road temperatures, the overall model comparing the average road temperature to the percentage of the three land use classes (bare ground/dry grass, green grass, tree cover) was highly significant. Both the percentage of tree cover and green grass within the road segments had a significant negative relationship with road temperature (*** 0.0001).
Sustainability 08 00788 g003
Figure 4. For the analysis of average park temperature, the overall model comparing the average park temperature at each point to the percentage of the four land use classes (pavement, bare ground/dry grass, green grass, tree cover) was highly significant. Both the percentage of pavement and bare soil/dry grass within the park point buffer had a significant positive relationship with temperature (*** 0.0001).
Sustainability 08 00788 g004

