1. Introduction
In recent years, tourism has become one of the fastest growing economic industries in the world. Tourism in China has made a considerable contribution to the global tourism economy, and China has shown, by far, the fastest growth with regard to expenditures on international tourism [
1]. China was the world’s third most visited tourist destination in 2010, and the total inbound visitor arrivals reached 134 million, with a foreign exchange income of U.S. $45.8 billion [
2]. The accommodation sector plays an indispensable role in the tourism industry and has a significant global environmental impact [
3]. The hotel industry in China has experienced rapid growth in the past ten years, and this trend is expected to continue in the future. For instance, the number of star-rating hotels in China increased from 7358 in 2001 to 11,779 in 2010, and the total revenue raised by 330% from USD $7.3 billion to USD $31.4 billion [
2]. Hotels rank among the top five energy consumers in the building sector, largely due to their unique features, such as 24-h operation of daily operations and recreational activities [
3,
4,
5]. Due to the use of energy-intensive technology to provide modern conveniences and comforts, massive amounts of energy are consumed by the variety of facilities provided, such as swimming pools, central cooling systems, heating systems, etc. [
5]. Studies are increasingly paying attention to the levels of energy consumed for the purposes of hotel operation.
Energy use intensity (EUI) is an important unit of measurement, which represents a building’s energy performance and can be defined as the annual energy use divided by the gross floor area of a building [
5,
6]. Santamouris et al. analyzed 158 hotels in Greece, finding their annual average energy use intensity to be 273 kWh/m
2, and estimated the potential energy savings of introducing new energy-efficient systems and techniques [
7]. Deng and Burnett calculated an average energy use intensity of 564 kWh/m
2 based on a study of 16 high-quality hotels in Hong Kong and showed that electricity dominated total energy consumption, with one-third of total energy consumption used for air conditioning [
5]. Becken et al. analyzed differences in energy consumption between different types of accommodation in New Zealand and found that hotels had an average energy use intensity of 159 kWh/m
2 [
8]. Rajagopalan et al. [
9] and Wu et al. [
10] collected data from a national survey of 29 high-quality hotels in Singapore and found their annual average energy use intensity to be 427 kWh/m
2. Taylor et al. [
11] selected two hotels with the aim of representing the most common U.K. hotel types. They found that it is technically feasible to reduce emissions by 50% without compromising guest comfort. Wang [
3] undertook a broad analysis of the energy performance of 200 hotels in Taiwan and found an energy use intensity of between 143.6 and 280.1 kWh/m
2, with electricity accounting for 84% of total energy use. Oluseyi et al. built the correlation analysis to investigate the interdependence of carbon footprint and normalized energy consumption and obtained an average energy use intensity of 265.95 kWh/m
2 in Nigeria [
12]. Lai aimed at examining the relation between energy use and the maintenance costs of hotels and found that electricity accounted for most of the energy used by the hotels in Hong Kong [
13].
Given that EUI might be influenced by many factors, hotel energy performance varies significantly depending on differing locations. Different climate conditions can affect the energy use in a hotel building [
3,
5,
8,
9,
10,
12,
14,
15,
16]. Electricity, gas, and diesel oil are the main energy sources used in hotels for daily operations and recreational activities [
3,
5,
9,
12,
13,
14,
15,
16,
17,
18]. The significant factors affecting energy consumption are diverse, depending on the physical and operational parameters, such as hotel size, gross floor area, construction year, type of energy, occupancy rate and hotel star-rating. Benchmarking energy consumption can give a better understanding of hotel energy performance, which allows hotel managers to see where they stand within the wider hotel industry and enables them to put in place potential energy efficiency strategies [
9]. At present, energy performance studies that refer to energy monitoring are few in China, especially in relatively undeveloped economic regions. The collection of energy data is difficult, and relevant research is still in the early stages. This paper aims to analyze hotel energy consumption in Lijiang based on a regression-based model. This analysis will bring a greater focus on energy efficiency in hotel management.
2. Methods and Materials
2.1. Methods
A survey was designed and distributed to hotel managers and tourist administrators in order to give an in-depth view of the energy performance in Lijiang. First, considering the availability and reliability, a questionnaire and structured interview were adopted in our study. Data concerning hotel energy consumption, such as electricity consumption, diesel quantity, and gas consumption, were collected by the questionnaire from the Tourism Bureau and Tourism Association. The structured interview was adopted to develop a deeper understanding of hotel operations. To obtain the raw data, hotel managers were initially contacted by telephone and were asked about the fundamental data of their hotel, such as floor area (gross floor area, GFA), building age, number of guest rooms, and so on. After that, a structured interview was conducted on-site to investigate the energy use and operating-related information, such as occupancy rate, revenue, number of guests, and so on. Second, regression methods were applied to distinguish the determinants of energy use intensities in hotels. Regression analysis was then performed using SPSS (Armonk, NY, USA) statistical software, with the stepwise regression selection procedure used to determine the best fitting regression model. Third, the standardized EUI was built by means of establishing the adaptive standardized model to exclude abnormal effects.
The typical regression model referred to [
19,
20,
21] is shown as Equation (1):
where
c0 is the intercept;
ci is the standardized regression coefficient;
xi (
i = 1, 2, ..., k) are the values of the factors that affect EUI, such as gross floor area, building age, occupancy rate, and so on;
is the random error.
The standardized model referred to [
19,
20] is shown as Equation (2):
where
EUIstd is the standardized EUI;
EUIobser is the observed EUI;
ci is the standardized regression coefficient;
xi (
i = 1, 2, ...,
k) are the observed values of factors that affect EUI, such as gross floor area, building age, occupancy rate, and so on.
The survey data were processed and analyzed with IBM SPSS Statistics 19.0 (Armonk, NY, USA) [
22].
2.2. Research Area
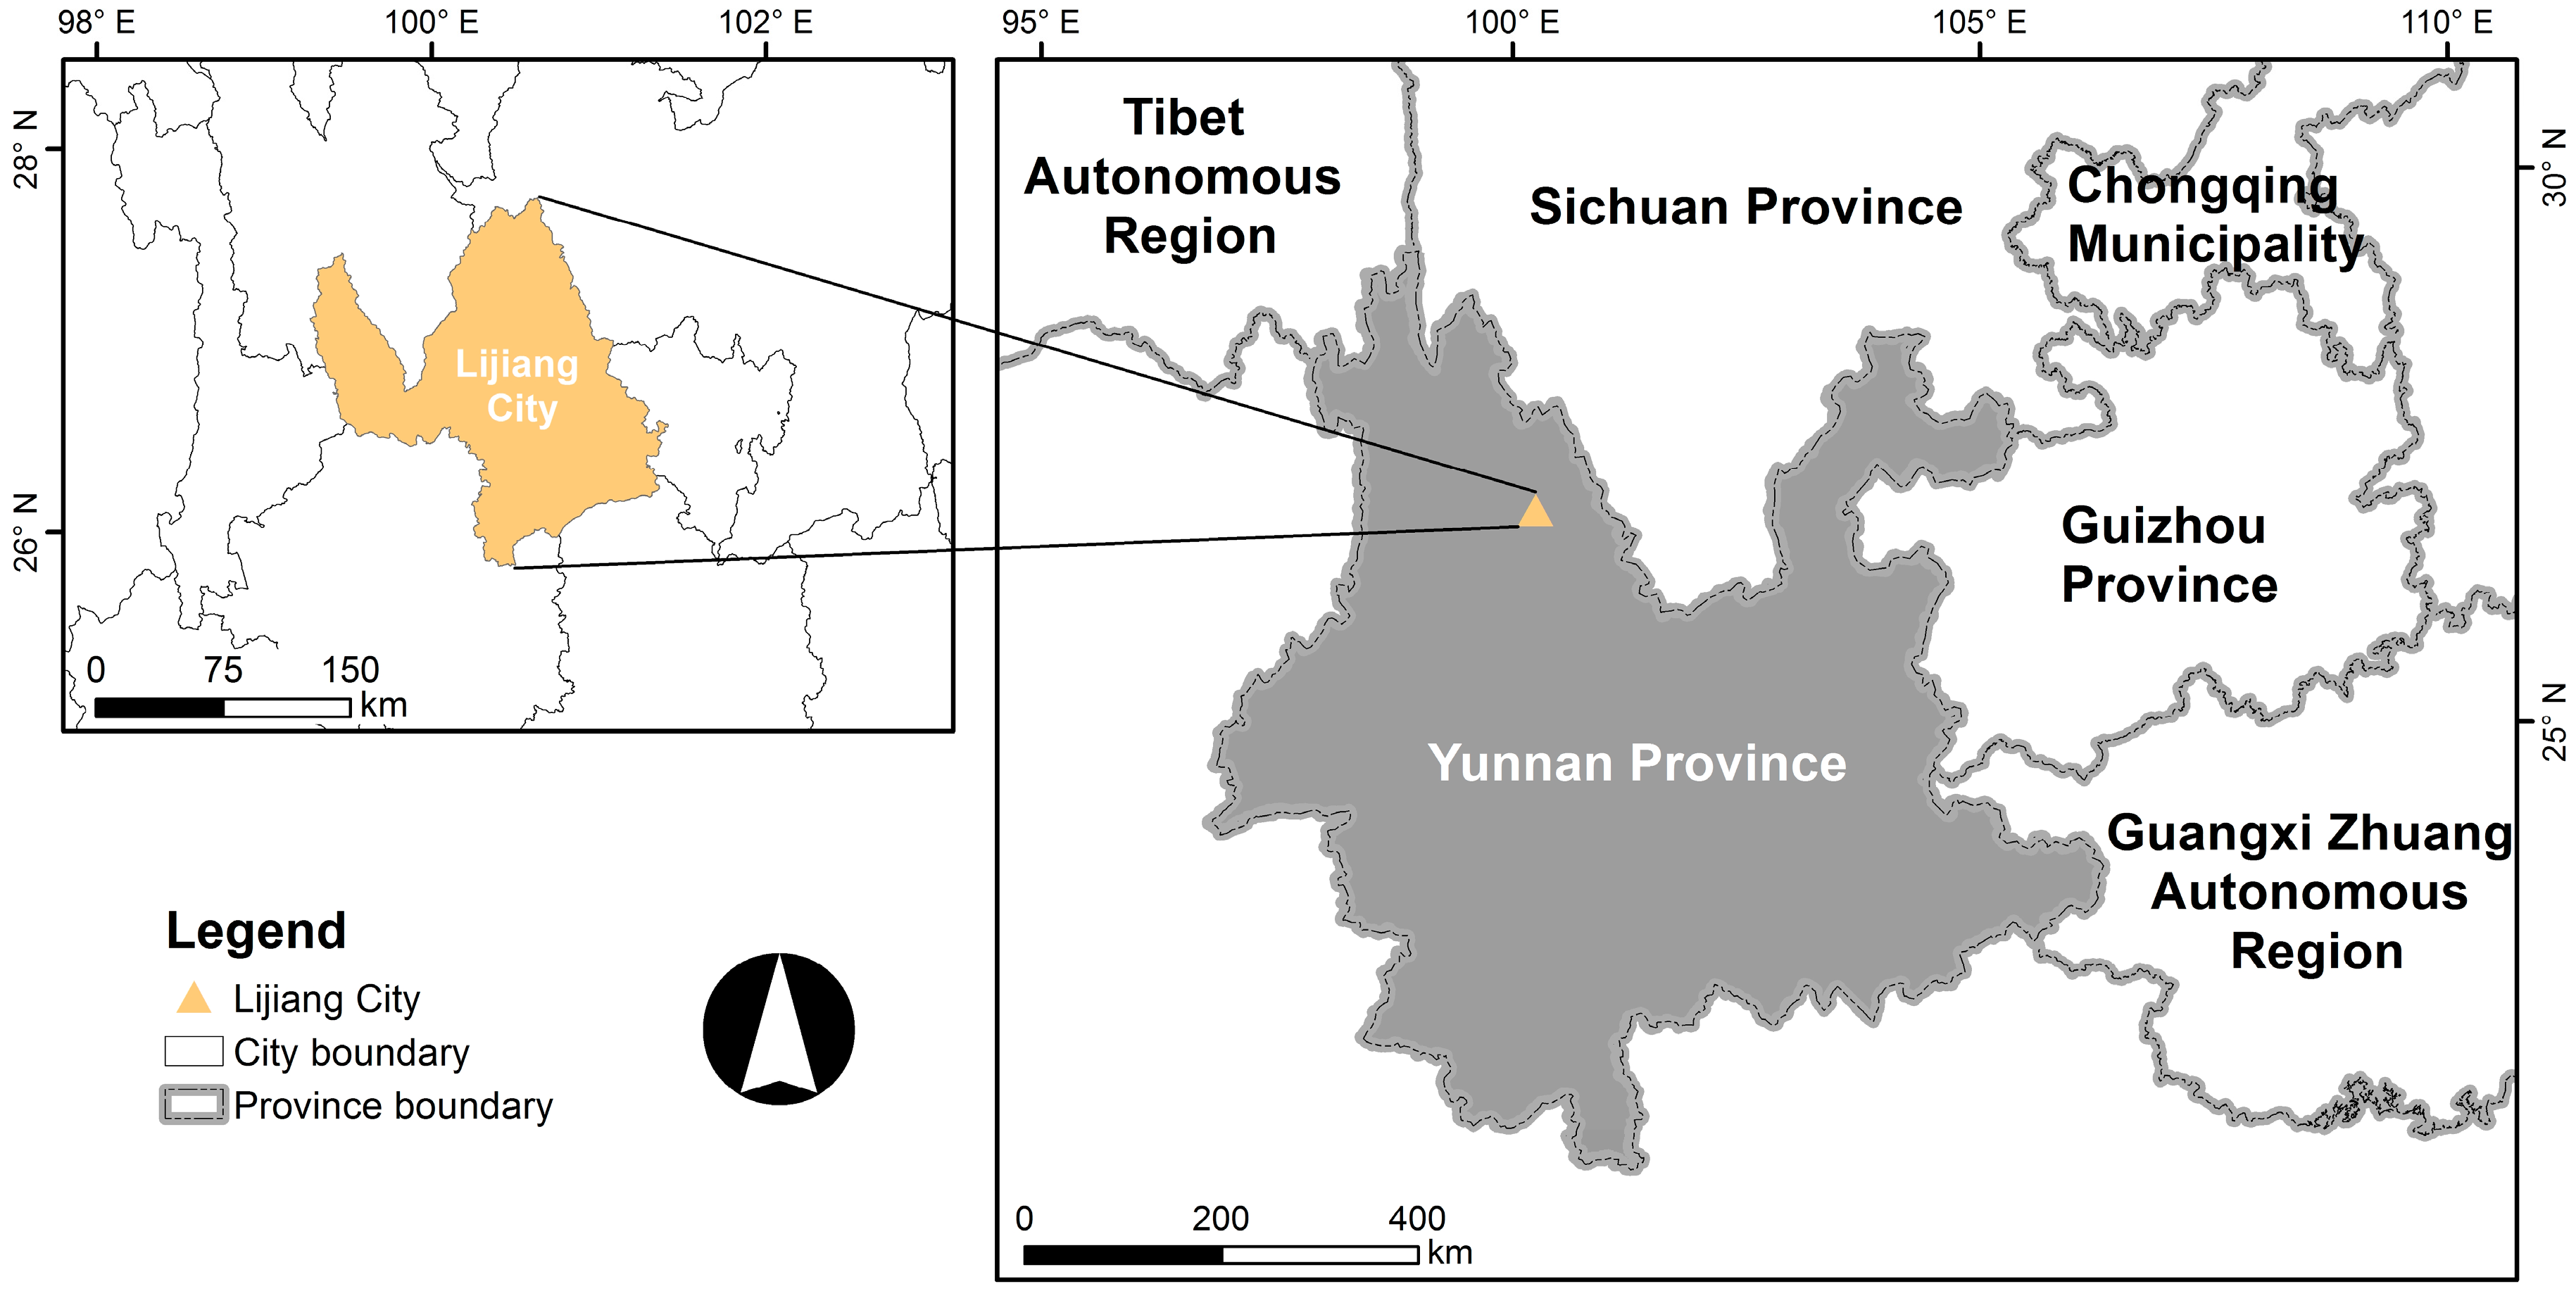
Lijiang is located between east longitude 99°23′ to 101°01′ and north latitude 25°59′ to 27°56′, in the southwest of China (
Figure 1), with an area of 20,600 km
2 and a population of 1.24 million [
23]. Lijiang has a plateau monsoon climate type, and its four seasons tend to be indistinct; however, there are clear wet and dry seasons, with an average annual temperature between 12.6 °C and 19.9 °C. Lijiang is a very popular tourist destination in China, with hotels constituting a high proportion of the commercial buildings. Tourism is a boom industry in Lijiang, with about 11.84 million tourists in 2011 and tourism receipts reaching U.S. $2.36 billion. Until 2012, there were 180 star-rated hotels in Lijiang, including two five-star hotels, 14 four-star hotels, 45 three-star hotels, 82 two-star hotels, and 37 one-star hotels [
24]. A survey was conducted in Lijiang among the 40 registered hotels. In order to establish an efficient stepwise regression prediction model, the data of a surveyed hotel were fully acquired before being considered as a valid sample. Finally, 24 effective questionnaires were acquired, including five one-star hotels, six two-star hotels, four three-star hotels, and nine four-star hotels.
4. Discussion
4.1. The Results of EUI
As shown in
Table 2, EUI findings of the study can be categorized according to star rating. The highest EUI was found in four-star hotels, with an average EUI of 180.8 kWh/m
2; the second highest was found in three-star hotels, with an average EUI of 113.3 kWh/m
2; the third highest in two-star hotels, with an average EUI of 74.2 kWh/m
2; and the lowest was found in one-star hotels, with an average EUI of 70.2 kWh/m
2.
Basic facilities and space requirement were the main causes of the difference among one- to four-star hotels. Among the hotels with central air conditioning systems, the proportion of four-star hotels was 63.6%; with a fitness center, the proportion was 85.7%; with conference rooms, the proportion was 60.0%. The highest GFA were found in four-star hotels, with an average of 12,693 m2; and the averages of three-, two-, one-star hotels were 2594 m2, 3707 m2, and 571 m2, respectively.
Most hotels provide services to meet guests’ needs and expectations on quality; for instance, the temperatures in hotel lobbies and public areas are usually controlled to below 26 °C in summer to ensure guests are comfortable. In summer, the set-point temperatures of public areas in 24 hotels were kept at the minimum of 18 °C and the maximum of 26 °C. Among them, 16 of the surveyed hotels (68%) were set around 23–25 °C. Under mild weather conditions, particularly during the spring, air-conditioning is rarely used in Lijiang, with guest room temperatures being more commonly regulated by means of the outdoor breeze. Furthermore, enough solar energy was captured and stored in Lijiang to enable use in meeting heating needs for the daily consumption of hotels. We made a comparison on the energy consumption between four-star hotels with (88.9%) and without solar energy heating systems (11.1%). It was found that the former (175.1 kWh/m
2) was obviously lower than the latter (225.9 kWh/m
2). This practice can reduce electricity usage sharply; moreover, it would be possible to further develop clean energy projects in order to achieve low-carbon tourism. However, the energy consumption shown in
Table 2 is indicative only of EUI in Lijiang, and the building energy consumption levels of other provinces may differ significantly.
It is often supposed that luxurious hotels will consume greater amounts of energy and require more stringent energy efficiency policies. In order to examine the results, a one-way ANOVA was conducted to verify our hypothesis. With a 95% level of confidence, it can be observed that four-star hotels are remarkably different from other types of hotels, using a far greater amount of energy per unit area than lower star hotels.
4.2. Pearson Correlations between Variables and Energy Use Intensity
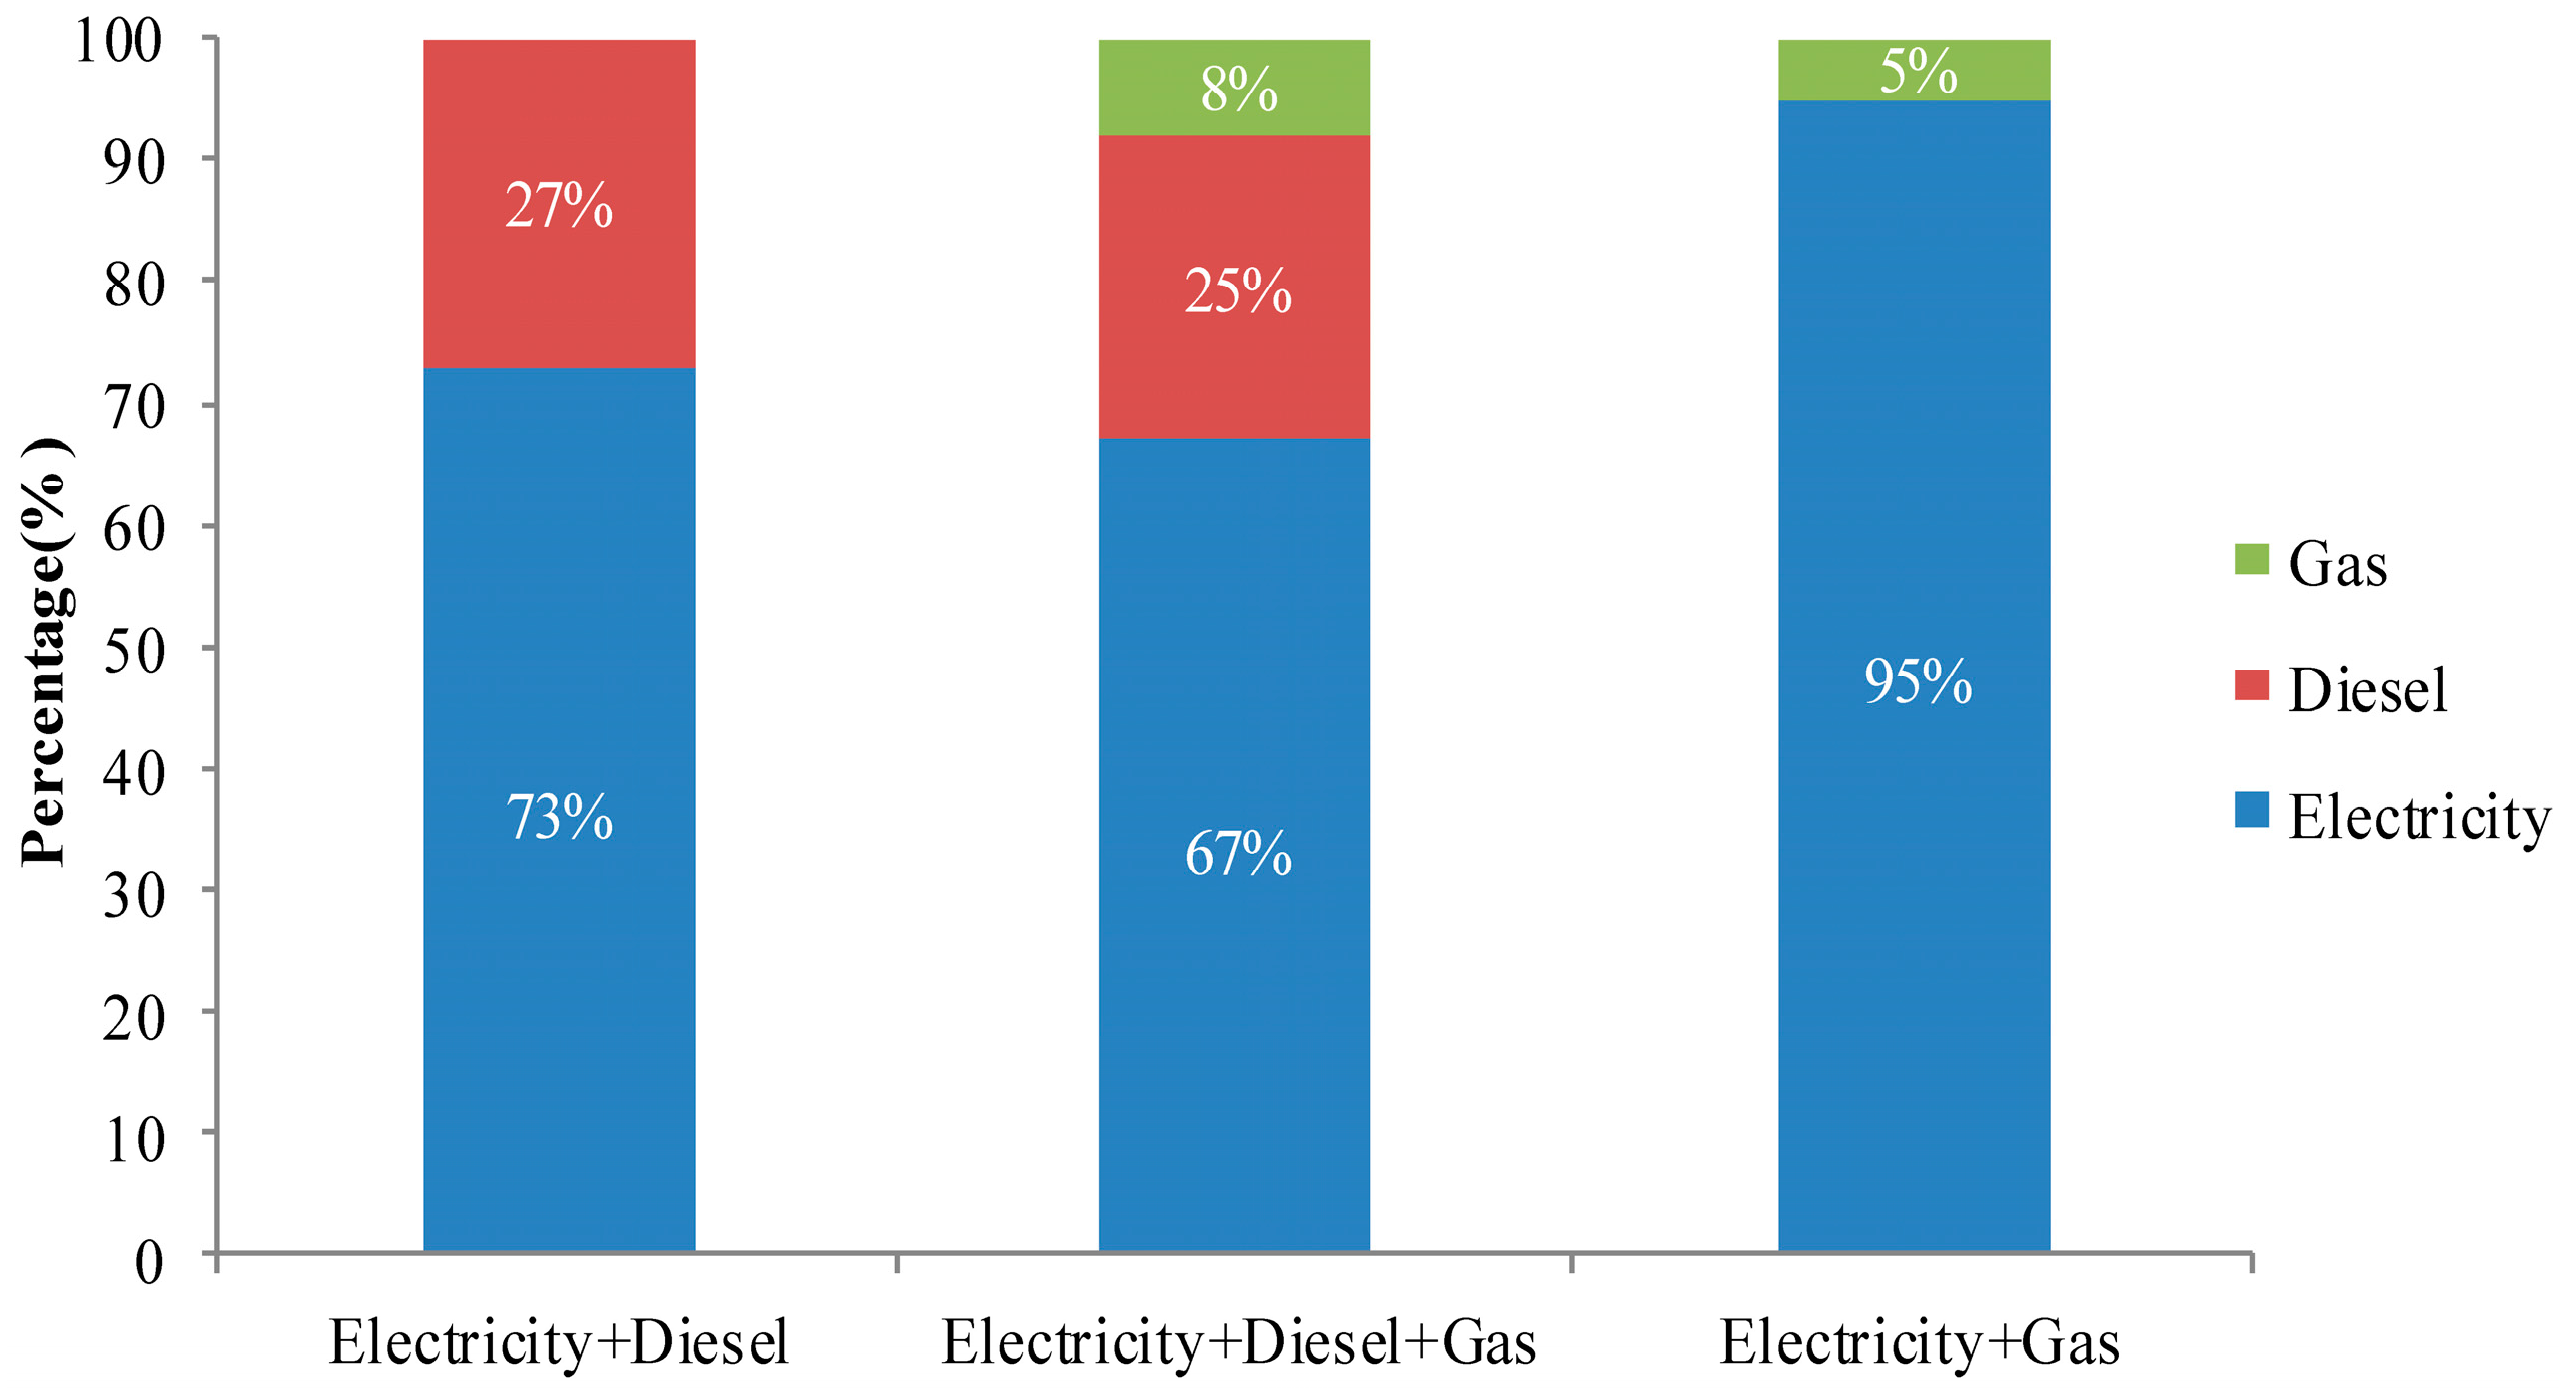
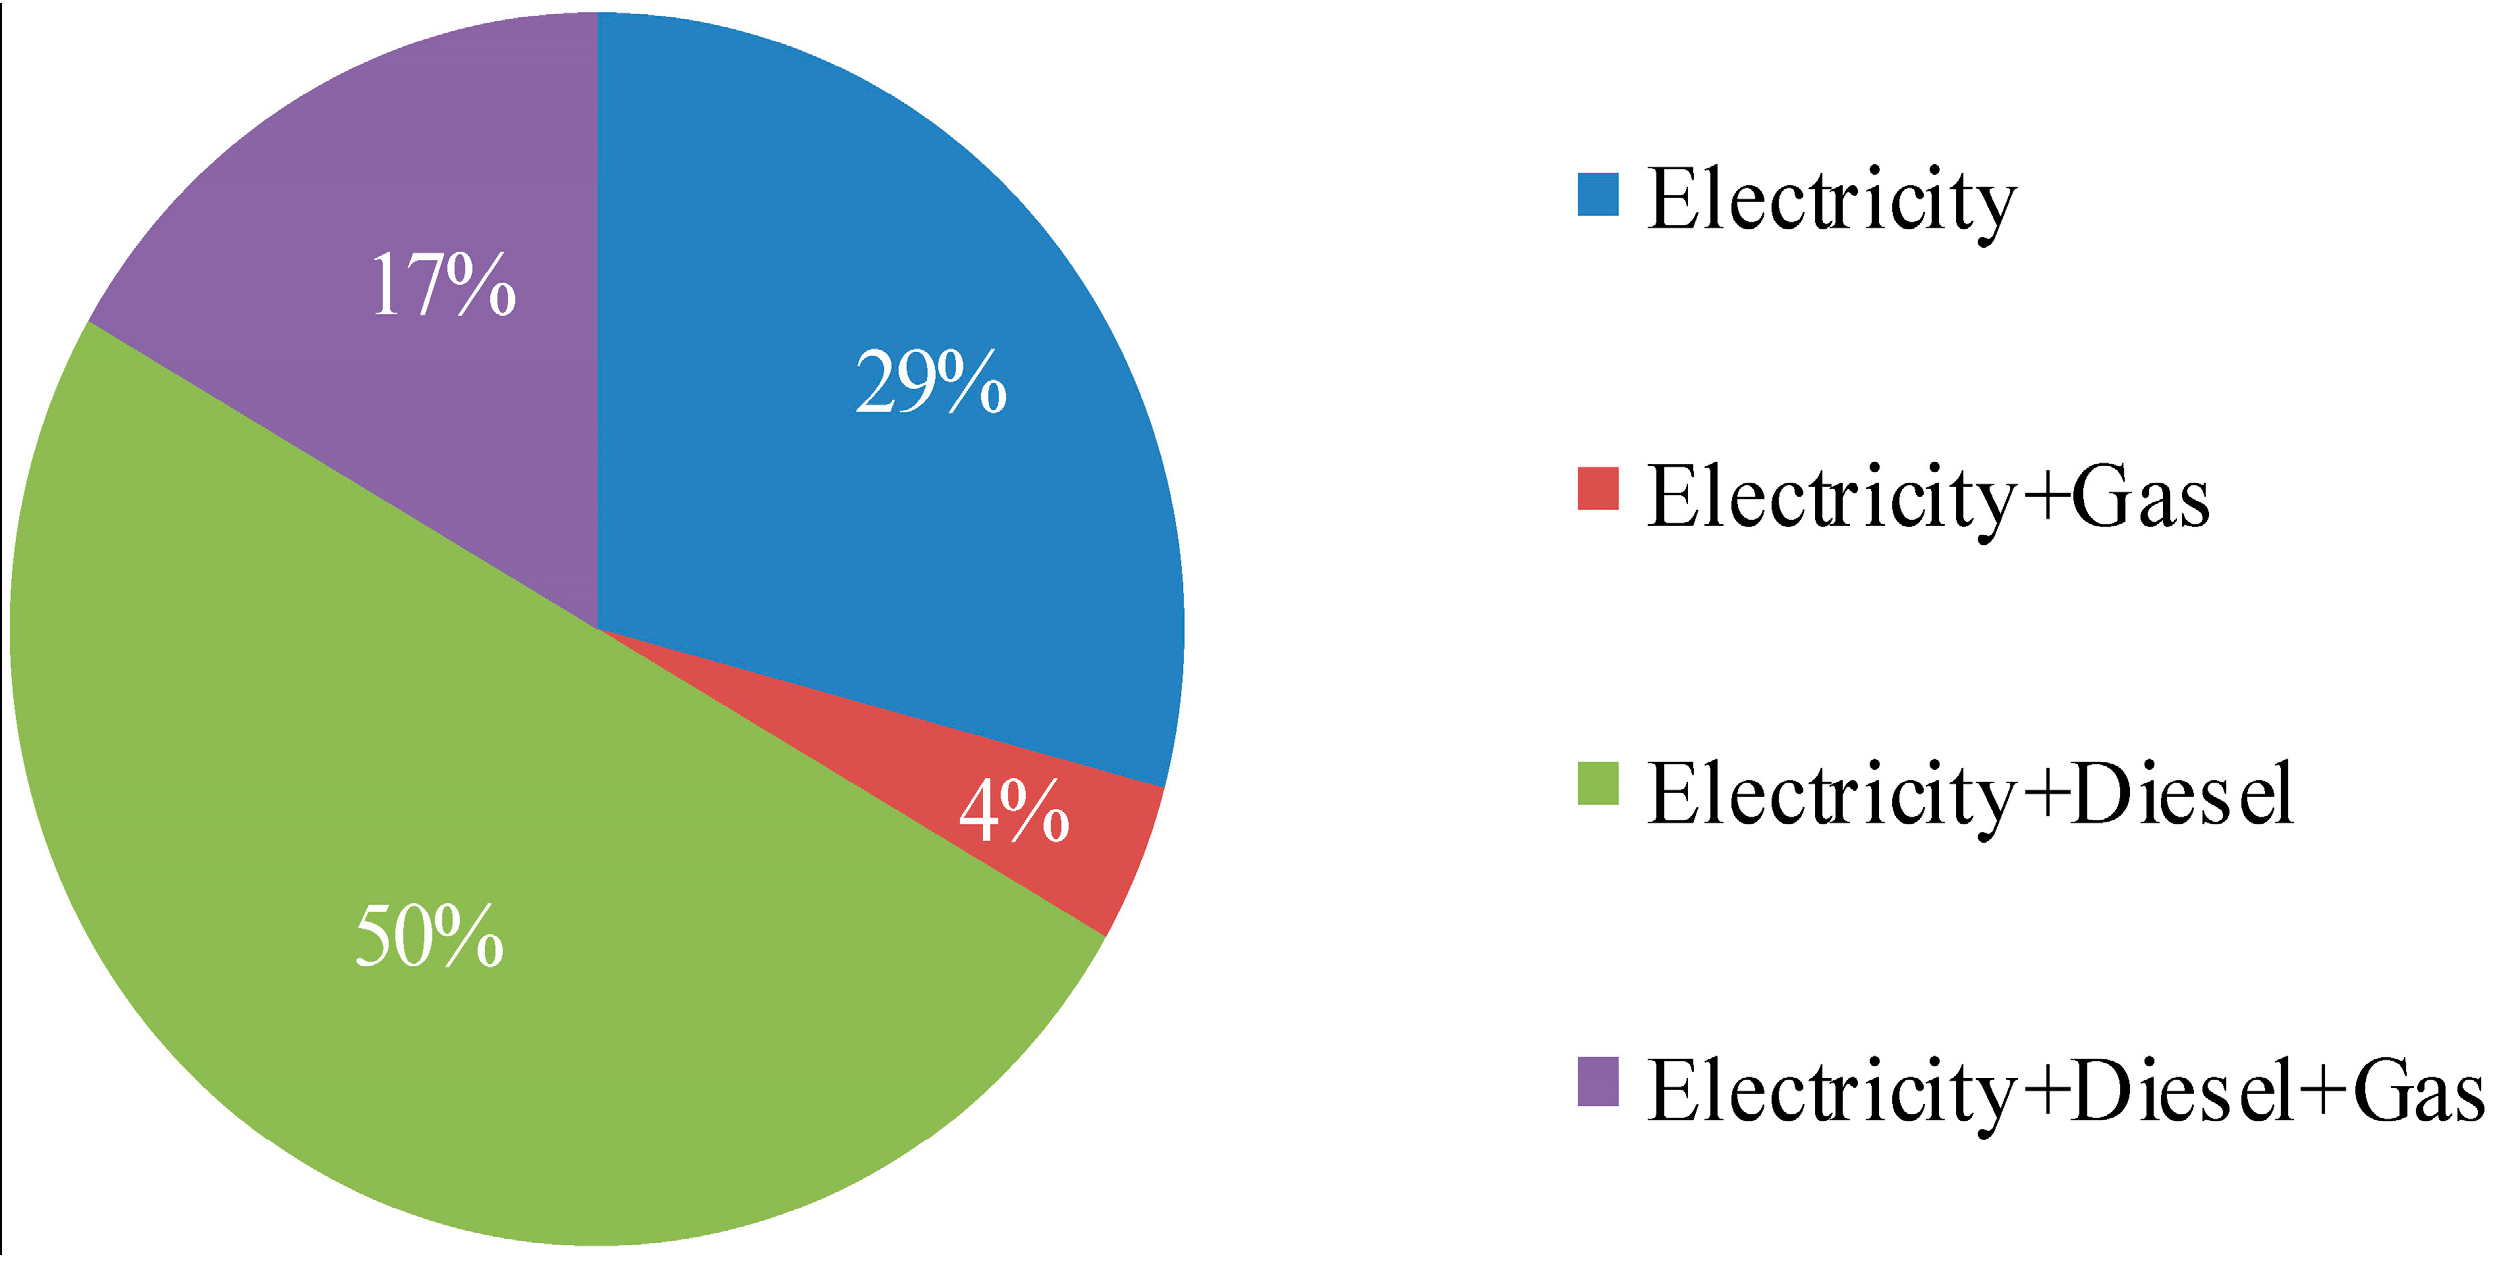
Energy needs in surveyed hotels in Lijiang were met by means of electricity, diesel, and gas; however, hotels depended on electricity as the dominant energy source. Electricity was often the most significant energy source in operating air conditioning, lighting, laundry services, and water-heating, while diesel and gas were often the main energy sources for cooking in kitchens. On average, 81% of total energy consumed in Lijiang’s sampled hotels came from electricity. Gas consumption was negligible, which might be due to transportation difficulties. Electricity was the dominating energy in the seven surveyed hotels (29%). Fifty percent of sampled hotels used both electricity and diesel to maintain normal hotel operations (
Figure 3), while the percentage of the usage of electricity and diesel were 73% and 27%, respectively. For other hotels that also consume gas for heating, the percentage of electricity and diesel dropped to 67% and 25%, respectively (
Figure 4).
As shown in
Table 3, Pearson correlation analyses were conducted between 17 surveyed variables (including occupancy rate, gross floor area (GFA), total revenue, number of workers, and others), and energy consumption.
It is shown that there is a significantly strong correlation between the EUI and four driving variables, namely the number of guest rooms, hotel star-rating, room revenue, and number of workers. The results indicate that higher star-rated hotels generally offer better services and facilities, which means that more guest rooms are provided, more workers employed, and more energy consumed. The correlation between EUI and room revenue leads to the conclusion that higher hotel income also indicates a higher energy consumption. It can be seen from
Table 3 that GFA, occupancy rate, and GFA of guest rooms present less significant relevance. GFA was found to show significant correlation to energy consumption in Lijiang, as was reported in Singapore’s hotel industry by Wu et al. [
10].
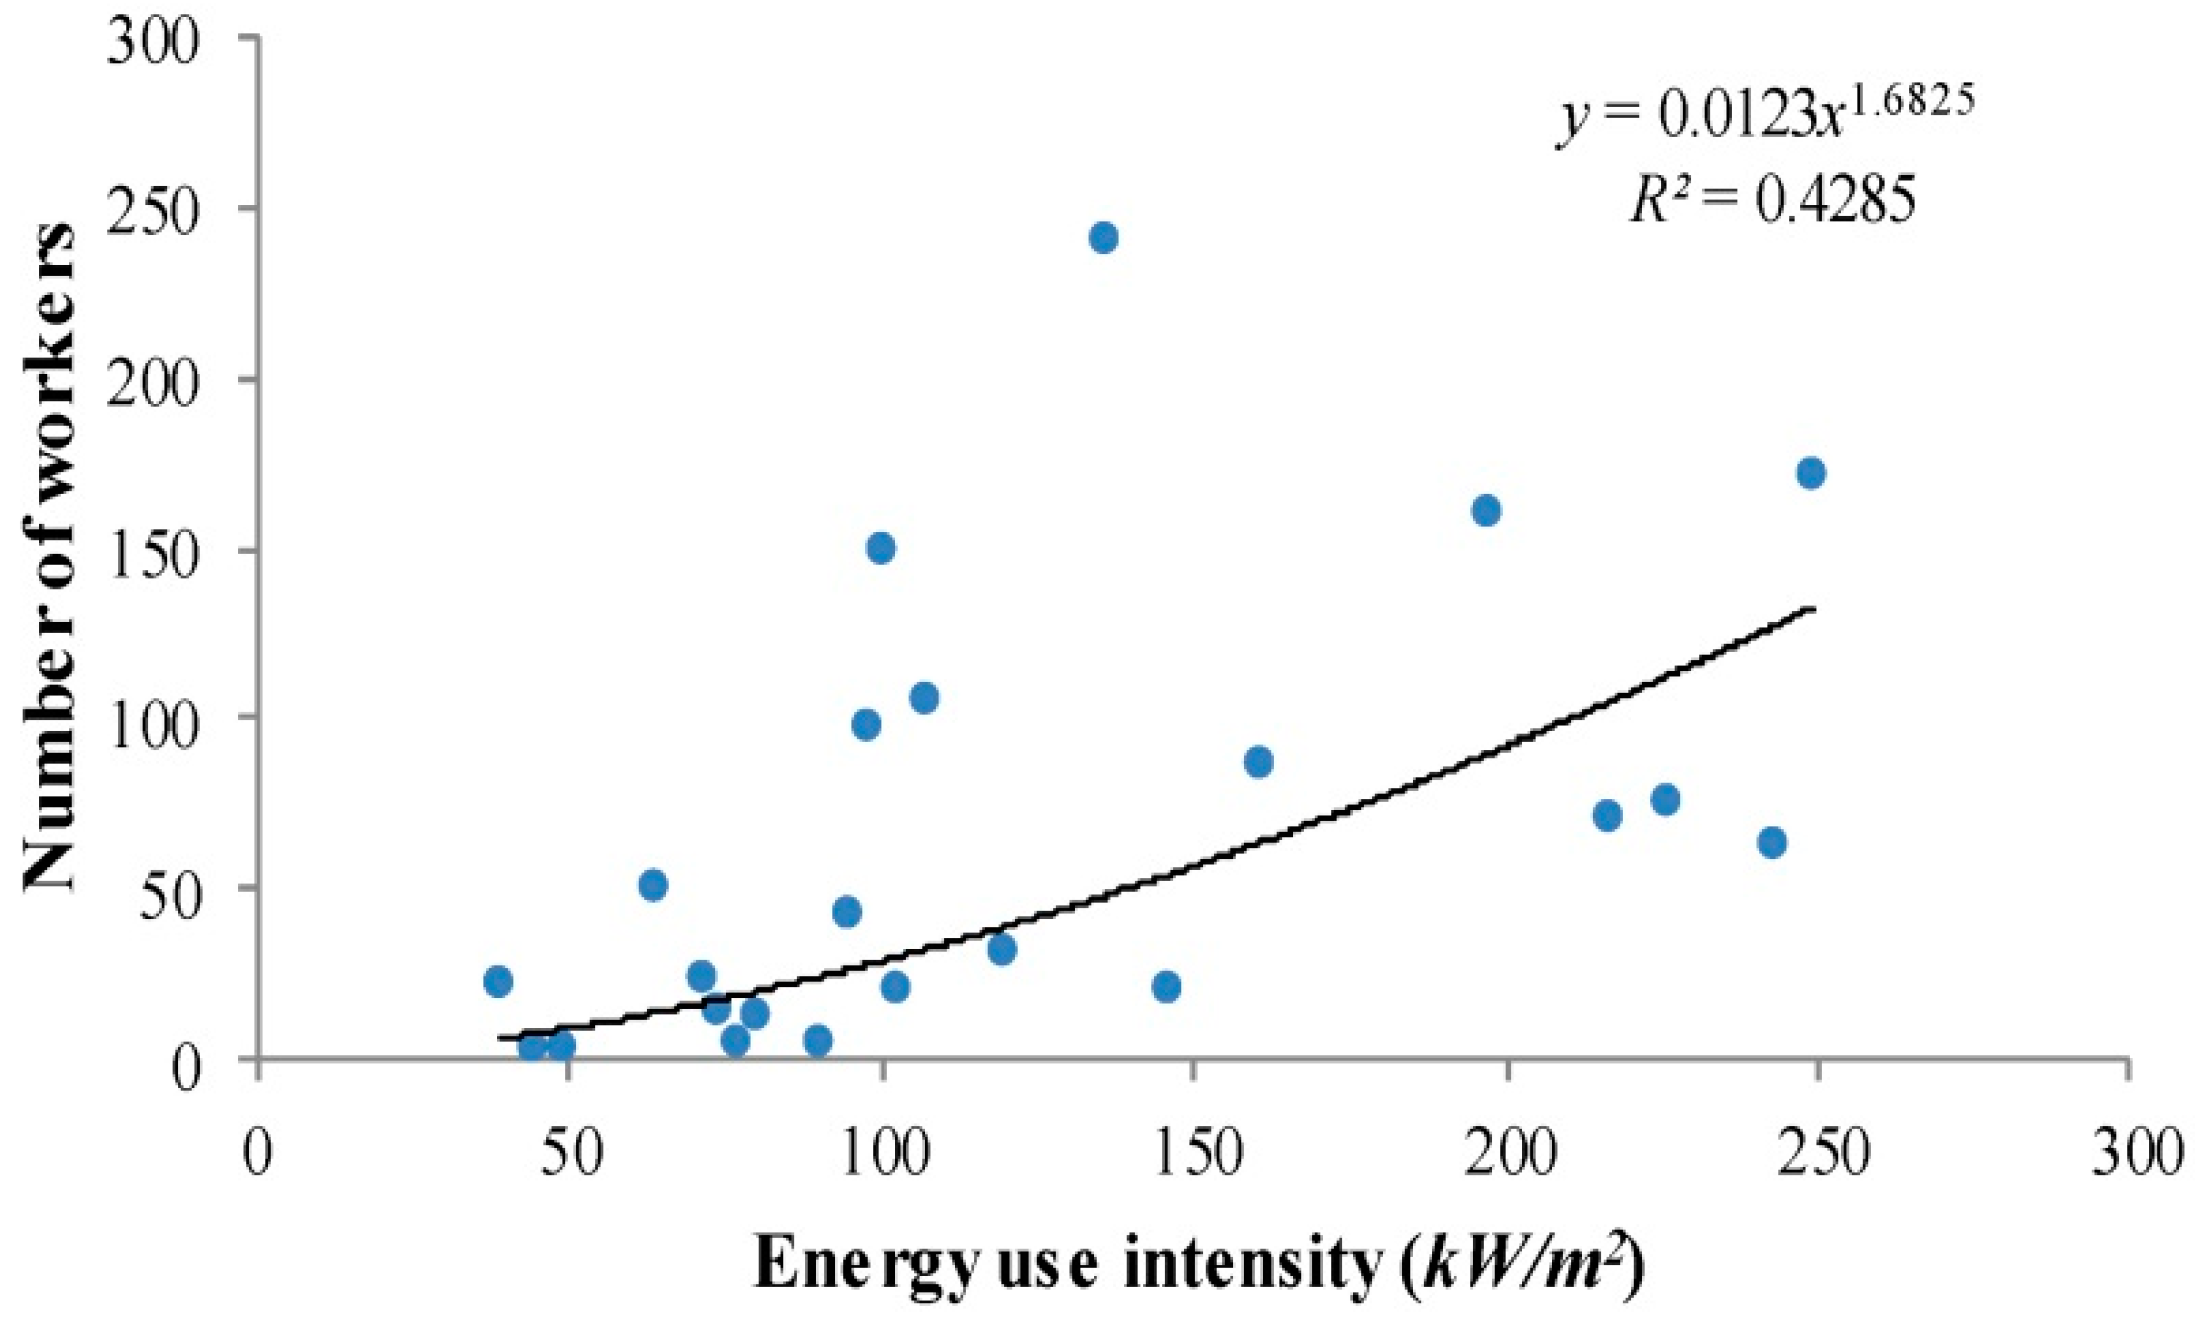
As shown in
Figure 5, the number of workers observed in surveyed hotels shows significant correlation with EUI. The data of worker numbers obtained refer to the sum of workers serving hotels, containing the staff, part-time workers and estimated outsourced workers. Variables were analyzed by the use of scatter plots to test exponential relationships between them. As the number of employees increased, hotels were found to put greater personnel costs and energy into management and operational processes. This is especially true for four-star hotels, in which the goal of the more professional staff is to provide luxurious service and the optimal experiences to guests. It has been reported previously that worker density (the number of workers on the main shift) is an indicator of the level of business activities in a hotel [
3,
9]. However, we did not take this into account in this study due to a lack of conclusive data of workers on the main shift from surveyed hotels and instead relied on the number of workers, which is more easily surveyed directly and accurately.
In addition, occupancy rate is commonly used to explain the number of overnight stays in hotel accommodation objectively and is considered indicative for evaluating the performance of hotels. The annual average occupancy rate in the sampled hotels was 58%, which varied from 40% to 76%. Wang [
3] found there to be a highly significant relationship between occupancy rate and EUI in Taiwan’s hotel industry, with a correlation factor of 0.712. Compared to that reported in Taiwan’s hotels, the correlation factor between occupancy rate and EUI shows lower significance in our study. Deng and Burnett reported that in high-quality hotels, air-conditioning operated 24 h a day to maintain a comfortable temperature and humidity, even when guest rooms were not occupied [
5]. This could possibly explain why the energy performance of hotels was not found to be greatly affected by the yearly occupancy rate.
4.3. Multiple Regression for the Predictive Model
As one of the basic tools of scientific investigation, multiple regression analysis is a linear technique to study the relationship between a response variable and a set of predictor variables [
29]. The regression model is obtained through comprehensive analysis of building characteristics, economic level, climate conditions, and other factors. Energy consumption is usually used to correlate with climatic variables in regression models in order to obtain an energy signature [
30]. Sharp established a linear regression model that found six major determinants in the predictive model for building energy consumption in commercial buildings [
31]. Several of the possible factors from Sharp’s study [
31] are included in the 17 variables surveyed in the Lijiang study (as shown in
Table 3) to determine the predictive model of EUI. Two variables were chosen to explain the model, and unrelated variables were excluded. Hotel star rating and yearly occupancy rate can be set as independent variables; moreover, hotel star rating was set as a dummy variable, taking a value of one for four-star hotels and zero for lower class hotels (one-, two-, and three-star hotels).
The prediction model can be written as follows:
where
X1 is the hotel star rating (dummy variable) and
X2 is the yearly occupancy rate.
As shown in
Table 4, hotel star rating and yearly occupancy rate are the significant predictor variables to the model, and their joint probability is 92%, indicating a strong correlation between EUI and the two influencing variables. In multivariate regression analysis, hotel star rating and yearly occupancy rate accounted for 85.8% and 6.2% of the total variance, respectively. Yearly occupancy rate explains 6.2% of the variability in EUI, where the
F change is 6.228 and
p = 0.037, <0.05. As the hotel star rating and occupancy rate increase, the EUI also increases, which is indicated by the positive regression coefficient.
4.4. Standardization of EUI
The energy consumption performance could be evaluated after the energy consumption quota was standardized. Chung et al. described a benchmarking method for the relationship between EUI and the explanatory factors in terms of multiple regression analysis. This method takes into account all significant factors to represent a normalized distribution of EUI [
19]. To eliminate the abnormal effects of EUI, standardization of EUI is necessary using a multivariate linear-regression approach to correlate significant indicators that affect energy performance.
Table 5 shows the statistical results of the explanatory variables, using the standardized model as established by Chung et al. [
19].
The standardized model is shown as:
where
EUIstd is the standardized EUI;
EUIobser is the observed EUI;
x1 is the hotel star rating (dummy variable); and
x2 is the yearly occupancy rate.
To a certain extent, the standardized model of EUI in Lijiang is limited by small sample sizes, but this study is, nevertheless, a hotel management policy indicator for the development of energy efficiency in the hotels of Lijiang. As the first-hand data were accurate and reliable, as well as the investigation covered most types of hotels, the results may prove to be representative for hotel energy performance evaluation in order to monitor energy performance and to improve standard scientific evaluation procedures for further evaluation of the hotel industry in China.
5. Conclusions
Energy performance was measured in this study by carrying out a survey of 24 hotels in Lijiang, China. Data were collected on variables, such as the operational and functional characteristics of the hotels. Electricity was the predominant energy consumption, accounting for 81% of the total annual energy consumption, which is similar to the result obtained in Taiwan (84%). The surveyed hotels could be divided into four star-rating classifications, and the EUI of the one-, two-, three-, and four-star hotels was 70.2, 74.2, 113.3, and 180.8 kWh/m
2, respectively. Further analysis of the EUI values indicates that the EUI in Lijiang, by contrast, was lower than that reported in Taiwan [
3], Singapore [
9], and Hong Kong [
5]; and that Lijiang hotels were less energy demanding than hotels in Canada [
6] and the U.K. [
11]. The EUI coincides approximately with the climate condition [
3,
8]. Mild weather and abundant sunshine might be part of the reason for the relatively low energy consumption in Lijiang. The climate in Lijiang is pleasant so that the hotels need both shorter summer cooling and winter heating. It is noted that solar energy was the main energy source in producing hot water in our findings. By taking into account the variables affecting energy performance, it was found that the number of guest rooms, hotel star rating, room revenue, and number of workers are the major determinants of hotel energy performance. Linear regression analysis was chosen as a predictive model of energy use intensity. Based on statistical analyses, two significant indicators represented a standardized distribution of EUI: hotel star rating and yearly occupancy rate. Hotels should be classified based on their individual characteristics and should develop energy efficiency policies according to the analyzed factors contributing most to their local energy consumption. The findings of this study could be regarded as a useful reference for hotel managers and those involved in tourist administration, and beneficial lessons can be extended to other districts, particularly tourist destinations within Southwestern China.
The simple meaning of energy efficiency is using less energy to perform the same tasks and functions. For hotels, this could mean savings in energy, costs, and emissions of greenhouse gases, such as CO
2 [
32]. Efficiency measures should take into account air-conditioning parameters, such as natural ventilation in selecting appropriate cooling and heating sources. Furthermore, it would be helpful to reduce energy consumption by moderately increasing guest room temperature, when rooms are not occupied. Monitoring of outdoor weather conditions and indoor temperature could be an effective method of controlling air conditioning units and saving electricity. On the basis of the Indoor Temperature Control Management Approach in Public Buildings in China [
33], the indoor temperature of hotels in Lijiang should not be set lower than 26 °C in summer. Intelligent lighting control systems should be established to manage illumination in different environments and different periods [
34]. Sixty percent of surveyed hotels used compact fluorescent lamps in areas with long-term illumination instead of incandescent lamps, which lowers lighting energy consumption. Eighty percent of sampled hotels chose solar energy as the main energy source in producing hot water; moreover, solar energy was suggested to be widely applied to more aspects of hotel operation other than heating; for example, lighting, catering, and so on. Some managers of the surveyed hotels considered reducing the cost of unnecessary elements as a good way to save energy and resources and encouraged guests to bring their own toiletries and to reduce the frequency of sheet cleaning. Most managers regarded the government and tourist administration as the important forces in boosting energy efficiency. The independent energy measures of catering supply, retail shops, laundry service, and other departments should be established in order to provide a separate energy use lists for hotel management. Energy monitoring platforms and energy audit management systems should be put in place to gain a comprehensive analysis.


