Article

A Study of Incentive Policies for Building-Integrated Photovoltaic Technology in Hong Kong

1
Department of Building Services Engineering, Faculty of Construction and Environment, The Hong Kong Polytechnic University, Hong Kong, China
2
Department of Land Surveying and Geo-Information, Faculty of Construction and Environment, The Hong Kong Polytechnic University, Hong Kong, China
*
Author to whom correspondence should be addressed.
Sustainability 2016, 8(8), 769; https://doi.org/10.3390/su8080769
Submission received: 24 May 2016 / Revised: 29 July 2016 / Accepted: 2 August 2016 / Published: 8 August 2016
(This article belongs to the Special Issue Renewable Energy Applications and Energy Saving in Buildings)

Abstract

:
Installing sustainable and renewable energy systems is a promising way of relieving Hong Kong’s dependence on imported fossil fuels. Solar photovoltaic (PV) technology is a perfect solution for Hong Kong as it fits the economic and geographic situation. Through a review of the PV development history of five leading PV countries, Germany, Japan, Italy, Mainland China, and the USA, this paper serves as a useful policy toolbox to aid PV development. Based on the forerunners’ successful PV industry experiences and Hong Kong’s unique local situations, a series of incentive strategies were proposed for Hong Kong to help promote the utilization of solar PV systems by reducing the initial investment and providing reasonable subsidies at the initial stages and during the operation period of the PV systems. These results could be a practical reference for promoting renewable energy applications for local policy-makers.

1. Introduction

Hong Kong started to play an important role in global economic development early last century. Since then, Hong Kong has been famous for its relatively high population density and beautiful city appearance. High prosperity and a large population no doubt results in huge energy consumption. As a high energy density city and a net energy importer, the dramatic rise in energy consumption and the constantly increasing energy demand pose quite the challenge to sustainable development in Hong Kong. For now, fossil fuels still take the dominant role (over 99%) in energy sources of Hong Kong [1]. It should be noted that with an area of only around 1100 square kilometers, it is impossible for Hong Kong to be self-sufficient in fossil fuel supply. The cost of fossil fuel imports is an important issue that affects the local economy. However, CO2 emissions from fossil fuels is also a critical issue that attracts attention from the whole society.
The application of sustainable and renewable energy in Hong Kong could be a promising way of reducing the financial and environmental costs of fossil fuel. Carbon intensity in the power sector can be reduced by reducing coal use and by increasing the use of lower carbon content fuels, such as natural gas, nuclear, and renewable energy. The proportion of each energy source in the chosen fuel mix depends on local availability and infrastructure as well as economic affordability. For a more holistic perspective, it would be prudent to also consider the life cycle carbon emissions of each fuel to ensure the effectiveness and sustainability of any proposed choice. The Hong Kong Special Administration Region (HKSAR) government has set a primary energy target of 50% nuclear, 40% gas, 3%–4% renewable energy, and not more than 10% coal up to 2020 [2]. With limited fossil fuel resources, Hong Kong’s low latitude subtropical climate location offers great potential for sustainable energy application. Currently, the major forms of renewable energy include biomass, solar, wind, hydro, and geothermal. Local scholars have conducted fruitful research work on Hong Kong’s sustainable energy application, and came out with quite detailed data about potential sustainable energy applications in Hong Kong.
In Hong Kong, the contribution from renewable energy at present comes mostly from biomass and waste conversion. Ni et al. did a very detailed and complete study on potential renewable energy applications in Hong Kong. They did a statistical analysis and research on three major waste types suitable for energy generation in Hong Kong, including solid waste, sewage sludge, and livestock waste. The hydrogen production per year from organic waste can generate up to 1.1 TWh of electrical energy with satisfactory efficiency, which could satisfy more than 4.0 % of the energy demand for transportation cost [3]. In addition, the local annual solar radiation level of 1350 kWh/m2 is abundant for solar photovoltaic (PV) application compared with other countries such as Germany, the United Kingdom, and Japan. According to the statistics of Peng and Lu, the annual potential energy output for a rooftop PV system is predicted to be 5981 GWh, which can account for 14.2% of the total electricity used in Hong Kong in 2011 [4]. Gao et al. applied a Multi-Population Genetic Algorithm to investigate the potential offshore wind energy in Hong Kong. They claimed that for the year 2011, the potential offshore wind annual electric generation was about 112.81 × 10⁸ kWh, which accounts for 1/4 of the total power consumption in 2011 under the layout optimized condition. They also found that the wind power potential is the highest in October but the lowest in August [5]. Furthermore, the lack of large running water systems in Hong Kong rules out hydro generation. Producing electricity from geothermal energy is not supported by exploitable resources in Hong Kong and land availability constraints limit economic opportunities for ground-based wind and solar photovoltaic generation. As stated above, it seems likely that wind and PV will become the most feasible sustainable energy forms in Hong Kong. This paper will focus on solar PV development in Hong Kong.
Solar PV systems can be defined as a combinations of several elements to generate electric from irradiation, which including modules and mechanical and electrical mountings, among others [6]. Systems of different scales, whether a large plant or small distributed, have different components and characteristic in engineering and economics [7,8]. From this point of view, the primary consideration when building a PV system is on-grid versus standalone [9,10,11], which depends on the margin above the electric demands. The specific mounting configuration is another significant factor that affects the system’s performance. Rack-mounted and BIPV [12] are two of the main mounted types usually used. In addition, several technologies can be combined with the original PV system in order to improve the efficiency or suitability for multiple environments, such as an MPPT tracking system [13], battery storage integrated [14,15,16], and other energy hybrids [17,18,19].
The most impactful method to improve PV module efficiency must be MPPT technology. MPPT have benefit to increase in the power delivered from the PV module to the end uses, and extend the PV operating time. Several MPPT techniques have been developed in recent years, including offline models (also known as model-base method, that the control signals are generated by physical values of the PV panel) [20,21,22,23], online method (also known as a model-free method, that the control signals are generated by instantaneous values of the PV output voltage or current) [24], and hybrid method [25].
One of the disadvantages of PV systems is that they cannot supply electricity demand outside of daylight hours. Therefore, in the case of off-grid applications, electricity storage becomes an inseparable part of PV generation (cost issues are ignored) to ensure higher power reliability. Therefore, energy storage, also called battery integrated, is one of the key issues to be solved in the roadmap of PV development [26].
Currently, the most pressing problem that engineers focus on is the size of batteries, which is a roadblock to commercial use even though many models t were established to improve the system’s economy [27,28,29,30]. However, research focused on energy storage for single-family dwellings indicated that integrated storage may increase by more than 100% annual PV self-consumption [31]. In addition, recent research shows that the PV-battery storage integrated system is still not ready for commercial rollout because suitable PV-batteries are sensitive to all the parameters and the battery will only have a positive impact on Net Present Value (NPV) at a low installation cost (e.g., below 750 USD/kWh) [32].
Another method to improve the electrified economy is using PV Hybrid Systems. For residential-scale photovoltaic arrays, the development of small-scale combined heating and power (CHP) systems has provided the opportunity for in-house power backup [33]. Recent work has shown that small-scale CHP and PV technologies can produce significant emission reductions at the residential level [34,35]. Other hybrid systems include PV-Diesel [36,37], PV-Wind [38,39,40], or PV-Wind-Diesel systems [41,42,43,44]. These kinds of hybrid system have lower costs than traditional systems.
A final way to reduce the lifetime cost of a PV system is recycling of PV modules [45]. From an economic point of view, energy payback time (EPBT) studies have shown great potential savings from recycling the low-efficiency module [46]. Currently there are three kinds of major recycling pathways focused on by researchers, including recycling of manufacturing waste, recycling of end-of-life or used module material, and module remanufacturing and reuse [47]. However, most PV modules are still lack the economic motivation to recycle [48].
In our study, considering the high building density and scarcity of land, mass installations on fields like in Mainland China, the USA, and some European countries is not practical in Hong Kong. However, with solar PV technologies becoming more mature, integrating PV systems with the envelope of buildings, especially the rooftop, which is also known as building-integrated photovoltaic (BIPV), offers a great opportunity for renewable energy development in Hong Kong. Compared with traditional PV systems, the BIPV system possesses many merits. It does not occupy land resources. It is also able to directly supply electricity at the place where it is installed. Moreover, the PV elements can be applied as an integral part of the building and reduce building material use. BIPV systems can not only generate electricity for free but also reduce building energy use by blocking out unwanted solar radiation and building solar heat gain. From the perspective of sustainability, the EPBT, and greenhouse gas payback time (GPBT) of PV systems range from 1.9 to 3.0 and 1.4 to 2.1 years, both of which are much less than their service life of 30 years. Their energy yield ratio (EYR) distribute from 10 to 15.8, generating about 10 times than their energy requirement during their lifetime [49]. In terms of GHG emissions, even the highest one, viz. the emission rate of mono-Si PV systems, was still an order of magnitude less than that of fossil fuel-based electricity in Hong Kong, which is about 700 g CO2-eq/kWh [50].
The first BIPV system in Hong Kong was installed on the roof of a building at Hong Kong Polytechnic University, which has been operating for over 14 years. PV electricity output from this system was stable and never required moving components or anything more than low-key maintenance work during these years’ operation. This demonstrates that the PV system provides the best reliability and feasibility of any BIPV system in Hong Kong.
According to the Global Future Report 2013, it is estimated that global solar PV capacity could reach 400–800 GW as soon as 2020 and as much as 8000 GW by 2050, which will save more than 53 million tons of CO2 emissions [51,52]. By the end of 2015, the Chinese mainland, the largest and fastest developing region in the world, reached 43.5 GW cumulative installed capacity as compared to only 19.2 GW in 2013. In the meantime, Germany and Italy have reached 39.7 GW and 18.9 GW, representing the largest PV penetration of the electricity demand (7.1% and 8.0%) in the world. Japan and the USA were positioned third and fourth in the list, having reached 34.4 GW and 25.6 GW with 11 GW and 7.3 GW annual installed capacity in 2015 [53]. However, PV application has not yet been well developed in Hong Kong in recent years. Although its solar energy resources are above the world average, the total PV installed capacity is less than 3 MWp and the actual PV electricity generation only accounts for a negligibly small share of the total energy end use in Hong Kong.
According to Karakaya’s research, barriers to the adoption of photovoltaic systems fall into four categories: sociotechnical barriers, management barriers, economic barriers, and policy barriers [54]. Hong Kong is a high-income economy with high quality of life, which means sociotechnical issues are not a barrier. The biggest obstacle to the wide application of PV systems in Hong Kong is the expensive installation cost, which is nearly 2.5 times higher than in Germany and 4 times higher than in Mainland China, so that is an economic barrier [55,56]. The higher installation cost for PV systems also results in a higher levelized cost of PV electricity, than 2 HKD/kWh, while the domestic tariff of electricity in Hong Kong varies from 0.81 HKD/kWh to 1.75 HKD/kWh depending on the monthly electricity consumption. Although the global market cost of PV electricity has already dramatically decreased, it is still not profitable in Hong Kong due to the very high installation costs. In conjunction with their high cost in initial capital, PV systems are not profitable without policy support. For this reason, policy measures are of vital importance for the rapid diffusion of environmentally friendly innovations including PV systems. Especially in the case of Hong Kong, the lack of participation of stakeholders or members of the community in energy policy planning and the lack of incentives to support the adoption are the greatest barriers [57].
Policy support is the key to the future development of the PV industry, for both the private investors and governments involved. There have been many attempts to measure the success of government policies on renewable energy sources [58,59,60]. Many studies show the success in development around the world, such as Japan [61], Australia [62], China [63], the USA [64], and the EU [65].
Throughout the development process of those PV leading countries and regions, PV applications were provided with generous subsidies from governments at the initial development stage, when PV electricity was much more expensive than other sources of electricity; then the subsidies gradually decreased according to the cost reduction of PV systems. The Hong Kong government has not yet introduced any subsidies to increase users’ enthusiasm in installing PV systems; there is a need for public authorities of HKSAR to increase support for PV applications.
In this paper, a simple input/output methodology is employed. The histories of PV development and application were reviewed as the inputs. Five leading economies in PV application, Japan, Germany, Italy, the USA, and Mainland China, were selected as discussed in the above section. Their subsidies and policies from different eras were collected and analyzed. Then a policy tools box was generated as the methodology output. Their experiences were referred to while a series of strategies and policies that fit Hong Kong’s situation was developed. It was hoped that the conclusions of this study could serve as a practical reference for local researchers as well as policy-makers.

2. Subsidies in PV Leading Countries

Since the “Energy Crisis” last century, the major economies started to consider their energy policies carefully. Much more attention was paid to the development of sustainable energy as an acceptable alternative for traditional fossil energy sources. In the following section, four main economies were selected, Japan, Germany, Italy, Mainland China, and the USA. Their PV policies are collected and reviewed here. It is hoped that through this research, a series of policies and strategies that fit Hong Kong’s situation could be developed.

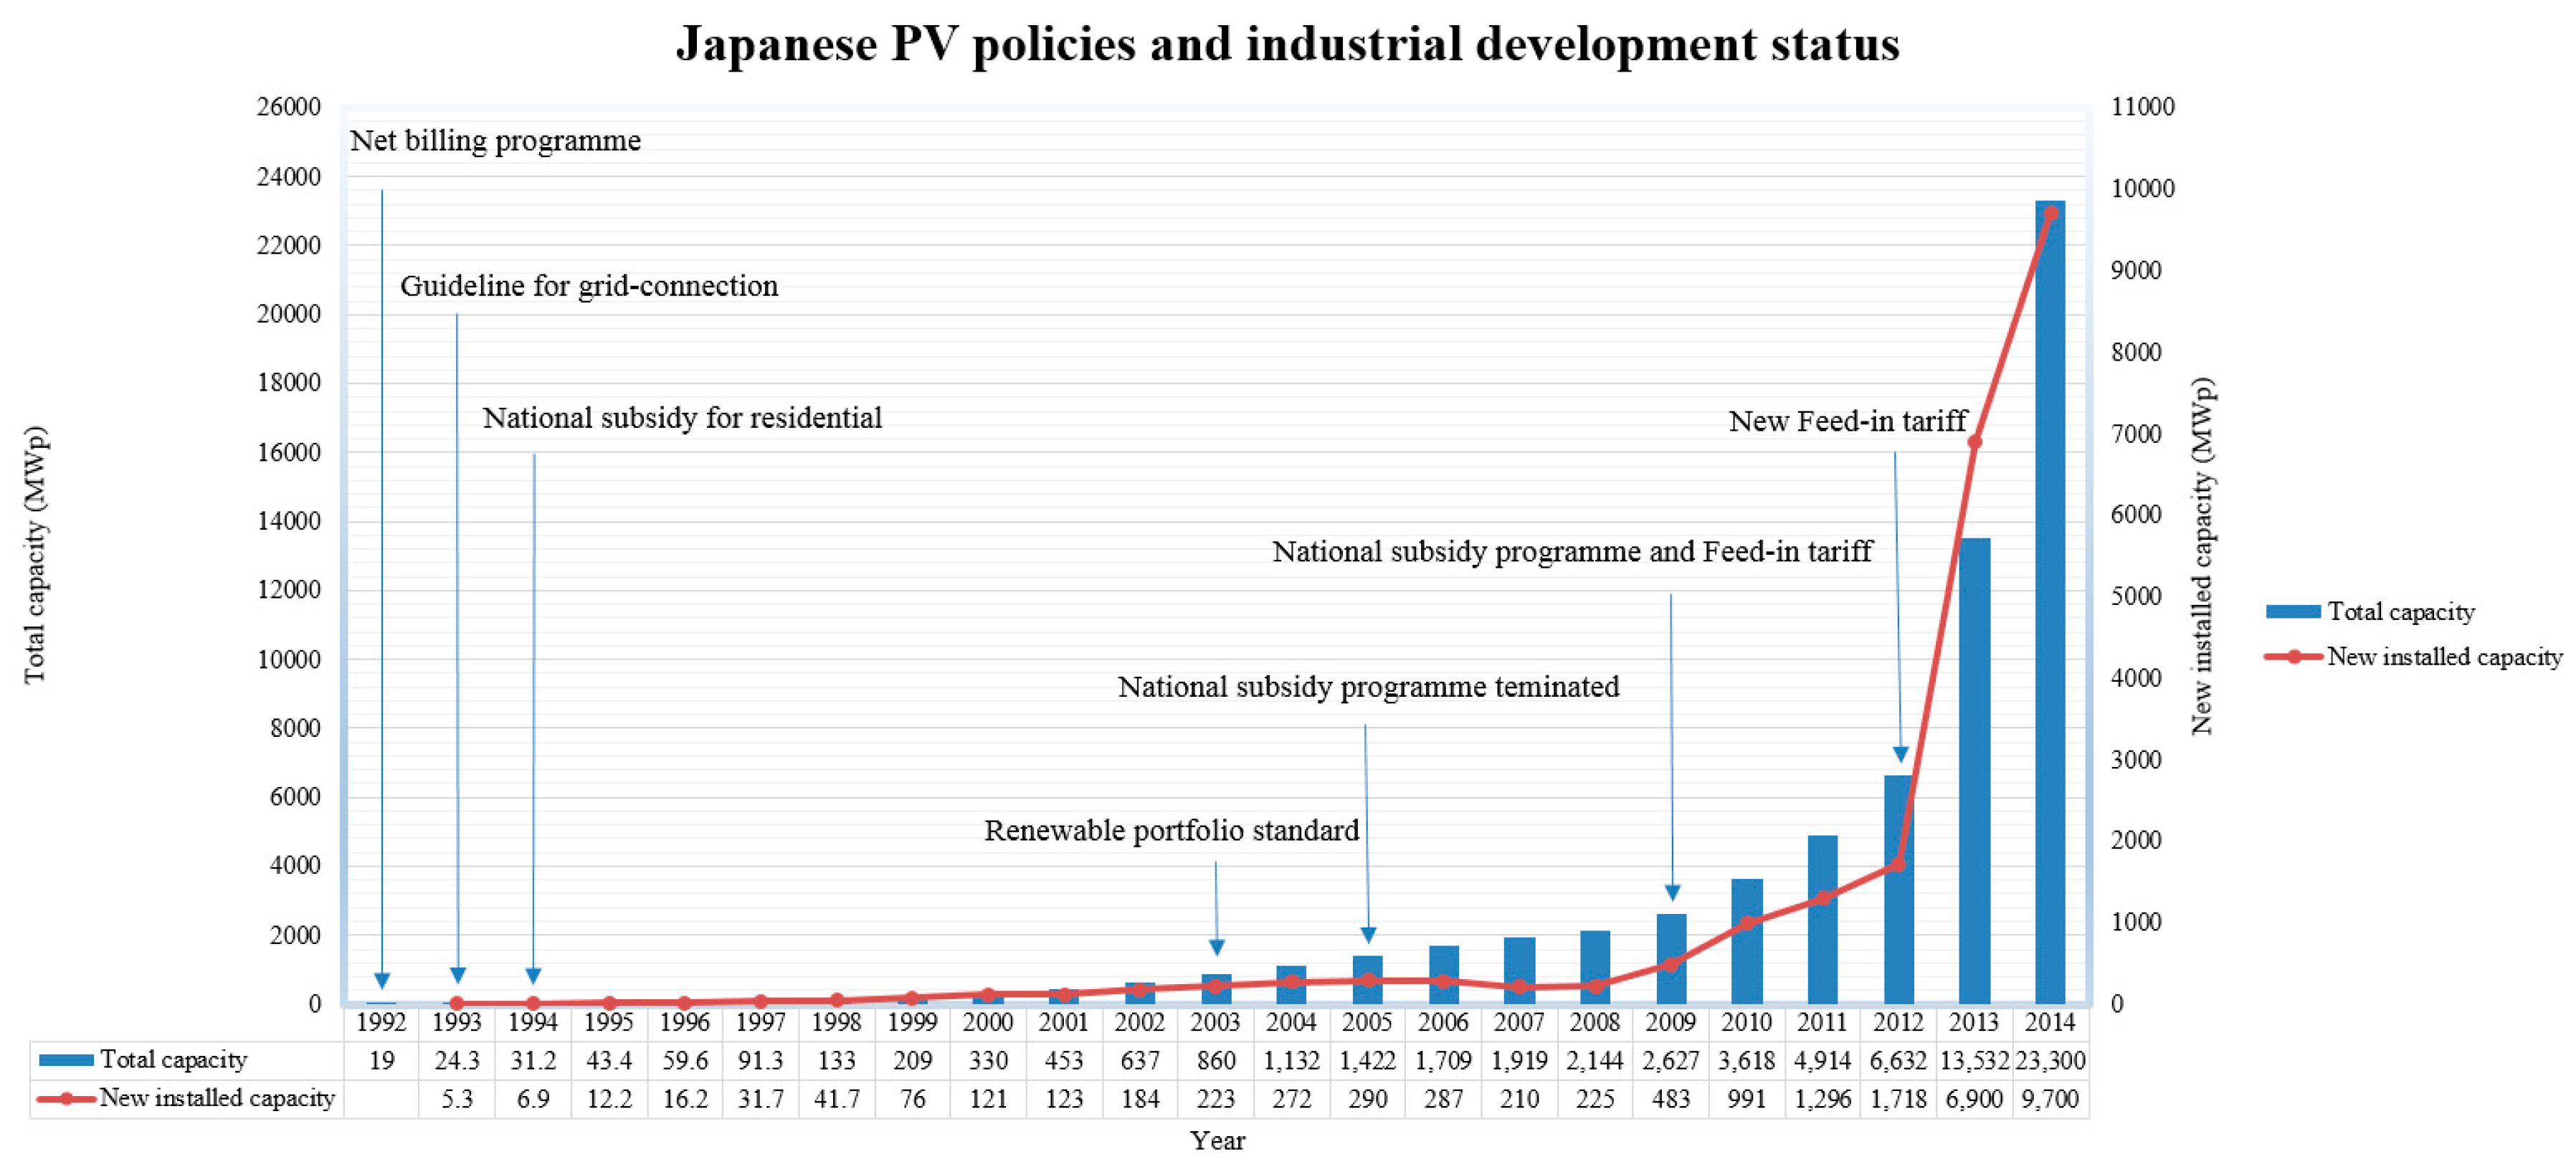
2.1. PV Incentive Policies in Japan

Japan was one of the earliest countries that developed and applied solar photovoltaic. In the early 1980s, the New Energy and Industrial Technology Development Organization started to research and develop PV systems, aiming at practical application. In the early 1990s, the basic problems involving the installation and connection of the PV system were solved. The first public support for a PV application, the “Net Billing Program”, came out in 1992. This program was launched autonomously by 10 domestic electrical enterprises rather than the government to purchase PV electricity at a market price of 23 JPY/kWh. Soon afterwards, the Japanese government officially approved the Guideline for Grid-connection for PV electricity in 1993 [66].
In 1994, the Japanese government introduced a specific PV program of National Subsidy for Residential Buildings whereby the government subsidized 50% of the PV installation cost for those with installed capacity less than 5 KW, with a ceiling price of 900 JPY/Wp. The subsidy value for installation had been annually adjusted according to market changes. This program greatly promoted PV development in Japan; by the time of its termination, the installation cost had declined from 1920 JPY/W in 1994 to 661 JPY/W in 2005. Although the subsidy value was reduced to 20 JPY/Wp, the domestic PV installed capacity in Japan had been over 1422 MW until the year 2005 [66,67,68,69].
However, due to the subsidy value for PV installation decreasing and the government failing to follow up with new subsidy policies, the profitability of PV electricity generation decreased. As shown in Figure 1, Japan’s PV market developed slowly; especially after the installation subsidy was terminated in 2005, the growth rate of PV installed capacity started falling. In spite of that, the Japanese government attempted to revive the PV market. In 2003 they introduced a new renewable energy policy known as Renewable Portfolio Standard (RPS), which determined that utility companies had an obligation to purchase a specific percentage (at least 1.35%) of renewable electricity. This policy did not expand with apparent effect; the new installed capacity was still declining year by year during 2005 to 2008 [70,71]. In 2009, the Japanese government re-executed the subsidy for PV installation at 70 JPY/W. In November of same year, the Japanese government introduced a feed-in tariff mechanism for PV electricity with 48 JPY/kWh for those installations less than 10 kW and paid over a duration of 10 years. Although the Japanese feed-in tariff was only provided on the surplus of photovoltaic electricity after meeting the residential use, Japan’s PV market was revitalized immediately in 2009, and the newly installed capacity was more than double that of 2008. These two subsidy policies had particular influence on the development of BIPV systems, in that more than 90% of PV systems were installed on residential buildings [66,72,73].
After the nuclear disaster at Fukushima, there was more of an emphasis on renewable energy development. The Japanese government passed the Act on Purchase of Renewable Energy Sourced Electricity, which created a more comprehensive feed-in tariff mechanism in 2012 and set targets for PV installation: that the cumulative installed capacity would increase to 28 GW in 2020 and reach 50 GW in 2030. Unlike with previous subsidies, BIPV systems were encouraged to be installed on large commercial and industrial rooftops rather than on residential buildings. Faced with a more generous subsidy, BIPV was becoming more and more profitable in Japan and attracted a large number of investors. As shown in Figure 1, the total installed capacity skyrocketed by 351% between 2012 and 2014.

2.2. PV Incentive Policies in Germany

Germany was also one of the earliest countries to have widespread PV application. The Electricity Feed-in Act of 1991 was the first German governmental PV support scheme that facilitated the development of renewable energy. “The Thousand Solar Roofs Program”, the first specific support scheme for the PV industry, was formulated the same year and implemented until 1995. It subsidized 70% of the PV system’s cost for solar roof programs from 1 kW to 5 kW [75]. Soon, the Thousand Solar Roofs Program was granted by the state-owned development bank (KfW) between 1999 and 2003. It provided loans at low interest rates for PV projects; consequently, the deployment of the Thousand Solar Roof Programs was completed soon and the total installed capacity reached 435 MW by 2003 [76].
Germany stood out from the old Electricity Feed-in Act and dedicatedly enacted the new tariff for PV electricity in the EEG (Erneuerbare Energien Gesetz) Law of 2004, which raised the feed-in tariff from 0.09 EUR/kWh to 0.51EUR/kWh for a 20-year period for both ground-based and rooftop systems. In order to encourage cost reductions, the feed-in tariff decreased by at least 5% each year, indiscriminate of regions and capacities. The rate of feed-in tariff decline kept increasing in recent years; for instance, a decline of 24% was found in 2011 when the newly installed capacity exceeded 7.4 GWp [77].
After experiencing constant high-speed growth during the past eight years, Germany’s renewable policy for PV market underwent a great change in 2012 due to the New EEG Law. The major changes included the introduction of a threshold of 52 GW total installed capacity, the reduction of the feed-in tariff rate to less than 0.14 EUR/kWh, which was a digressive schedule based on the installed capacity, and a limitation on the amount of PV electricity exported to the utility grid. These changes represented an effort to transition PV to a new, incentive-free policy paradigm [78]. As shown in Figure 2, the growth rate of PV installed capacity plummeted in 2013 and 2014.

2.3. PV Incentive Policies in Italy

Italy has the second largest PV capacity in the EU at 18.9 GW, which corresponded to 9.08% of the national power production at the end of 2015 [79]. However, the pathway of development is quite different from Germany’s. The first policy implemented by the government was the “Photovoltaic roofs” program of 2001. This program provided financial support, up to 75% of the total capital costs, to install a PV system with peak power between 1 and 20 kWp. In other words, investors could obtain a maximum refund of 8005.08 €/kW on the investment cost of PV systems with nominal power up to 5 kWp, which linearly decreased to 7230.40 €/kW for an installed power of 20 kWp [80]. Unfortunately, although the program provide about 27.0 MW capacity in 2003, it still had a disadvantage that did not reward the PV system with higher efficiency and electricity generation. Based on the unacceptable cost of replacing or repairing the broken equipment at that time, many PV systems were turn off after a few years. The producers also had no motivation to spend their resources to maintain their systems [81]. As a result, the installation of PV plants in Italy was unregulated until 2006.
In 2005, in order to put the European Union 2001/77/EC Directive into effect, the Italian government implemented a Feed-in Tariffs scheme to incentivize the PV systems’ diffusion, which was called 1st “Conto Energia” [82,83]. In this scheme, PV owners had thepossibility of selling the electricity exported to the grid and alternative use of the net metering service for PV systems with a peak power up to 20 kWp. Meanwhile, a premium tariff for the electricity generated by PV systems with a peak power up to 1000 kW was provided by the government to PV owners for 20 years. The range of premiums varied from 0.460 €/kWh to 0.490 €/kWh for a 3–1000 kW PV system. This incentive resulted in the 500 MW of PV installed power target being reached in March 2006.
Then a new program was carried out in 2007, named 2nd “Conto Energia,” which was set a 1200 MW target of PV capacity to be installed at a national level [84]. Based on all the terms of the 1st phase, only the premium tariff was modified according to the architectural typologies of the system. Building integrated PV (BIPV) systems and partially BIPVs were selected to receive a higher tariff than other PVs. Meanwhile, a premium tariff de-escalation rate of 2%/year was fixed for PV systems installed after 2008. This incentive prompted a giant growth in PV investment; annual installation capacity reached more than 300 MW in 2007 and 2008. However, at the same time, the tariffs paid by government had reached 110 million euros.
In 2009 the AEEG modified the terms and conditions of net metering service [85] so that cover the fees incurred by customers for withdrawing electricity from the grid. Hourly market price of the electricity exported or imported by PV systems was also considered at various hours of the day in a given calendar year. In 2009, the annual installation reached 1.144 GW, which was more than triple the value from 2008. The rapid market growth seen in 2008 and 2009 was driven by the changes to the FiT decree, which were adopted in early 2007.
The 3rd “Conto Energia” was carried out in 2010; besides regular PV systems, it scheduled the installation of Building Integrated PV (BIPV) systems and advanced concentrating PV (CPV) systems, which were reached an accumulated capacity of 3500 MW [86]. This movement reduced the tariffs in multiple phases. The government hoped it would not put the development of PV at risk in Italy.
The 4th “Conto Energia” [87], which was carried out in June 2011, offered a modified net metering service and simplified purchase and resale arrangements for the electric send into the grid by all kinds of PV systems. At the end of August 2012, this CE was finished. Because the total amount of incentives paid by government reached the target value of 6 M€/year. In 2011, the total installations were schemed to about 3000 to 5000 MW. To keep investors’ confidence in strong, government decided to maintain registration under the current CE program [88].
After the 4th “Conto Energia” ceased, the 5th “Conto Energia” [89] was implemented, under the condition that the total amount of paid incentives was fixed at the target of 6.7 M€/year. Due to the tight incentive budget, the 5th “Conto Energia” had a short life and ceased by July 2013. The total installation capacity in Italy was 17.08 GW in 526,000 plant sites in the middle of 2013. The Italy case shows intense government promotion development in PV, with a heavy debt shouldered by the government. The result shows a rapid but unsustainable growth in PV installation.

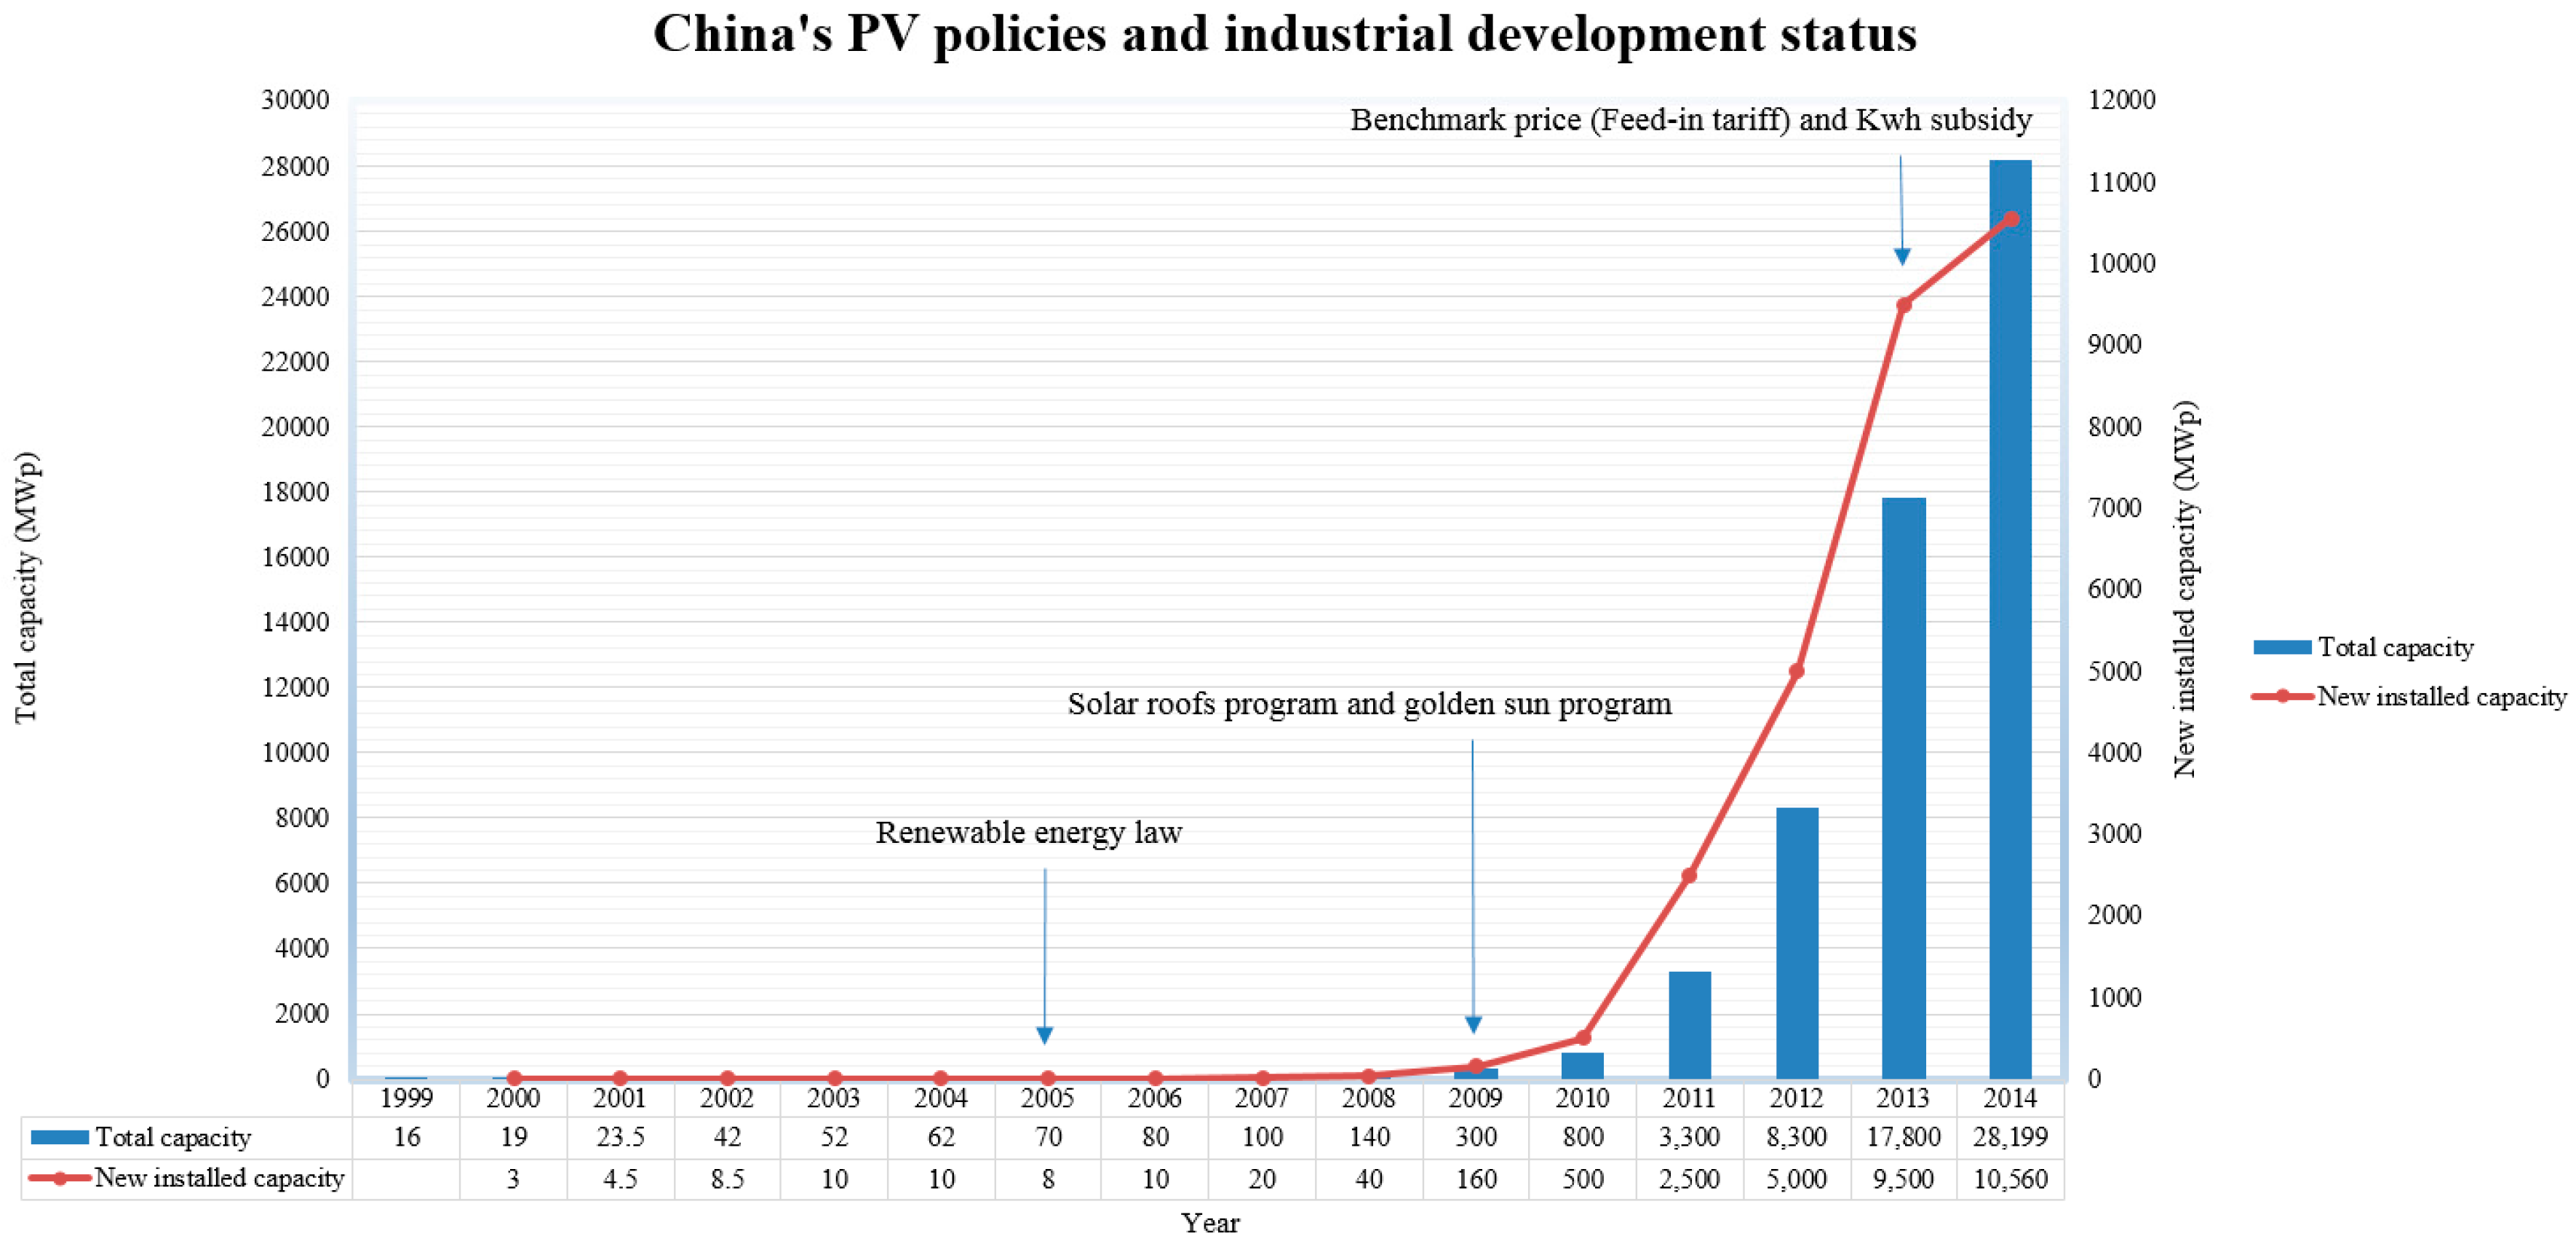
2.4. PV Incentive Policies in Mainland China

Beginning with the enactment of the Renewable Energy Law (REL) in 2005, China has relied on a wide and diverse mix of policy instruments to promote renewable energy growth. PV electricity was identified as the prior renewable energy source to resolve power supply issues in remote rural areas and enhance the utilization of renewable energy in urban areas. The REL set a national target for renewable energy development, and mandated grid companies to purchase all renewable electricity at a price higher than coal-fired electricity; in addition, a specific fund was established to provide additional financial support for renewable energy development, including R&D, pilot projects, rural utilization of renewables, and standard setting and assessment [90].
In order to implement the national strategy of “energy-saving”, the Chinese government strengthened support for PV development. In 2009, the ministers of finance and housing and urban–rural development jointly issued “The enforcement advice for promoting solar energy applications in buildings” and “The interim procedures for financial subsidy of solar photovoltaic application in buildings”. These two official documents raised China’s solar roof program and provided financial subsidies for PV installation at 20 RMB/Wp. Additionally, in the middle of 2009, the ministers of finance, science and technology, and national energy administration jointly issued “The notice for implementation of golden sun program” and “The interim procedures for financial subsidy of golden sun program”. The Golden sun program clearly stated that the government would undertake 50% of the investment costs for on-grid PV systems and 70% for off-grid PV systems in remote regions of China. Subsequently, the subsidy of the Golden sun program was adjusted in 2010 so that installation subsidy for BIPV was reduced to 17 RMB/Wp and 13 RMB/Wp for BAPV systems. With the implementation of installation subsidies provided by the solar roof program and the Golden sun program, China’s PV industry has developed dramatically since 2009: the cumulative installed capacity increased from 300 MW in 2009 to 17,800 MW in 2013, as shown in Figure 3.
The fast progress of the PV application, especially the fairly short payback period after being subsidized, greatly stimulated people’s motivation to install PV systems. For the sake of promoting the healthy and rapid development of the PV industry, although the Chinese government gradually reduced subsidies for the Golden sun and solar roof programs, new incentive measures known as PV electricity grants (PVEG) were implemented that granted the power generated by distributed PV systems with 0.42 RMB/kWh and provided feed-in tariffs for ground-based PV systems (called the benchmark price) that differed in terms of regional solar energy resource distribution in China [91], as presented in Figure 4. As shown below, the feed-in tariff rate is 0.9 RMB/kWh for zone I, which has the most abundant solar energy resources; 0.95 RMB/kWh for zone II, which is slightly less abundant than zone I; and 1 RMB/kWh for zones III and VI.

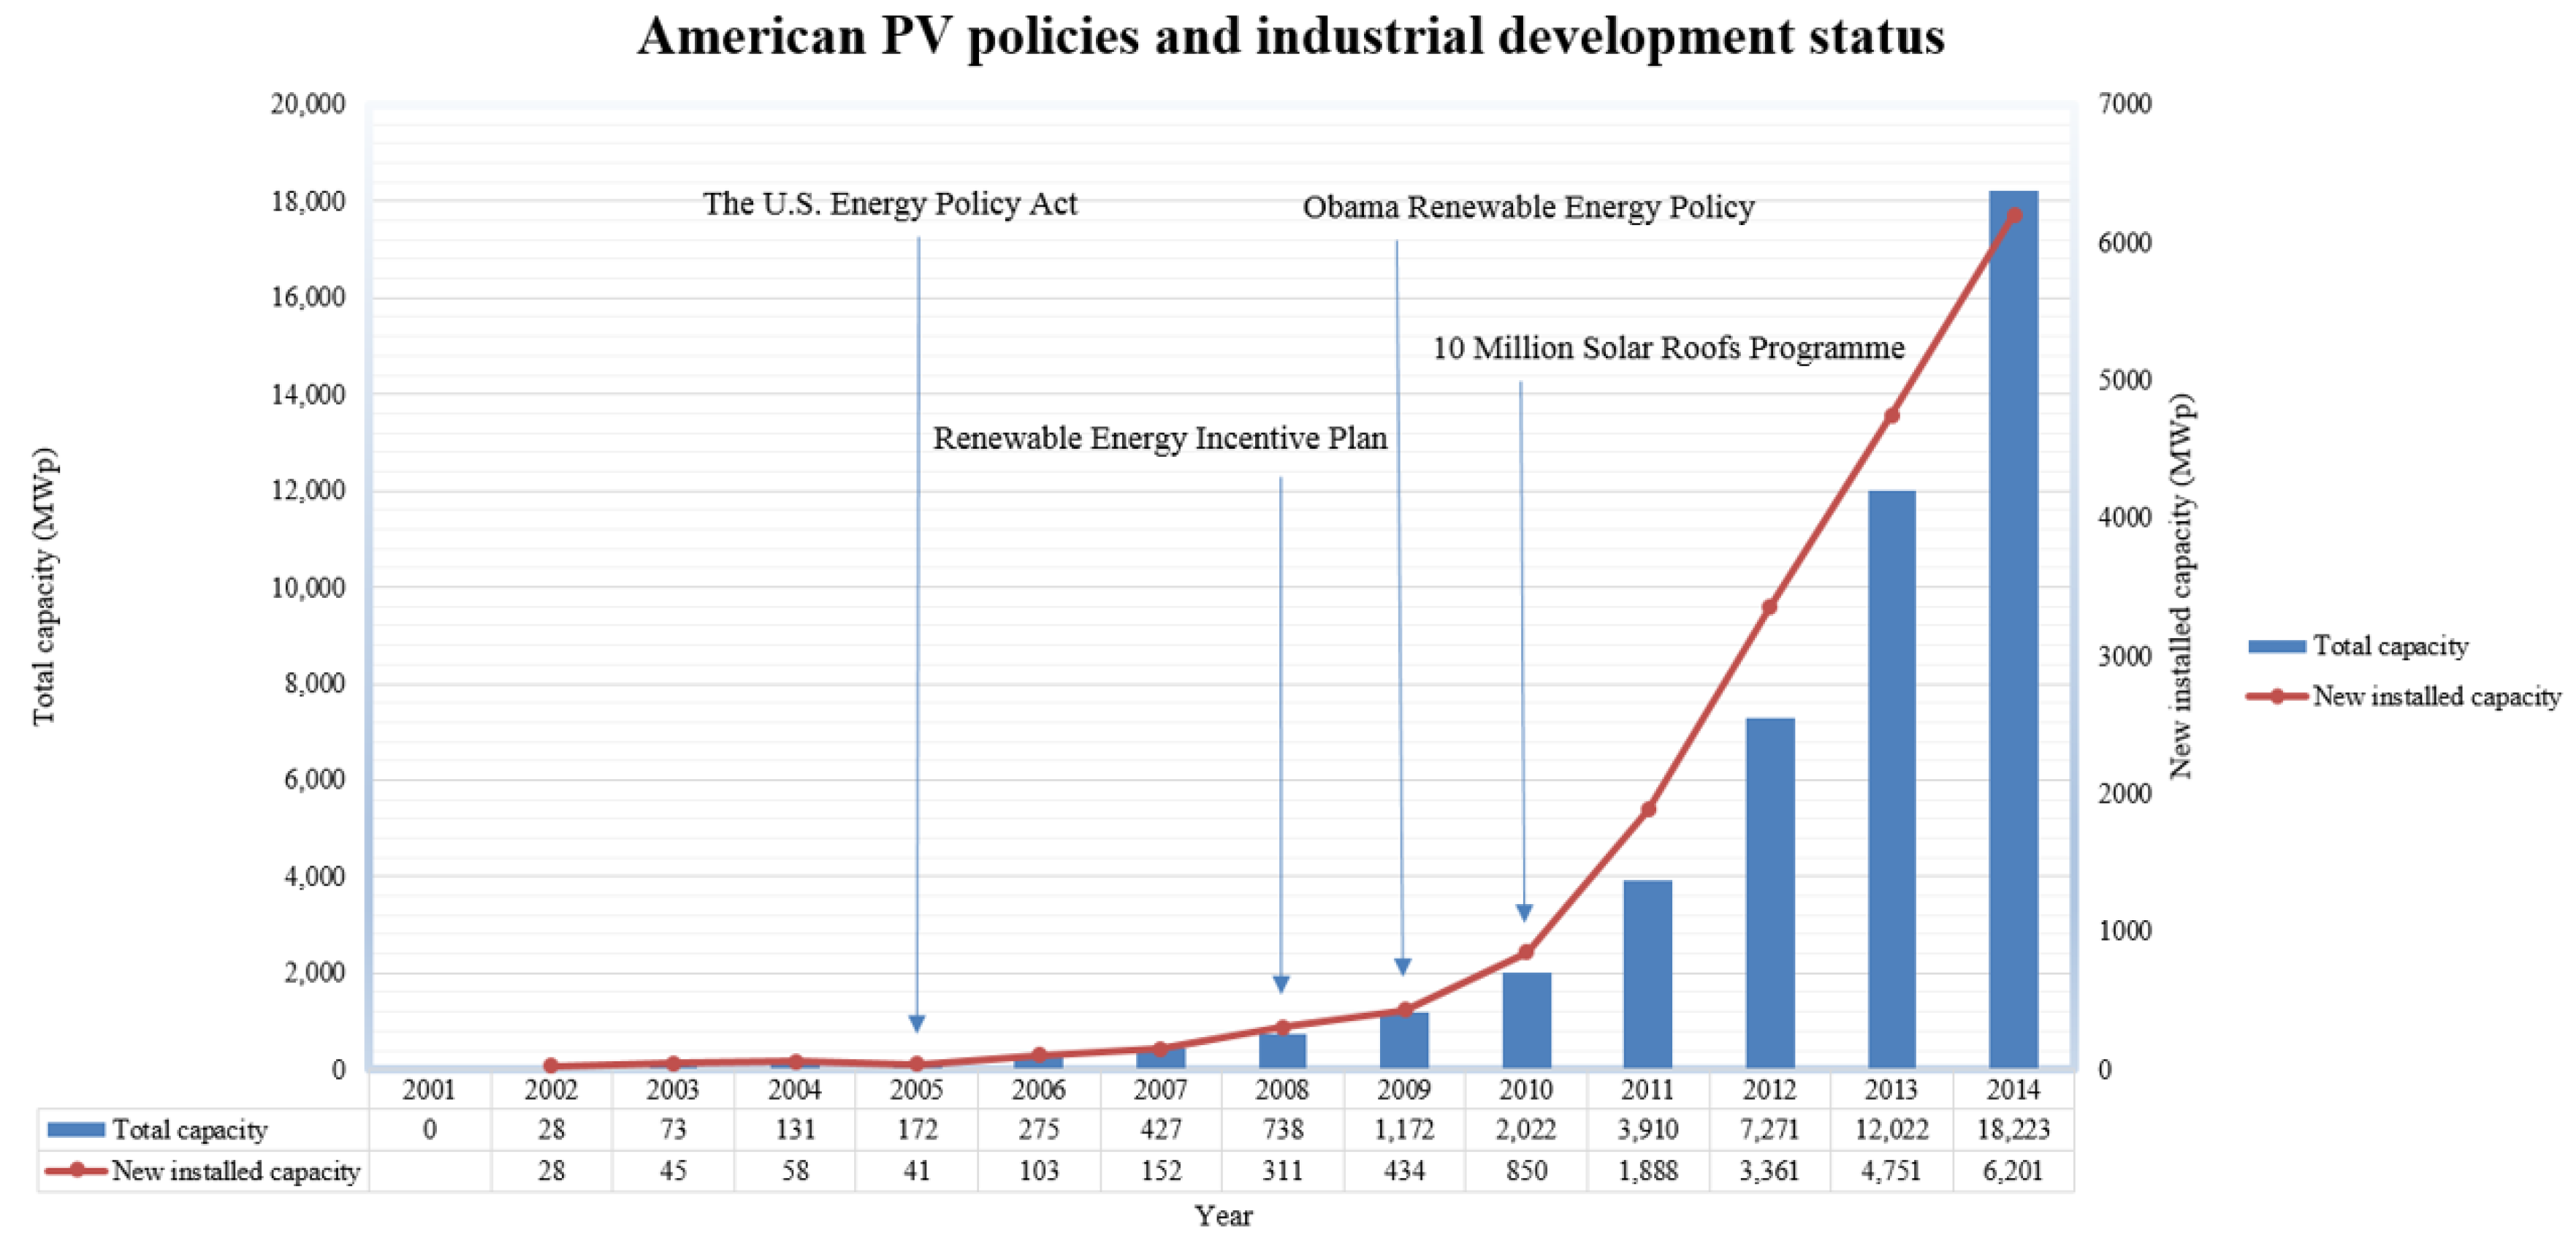
2.5. PV Incentive Policies in the USA

The USA has abundant solar energy resources and its PV application ought to be far more developed than that in Europe and Japan. However, due to the lack of sufficient policy support, the overall maturity of the American PV industry is less advanced than in Europe and Japan [92]. With the increasing scarcity of global energy, the U.S. government had paid much more attention to renewable energy and stepped up efforts to promote the PV industry.
The first incentive subsidy to renewable energy appeared as early as 1978 in the Public Utility Regulatory Policies Act, which mandated the price standard for electricity sourced from renewable energy in accordance with the avoided cost of fossil fuel. In 1992, the U.S. government passed the U.S. Energy Policy Act, which laid claim to the proportion of renewable energy in electricity demand and allowed renewable energy access to the grid. Furthermore, the new policy was also an offer to subsidize PV projects with tax credits.
In the year 2005, the government updated the U.S. Energy Policy Act to set detailed rules for the proportion of renewable energy in electricity demand, should reach 7.5% by 2010. Moreover, the policy also urged governmental buildings to take the lead in using renewable electricity. In addition, the category of items for tax credits extended to investment tax and PV equipment and products. Subsequently, the U.S. government formulated the Renewable Energy Incentive Plan, which provided preferential policies on investment and financing for PV policies in 2008. This plan included $6 billion to support bank loans and loan guarantees for the PV industry and subsidized PV projects that had been constructed before 2010; and $0.8 billion of energy-saving bonds to support R&D of PV technology. At the same time, many states also introduced local renewable energy policies to support the PV industry, such as states’ tax credits, high purchasing price to surplus solar electricity, etc. With the development of PV technology, the U.S. government realized and became increasingly focused on promoting the application of BIPV. The 10 million Solar Roofs Program was launched in 2010. Since 2012, the U.S. government has invested $250 million in the construction of solar power rooftops and enlarged the budget on an annual basis, aiming to reach 100 GW by 2021. From Figure 5, it is clear that the incentive policies launched by the U.S. government had the expected effect, and PV application achieved explosive development since 2008. The newly installed capacity increased by nearly 20 times in just six years, making the total capacity almost 20 GWp.
In 2008, a global financial crisis hit the U.S. economy hard and caused huge losses. In order to stimulate economic resurgence and create more jobs, the U.S. government enhanced the support to renewable energy, especially for the PV industry, which was known as the Obama Renewable Energy Policy. This policy carved out more in the budget for subsidizing PV industry on the basis of the original support, which aimed at 10% of electricity supply sourced from renewable energy in 2012; this proportion would rise to 25% in 2025.

2.6. Lessons Learned from Leading Countries

Following a review of the incentive policy instruments in five leading countries, Germany, Italy, Japan, Mainland China, and the United States, it was found that their incentive policies could be classified into two main categories.
One focuses on helping investors to reduce the investment threshold, for instance, introducing laws to encourage and formalize the application of PV electricity, or subsidizing PV installations to reduce initial capital input and reduce the financial cost.
The other focuses on improving the PV investment return, such as a feed-in tariff (FiT), which means preferentially purchasing the PV electricity at a higher price than the domestic tariff; it has been the most widely implemented PV electricity incentive in recent years. This kind of incentive encourages the public to transmit all the PV electricity generated to the utility grid. As the return on electricity sales is relatively stable, people are keen on investing in large-scale ground-mounted PV power plants. In addition, a PV electricity grant (PVEG), which is more specifically to encourage distributed PV installation (for example, building integrated photovoltaic), is another effective incentive measure. PVEG aims to encourage PV electricity used on the spot and the surplus electricity is transmitted to the utility grid. On the one hand, using the electricity generated by PV systems can cut electricity bills; on the other hand, the additional subsidy granted with the use of PV electricity enhances the return rate to investors. Detailed classification of the incentive policies is presented in Table 1 and Table 2.
The effects of each tool are described in more detail below. First, the law, though necessary, is the weakest tool because it does not directly create investment but gives investors and householders a “guide” or “roadmap” to take action, which means they will build PV systems in the specific technology forms and management mode that the government thought would be beneficial in the long term rather than investment myopia. Secondly, the investment program carried out by the government or company is the strongest tool in the box. This can be proved by the fast increase in capacity after a program is carried out, such as the annual installed capacity increasing more than three-fold after the start of the Gold sun and 10 million roofs projects in Mainland China in 2009. However, this kind of tool has a limitation when extended to residential PV systems, because the householder or building owner must be persuaded to install the device on the outside of their building even though this produces no direct profit and mars the appearance of the building. Thirdly, financing measures are only an auxiliary tool to help development. They will be powerful during a period of expansion in an investment program since they will generate a multiplier effect on investment. In addition, a feed-in tariff is another boost to investment programs. These measures will lighten the capital burden on government, in turn releasing more civilian capital to invest in the PV system, which is more suitable for “small government.” It crosses economic barriers in a more free-market way. The last tool in the box is PVEG, which is similar to the feed-in tariff above. With the joint efforts of these leading countries in recent years, the hard cost of PV installations has already been dramatically reduced. Therefore, PV technology has become a significant and widely accepted source of renewable energy. Expensive initial investment for installation was no longer a major issue for many countries. In order to quickly promote PV application, governmental supports to increase investment return (for example, Fit and PVEG) have gradually replaced the subsidies of reducing investment capital input to become the mainstream of incentive policies.

3. Discussion of the Hong Kong Case

3.1. Technology Choice for HK

Hong Kong is a high-density city whose area reaches 1105 km2 and has more than 7.3 million residents. However, Hong Kong has limited land for installing large-scale solar plants. Thus, Building integrated Photovoltaic (BIPV) systems, small-scale PV systems that can be installed on vertical building façades or rooftops, are suggested in cities such as Hong Kong.
Building Integrated Photovoltaics (BIPV) is almost maintenance-free and can be integrated with outside of buildings, such as roofs, facades, curtain walls, skylights, etc.
The building rooftop PV system is the most typical technology of BIPV. Based on the previous study, this kind of system has the potential to generate more than 14% of electricity mix with currently available technology and no extra land requirements in Hong Kong.

3.2. Installation Resources for BIPV in HK

Most previous studies focused on using different methods to assess the development potential of rack mounted PV systems on the top roofs [93,94,95,96,97].
The main difference between these methods is the way to accumulate the roof area for PV application. There are three types of method, i.e., assuming the roof area ratio per capita, establishing the correlation between the population density and roof area, and being aided by geographic information systems (GIS). Although a lot of research has been done, with the existing methods it is still difficult to extract the rooftop area efficiently and robustly.
In this study, a fast level set method is proposed for recognizing a building’s roof from remote sensing images efficiently and accurately. A 3 × 3 median convolution was first applied to both DSM and DTM airborne LiDAR data. Then, the DSM was resized to 3 m resolution and used for calculating solar radiation in Solar Analyst. Several criteria were applied to filter off the unwanted pixels. After eliminating the ground pixels, barriers (buffer minus 1 m) on rooftops, shadows, and steep sloping pixels using decision tree classification, the optimal areas of rooftop pixels could then be identified. Then, the building polygons and solar radiation map were spatially joined. Assuming that at least two solar panels should be deployed in each candidate installation site, polygons with areas smaller than 3 m2 were then removed.
Finally, through combining airborne LiDAR data and spatial analysis, the total rooftop area available for installing PV systems in Hong Kong was estimated, which is about 39.2 km2. With the total PV-suitable rooftop area, the potential installation capacity of rooftop PV systems was estimated to be 4.67 GWp by taking the reserved array distance into account, and accordingly the annual potential energy generated was predicted to be 4674 GWh, which was about 10.7% of the total electricity used in Hong Kong in 2014. In addition, about 3 million tons of greenhouse gas (GHG) emissions could be avoided yearly by replacing the equivalent local electricity mix.

3.3. Possible Initiatives for Hong Kong

3.3.1. Legal Measures

Uses of PV are a new policy issue in Hong Kong, but the technologies clearly have the ability to reach such a set of objectives. Two potential legal measures to promote development in Hong Kong are suggested: open the service and labor market to Mainland China, and provide more educational and training resources to workers or engineers.
These points are based on the goal of decreasing the cost of installation. In recent years, global PV markets have been making fast progress toward competitiveness. PV prices decreased and the rise in electricity prices helped to drive momentum toward “dynamic grid parity”, which means that the savings in electricity cost and/or the revenues generated by selling PV electricity on the market are equal to or higher than the long-term cost of installing and financing PV systems. Deutsche Bank’s report revealed that solar PV electricity was currently competitive without subsidies in at least 19 markets globally and it expects more markets to reach grid parity in 2015 as solar system prices decline further. Figure 6 clearly demonstrates the declining trend of installation costs worldwide. Hence, if appropriate incentive policies are introduced by the Hong Kong government, the PV electricity could fully compete with other traditional electricity in Hong Kong by reducing PV installation costs in the near future so as to easily achieve their renewable energy target in 2020.

3.3.2. Installation Cost Support Measures

Installation cost support incentives, also formularized in investment subsidy, are discussed in this section. This subsidy can be designed to cover a certain percentage of the construction cost or a fixed amount per kWp. The advantage of this measure is the low administrative expense. A disadvantage is that it is hard to control the quality of the installed PV power plant.
Thinking optimistically, a target of 400 MW/year for five years’ annual installation is assumed in order to meet the requirement of renewable energy accounting for 3%–4% of total electricity end use by 2020 in Hong Kong, which will be about 1485 to 1980 GWh. The annual power generation per unit is estimated based on a SAM model [98] including a 23 deg tilt south-facing rooftop PV with 15.9% efficiency, which is traditional in the market under Hong Kong’s climate and irradiation conditions. An annual degradation of performance is assumed to be 1%, so that the total power generation during a lifetime of 20 years can be estimated. Meantime, the initial unit investment is evaluated from the market price and hypothesized to decrease by 5% each year. At last, the levelized cost of electricity without any subsidy is estimated. The result is shown in the Table 3 below.
It can be seen from the results that the LCOE is nearly twice the price of electricity, which is unacceptable for investors. A low level of 20% versus a high level of 60%, and a fixed investment subsidy value of 4 HKD/Wp, which is similar to that in Mainland China, are assumed to be supplied by the government. The results can be found in Table 4 below.
As a result, the government total budget is about 8.54, 25.62, and 8.00 billion HKD for low-level, high-level, and fixed level subsidies, respectively. Considering the electricity price for commercial residential is about 0.987 HKD/kWh [99], the LCOE of the 20% case and the fixed value of 4 HKD/kWh will be below the retail price after 2020, which means that PV will be economical enough to need no subsidy in competition with other energy sources.

3.3.3. Financial Support Measures

According to the high initial capital investment of PV, it is often a liability. Therefore, the interest rate is the key parameter influencing investor payback in this kind of long-term return project. If the government can give support by publishing “Green Bonds”, it will decrease the interest rate. In addition, tax benefits are suggested in the case of a PV system installed in conjunction with the purchase or construction of a private home. Moreover, steps should be taken to effectively attract private capital and foreign investment (especially PV suppliers or investors from Mainland China) to develop rooftop PV power plants in Hong Kong by energy management contract (EMC).

3.3.4. Feed-in Tariff Measures

A feed-in tariff (FiT), or electricity grant, is an energy supply policy will offer long-term purchase agreements for the sale of electricity in order to support the development of new renewable energy projects. The core of FiT policy design is determining the payment structure. The suggested payment methodology is based on the actual levelized cost of electric (LCOE) of RE, which means that Tif will cover the gap above the average electricity market price for 20 years. Under the scenario of the electricity retail price remaining at this level for the entire period, the total cost of the FiT plan can be indicated in Table 5.
The 0.64 billion HKD cost of FiT will last until 2036 then decrease to 0.17 billion HKD by 2040. Therefore the total cost of this program will be 12.71 billion HKD.

4. Discussion

We learn from the energy policies of PV leading countries that, although PV investment subsidy requires the least outlay, if investment grants could be subsidized, which is a sort of one-time subsidy, actual electricity generation may become an issue. Therefore, investment subsidies have rarely been implemented in recent years; instead, providing PV with return support became the default.
From the cost-effectiveness point of view, we propose a subsidy for PV development with an electricity grant. It is more suitable for Hong Kong than feed-in tariffs and other forms of investment subsidy because the related legal provisions for solar energy application in Hong Kong are still inadequate. It is difficult for major local utility companies to provide convenient grid-connection services, which is one of the most significant defects that limit the implementation of a feed-in tariff. Moreover, Hong Kong has scarce land resources, which makes it only suitable for small-scale distributed PV systems. Thus, it is especially important to stimulate investors to responsibly operate and maintain their PV systems, and to ensure that each unit of PV electricity generated will contribute to their initiative.

5. Conclusions

In this research, five countries leading in solar PV application were studied. Their histories of PV system development and application were reviewed and analyzed. Their initiatives toward the popularizing and prosperity of PV application were collected and summarized.
Accordingly, this study proposed a strategy for the incentivizing of BIPV application for Hong Kong PV application. The strategy aims to increase the competitive strength of the PV application, trying to help the relatively frail PV industry survive in the relatively intense free market, and eventually grow up to be a promising local energy solution in the near future. From the lessons learned from the four forerunners, a series of subsidy policies and incentives was drawn up to help the local PV industry survive through the early pioneering stage. It was hoped that the results could serve as a reference for future policy making. The major findings are listed as follows:
(1)
The BIPV system, which requires little extra installation and land, is a promising way of relieving the increasing financial and environmental costs of fossil fuel energy generation.
(2)
Due to the relatively high initial investment and service costs, it is still difficult for PV technology to compete against fossil fuels in Hong Kong’s local energy market of. The government should release subsidy and sustain policies to help the PV industry grow.
(3)
The service and labor market should be opened up to providers abroad to reduce the price. Measures must be taken to further improve the efficiency of practitioners so that the soft costs could also be cut.
(4)
Subsidy of PV development with PV electricity grants should be implemented to support the PV business.

Acknowledgments

The work described in this paper was financially supported by industry through project H-ZW1Q and CPU Public Policy Research Projects K-QZ1G and K-QZ1K.

Author Contributions

Aotian Song and Lin Lu conceived and designed the experiments; Aotian Song and Man Sing Wong performed the experiments; Aotian Song and Zhizhao Liu analyzed the data; Man Sing Wong and Zhizhao Liu contributed reagents/materials/analysis tools; Aotian Song wrote the paper.

Conflicts of Interest

The authors declare no conflict of interest.

References

  1. Electrical and Mechanical Services Department (EMSD). “Hong Kong Energy End-Use Data 2014”. Available online: http://www.emsd.gov.hk/filemanager/en/content_762/HKEEUD2014.pdf (accessed on 30 June 2016).
  2. CLP Power Hong Kong Limited. ‘Response to Hong Kong’s Climate Change Strategy and Action Agenda’. Available online: http://www.epd.gov.hk/epd/english/climate_change/consult.html (accessed on 30 June 2016).
  3. Ni, M.; Leung, M.K.H.; Sumathy, K.; Leung, D.Y.C. Potential of renewable hydrogen production for energy supply in Hong Kong. Int. J. Hydrog. Energy 2006, 31, 1401–1412. [Google Scholar] [CrossRef]
  4. Peng, J.Q.; Lu, L. Investigation on the development potential of rooftop PV system in Hong Kong and its environmental benefits. Renew. Sustain. Energy Rev. 2013, 27, 149–162. [Google Scholar] [CrossRef]
  5. Gao, X.X.; Yang, H.; Lu, L. Study on offshore wind power potential and wind farm optimization in Hong Kong. Appl. Energy 2014, 130, 519–531. [Google Scholar] [CrossRef]
  6. Parida, B.; Iniyan, S.; Goic, R. A review of solar photovoltaic technologies. Renew. Sustain. Energy Rev. 2011, 3, 1625–1636. [Google Scholar] [CrossRef]
  7. Yuan, J.; Sun, S.; Zhang, W.; Xiong, M. The economy of distributed PV in China. Energy 2014, 78, 939–949. [Google Scholar] [CrossRef]
  8. Ding, M.; Xu, Z.; Wang, W.; Wang, X.; Song, Y.; Chen, D. A review on China’s large-scale PV integration: Progress, challenges and recommendations. Renew. Sustain. Energy Rev. 2016, 53, 639–652. [Google Scholar] [CrossRef]
  9. Kaushika, N.D.; Gautam, N.K.; Kaushik, K. Simulation model for sizing of standalone solar PV system with interconnected array. Sol. Energy Mater. Sol. Cells 2005, 85, 499–519. [Google Scholar] [CrossRef]
  10. Fernández-Infantes, A.; Contreras, J.; Bernal-Agustín, J.L. Design of grid connected PV systems considering electrical, economical and environmental aspects: A practical case. Renew. Energy 2006, 31, 2042–2062. [Google Scholar] [CrossRef]
  11. Li, D.H.W.; Cheung, K.L.; Lam, T.N.T.; Chan, W.W.H. A study of grid-connected photovoltaic (PV) system in Hong Kong. Appl. Energy 2011, 90, 122–127. [Google Scholar] [CrossRef]
  12. Cerón, I.; Caamaño-Martín, E.; Neila, F.J. ‘State-of-the-art’ of building integrated photovoltaic products. Renew. Energy 2013, 58, 127–133. [Google Scholar] [CrossRef] [Green Version]
  13. Reisi, A.R.; Moradi, M.H.; Jamasb, S. Classification and comparison of maximum power point tracking techniques for photovoltaic system: A review. Renew. Sustain. Energy Rev. 2013, 19, 433–443. [Google Scholar] [CrossRef]
  14. Chaurey, A.; Deambi, S. Battery storage for PV power systems: An overview. Renew. Energy 1992, 2, 227–235. [Google Scholar] [CrossRef]
  15. Lambert, D.W.H.; Holland, R.; Crawley, K. Appropriate battery technology for a new, rechargeable, micro-solar lantern. J. Power Sources 2000, 88, 108–114. [Google Scholar] [CrossRef]
  16. Hua, S.; Zhou, Q.; Kong, D.; Ma, J. Application of valve-regulated lead-acid batteries for storage of solar electricity in stand-alone photovoltaic systems in the northwest areas of China. J. Power Sources 2006, 158, 1178–1185. [Google Scholar] [CrossRef]
  17. Schmid, L.A.; Hoffmann, C.A.A. Replacing diesel by solar in the Amazon: short-term economic feasibility of PV-diesel hybrid systems. Energy Policy 2004, 32, 881–898. [Google Scholar] [CrossRef]
  18. Nelson, D.B.; Nehrir, N.H.; Wang, C. Unit sizing and cost analysis of stand-alone hybrid wind/PV/fuel cell power generation systems. Renew. Energy 2006, 31, 1641–1656. [Google Scholar] [CrossRef]
  19. Deshmukh, M.K.; Deshmukh, S.S. Modeling of hybrid renewable energy systems. Renew. Sustain. Energy Rev. 2008, 12, 235–249. [Google Scholar] [CrossRef]
  20. Enslin, J.H.R.; Wolf, M.S.; Snyman, D.B.; Swiegers, W. Integrated photovoltaic maximum power point tracking converter. IEEE Trans. Ind. Electron. 1997, 44, 769–773. [Google Scholar] [CrossRef]
  21. Noguchi, T.; Togashi, S.; Nakamoto, R. Short-current pulse-based maximum-power-point tracking method for multiple photovoltaic-and-converter module system. IEEE Trans. Ind. Electron. 2002, 49, 217–223. [Google Scholar] [CrossRef]
  22. Sun, X.; Wu, W.; Li, X.; Zhao, Q. A research on photovoltaic energy controlling system with maximum power point tracking. In Proceedings of the Power Conversion Conference, Osaka, Japan, 2–5 April 2002.
  23. Algazar, M.M.; Al-Monier, H.; El-Halim, H.A.; El Kotb Salem, M.E. Maximum power point tracking using fuzzy logic control. Electr. Power Energy Syst. 2012, 39, 21–28. [Google Scholar] [CrossRef]
  24. Abdelsalam, A.K.; Massoud, A.M.; Ahmed, S.; Enjeti, P.N. High-performance adaptive perturb and observe MPPT technique for photovoltaic-based microgrids. IEEE Trans. Power Electron. 2011, 26, 1010–1021. [Google Scholar] [CrossRef]
  25. Moradi, M.H.; Reisi, A.R. A hybrid maximum power point tracking method for photovoltaic systems. Sol. Energy 2011, 85, 2965–2976. [Google Scholar] [CrossRef]
  26. IEA. Technology Roadmap: Solar Photovoltaic Energy—2014 Edition. Available online: http://www.iea.org/publications/freepublications/publication/technology-roadmap-solar-photovoltaic-energy---2014-edition.html (accessed on 20 July 2016).
  27. Ratnam, E.L.; Weller, S.R.; Kellett, C.M. Scheduling residential battery storage with solar PV: Assessing the benefits of net metering. Appl. Energy 2015, 155, 881–891. [Google Scholar] [CrossRef]
  28. Khoury, J.; Mbayed, R.; Salloum, G.; Monmasson, E. Optimal sizing of a residential PV-battery backup for an intermittent primary energy source under realistic constraints. Energy Build. 2015, 105, 206–216. [Google Scholar] [CrossRef]
  29. Khalilpour, R.; Vassallo, A. Planning and operation scheduling of PV-battery systems: A novel methodology. Renew. Sustain. Energy Rev. 2016, 53, 194–208. [Google Scholar] [CrossRef]
  30. Guinot, B.; Champel, B.; Montignac, F.; Lemaire, E.; Vannucci, D.; Sailler, S.; Bultel, Y. Techno-economic study of a PV-hydrogen-battery hybrid system for off-grid power supply: Impact of performances’ ageing on optimal system sizing and competitiveness. Int. J. Hydrog. Energy 2015, 40, 623–632. [Google Scholar] [CrossRef]
  31. Parra, D.; Walker, G.S.; Gillott, M. Modeling of PV generation, battery and hydrogen storage to investigate the benefits of energy storage for single dwelling. Sustain. Cities Soc. 2014, 10, 1–10. [Google Scholar] [CrossRef]
  32. Khalilpour, K.R.; Vassallo, A. Technoeconomic parametric analysis of PV-battery systems. Renew. Energy 2016, 97, 757–768. [Google Scholar] [CrossRef]
  33. Pearce, J.M. Expanding photovoltaic penetration with residential distributed generation from hybrid solar photovoltaic + combined heat and power systems. Energy 2009, 34, 1947–1954. [Google Scholar] [CrossRef]
  34. Mostofi, M.; Nosrat, A.H.; Pearce, J.M. Institutional-scale operational symbiosis of photovoltaic and cogeneration energy systems. Int. J. Environ. Sci. Technol. 2011, 8, 31–44. [Google Scholar] [CrossRef]
  35. Nosrat, A.H.; Swan, L.G.; Pearce, J.M. Improved performance of hybrid photovoltaic-trigeneration systems over photovoltaic–cogen systems including effects of battery storage. Energy 2013, 49, 366–374. [Google Scholar] [CrossRef]
  36. Ramli, M.A.M.; Hiendro, A.; Twaha, S. Economic analysis of PV/diesel hybrid system with flywheel energy storage. Renew. Energy 2015, 78, 398–405. [Google Scholar] [CrossRef]
  37. Tsuanyo, D.; Azoumah, Y.; Aussel, D.; Neveu, P. Modeling and optimization of batteryless hybrid PV (photovoltaic)/Diesel systems for off-grid applications. Energy 2015, 86, 152–163. [Google Scholar] [CrossRef]
  38. Li, C.; Ge, X.F.; Zheng, Y.; Xu, C.; Ren, Y.; Song, C.G.; Yang, C.X. Techno-economic feasibility study of autonomous hybrid wind/PV/battery power system for a household in Urumqi, China. Energy 2013, 55, 263–272. [Google Scholar] [CrossRef]
  39. Caballero, F.; Sauma, E.; Yanine, F. Business optimal design of a grid-connected hybrid PV (photovoltaic)-wind energy system without energy storage for an Easter Island’s block. Energy 2013, 61, 248–261. [Google Scholar] [CrossRef]
  40. Bhattacharjee, S.; Acharya, S. PV–wind hybrid power option for a low wind topography. Energy Convers. Manag. 2015, 89, 942–954. [Google Scholar] [CrossRef]
  41. Rehman, S.; Alam, M.M.; Meyer, J.P.; Al-Hadhrami, L.M. Feasibility study of a wind–PV–diesel hybrid power system for a village. Renew. Energy 2012, 38, 258–268. [Google Scholar] [CrossRef]
  42. Maheri, A. Multi-objective design optimisation of standalone hybrid wind-PV-diesel systems under uncertainties. Renew. Energy 2014, 66, 650–661. [Google Scholar] [CrossRef]
  43. Bianchini, A.; Magnelli, N.; Ferrara, G.; Carneval, E.A.; Ferrar, L. Optimization of a PV-wind-diesel hybrid system for a remote stand-alone application. Energy Procedia 2015, 81, 133–145. [Google Scholar] [CrossRef]
  44. Shezan, SK.A.; Julai, S.; Kibria, M.A.; Ullah, K.R.; Saidur, R.; Chong, W.T.; Akikur, R.K. Performance analysis of an off-grid wind-PV (photovoltaic)-diesel-battery hybrid energy system feasible for remote areas. J. Clean. Prod. 2016, 125, 121–132. [Google Scholar] [CrossRef]
  45. Fthenakis, V.M. End-of-life management and recycling of PV modules. Energy Policy 2000, 28, 1051–1058. [Google Scholar] [CrossRef]
  46. Goe, M.; Gaustad, G. Estimating direct climate impacts of end-of-life solar photovoltaic recovery. Sol. Energy Mater. Sol. Cells 2016, in press. [Google Scholar] [CrossRef]
  47. Tao, J.; Yu, S. Review on feasible recycling pathways and technologies of solar photovoltaic modules. Sol. Energy Mater. Sol. Cells 2015, 141, 108–124. [Google Scholar] [CrossRef]
  48. McDonald, N.C.; Pearce, J.M. Producer responsibility and recycling solar photovoltaic modules. Energy Policy 2010, 38, 7041–7047. [Google Scholar] [CrossRef]
  49. Peng, J.Q.; Lu, L.; Yang, H.X. Review on life cycle assessment of energy payback and greenhouse gas emission of solar photovoltaic systems. Renew. Sustain. Energy Rev. 2013, 19, 255–274. [Google Scholar] [CrossRef]
  50. Lu, L.; Peng, J.; Yang, H. Environmental Payback Time Analysis of Building-Integrated Photovoltaic (BIPV) Applications in Hong Kong. Appl. Energy 2010, 87, 3625–3631. [Google Scholar] [CrossRef]
  51. Masson, G.; Latour, M.; Rekinger, M.; Theologitis, I.T.; Papoutsi, M. Global Market Outlook for Photovoltaics 2013–2017. Available online: http://www.construction21.org/articles/h/report--global-market-outlook-for-photovoltaics-2013-2017.html (accessed on 15 July 2016).
  52. Martinot, Eric, REN21 Renewables Global Futures Report. Available online: http://www.ren21.net/future-of-renewables/global-futures-report/ (accessed on 15 July 2016).
  53. IEA-PVPS, 2015 Snapshot of Global Photovoltaic Markets. Available online: http://www.iea-pvps.org/index.php?id=241 (accessed on 15 July 2016).
  54. Karakaya, E.; Sriwannawit, P. Barriers to the adoption of photovoltaic systems: The state of the art. Renew. Sustain. Energy Rev. 2015, 49, 60–66. [Google Scholar] [CrossRef] [Green Version]
  55. BSW-Solar. Statistic Data on the German Solar Power (Photovoltaic) Industry; German Solar Industry Association (BSW-Solar): Berlin, Germany, 2014. [Google Scholar]
  56. CLP Power Hong Kong Limited. Energy Charge for Residential Customers. Available online: https://www.clp.com.hk/en/customer-service/tariff/residential-customers (accessed on 9 August 2015).
  57. Zhang, X.; Shen, L.; Chan, S.Y. The diffusion of solar energy use in HK: What are the barriers? Energy Policy 2012, 41, 241–249. [Google Scholar] [CrossRef]
  58. Menz, F.C.; Vachon, S. The effectiveness of different policy regimes for promoting wind power: Experiences from the states. Energy Policy 2016, 34, 1786–1796. [Google Scholar] [CrossRef]
  59. Yin, H.; Powers, N. Do state renewable portfolio standards promote in-state renewable generation. Energy Policy 2010, 38, 1140–1149. [Google Scholar] [CrossRef]
  60. Buckman, G. The effectiveness of Renewable Portfolio standard banding and carve-outs in supporting high-cost types of renewable electricity. Energy Policy 2011, 39, 4105–4114. [Google Scholar] [CrossRef]
  61. International Energy Agency (IEA). National Survey Report of PV Power Applications in Japan 2010; IEA: Tokyo, Japan, 2011. [Google Scholar]
  62. Chapman, A.J.; McLellan, B.; Tezuka, T. Residential solar PV policy: An analysis of impacts, successes and failures in the Australian case. Renew. Energy 2016, 86, 1265–1279. [Google Scholar] [CrossRef]
  63. Huang, P.; Negro, S.O.; Hekkert, M.P.; Bin, K.X. How China became a leader in solar PV: An innovation system analysis. Renew. Sustain. Energy Rev. 2016, 64, 777–789. [Google Scholar] [CrossRef]
  64. Barbose, G.; Wiser, R.; Heeter, J.; Mai, T.; Bird, L.; Bolinger, M.; Carpenter, A.; Heath, G.; Keyser, D.; Macknick, J.; et al. A retrospective analysis of benefits and impacts of U.S. renewable portfolio standards. Energy Policy 2016, 96, 645–660. [Google Scholar] [CrossRef]
  65. Dusonchet, L.; Telaretti, E. Comparative economic analysis of support policies for solar PV in the most representative EU countries. Renew. Sustain. Energy Rev. 2015, 42, 986–998. [Google Scholar] [CrossRef]
  66. Kaizuka, I. Net billing schemes, experience from Japan e evolution to net Export FiT. In Proceedings of the PVPS Workshop, Frankfurt, Germany, 24 September 2012; pp. 1–20.
  67. Myojo, S.; Ohashi, H. Effects of consumer subsidies for renewable energy on industry growth and welfare: Japanese solar energy. In Proceedings of the 39th Annual Conference of European Association for Research in Industrial Economics, Rome, Italy, 2–4 September 2012.
  68. Foster, R. Japan Photovoltaics Market Overview; Sandia National Laboratory, US Department of Energy: Livermore, CA, USA, 2005; pp. 1–36. [Google Scholar]
  69. Sweden, M. Residential PV system installation in Japan e example of PV community. In Proceedings of the Stakeholders Workshop IEA PVPS Task 10, Malmö, Sweden, 14 November 2006; pp. 1–28.
  70. Huenteler, J.; Schmidt, T.S.; Kanie, N. Japan’s post-Fukushima challenge-implications from the German experience on renewable energy policy. Energy Policy 2012, 45, 6–11. [Google Scholar] [CrossRef]
  71. Japan Renewable Energy Policy Platform. Renewables Japan Status Report 2010 Executive Summary; JREPP: Tokyo, Japan, 2010. [Google Scholar]
  72. Yamamoto, Y. Rooftops and Residential: Solar Power in Japan; Suntech Power: Tokyo, Japan, 2012; Available online: http://blog.suntechpower.com/2012/suntechexplains/rooftops-and-residential-solar-power-in-japan/ (accessed on 13 November 2014).
  73. Plasto, J. PV: Big in Japan. Inter PV.net. Available online: http://www.interpv.net/market/market_view.asp?idx=312&part_code=04&page=5;2010 (accessed on 13 November 2014).
  74. Yamada, H.; Ikki, O. National survey report of PV power application in Japan 2012. In IEA Cooperative Programme on PVPS Task 1 Exchanging and Dissemination of Information on PV Power Systems; IEA: Tokyo, Japan, 2013; pp. 1–45. [Google Scholar]
  75. Avril, S.; Mansilla, C.; Busson, M.; Lemaire, T. Photovoltaic energy policy: Financial estimation and performance comparison of the public support in five representative countries. Energy Policy 2012, 51, 244–258. [Google Scholar] [CrossRef]
  76. Reinmuller, D.; Praetorius, B.; Langniss, O. Sustainable Energy Policy Concepts; Final Report; International Solar Energy Society: Freiburg, Germany, 2002. [Google Scholar]
  77. Grau, T.; Huo, M.; Neuhoff, K. Survey of photovoltaic industry and policy in Germany and China. Energy Policy 2012, 51, 20–37. [Google Scholar] [CrossRef]
  78. Fulton, M.; Capalino, R. The German Feed-in Tariff: Recent Policy Changes; Deutsche Bank Group Investment Research Report; Deutsche Bank Group: Frankfurt, Germany, 2012. [Google Scholar]
  79. Terna Rapporto Mensile Sul Sistema Elettrico. Available online: http://www.terna.it/it-it/sistemaelettrico/dispacciamento/datiesercizio/rapportomensile.aspx (accessed on 13 June 2016).
  80. Ministero dell’Ambiente e della Tutela del Territorio e del Mare. Decreto Ministeriale 16 Marzo 2001—Programma Tetti Fotovoltaici; Ministero dell’Ambiente e della Tutela del Territorio e del Mare: Roma, Italy, 2001. [Google Scholar]
  81. Orioli, A.; Gangi, A.D. The recent change in the Italian policies for photovoltaics: Effects on the payback period and levelized cost of electricity of grid-connected photovoltaic systems installed in urban contexts. Energy 2015, 92, 1989–2005. [Google Scholar] [CrossRef]
  82. Italian Government. Decreto Ministeriale 28 Luglio 2005—Criteri per L’Incentivazione Della Produzione di Energia Elettrica Mediante Conversione Fotovoltaica Della Fonte Solare; Italian Government: Rome, Italy, 2005.
  83. Italian Government. Decreto Ministeriale 6 Febbraio 2006-Criteri per L’Incentivazione Della Produzione di Energia Elettrica Mediante Conversione Fotovoltaica Della Fonte Solare—Dlgs 387/2003-Modifica DM 28 Luglio 2005; Italian Government: Rome, Italy, 2005.
  84. Italian Government. Decreto Ministeriale 19 Febbraio 2007—Criteri e Modalità per Incentivare la Produzione di Energia Elettrica Mediante Conversione Fotovoltaica Della Fonte Solare, in Attuazione Dell’articolo 7 del Decreto Legislativo 29 Dicembre 2003, n. 387; Italian Government: Rome, Italy, 2007.
  85. AEEG—Autorità per l’Energia Elettrica, il Gas e il Sistema Idrico. Delibera ARG/elt 74/08. Testo Integrato Delle Modalità E Delle Condizioni Tecnico-Economiche per lo Scambio sul Posto (TISP). Available online: http://www.autorita.energia.it/it/docs/08/074-08arg.htm (accessed on 13 June 2016).
  86. Italian Government. Decreto Ministeriale 6 Agosto 2010—Incentivazione Della Produzione di Energia Elettrica Mediante Conversione Fotovoltaica Della Fonte Solare; Italian Government: Rome, Italy, 2010.
  87. Italian Government. Decreto Ministeriale 5 Maggio 2011—Incentivazione Della Produzione di Energia Elettrica da Impianti Solari Fotovoltaici; Italian Government: Rome, Italy, 2011.
  88. Cucchiella, F.; D’Adamo, I. Feasibility study of developing photovoltaic power projects in Italy: An integrated approach. Renew. Sustain. Energy Rev. 2012, 16, 1562–1576. [Google Scholar] [CrossRef]
  89. Italian Government. Decreto Ministeriale 5 Luglio 2012—Attuazione dell’art. 25 del Decreto Legislativo 3 Marzo 2011, n. 28, Recante Incentivazione Della Produzione di Energia Elettrica da Impianti Solari Fotovoltaici (c.d. Quinto Conto Energia); Italian Government: Rome, Italy, 2012.
  90. Zhang, S.; He, Y. Analysis on the development and policy of solar PV power in China. Renew. Sustain. Energy Rev. 2013, 21, 393–401. [Google Scholar] [CrossRef]
  91. National Development and Reform Commission. The Perfection of Photovoltaic Price Policy 2013. Available online: http://tgs.ndrc.gov.cn/ggkx/201309/t20130903_557009.html (accessed on 13 May 2015).
  92. Zahran, S.; Brody, D.; Vedlitz, A.; Lacy, M.; Schelly, C. Greening local energy explaining the geographic distribution of household solar energy use in the United States. J. Am. Plan. Assoc. 2008, 74, 419–434. [Google Scholar] [CrossRef]
  93. Denholm, P.; Margolis, R. Supply Curves for Rooftop Solar PV-Generated Electricity for the United States; Technical Report; National Renewable Energy Laboratory: Golden, CO, USA, 2008.
  94. Pelland, S.; Poissant, Y. An evaluation of the potential of building integrated photovoltaics in Canada. In Proceedings of the 31st Annual Conference of the Solar Energy Society of Canada (SESCI), Montréal, QC, Canada, 20–24 August 2006.
  95. Defaix, P.R.; van Sark, W.G.; Worrell, E.; de Visser, E. Technical potential for photovoltaics on buildings in the EU-27. Sol. Energy 2012, 86, 2644–2653. [Google Scholar] [CrossRef]
  96. Radhi, H. On the value of decentralized PV systems for the GCC residential sector. Energy Policy 2011, 39, 2020–2027. [Google Scholar] [CrossRef]
  97. Radhi, H. Trade-off between environmental and economic implications of PV systems integrated into the UAE residential sector. Renew. Sustain. Energy Rev. 2012, 16, 2468–2474. [Google Scholar] [CrossRef]
  98. National Renewable Energy Laboratory. System Advisor Model-Help; National Renewable Energy Laboratory: Golden, CO, USA, 2015.
  99. Electric Price of CLP. Available online: https://www.clp.com.hk/zh/customer-service-site/tariff-site/Documents/clp_tarifftable_chi.pdf (accessed on 13 May 2015).
Figure 1. PV incentive policies and development trends in Japan [66,74].
Sustainability 08 00769 g001
Figure 2. PV incentive policies and development trends in Germany.
Sustainability 08 00769 g002
Figure 3. PV incentive policies and development trends in Mainland China.
Sustainability 08 00769 g003
Figure 4. Solar energy resource distribution in China.
Sustainability 08 00769 g004
Figure 5. PV incentive policies and development trends in the United States.
Sustainability 08 00769 g005
Figure 6. Declining trend of PV installation labor cost.
Sustainability 08 00769 g006
Table 1. Classification of different PV subsidies policies.
Investment Support
Law:
(1)
Feed-in act
(2)
Guideline for grid connection
(3)
Renewable portfolio standard
(4)
Renewable energy law
Installation:
(1)
Solar roof program
(2)
National subsidy program
(3)
Gold Sun program
Financing:
(1)
Low interest loan
(2)
Public guarantee
(3)
Tax abatement
Return Support
Feed-in tariff:
(1)
Feed-in tariff of EEG law
(2)
Benchmark price
(3)
Net billing program
(4)
“Conto Energia”
PV electricity grant:
(1)
China’s PV electricity grant
Table 2. The major PV incentive policies implemented by PV leading countries.
GermanyItalyJapanMainland ChinaUSA
1991
Electricity Feed-in Act
1000 Solar Roofs Program
1992
Net Billing Program
1993
Guideline For Grid-connection
1994
National Subsidy For Residential
1999
100,000 Solar Roofs Program
2001
Photovoltaic roofs
2003
Renewable Portfolio Standard
2004
Feed-in Tariff of EEG Law
2005
1st “Conto Energia”
Renewable Energy Law
The U.S. Energy Policy Act
2007
2nd “Conto Energia”
2008
Renewable Energy Incentive Plan
2009
National Subsidy Program
Feed-in Tariff
Solar Roofs Program
Golden Sun Program
Obama Renewable Energy Policy
2010
3rd “Conto Energia”
10 Million Solar Roofs Program
2011
4th “Conto Energia”
2012
5th “Conto Energia”
2013
Benchmark price (China’s Feed-in tariff)
PV electricity grant
Table 3. Installation and investment estimated from 2016 to 2020.
20162017201820192020
Annual new installation capacity (MWp)400.0400.0400.0400.0400.0
Accumulated installation capacity (MWp)400.0800.01200.01600.02000.0
Estimated annual PV power generation (GWh)345.2690.41035.61380.81726.0
Estimated total power generated during lifetime of annual installation (GWh)6285.856285.856285.856285.856285.85
Unit Investment (HKD/Wp)HKD 23.64HKD 22.46HKD 21.34HKD 20.27HKD 19.26
LCOE without any subsidy (HKD/kWh)HKD 1.50HKD 1.43HKD 1.36HKD 1.29HKD 1.23
Table 4. Government subsidies and investments, estimated from 2016 to 2020.
20162017201820192020
Government subsidy in 20% case (Billion HKD)1.891.791.701.621.54
Real investment in 20% case (Billion HKD)7.567.186.826.486.16
LCOE of 20% case (HKD/kWh)1.201.141.091.030.98
Government subsidy in 60% case (Billion HKD)5.675.395.124.864.62
Real investment in 60% case (Billion HKD)3.783.593.413.243.08
LCOE of 60% case (HKD/kWh)0.600.570.540.520.49
Government subsidy in fixed 4 HKD case (Billion HKD)1.601.601.601.601.60
Real investment in fixed 4 HKD case (Billion HKD)7.867.386.946.516.10
LCOE of fixed 4 HKD case (HKD/kWh)1.251.171.101.040.97
Table 5. Government FiT costs estimated from 2016 to 2020.
20162017201820192020
Annual new installation capacity (MWp)400.0400.0400.0400.0400.0
Accumulated installation capacity (MWp)400.0800.01200.01600.02000.0
Estimated annual PV power generation (MWh)345.2690.41035.61380.81726.0
Estimated electricity generated during lifetime (MWh) 20 year with 1% degradation per year6285.856285.856285.856285.856285.85
Unit Investment (HKD/Wp)HKD 23.64HKD 22.46HKD 21.34HKD 20.27HKD 19.26
LCOE (HKD/kWh)1.501.421.351.291.22
FiT (HKD/kWh)0.510.440.370.300.23
Total FiT cost to government (Billion HKD)0.170.330.450.560.64

