Article

The Milk Supply Chain in Italy’s Umbria Region: Environmental and Economic Sustainability

1
Department of Agriculture, Food and Environmental Science, University of Perugia, Borgo XX Giugno, 74, 06126 Perugia, Italy
2
CRB—Biomass Research Centre, Via G. Duranti, 63, 06125 Perugia, Italy
*
Author to whom correspondence should be addressed.
Sustainability 2016, 8(8), 728; https://doi.org/10.3390/su8080728
Submission received: 31 May 2016 / Revised: 25 July 2016 / Accepted: 25 July 2016 / Published: 29 July 2016
(This article belongs to the Special Issue Sustainability and Competitiveness of Farms)

Abstract

:
This article aims to investigate the environmental and economic sustainability of five dairy farms in the Umbria Region (Italy). The study also provides an assessment of aggregate sustainability, which is less investigated with reference to cattle milk both globally and in Italy, through the analysis of the relationship between economic and environmental performance. Primary data were collected through a direct survey carried out in 2014. The environmental assessment was conducted with a Life Cycle Assessment (LCA) “cradle to farm gate” approach, while the economic dimension was evaluated by determining the direct and indirect costs related to the factors involved in the production process. A correlation analysis and a linear regression were performed in order to study the relationship between the carbon footprint (CF) and operating income. The average operating income amounted to 0.03 Euro/L of milk. The CF values of the five companies are contained within a variation range comprised between 0.90 and 1.76 kg CO2 eq/L of milk. The existence of an inverse relationship between the CF of milk and operating income confirms the hypothesis regarding the possibility of implementing strategies aimed at improving performance in both investigated dimensions at the same time, thus increasing the aggregate sustainability.

1. Introduction

In recent years the scientific debate about gas emissions of anthropogenic origin has caused considerable interest, also given the extensive scientific evidence that has demonstrated a clear relationship between the increase in greenhouse gas emission levels and the evident global climate change. More recently, at the European level, the reduction of Greenhouse gas emissions (GHG) has become one of the key challenges pursued by the Europe 2020 strategy, through the objective of reducing GHG of 20% by 2020 [1]. Environmental issues play a leading role in the 2014–2020 Common Agricultural Policy (CAP) [2], with the introduction of payments to encourage the use of “green” practices (greening). Also thanks to such stimuli, increasing attention has been paid to the study of the environmental impact of agriculture, forestry sector and other land use, which is associated with a major contribution in terms of worldwide emissions, which increased from 4.7 billion tons CO2 eq in 2001 to over 5.3 billion tons in 2011, an increase of 14% [3]. With respect to emissions, animal husbandry is the agricultural activity most responsible for greenhouse gas production. Within this sector, a significant contribution is made by the bovine milk area, which alone is responsible for the emission of 1969 million tons CO2 eq, equal to about 4% of total anthropogenic emissions [4]. In view of this fact, a wide range of studies has been conducted, with the aim to investigate the impact of bovine milk production on gas emission at global [4,5], national [6,7,8,9,10,11] and local level [8]. In all the cases mentioned above, albeit the use of different methodology that do not allow a comparison, the Life Cycle Assessment (LCA) methodology has been employed for milk Carbon Footprint (CF) analysis [12], and is considered the most suitable for the estimation of GHG emissions, and of resources consumption associated with the milk production process. In particular, the choice of this method, in accordance with the international guidelines established by the ISO/TS 14067 (ISO, 2013) legislation [13], is justified by the typical “cradle to gate” approach of the LCA, which allows for the identification and quantification of emissions along the entire production cycle. In accordance with ISO/TS 14067, the CF is defined as the algebraic sum of the emissions and removals of GHG related to all stages in the life of a product, expressed in CO2 equivalents.
While the above-mentioned studies have contributed to improving knowledge by providing important information about possible mitigation measures, they are nevertheless limited to taking into consideration only the environmental dimension of the concept of sustainability, which is characterized by multiple components that require a multidisciplinary approach for the purpose of such a study. The 2005 World Summit on Social Development identified three different aspects as fundamental for the analysis of sustainability, with regard to the environmental, economic and social spheres [14]. The sustainability is thus a very broad concept, which more specifically with respect to livestock farming, has been outlined under four profiles of sustainability [15]: economic sustainability (profitability); internal social sustainability (working conditions); external social sustainability (animal welfare, quality of the landscape, etc.); and ecological and environmental sustainability (greenhouse gas emissions, eutrophication, groundwater pollution, etc.). Given the connection with elements of difficult and objective measurement, the present study focuses on aspects of environmental and economic sustainability. The maintenance of acceptable income levels for production companies is configured as a necessary condition for the implementation of any environmental impact mitigation measures [16]. The economic performance of the sector is also of primary importance, in view of the important contribution it provides, not only in terms of emissions, but also in economic terms. The value of EU milk production represents around 15% of the total, and stands in first place in terms of value among the individual agro-industrial productive sectors [17]. The EU also plays a leading role in the global milk market, producing about 153 million tons per year [17], which corresponds to about 20% of global production.
The dairy supply chain makes an important contribution to the performance of the Italian agro-food system, to the extent that in 2013 it contributed 9.4% of the total Gross Domestic Product (GDP) of the primary sector. Seventy-five percent of dairy production is concentrated in the northern regions of Lombardy, Emilia Romagna, Veneto and Piedmont. In the Umbria region, the dairy sector is less important in terms of quantity, but is still historically rooted in the territory, with a production of 63.762 tons of cow milk in 2012 [18].
Only a limited number of studies have made use of economic indicators in the calculation of the bovine milk CF [16,19], and none have dealt with the Italian productive context.
In the light of the framework outlined above, the present study has as its aims: the evaluation of the carbon footprint of bovine milk produced in Umbria; the determination of the economic performance through the use of profitability indicators; and the study of the relationship between the CF and profitability indicators.
The analysis of the economic and environmental performance has been carried out elaborating the technical and economic data of five dairy farms located in the province of Perugia, in the Umbria Region, in 2014. In 2014, five dairy farms were partners of BOVINEPRINT2020 project funded by the Umbria Region RDP 2007–2013, Measure 1.2.4 (“Cooperation for the development of new products, processes and technologies in the agriculture and food sector and forestry”). The aim of the project was to define possible guidelines for the mitigation of GHG emissions in the regional production of bovine milk and to determine the relative economic trade-off.

2. Materials and Methods

This study analyzed sustainability according to environmental and economic criteria. In particular, through a careful process of data collection based on corporate audit methodology, data outlining both the environmental and economic performance of 5 dairy farms were collected, relating to the year 2014.
The choice of these 5 dairy farms was based on the criteria of size, in order to ensure the representativeness of the sample (in terms of livestock numbers). Based on ISTAT data [20] relating to the milk sector in Umbria, the following three principal categories of business size were identified, with reference to number of livestock reared: class 1 (0–199); class 2 (200–299); and class 3 (more than 300). The survey looked at two dairy farms for each of the classes 1 and 2, and one dairy farm for class 3, in view of the low frequency recorded for the latter class, due to the intrinsic characteristics of the territorial context in question, which does not favor the presence of dairy herds of a considerable size [20].

2.1. Environmental Sustainability

With the aim of evaluating the carbon footprint linked to milk production, an LCA analysis was conducted for each dairy farm selected according to the “cradle to farm gate approach”; the SimaPro software (ver. 8.0.4.30) (PRé Consultants bv, Amersfoort, The Netherlands) was used, in accordance with both the UNI ISO/TS 14067:2013 [13] standard and the standards ISO 14040 [21] and 14044 [22].
Greenhouse gas emissions were expressed in terms of Global Warming Potential (GWP) with a return period of 100 years, taking as characterization factors in CO2 eq: 1 kg of CO2 eq to 1 kg of CO2 eq, 1 kg of CH4 eq to 25 kg of CO2 eq and 1 kg of N2O eq to 298 kg CO2 eq.
The indications in the General Programme Instructions For The International EPD® SYSTEM 2.01 [23] were adopted along with the following product category rule (PCR): PCR 2013:05 Arable crops of 12-06-2013 [24]; and PCR 2013:16 Raw Milk of 17-09-2013 [25]. These methodological choices were preferred as the ISO/TS 14067 does not provide a clear indication and in order to improve the comparability of results with other studies.

2.1.1. Functional Unit and System Boundaries

The functional unit is a liter of milk, as required by the IDF guidelines. The functional unit is the reference unit with respect to which the impact was assessed. The system boundaries include all incoming materials (purchased animals, fodder, feed, food supplements, seeds, fertilizers, pesticides, herbicides and crop protection products, energy, etc.), while for the outgoing products (milk, meat, vegetable products, manure, etc.) the system boundaries stop at the farm gate (Figure 1).
The following effects have not been considered:
  • the production of agricultural machinery and construction of buildings;
  • the production of veterinary medicines;
  • the transportation and disposal of carcasses;
  • emissions associated with the combustion of methane produced by biodigesters;
  • the production and disposal of the packaging of seeds and synthetic chemical products, due to lack of information;
  • change in land use: it was not possible to collect data on the last 20 years;
  • food processing within feed mills; and
  • the disposal of waste water involved in the washing of premises.

2.1.2. Allocation of By-Products

In accordance with the PCR for Arable crops [24], if there is a by-product (such as straw) that is collected and sold to third parties, it is necessary to make an allocation that must be of an economic nature.
Furthermore, an environmental impact breakdown study was carried out between the milk and meat produced (cattle at the end of their productive lives and calves not destined to restock herds).
As indicated by PCR for Raw milk [25], two different allocations were applied to the categories of cattle: for lactating dairy cows, the co-produced meat derived from surplus calves was considered; and, for those intended to restock herds (calves and heifers), the co-product considered was the meat derived from surplus calves and culled cows. The processes allocated in this manner are those relating to the production, preparation and serving of feed, enteric fermentation, and manure management. The processes not allocated between milk and meat were those of milking, the washing of facilities and the refrigeration of raw milk.

2.1.3. Data Quality

The data collection was carried out through a structured questionnaire and they refer to the year 2014, if available; they concerned at the single process level (primary data) and delivery notes, invoices, herd registers, herd management software and the logbook, and interviews. The secondary and tertiary data were derived from international databases (Ecoinvent), an environmental assessment tool, or calculated with suitable estimation models (IPCC, Ecoinvent).

2.1.4. Inventory Analysis

For the assessment calculation in the phase of inventory, four categories of cattle were defined for each farm:
  • calves;
  • heifers;
  • lactating cows; and
  • dry cows.
The four categories into which the barn was divided have different intervals of reference, which sometimes exceed 12 months. For this reason the equivalent number of days that each category lasted was calculated, adjusting the length of the category to 12 months. The dry period was considered equal for all farms, at 60 days a year from the beginning of the lactation phase. Vice versa, breeders provided their average values for the calf, heifer and lactation phases. The length of all categories was then annualized, thus defining a dummy animal that passes through all four phases in a year.

Feed

The cultivation of fodder and silage at livestock farms has been modeled following the parameters of the PCR for Arable crops [24]. The inputs for the model were: diesel fuel and mineral oil used by machinery in farming operations, mineral and organic fertilizers, herbicide products for pest control, plastic material for baling, electricity for irrigation, and the seeds used.
The data relating to all cultivation operations and each species cultivated in the selected farms were collected, along with processing time and the power of the tractors used. The data analysis has permitted the estimation of the consumption of diesel and mineral oil for each farming operation. The emissions associated with fuel combustion, its production, and the production of mineral oils were calculated beginning with processes in the Simapro software database.
The fertilizers, manure, slurry and digestate spread on farmland for each crop were recorded through first person interviews with livestock farmers and incorporated into the model. Starting from the applied quantity, the direct and indirect emissions of nitrous oxide (N2O) in the air, and carbon dioxide (CO2) resulting from the use of urea were calculated, applying the IPPC, Tier 2 methodology [26].
The production of the main products of chemical synthesis was modeled using the processes present in Agri-Footprint and Ecoinvent databases, as in the production of seeds.
The fodder purchased was generally of local origin, and its cultivation has been assimilated to that of fodder produced in a medium sized farm in the study area. Information regarding the percentage of purchased fodder, compared to self-produced, and the distance travelled for transportation, was obtained from interviews; an average distance of 50 km for procurement was considered if it was not known. With regard to transport, the use of medium-sized vehicles (a fleet with a capacity of between 16 and 32 tons) has been hypothesized.
Regarding the production of complex feed, the modeling was performed using the data presented on product labels featuring information on the type of ingredients and the chemical composition of the feed, thus it was possible to derive the percentage quota of each ingredient; in fact, it was not possible to use secondary data for their production. The production processes employed for all the components of the feed were incorporated into the model, making use of the crop cultivation processes present in the Ecoinvent database.
The transport of feed from the storage warehouse to the companies was hypothesized to have been carried out using medium-sized trucks (a fleet with an average capacity of 16–32 tons), while an average procurement distance of 20 km was assumed.

Animal Breeding and Milking

The calculation of methane emissions from enteric fermentation was carried out with a Tier 2 level of detail, according to the IPCC classification [26].
Regarding stable operations, within each livestock farm these have been modeled starting with electricity and diesel consumption in the preparation of feed (mixer wagon, silos, and mill), in the removal and handling of manure (scrapers, pumps, agitator, and separator), in the milking of cows, in the cleaning of facilities (boiler for hot water production) and in the refrigeration of milk awaiting delivery. With regard to the machinery used, for each of the operations cited the power (in kW or hp) was recorded, along with an estimate of the daily timetable of operations provided by the farmer. These data were used for the calculation of the electrical energy consumption of each operation per liter of milk produced.
The production of the technical washing products used in washing the equipment was also included. The modeling of the production of detergents was prepared by reconstructing the individual products, beginning with the concentration of the ingredients on the label, using the processes of production of the active ingredients, where possible. The products used for which it was not possible to determine the composition were assimilated to products that could be modeled that perform the same function.
The transport of technical materials was hypothesized as being carried out by medium-sized trucks (a fleet with an average capacity of 16–32 tons), while an average procurement distance of 50 km was assumed.

Manure management

The management of manure emissions resulting reared have been estimated in accordance with the indications of the PCR for Raw milk [25], following the methodology in the IPCC Guidelines [26], implementing the equations for the calculation of (direct and indirect) methane and nitrous oxide emissions.
Emissions from manure management are considered void in the event that the farm converges livestock waste within an anaerobic digestion plant, without significant storage. If the facility is owned by the farm, the chemicals used for the operation are considered; the production of which has been modeled by defining the concentration of the ingredients on the label and using the production processes of the active ingredients, where possible. The products used for which it was not possible to determine the composition were assimilated to products that can be modeled which perform the same function.
The transportation of the chemical products was hypothesized as being carried out on medium-sized trucks (a fleet with an average capacity of 16–32 tons), while an average procurement distance of 200 km was assumed.

2.2. Economic Sustainability

Economic viability was assessed by determining both fixed and variable, direct and indirect costs, with regard to all factors involved in the milk production process. In order to create more comparable results, the costs of capital supply arrangements and the cost of taxes are not considered in the analysis, given the high level of variability between farms that characterizes them.
Among revenues, the values of sales of milk and meat are accounted as the difference between revenues and the sum of the fixed and variable costs, net or gross of personnel costs; gross profit and operating income have been calculated.
All the economic indicators mentioned above refer to the financial year 2014, and are expressed in Euro/liter of milk.
More specifically, the analysis was divided into the following phases:
  • the classification of primary costs based on the physical nature of the direct factors used in the production process;
  • the allocation of the indirect costs in the milk production process; and
  • the determination of the net margin.

2.2.1. The Classification of Primary Costs Based on the Physical Nature of the Direct Factors Used in the Production Process

Direct costs are defined as those associated with the use of factors that are directly involved in the technical milk production process (machines, raw materials, labor, etc.), whether they are fixed or variable by nature [27]. Regarding fixed costs, those related to the use of fixed assets have been accounted for, and are represented by the depreciation associated with the usage of each fixed asset. Among the variable cost items, all costs associated with consumable production factors were taken into account. Specifically, the cost of fuels, lubricants, seeds, fertilizers, herbicides, water, electricity, feed, supplements, hygienic, sanitary, and veterinary equipment, and any other purchased consumable materials were considered. Apart from these, both fixed and adventitious labor expenses were accounted.

2.2.2. The Allocation of Indirect Costs to the Individual Production Process

The study also considered all cost items related to the use of indirect factors, namely those associated with the economic production process, but not with that of a technical nature [27]. More specifically, these costs also include those related to general expenses, consulting, administration, and all auxiliary and common cost centers that perform services of a subsidiary nature, and therefore are not directly involved in the technical processing cycle, but are nevertheless essential to the overall operation the farm.
The allocation criterion chosen was the percentage breakdown in proportion to the weight percentage of the value of milk to total revenues. This economic parameter was preferred to a technical criterion as, given that livestock activity is the phase most responsible for the creation of added value, it is therefore to be attributed a proportionally greater share of the indirect costs incurred by the farm.

2.2.3. The Determination of The Gross Saleable Production and Operating Income (Net of Interest and Taxes)

Revenue was calculated including the sale of the main product, milk, and various by-products, mainly consisting of meat. To ensure comparability between companies, EU funding was not accounted for. The operating income was calculated as the difference between total revenue, as defined above, and the sum of direct and indirect total costs.

2.3. The Relationship between Environmental and Economic Sustainability

The study of the relationships between the two dimensions of sustainability considered (economic and environmental) was conducted by means of a statistical analysis. While the studies in the literature on this topic considered very large samples [16,19], in both cases they made use of secondary data from databases. In [19] the assessment was based on the data contained in the Farm Accountancy Data Network (FADN) with regard to 119 Dutch companies for the year 2005. In the second case [16], the analysis examined a sample of 221 companies identified as part of the National Farm Survey (NFS) in Ireland. This data was used, with limited additions made by means of interviews, for the determination of the CF of milk and related economic indicators.
In this sense, even if the statistical analysis does not claim to provide indications that are significant and extensible to larger production contexts, given the limited size in the global sense of the sample (although it is representative of the milk sector in the Umbria Region), the analysis is however characterized by the punctual reliability of the data collected, derived from the very high level of detail that characterized the data collection process. Therefore, the results obtained in the present study may represent a further confirmation of trends already observed in larger investigative contexts [16,19].
The statistical analysis was organized in two phases: the first consisted in verifying the existence of a relationship between operating income, expressed in Euro/L, and the CF of milk, by calculating the Pearson correlation coefficient, following a positive verification of the assumption of applicability.
If a deteriorating environmental performance were accompanied by an improved economic performance, this would reveal the presence of a trade-off between the two aspects; on the other hand, if an improvement in environmental performance also corresponded with an improvement in profitability, this would qualify as a sustainable benefit [19].
The second phase of the analysis is based on the application of a linear regression model, in order to evaluate the relationship between the carbon footprint per kg of FPCM and operating income. In accordance with the purposes of the study, the CF of milk is the dependent variable on which the effects of possible changes in operating income are to be estimated, and is therefore to be considered as an explanatory variable.
In accordance with the claims declared by [16] regarding the nature of the relationship between net income and CF, the variables considered in this model are also linked by a non-linear type relationship, attributable to an exponential function as the following:
CFi = AeBROi
where
  • CFi = CF of the milk from the i-th dairy farm;
  • ROi = Operating income of the i-th dairy farm;
  • A, B = parameters of the model; and
  • e = Euler number
Through a logarithmic transformation [28], this can be expressed in the form of the following log-linear equation:
ln(CFi) = ln(A) + βROi + ɛi
By operating the following change in variables:
Y = ln(CFi)
α = ln(A)
β = B
X = ROi
the following is obtained:
Y = α + β X + ɛi
The parameters α and β of this model were determined by linear regression, based on the least squares method, and tested according to the procedures for checking the hypotheses and constructing confidence intervals. As a result of the logarithmic transformation, the regression coefficient β can be interpreted as follows: a unitary variation of RO is associated with a variation of 100·β% in the CF.

3. Results

3.1. Economic Performance

The economic results of the five farms considered and their relative values in terms of weighted average and standard deviation are reported in absolute value per liter of milk in Table 1.
In addition, the data reported in Table 2 highlight the different percentage weights of the various components of positive (revenues) and negative (costs) income.
In terms of weighted average, the operating income amounted to 0.03 Euro per liter of milk, although the data reveal a strong level of variability among the farms examined, as evidenced by the high SD value of 0.09 Euro.
The main revenue item for all companies is of course the sale of milk, estimated on average at 0.43 Euro/L, and equivalent to 95.5% of total revenue. A much lower contribution to revenues is provided by the sale of meat by-products, equivalent 0.02 Euro/L in average unit terms, and 4.6% in percentage terms. Total revenue was determined from the sum of the two positive income components, which on average amounted to the value of 0.45 Euro/L. While there are almost equivalent revenue values among the five dairy farms, if an exception is made for the fourth case, where the higher unit sales price is justified by organic farming, the costs present an extremely wide range of variation, between the extremes of 0.35 Euro/L and 0.57 Euro/L, equivalent to 0.42 Euro/L in terms of weighted average (SD = 0.086). In this sense, the highest incidence is found in relation to the direct variable cost of 0.30 Euro/L of milk in terms of weighted average, corresponding to 70.6% of the total cost.
In this regard, the cost item that contributes to the greatest extent to these results, in accordance with the contents of Table 2, is the feeding of livestock, involving feed originating both within and outside the farm, which taken as a whole represents on average more 50% of the total cost. Within this, the costs associated with the purchase of feeds and concentrates are clearly predominant, with a value of 0.18 Euro/L in absolute terms, and 43% in relative terms. Expenditure on farm-produced fodder is more limited, averaging 0.06 Euros/L (13.8%). Less relevant, and, respectively, equivalent to 7.4% and 6.4% of the total cost, are the costs for fuel and energy and other variable direct costs.
In relation to the second category of costs, regarding the use of fixed direct factors, the main item of expenditure involves the use of hired labor, which in average terms contributes a unit cost of 0.07 Euro/L, equivalent to 16.6% of the total. Only 1.4% of the latter was attributable to fixed costs associated with the use of facilities and machinery.
Less significant, as they amount to 0.05 Euro/L in unit terms, are the costs involving indirect factors, essentially of an administrative and management nature, which stood on average at 11.3% of the total.
Considering the retail business, the data show poor economic performance in the production process in three out of five farms, as demonstrated by the operating income figures that are significantly negative in the Farm 3 and 4 and, to a lesser extent, in Farm 1. In all farms listed above, a state of imbalance is observed between costs and revenues, which are not capable of adequately remunerating the contribution of the different factors of production.
More specifically, in Farm 1, and much more significantly in Farm 3, the losses, amounting, respectively, to 0.01 Euro/L and 0.11 Euro/L, are due to the excessive impact of salaried labor costs, which are higher than the average: 0.02 Euro per liter in Farm 1 and 0.12 Euro in Farm 3.
Concerning Farm 4, the cost of externally purchased feed and concentrates contribute most to the negative level of operating income; these cost have an impact in terms of higher associated costs of 0.09 Euro/L, when compared with the weighted average value.
In this sense, management is more efficient in Farms 2 and 5, which achieve a profit, albeit to a limited extent. These findings are due to the higher selling price in the marketplace, thanks to organic branding, in the case of Farm 2. In Farm 5, the profit is linked to a higher level of competitiveness in terms of production costs.
In particular, the best economic performances achieved by the 5 dairy farms considered are linked to two key elements: larger scale production, which allows for the creation of positive economies of scale, and the higher degree of intensification of the production process, as evidenced by the higher values in terms of kg of concentrates per cow, which result in higher yields in liters of milk per cow.

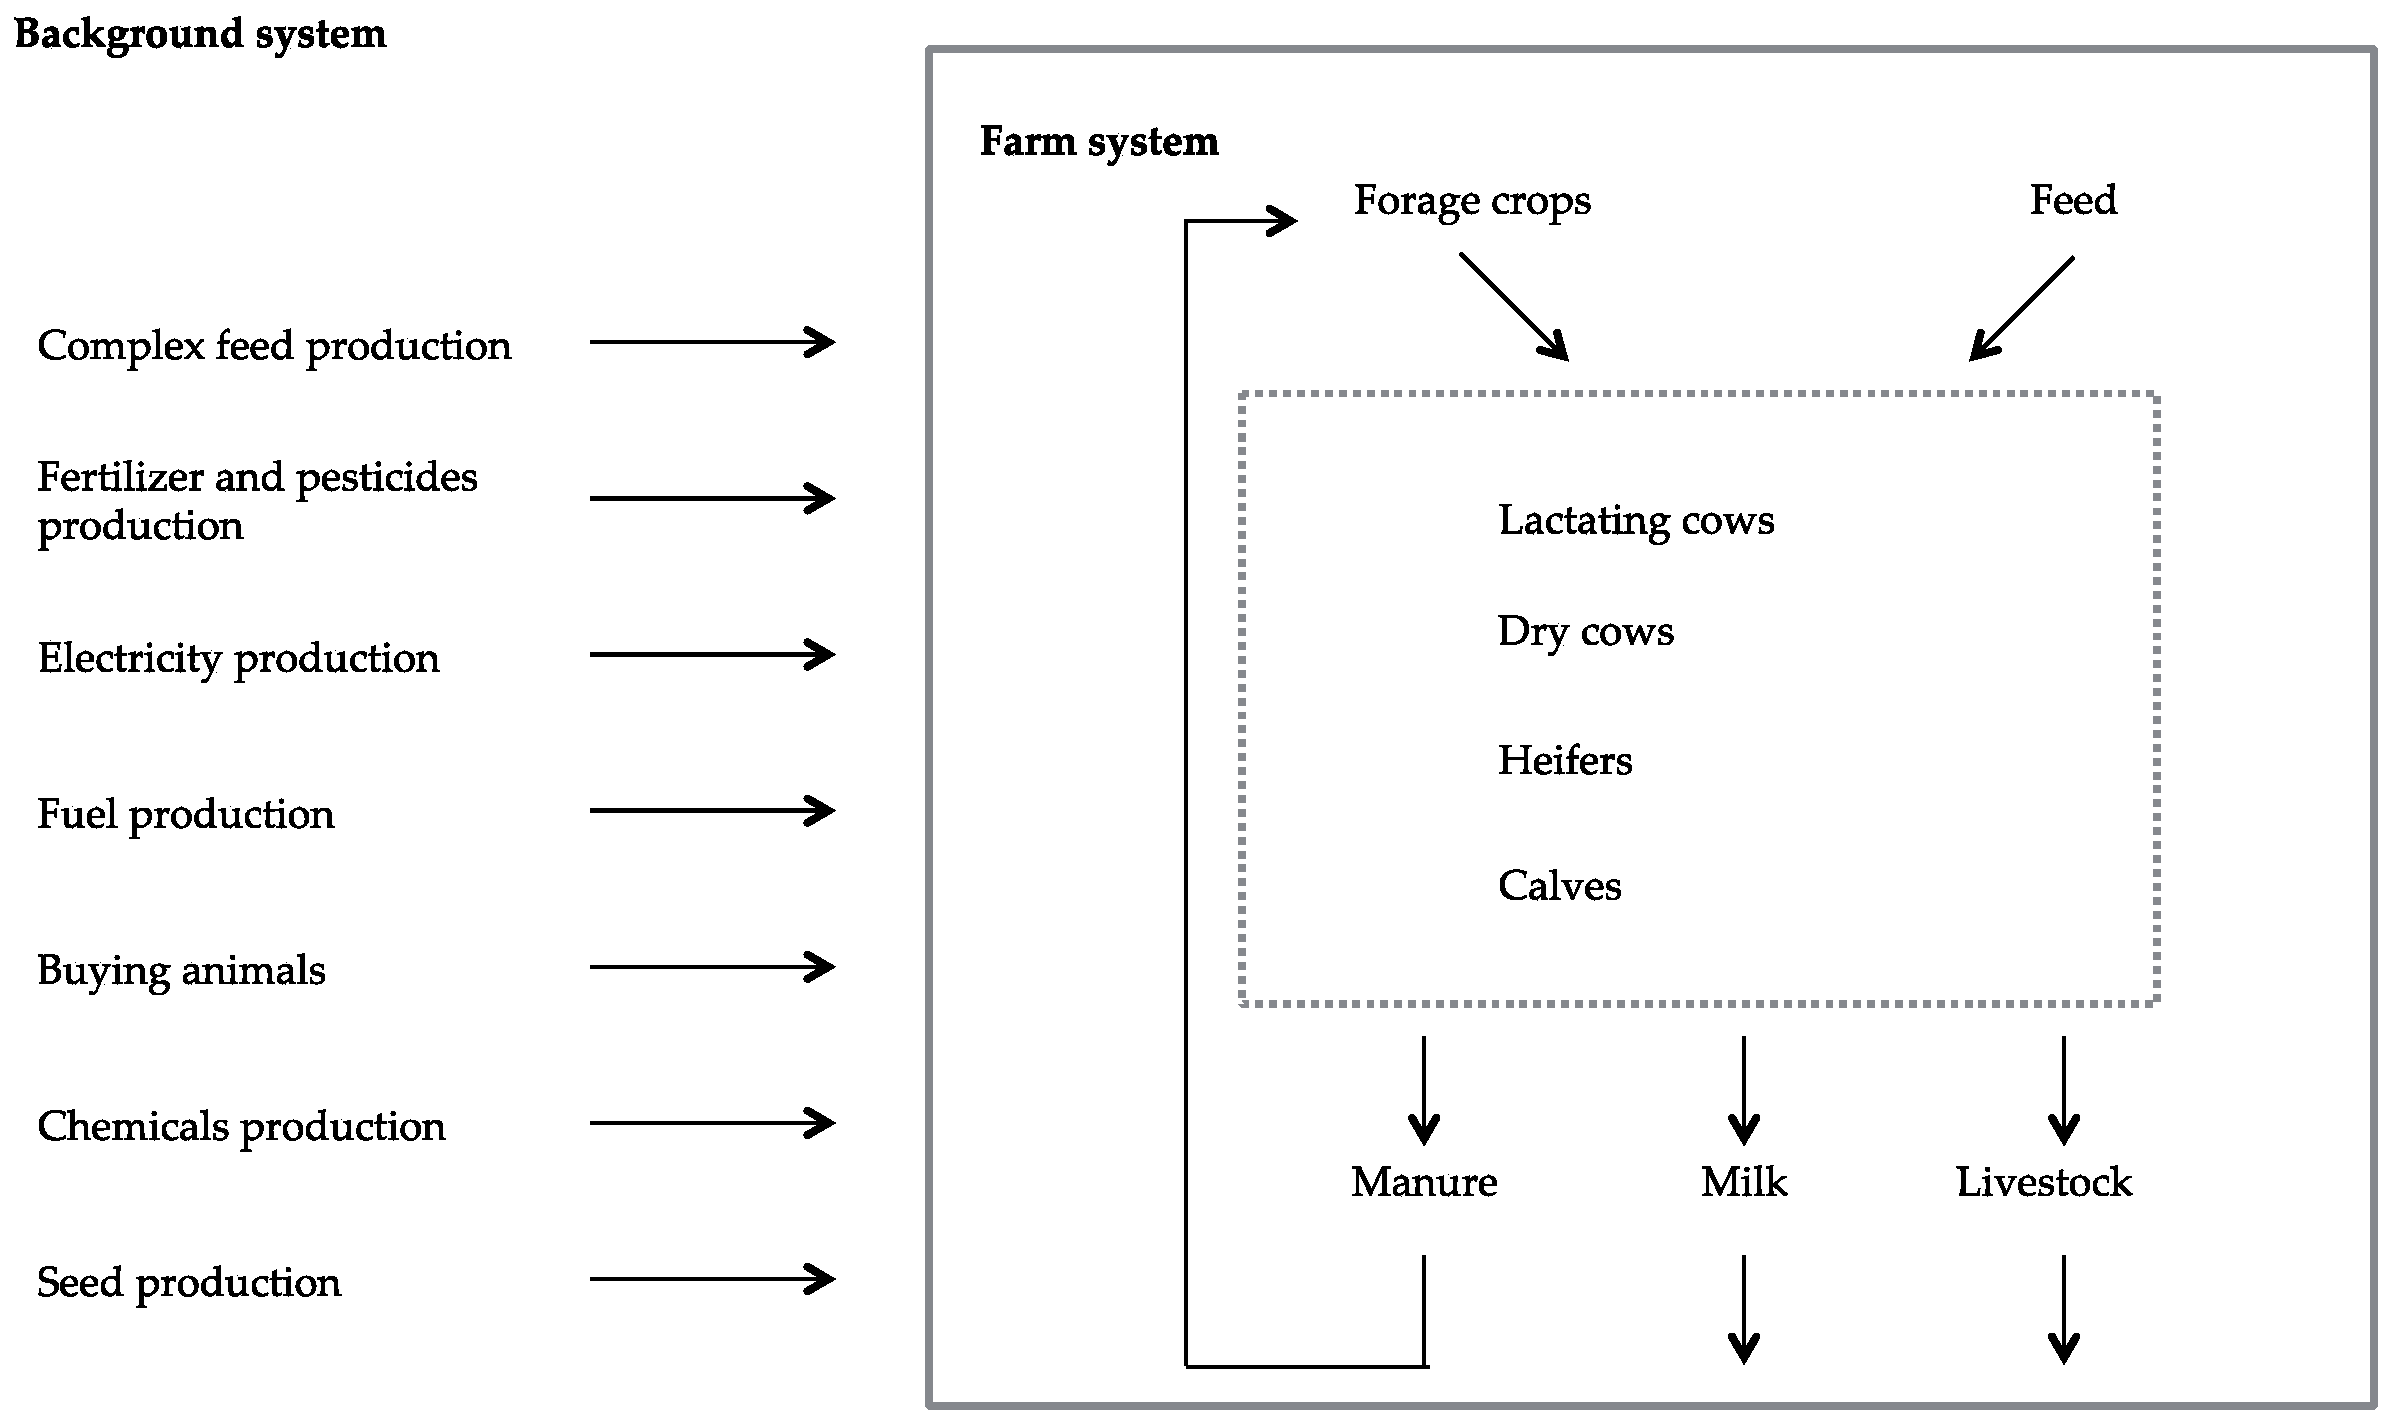
3.2. Environmental Performance

Table 3 presents the results obtained for each dairy farm in terms of kg of CO2 eq per liter of milk produced, disaggregated into the four macro-processes of the supply chain: feed, animal breeding, milking and manure management. The animal breeding phase includes three processes:
  • Enteric fermentation of animals;
  • Consumption for animal feeding; and
  • Consumption for the management of the barn.
The macro process of manure management includes consumption for storage operations and transport and eventual storage-related emissions.
The contribution of the enteric fermentation of cattle is the most serious, with values of between 45% and 57%, which confirms the assertions of scientific studies in the sector, as the methane emitted by animals effectively represents the main source of greenhouse gases from cattle farming.
This is followed by the impact of the production of feed, which includes the cultivation stage for self-produced feed and the production and transportation of purchased feed, which is responsible for 35%–46% of total emissions.
Consumption related to barn equipment and machinery for feeding the cattle does not make a particularly significant impact on total emissions (at most 8% of total emissions of the sector).
The manure management phase makes a maximum contribution of 6%, while milking and milk storage operations make a contribution to total emissions of between 3% and 10%, mainly attributable to consumption for the refrigeration of milk.

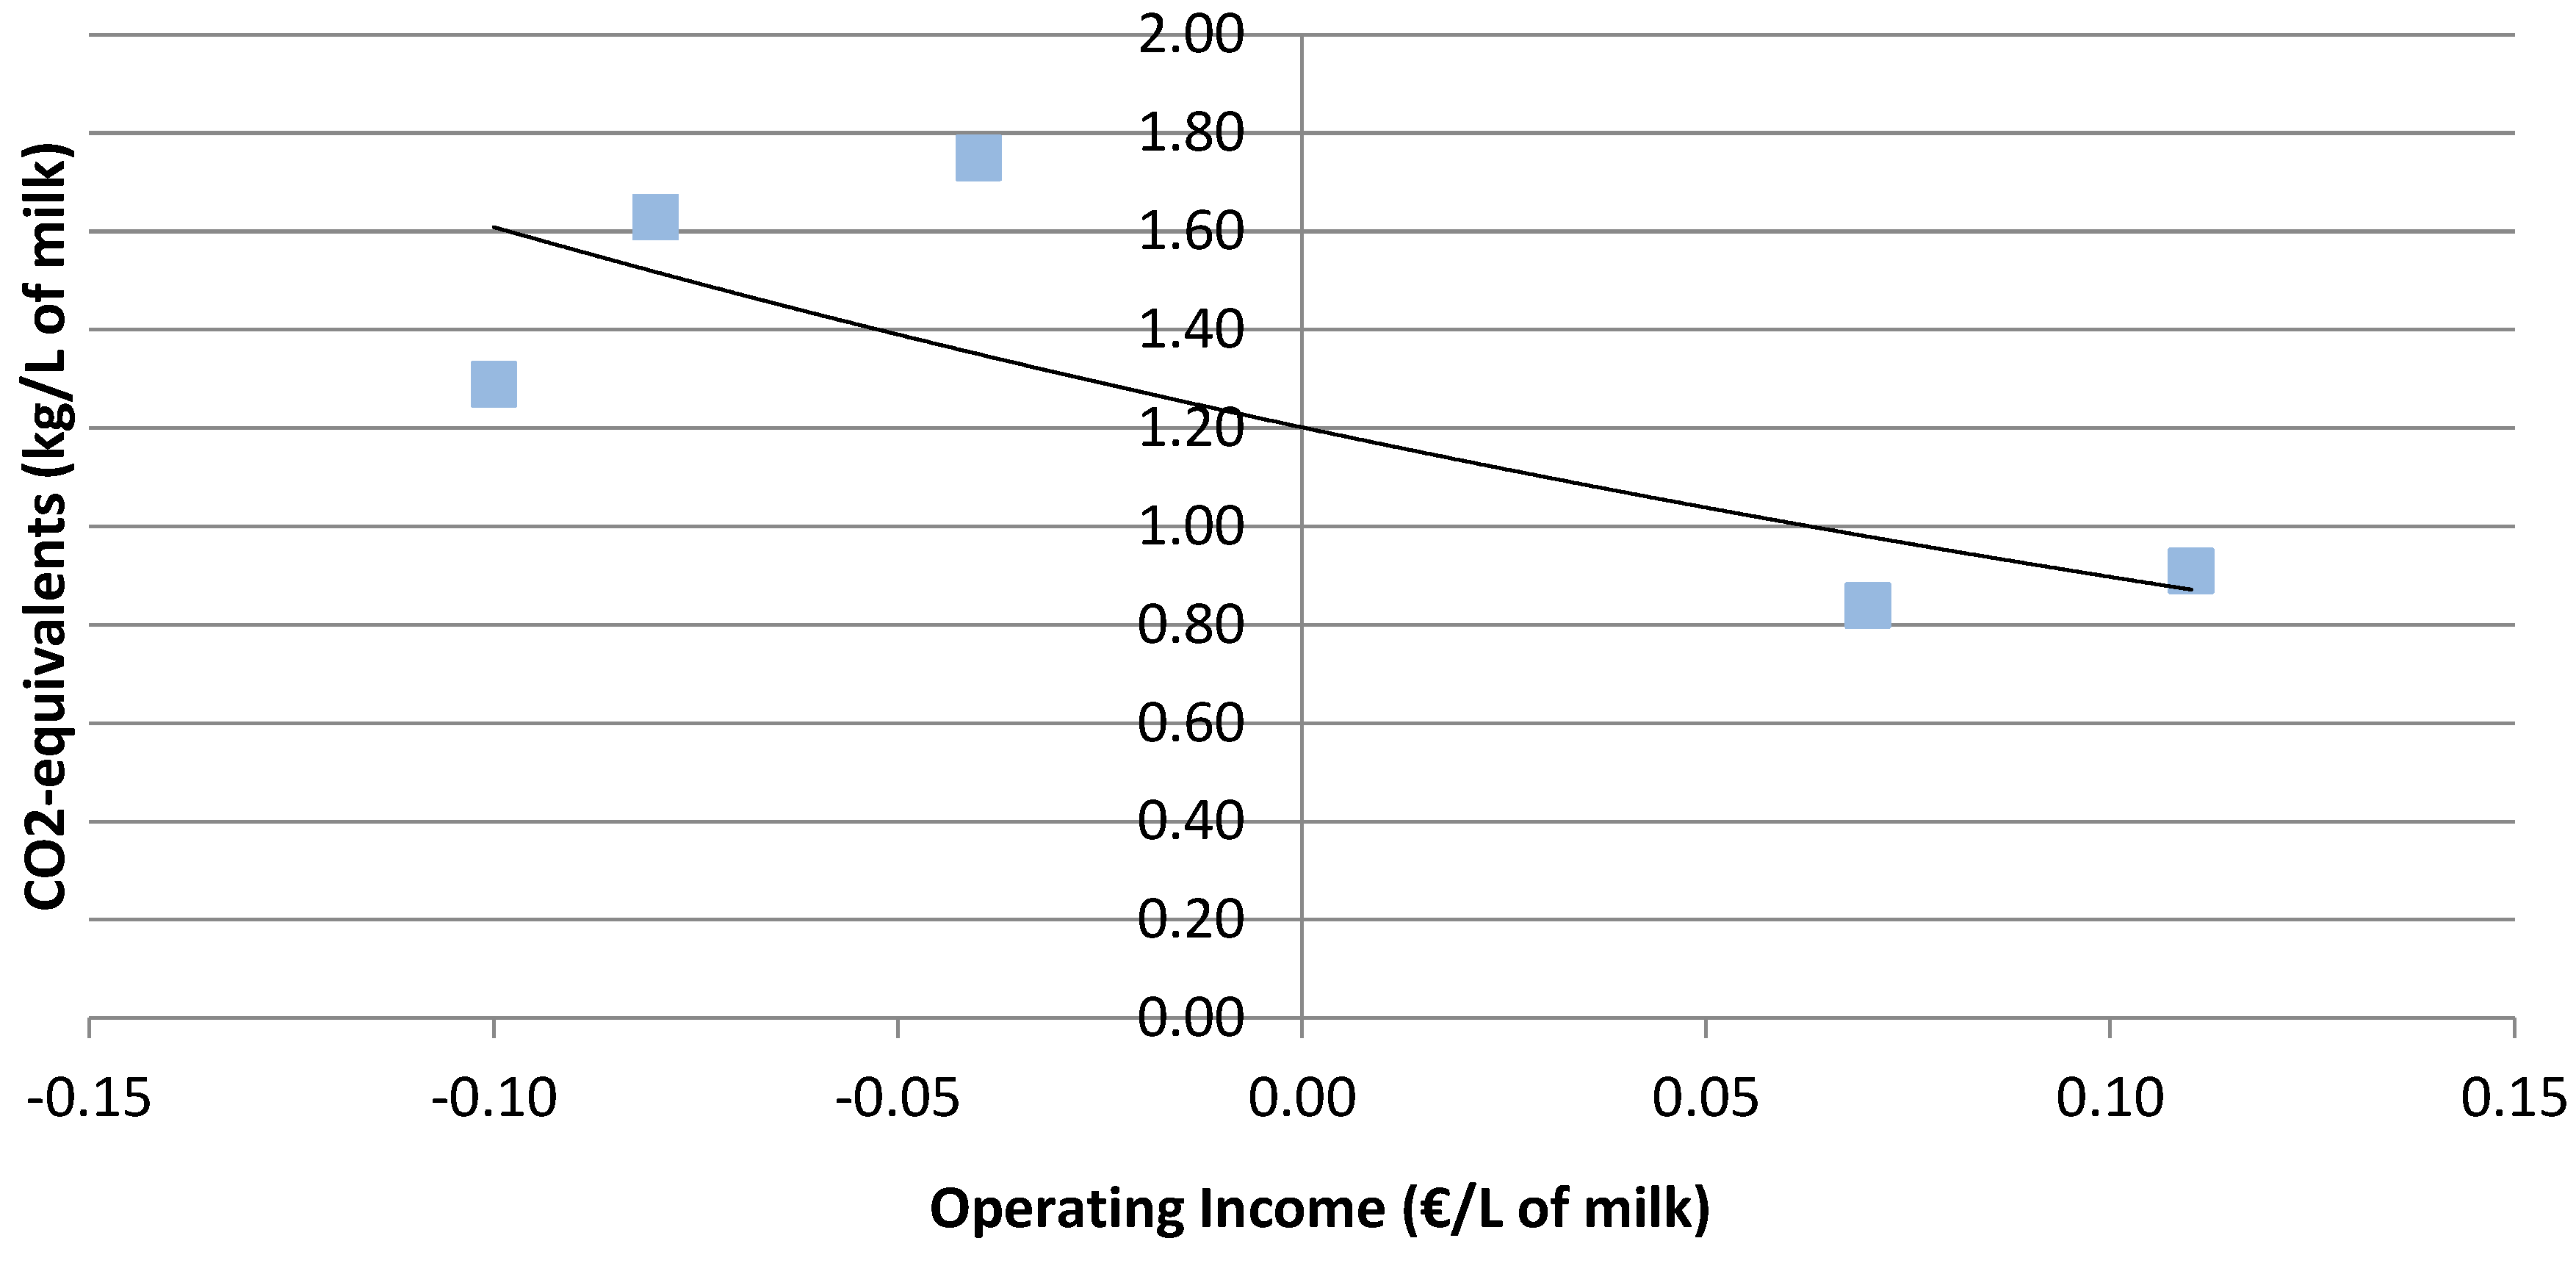
3.3. The Relationship between Environmental and Economic Sustainability

The economic sustainability indicator, represented by the operating income, and the indicator for the environment, consisting of the CF of milk, are strongly and negatively correlated (r = −0.779). Figure 2 displays this relationship for the five farms studied, represented by individual points in the graph.
The results confirm the existence of a negative relationship between the two variables considered: a decrease in the CF of milk is accompanied, in general terms, by an increase in operating income. More generally, an improvement in environmental performance is achieved alongside an increase in economic performance, as highlighted by the positive change in profitability levels, thus establishing a sustainable benefit. Limited to the farms considered by this study, the two goals, respectively, of environmental protection and an increase of farm income, do not therefore appear to be antithetical, but rather can be pursued simultaneously through strategies for the mitigation of the environmental impact that also allow, at the same time, for better management in economic terms.
As also underlined by Bates and Watts [28], the relationship between the dependent variable (representing the CF of milk) and the independent variable (consisting of operating income) is non-linear; specifically it is characterized by an approximated trend with an exponential equation, linearized by logarithmic transformation, the parameters of which have been estimated by the application of a linear regression model. In Table 4, the main parameters and testing aimed at, respectively, evaluating the adaptation and statistical significance of the model as a whole are summarized. In particular, the value assumed by the index (R2 = 0.668) indicates a good fitting of the data, demonstrating that the model is able to explain 66.8% of the total variability. Furthermore, the statistical significance of that fraction of explained variance is confirmed by the test F (F = 6.050, p < 0.10). The parameter estimated (Table 5) confirm the presence of a linear negative relationship between the dependent and independent variables, as had already emerged in the correlation analysis.

4. Conclusions

The aim of this study was to measure environmental and economic performance, and the relationship between them, of five Umbrian dairy farms that are considered representative of the production context in the Umbria Region.
According with these objectives, social issues (like animal welfare, food quality, landscape quality or consumers perception) were not included in this study for data-constraint because considering these aspects in the analysis, it might point out a trade-off situation between the different dimension of sustainability [19,29].
For example, increasing annual milk production per cow could improve economic and environmental performance, but this strategy is sustainable as long as animal welfare is guaranteed. Social issues, therefore, should be included into a sustainability analysis [19].
With regard to the environmental aspect, the analysis demonstrates that the most serious impact in terms of CO2 eq per unit of product is due to the emissions of methane in the enteric fermentation of animals; these emissions are directly connected to the type of diet fed to cattle, and consumption related to the production of feed and fodder, either self-produced by the companies themselves or purchased from external suppliers. In order to improve these aspect in terms of sustainability, according to [16] and [29], among others, two key factors have to be considered in conventional livestock breeding: management of feeding practices and annual milk production per hectare and per cow.
According to [30,31,32], higher use of grain and fiber-based concentrate in animal feeding could reduce enteric CH4 emissions while improve milk production, thus decreasing the denominator of CF index relating to on-farm emissions. However, a larger use of concentrates enhance off-farm emissions per kilogram of FPCM, which worsens milk CF.
In this perspective, more suitable strategies for conventional dairy farm are suggested by [33]: on the one hand, animal feeding should make a larger use of forage instead of grain-based concentrates, so that grasslands that are not suitable for crop production are used for extensive animal grazing, whereas waste products of agri-food industries could be recycled and integrated into livestock feed. On the other hand, waste disposal and its valorization thorough renewable energy production technologies (in particular the anaerobic digestion of sewage) allow for not inconsiderable reductions in the Carbon Footprint relative to the liter of milk produced.
Appropriate emission mitigation strategies should therefore involve the agricultural phase, in terms of the types of foods used and the optimization of resources and agricultural techniques, as well as providing the use of by-products (manure and slurry), in both organic fertilizer and the production of electricity and heat energy through anaerobic digestion. GHG emissions, quantified in the present study through the estimation of the CF, do not constitute the only source of environmental impact associated with the production process examined. Milk production and its related activities are also responsible for phenomena such as the eutrophication and acidification of waters, as well as having serious repercussions on soil quality and the biodiversity of the areas involved.
Therefore, the environmental benefits may be optimized by using integrated farming systems that use the best farming technologies for reducing the environmental impacts while producing high yields. As pointed out in previous studies [34,35], higher environmental performance could be achieved thorough integrated farming systems that combine the best farming technologies from organic and conventional systems. In addition, the evaluation of economic performance has highlighted the presence of critical issues regarding levels of profitability; these critical issues are not only due to exogenous reasons relating to the performance of the world milk market, as a result of the abolition of the quota system, but are also induced by limited competitiveness, in terms of production costs, that are connected to the structural characteristics of regional production. In fact, the regional system, composed mainly of small- and medium-sized farms, is heavily penalized in comparison to the international competition, where greater economies of scale and more intensification of the production process allow for a higher level of economic efficiency. However, the adoption of a more efficient feed management could also reflect its positive benefits from an economic point of view: a larger use of self-product forage, to the detriment of concentrates, could in fact reduce direct farm costs. In this way, farms could improve their added value and their operating income, although this means a decrease in yield levels per cow and per hectare [16]. The approach proposed in this paper does not claim to provide an exhaustive and definitive investigative tool for the study of the relationship between the two dimensions of sustainability in question. In addition, the limited sample size does not allow the formulation, through the application of more complex models including other covariates, of more reliable hypotheses on the nature of the interdependent relationships that bind economic and environmental performance, and the factors that underpin them. However, this study, confirms the results of several previous studies [16,36,37,38,39] regarding the negative correlation between the CF of milk and economic performance indicators. In this perspective, no trade-off could be identified between this two goals, thus it is possible for the agricultural sector to improve its profitability while simultaneously reducing its impacts on climate change.
More generally, this analysis presents a detailed picture of the milk production sector in the Region of Umbria from an environmental and economic perspective. This framework is useful from two points of view: the first is that the entrepreneur, through the results presented in this paper, could view the main strengths and weaknesses in the management of the dairy farm and implement corrective strategies in both economic and environmental terms. The indicators calculated can provide the farmers a tool to measure their achievements in terms of sustainability. Moreover, the results of this study, identifying regional benchmark values in terms of emissions and the profitability of the dairy sector, allow comparisons between a farm’s performance in the economic and environmental aspects of their production. Moreover, as concluded by [39], these indicators could also inform policy makers about the health status and trends in the performances within regional diary sector, and could represent essential advice that could support policy-makers in the planning of future rural development strategies [40].

Author Contributions

Massimo Chiorri coordinated the work.; Biancamaria Torquati designed the research and performed preliminary considerations; Chiara Paffarini and Marco Barbanera provided experimental support and collaborated in the interpretation and analysis of data; Lucio Cecchini and Daniele Foschini performed the research, analyzed the data and wrote the paper.

Conflicts of Interest

The authors declare no conflict of interest.

Abbreviations

The following abbreviations are used in this manuscript:
CAPCommon Agricultural Policy
CFCarbon Footprint
CO2 eqCarbon Dioxide Emission equivalent
FPCMFat and Protein Corrected Milk standardized
GHGGreenhouse gas emission
LCALife Cycle Assessment
PCRProduct Category Rule
ROOperating income

References

  1. Communication From the Commission (CE). Europe 2020 A Strategy for Smart, Sustainable and Inclusive Growth. 2010. Available online: http://ec.europa.eu/eu2020/pdf/COMPLET%20EN%20BARROSO%20%20%20007%20-%20Europe%202020%20-%20EN%20version.pdf (accessed on 17 May 2016).
  2. European Parliament and Council (EU). Regulation EU No 1307/2013 Establishing Rules for Direct Payments to Farmers under Support Schemes within the Framework of the Common Agricultural Policy and Repealing Council Regulation (EC) No 637/2008 and Council Regulation (EC) No 73/2009. 2013. Available online: http://eur-lex.europa.eu/legal-content/EN/TXT/?uri=CELEX:32013R1307 (accessed on 15 May 2016).
  3. Food and Agriculture Organization of the United Nations (FAO). Greenhouse Gas Emissions from the Dairy Sector: A Life Cycle Assessment; FAO: Italy, Rome, 2010; Available online: http://www.fao.org/docrep/012/k7930e/k7930e00.pdf (accessed on 13 May 2016).
  4. Hambly, J. Environmental—Ecological Impact of the Dairy Sector (Literature Review on Dairy Products for an Inventory of Key Issues—List of Environmental Initiatives and Influences on the Dairy Sector); International Dairy Federation: Brussels, Belgium, 2011; pp. 145–146. [Google Scholar]
  5. Hagemann, M.; Hemme, T.; Ndambi, A.; Alqaisi, O.; Sultana, M.N. Benchmarking of greenhouse gas emissions of bovine milk production systems for 38 countries. Anim. Feed Sci. Technol. 2011, 166, 46–58. [Google Scholar] [CrossRef]
  6. Thomassen, M.A.; van Calker, K.J.; Smits, M.C.; Iepema, G.L.; de Boer, I.J. Life cycle assessment of conventional and organic milk production in the Netherlands. Agric. Syst. 2008, 96, 95–107. [Google Scholar] [CrossRef]
  7. Van der Werf, H.M.; Kanyarushoki, C.; Corson, M.S. An operational method for the evaluation of resource use and environmental impacts of dairy farms by life cycle assessment. J. Environ. Manag. 2009, 90, 3643–3652. [Google Scholar] [CrossRef] [PubMed]
  8. De Vries, M.; De Boer, I.J.M. Comparing environmental impacts for livestock products: A review of life cycle assessments. Livest. Sci. 2009, 128, 1–11. [Google Scholar] [CrossRef]
  9. Flysjö, A.; Henriksson, M.; Cederberg, C.; Ledgard, S.; Englund, J.E. The impact of various parameters on the carbon footprint of milk production in New Zealand and Sweden. Agric. Syst. 2011, 104, 459–469. [Google Scholar] [CrossRef]
  10. Thoma, G.; Popp, J.; Shonnard, D.; Darin, N.; Marty, M.; Richard, U.; Wayne, K.; Dae Soo, K.; Zara, N.; Nathan, K.; et al. Regional analysis of greenhouse gas emissions from USA dairy farms: A cradle to farm-gate assessment of the American dairy industry circa 2008. Int. Dairy J. 2013, 31, S29–S40. [Google Scholar] [CrossRef]
  11. Gollnow, S.; Lundie, S.; Moore, A.D.; McLaren, J.; van Buuren, N.; Stahle, P.; Christie, K.; Thylmann, D.; Rehl, T. Carbon footprint of milk production from dairy cows in Australia. Int. Dairy J. 2014, 37, 31–38. [Google Scholar] [CrossRef]
  12. Thomassen, M.A.; De Boer, I.J.M. Evaluation of indicators to assess the environmental impact of dairy production systems. Agric. Ecosyst. Environ. 2005, 111, 185–199. [Google Scholar] [CrossRef]
  13. International Standard Organization (ISO). Greenhouse Gases—Carbon Footprint of Products—Requirements and Guidelines for Quantification and Communication; ISO/TS 14067:2013; ISO: Geneva, Switzerland, 2013. [Google Scholar]
  14. United Nations General Assembly. Resolution adopted by the General Assembly, 2005 World Summit Outcome. Available online: http://www.ifrc.org/docs/idrl/I520EN.pdf (accessed on 27 July 2016).
  15. Van Calker, K.J.; Berentsen, P.B.; Giesen, G.W.; Huirne, R.B. Identifying and ranking attributes that determine sustainability. Agric. Hum. Values 2005, 22, 53–63. [Google Scholar] [CrossRef]
  16. O’Brien, D.; Hennessy, T.; Moran, B.; Shalloo, L. Relating the carbon footprint of milk from Irish dairy farms to economic performance. J. Dairy Sci. 2015, 98, 7394–7407. [Google Scholar] [CrossRef] [PubMed]
  17. European Commission. Agriculture and Rural Development, Analysis of the EU Dairy Sector EU Production and Exports to Russia (2011–2013) Recent Market Trends and Measures Taken to Address Market Disruptions Following the Russian Import Ban 2014. Available online: http://ec.europa.eu/agriculture/russian-import-ban/pdf/dairy-production_en.pdf (accessed on 24 May 2016).
  18. National Institute of Statistics. Statistical Yearbook Italian; National Institute of Statistics: Rome, Italy, 2014.
  19. Thomassen, M.A.; Dolman, M.A.; van Calker, K.J.; de Boer, I.J.M. Relating life cycle assessment indicators to gross value added for Dutch dairy farms. Ecol. Econ. 2009, 68, 2278–2284. [Google Scholar] [CrossRef]
  20. National Institute of Statistics. 6th General Agricultural Census. 2012. Available online: http://www.istat.it/it/files/2011/03/1425-12_Vol_VI_Cens_Agricoltura_INT_CD_1_Trimboxes_ipp.pdf (accessed on 24 May 2016).
  21. International Standard Organization (ISO). Environmental Management—Life Cycle Assessment—Principles and Framework; ISO 14040:2006; ISO: Geneva, Switzerland, 2006. [Google Scholar]
  22. International Standard Organization (ISO). Environmental Management—Life Cycle Assessment—Requirements and Guidelines; ISO 14044:2006; ISO: Geneva, Switzerland, 2006. [Google Scholar]
  23. EPD (International Environmental Product Declaration System). General Programme Instructions for the International EPD® System 2.01. 2013. Available online: http://www.environdec.com/Documents/GPI/General%20Programme%20Instructions%20version%202.5.pdf (accessed on 28 July 2016).
  24. International Standard Organization (ISO). Environmental Labels and Declarations—Type III Environmental Declarations—Principles and Procedures—Product Category Rules according to: Arable Crops; ISO 14025:2006; ISO: Geneva, Switzerland, 2013. [Google Scholar]
  25. International Standard Organization (ISO). Environmental Labels and Declarations—Type III Environmental Declarations—Principles and Procedures—Product Category Rules according to: Raw Milk; ISO 14025:2006; ISO: Geneva, Switzerland, 2013. [Google Scholar]
  26. Intergovernmental Panel on Climate Change (IPCC). Guidelines for National Greenhouse Gas Inventories; IGES: Hayama, Japan, 2006; Volume 4, Chapter 10; pp. 7–69. [Google Scholar]
  27. Torquati, B.M. Economia e Gestione Dell’impresa Agraria; Edagricole: Bologna, Italy, 2003; pp. 245–286. [Google Scholar]
  28. Bates, D.M.; Watts, D.G. Nonlinear Regression Analysis and its Applications; John Wiley and Sons, Inc.: New York, NY, USA, 1988; p. 365. [Google Scholar]
  29. Dillon, E.; Hennessy, T.; Hynes, S. Assessing the sustainability of Irish agriculture. Int. J. Agric. Sustain. 2010, 8, 1–17. [Google Scholar] [CrossRef]
  30. Dillon, P.; Crosse, S.; O’Brien, B. Effect of concentrate supplementation of grazing dairy cows in early lactation on milk production and milk processing quality. Ir. J. Agric. Food Res. 1997, 36, 145–159. [Google Scholar]
  31. Benchaar, C.; Pomar, C.; Chiquette, J. Evaluation of dietary strategies to reduce methane production in ruminants: A modeling approach. Can. J. Anim. Sci. 2001, 81, 563–574. [Google Scholar] [CrossRef]
  32. Lovett, D.K.; Stack, L.J.; Lovell, S.; Callan, J.; Flynn, B.; Hawkins, M.; O’Mara, F.P. Manipulating enteric methane emissions and animal performance of late-lactation dairy cows through concentrate supplementation at pasture. J. Dairy Sci. 2005, 88, 2836–2842. [Google Scholar] [CrossRef]
  33. Tuomisto, H.L.; Hodge, I.D.; Riordan, P.; Macdonald, D.W. Does organic farming reduce environmental impacts?–A meta-analysis of European research. J. Environ. Manag. 2012, 112, 309–320. [Google Scholar] [CrossRef] [PubMed]
  34. Tuomisto, H.L.; Hodge, I.D.; Riordan, P.; Macdonald, D.W. Comparing energy balances, greenhouse gas balances and biodiversity impacts of contrasting farming systems with alternative land uses. Agric. Syst. 2012, 108, 42–49. [Google Scholar] [CrossRef]
  35. Tuomisto, H.L.; Hodge, I.D.; Riordan, P.; Macdonald, D.W. Comparing global warming potential, energy use and land use of organic, conventional and integrated winter wheat production. Ann. Appl. Biol. 2012, 161, 116–126. [Google Scholar] [CrossRef]
  36. Lovett, D.K.; Shalloo, L.; Dillon, P.; O’Mara, F.P. Greenhouse gas emissions from pastoral based dairying systems: The effect of uncertainty and management change under two contrasting production systems. Livest. Sci. 2008, 116, 260–274. [Google Scholar] [CrossRef]
  37. Beukes, P.C.; Gregorini, P.; Romera, A.J.; Levy, G.; Waghorn, G.C. Improving production efficiency as a strategy to mitigate greenhouse gas emissions on pastoral dairy farms in New Zealand. Agric. Ecosyst. Environ. 2010, 136, 358–365. [Google Scholar] [CrossRef]
  38. O’Brien, D.; Shalloo, L.; Grainger, C.; Buckley, F.; Horan, B.; Wallace, M. The influence of strain of Holstein-Friesian cow and feeding system on greenhouse gas emissions from pastoral dairy farms. J. Dairy Sci. 2010, 93, 3390–3402. [Google Scholar] [CrossRef] [PubMed]
  39. Van Passel, S.; Nevens, F.; Mathijs, E.; van Huylenbroeck, G. Measuring farm sustainability and explaining differences in sustainable efficiency. Ecol. Econ. 2007, 62, 149–161. [Google Scholar] [CrossRef]
  40. Cappelletti, G.M.; Ioppolo, G.; Nicoletti, G.M.; Russo, C. Energy Requirement of Extra Virgin Olive Oil Production. Sustainability 2014, 6, 4966–4974. [Google Scholar] [CrossRef]
Figure 1. System boundaries of the LCA analysis of milk production.
Sustainability 08 00728 g001
Figure 2. The relationship between operating income (€/L of milk) and the carbon footprint of milk (kg CO2/L of milk). FPCM = fat and protein corrected milk standardized to 4% fat and 3.3% true protein per kilogram.
Sustainability 08 00728 g002
Table 1. Revenues, expenses and operating incomes of the five farms (€/L of milk).
VariablesFarm 1Farm 2Farm 3Farm 4Farm 5Weighted AverageStandard Deviation
Income
Income from Milk Sales0.430.560.430.420.430.430.057
Income from Meat Sales0.020.040.020.020.020.020.009
Total income0.450.600.450.440.450.450.066
Variable costs
Animal feeds and concentrates costs0.160.110.180.270.160.180.053
Fodder costs0.080.030.070.020.060.060.023
Other direct costs 0.030.070.010.040.020.030.022
Fuels, lubricants and energy costs0.0180.030.0450.060.0250.030.015
Total variable costs0.2880.240.3050.390.2650.300.051
Fixed costs
Cost of labour0.100.170.190.070.040.070.070
Fixed costs for facilities and machinery0.0020.010.0150.010.0050.010.005
Total fixed costs0.1020.180.2050.080.0450.080.074
Indirect costs
Administrative and management costs0.070.040.060.040.040.050.013
Indirect costs0.070.040.060.040.040.050.013
Total costs0.460.460.570.510.350.420.086
Operating revenue−0.010.14−0.11−0.070.090.030.096
Table 2. Main cost and revenue variables of the five farms (percentages).
VariablesFarm 1Farm 2Farm 3Farm 4Farm 5Weighted AverageStandard Deviation
Income
Income from Milk Sales95.6%93.3%95.6%95.5%95.6%95.5%1.0%
Income from Meat Sales4.4%6.7%4.4%4.5%4.4%4.6%0.9%
Variable costs
Animal feeds and concentrates costs34.8%23.9%31.6%52.9%45.7%43.0%11.6%
Fodder costs17.4%6.5%12.3%3.9%17.1%13.8%6.0%
Other direct costs6.5%15.2%1.8%7.8%5.7%6.4%4.5%
Fuels, lubricants and energy costs3.9%6.5%7.9%11.8%7.1%7.4%2.5%
Total variable costs62.6%52.2%53.5%76.5%75.7%70.6%12.3%
Fixed costs
Cost of labor21.7%37.0%33.3%13.7%11.4%16.6%12.3%
Fixed costs for facilities and machinery0.4%2.2%2.6%2.0%1.4%1.4%0.8%
Total fixed costs22.2%39.1%36.0%15.7%12.9%18.0%12.8%
Administrative and management costs
Indirect costs15.2%8.7%10.5%7.8%11.4%11.3%2.6%
Total indirect costs15.2%8.7%10.5%7.8%11.4%11.3%2.6%
Table 3. Carbon Footprint of the five companies (kg CO2 eq/L of milk) for each phase of the production chain.
FarmFeedAnimal BreedingMilkingManure ManagementCF Milk
Feeding ConsumptionEnteric FermentationBarn ConsumptionConsumptionStorage Emissions
10.6140.0650.7790.1140.0780.105-1.76
20.3590.0690.4140.0150.0450.0020.00020.90
30.5990.0060.6680.0240.140.0340.00061.47
40.6540.0660.7370.0570.1150.0050.00071.63
50.4190.0460.4790.0180.0230.019-1.00
Table 4. Indicators of the evaluation of adaptation and test of the significance of the regression model.
RR2R2 AdaptedStandard ErrorF
0.8180.6680.5580.061906.050 *
* 10% significance level.
Table 5. Estimated parameters of the regression model.
Independent VariableCoefficientst testConfidence Interval for B 90.0%
Lower LimitUpper Limit
(Constant)0.0391.167
ln(CFi)−2.919−2.460 *−0.448−0.010
* 10% significance level.

