
Proposal for the Evaluation of Eco-Efficient Concrete

1
Building and Urban Research Institute, Korea Institute of Civil Engineering and Building Technology, Daehwa-dong 283, Goyandae-Ro, Ilsanseo-Gu, Goyang-Si 10223, Korea
2
School of Architecture & Architectural Engineering, Hanyang University, Sa 3-dong, Sangrok-Gu, Ansan-Si 04763, Korea
3
Department of Architectural Engineering, Andong National University, 1375, Gyeongdong-Ro, Andong-Si 36729, Korea
*
Author to whom correspondence should be addressed.
Sustainability 2016, 8(8), 705; https://doi.org/10.3390/su8080705
Submission received: 5 May 2016
/
Revised: 12 July 2016
/
Accepted: 14 July 2016
/
Published: 26 July 2016
(This article belongs to the Special Issue Life Cycle Assessment on Green Building Implementation)
Abstract
:The importance of environmental consequences due to diverse substances that are emitted during the production of concrete is recognized, but environmental performance tends to be evaluated separately from the economic performance and durability performance of concrete. In order to evaluate concrete from the perspective of sustainable development, evaluation technologies are required for comprehensive assessment of environmental performance, economic performance, and durability performance based on a concept of sustainable development called the triple bottom line (TBL). Herein, an assessment method for concrete eco-efficiency is developed as a technique to ensure the manufacture of highly durable and eco-friendly concrete, while minimizing both the load on the ecological environment and manufacturing costs. The assessment method is based on environmental impact, manufacturing costs, and the service life of concrete. According to our findings, eco-efficiency increased as the compressive strength of concrete increased from 21 MPa to 40 MPa. The eco-efficiency of 40 MPa concrete was about 50% higher than the eco-efficiency of 24 MPa concrete. Thus eco-efficiency is found to increase with an increasing compressive strength of concrete because the rate of increase in the service life of concrete is larger than the rate of increase in the costs. In addition, eco-efficiency (KRW/year) was shown to increase for all concrete strengths as mixing rates of admixtures (Ground Granulated Blast furnace Slag) increased to 30% during concrete mix design. However, when the mixing rate of admixtures increased to 40% and 60%, the eco-efficiency dropped due to rapid reduction in the service life values of concrete to 74 (year/m3) and 44 (year/m3), respectively.
1. Introduction
As argued by the “Declaration of Concrete Environment (2010)” of Korea and the “Declaration of Asian Concrete Environment (2011)” of six Asian countries, concrete has been shown to have an extremely large impact on environmental issues, including climate change [1]. Assessment of the environmental impacts of concrete materials and production has considerable importance. The concrete industry is shifting its paradigm from a simple construction industry that exploits resources and has environmental consequences to a sustainable development industry that preserves and maintains a robust global environment.
In addition, with the global topicality of energy conservation and greenhouse gas reduction, it is essential for the green growth of Korea to improve upon the environmental impacts of conventional cement and concrete industries. Based on the results of a recent evaluation of greenhouse gas emissions from materials used during the construction of buildings, concrete was found to be one of the major construction materials (along with reinforcement, steel frames, glass, paint, and insulation materials) that contribute to approximately 95% of overall greenhouse gas emissions. Because concrete is responsible for about 70% of this figure, there is a demand for techniques to evaluate and reduce greenhouse gas emissions from the production and use of concrete in construction [2].
However, there are a variety of significant pollution problems related to the environmental impact of concrete (in addition to global warming due to greenhouse gas emission), including depletion of the ozone layer, which predates global warming as an important environmental issue. In fact, the “Montreal Protocol on Substances that Deplete the Ozone Layer” came into effect in 1989 to stipulate regulations on the generation and use of chlorofluorocarbons (CFCs) that deplete the ozone layer. Sulfur dioxide (SO2) and nitrogen oxides (NOx), factors known to affect acidification, are specified as factors that affect human health, and are regulated as targets in the management of clean air environments.
Accordingly, diverse substances with an environmental load must be considered in addition to greenhouse gas emissions. To date, however, most of the research on concrete focuses almost exclusively on ways to improve the physical performance of concrete, such as crack control and increased strength and durability.
Currently, the development of eco-friendly concrete is receiving greater attention due to a growing focus on the effects of concrete production and use on the global, regional, and surrounding environments. Without comparing environmental emissions from the unit production of concrete with other construction materials, and considering the fact that large amounts of concrete and concrete products are required to construct commercial buildings and civil structures, efforts to quantitatively evaluate and reduce the effects of concrete production and use on the environment are essential to move the concrete industry toward sustainability. For this reason, studies are currently underway to evaluate and reduce the environmental impact of concrete. Nonetheless, existing domestic studies have mostly concentrated on technologies that reduce and evaluate greenhouse gas emissions among substances with an environmental impact.
There is an extreme scarcity of studies on technologies that comprehensively consider components of concrete, energy costs, and the durability of concrete as a structural material.
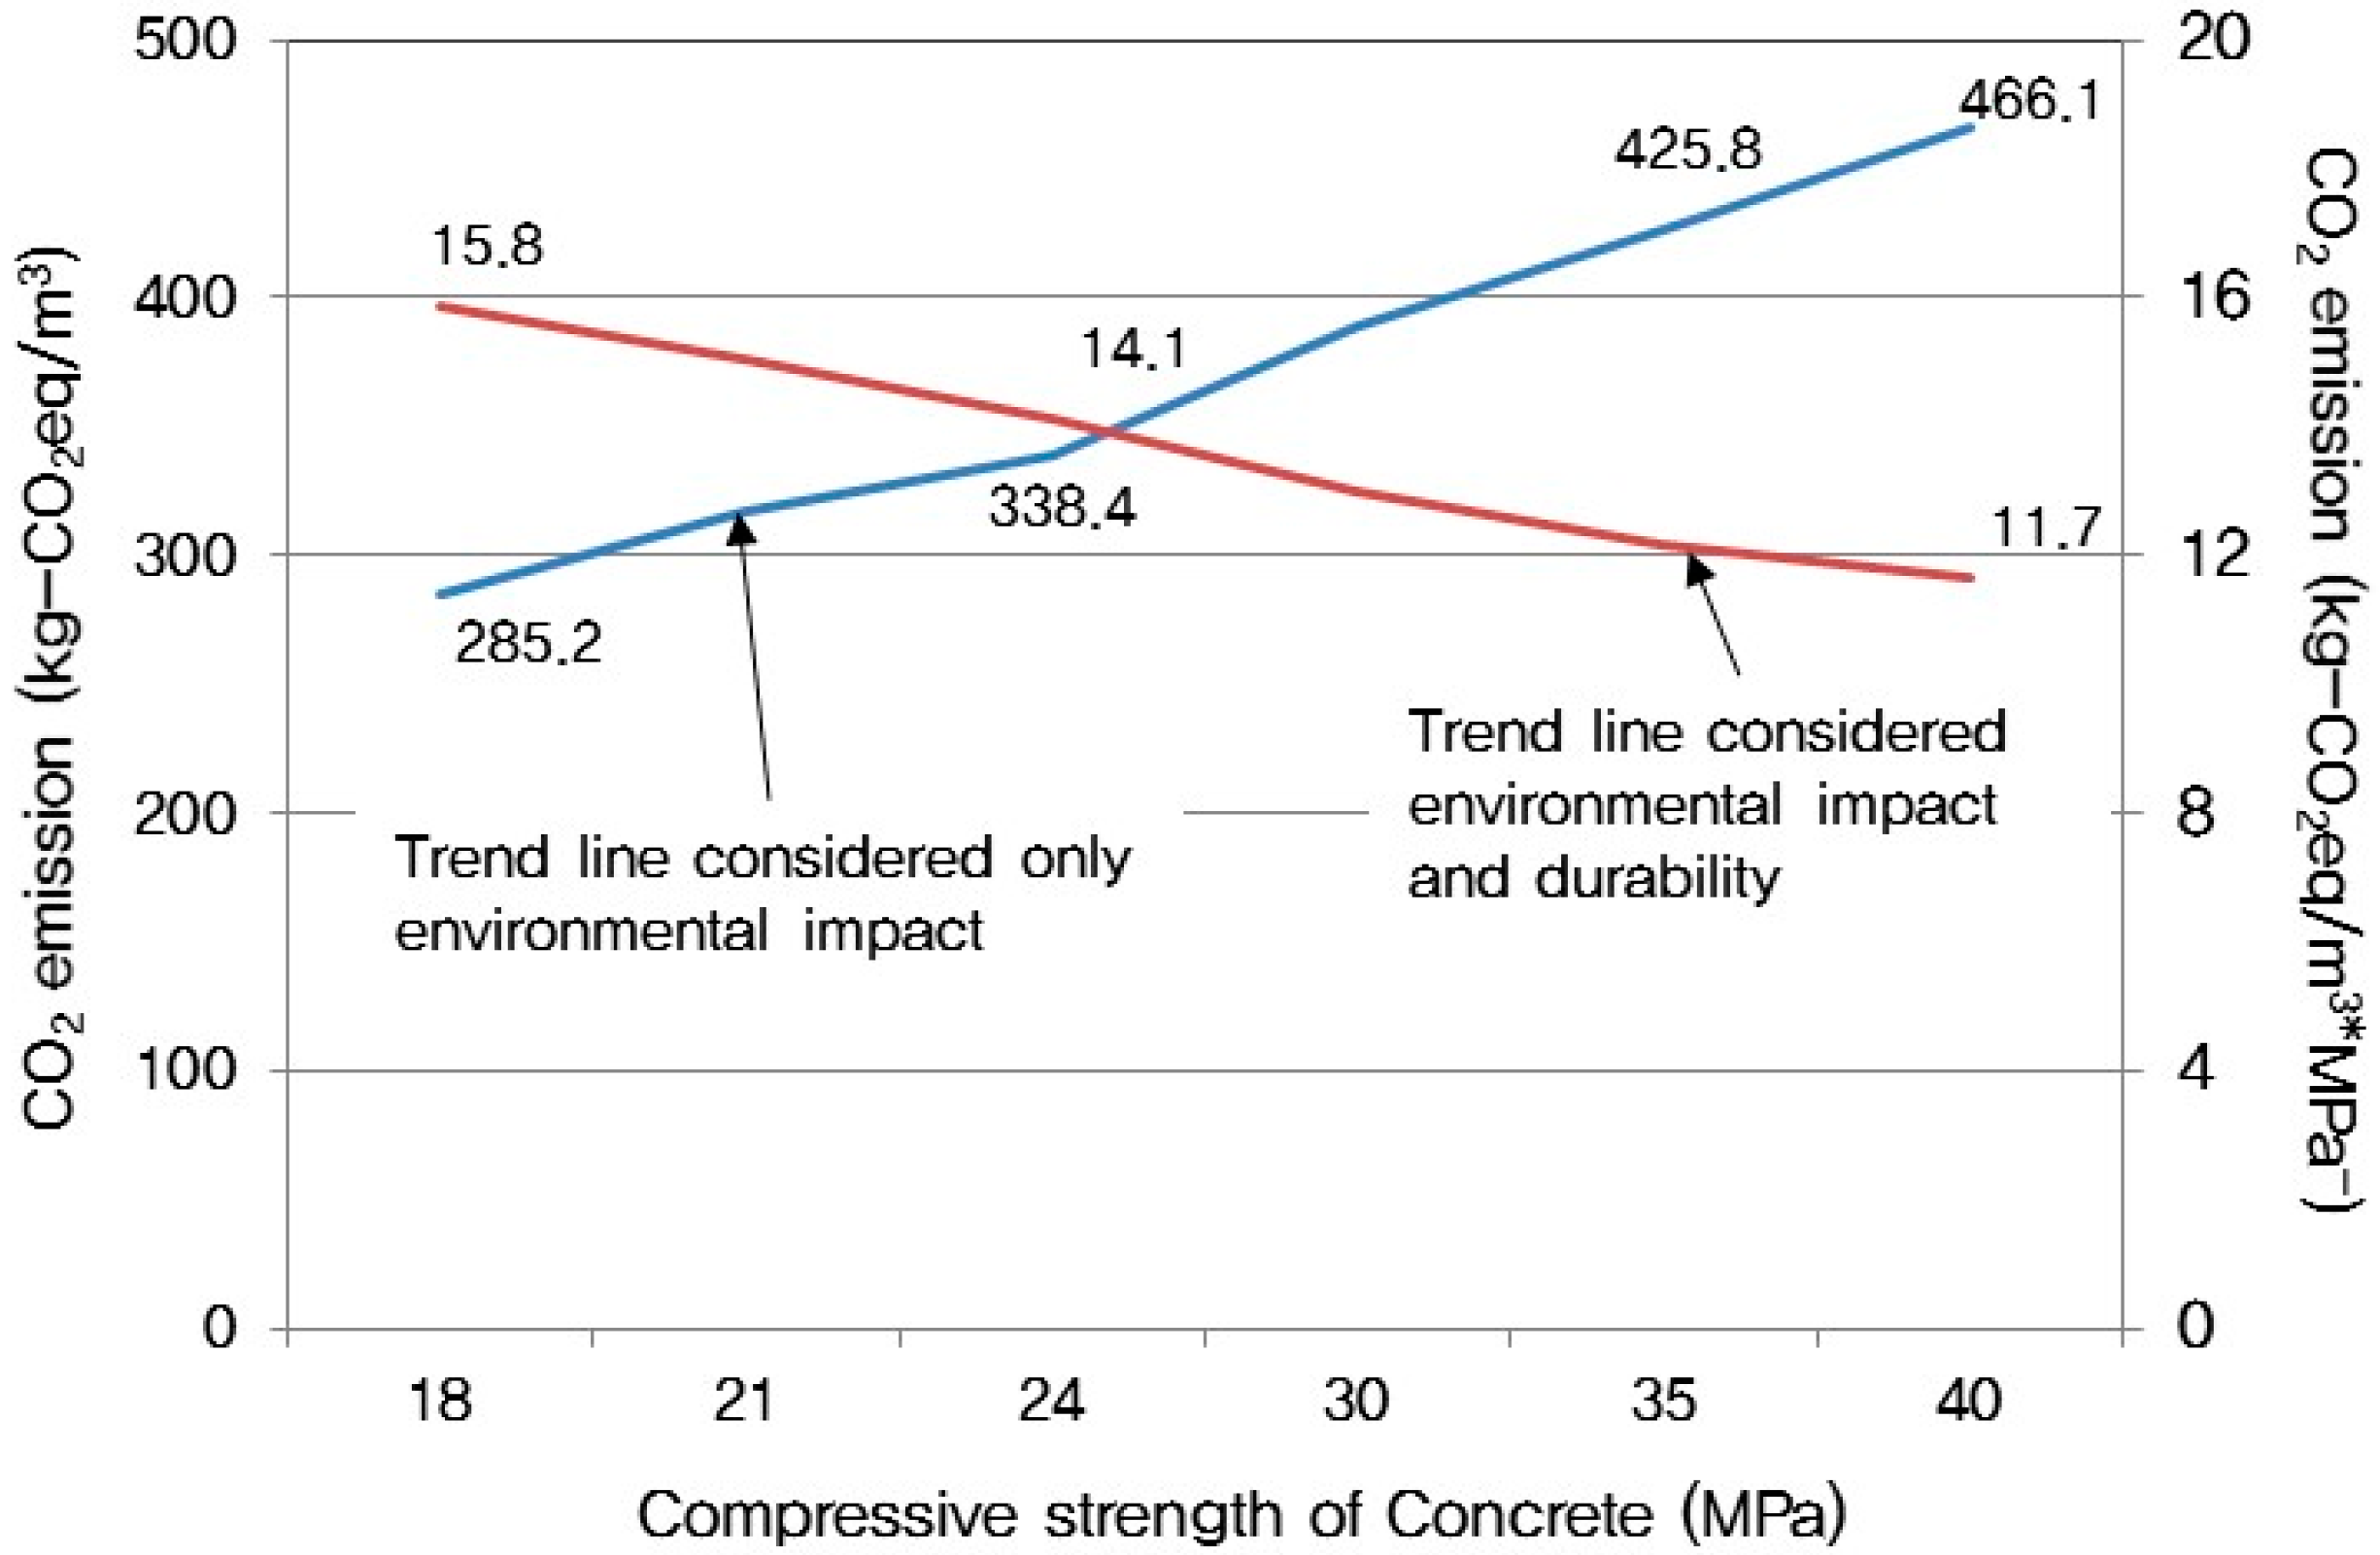
High-strength concrete has been evaluated to determine whether it is responsible for greater environmental emissions in comparison to normal-strength concrete in the context of environmental impact. It turns out, however, that high-strength concrete is in fact responsible for a lower proportion of emissions in terms of environmental impact and compressive strength (Figure 1) [3].
The importance of ecosystem effects of diverse substances with environmental impacts emitted during the production of concrete is recognized, but environmental performance has been evaluated separately from (and prioritized less than) the economic performance and durability performance of concrete. Eco-efficiency is an advanced concept used to evaluate the eco-friendliness of concrete [4]. The purpose of this study is to develop a method of evaluating the eco-efficiency of concrete based on environmental load emissions, manufacturing costs, and durability in the concrete production process. The technique proposed in this study intends to produce environment-friendly and highly durable concrete while minimizing both the environmental load on the ecosystem and manufacturing costs associated with the production and use of concrete. Our metrics are based on the results of service life assessments of various concrete samples. The technique can be utilized to evaluate the eco-friendly concrete.
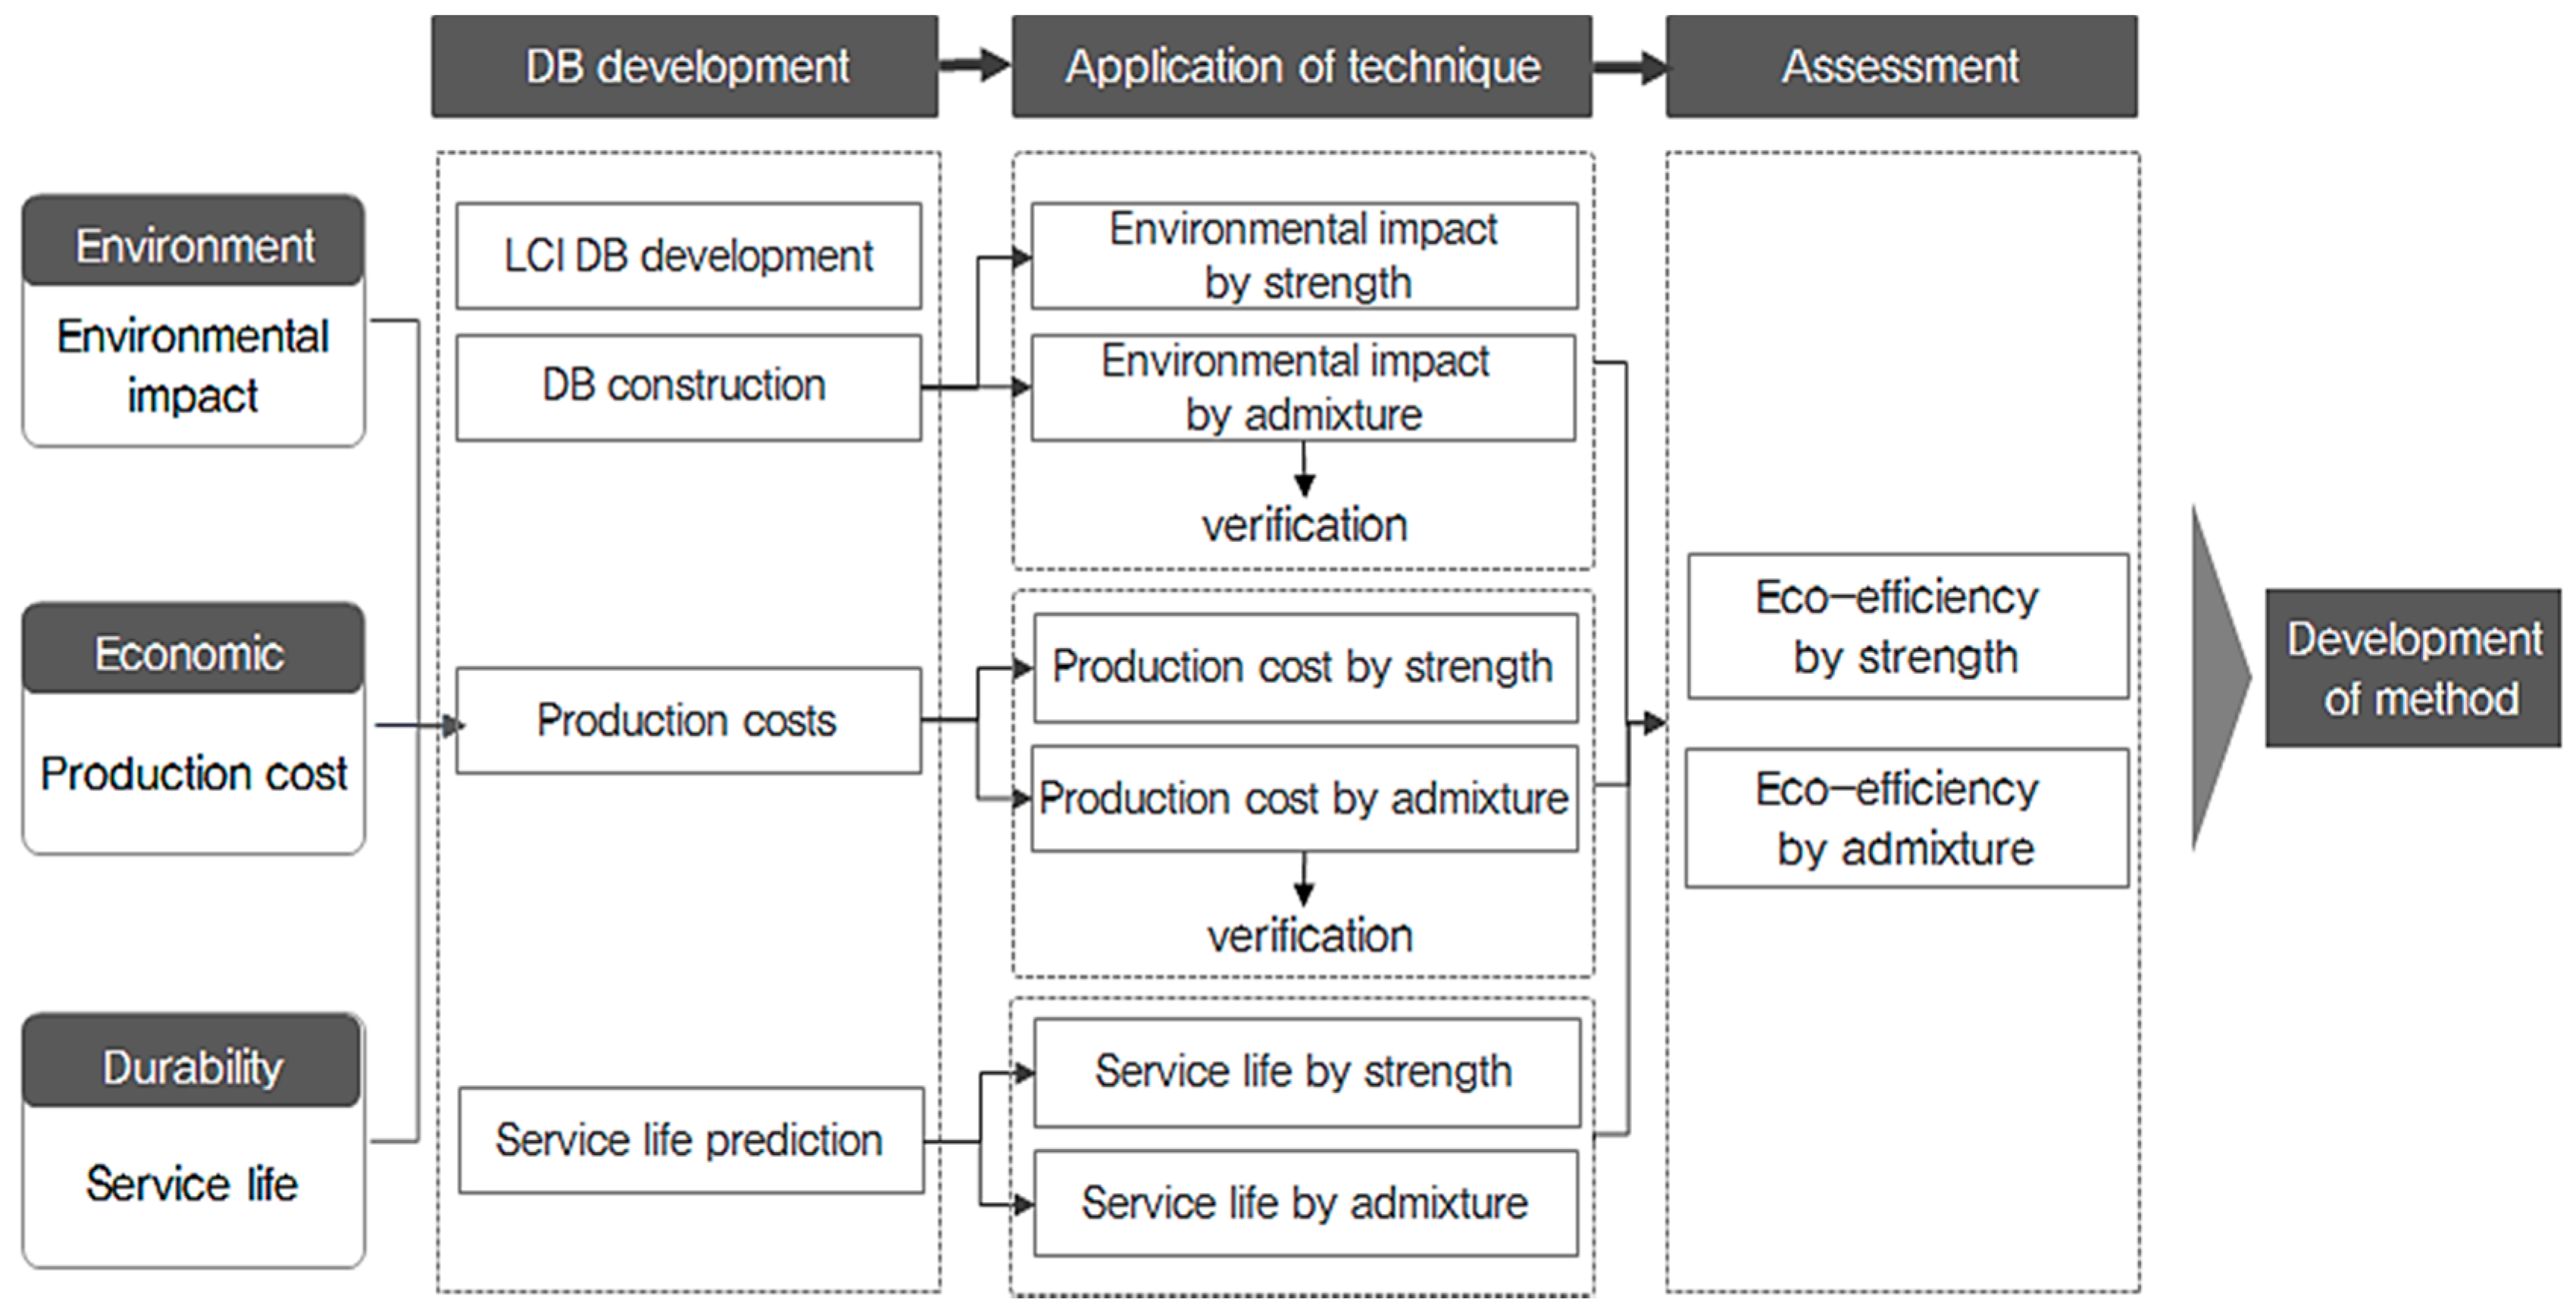
Furthermore, the vision of this research is to contribute to broad implementation of environment-friendly concrete and construction industries, as shown in Figure 2.
2. Literature Review
2.1. Concept of Eco-Efficiency
Through world summits on sustainable development such as the Rio Summit (1992) and the Johannesburg Summit (2002), sustainability has become the most important issue of the twenty-first century.
Eco-efficiency can be defined as a specific methodology to accomplish sustainability in the behaviors of governments, companies, or individuals. Accordingly, the World Business Council for Sustainable Development (WBCSD) was established to inspire companies to recognize the potential importance of eco-efficiency. There are some differences in the conceptual definitions of eco-efficiency and indicator development methodologies among nations, but the fundamental concept is identical to the original definition established by the WBCSD [5]. Eco-efficiency is based on the logic that companies with better eco-efficiency are more environmentally sustainable and show better environmental performance [6].
Eco-efficiency was initially utilized as an indicator to measure environmental efficiency as signified by environmental damage in comparison to the input of resources. However, eco-efficiency now includes environmental and economic implications, as it intends to create greater value using fewer resources. Eco-efficiency is a general concept that combines notions of economic efficiency and technical efficiency according to the conservation of resources, together with the concept of environmental efficiency, which aims to minimize environmental impacts from pollution (Equation (1)). As such, eco-efficiency is a concept for the sustainable development of products with competitive prices that simultaneously satisfies both environmental and social purposes.
Eco-efficiency = Economic Value/Environmental Impact
2.2. Eco-Efficiency Evaluation Methodology
Important details of the proposed eco-efficiency evaluation methodology can be summarized in four points.
First is the measurement of environmental impact and economic value, which constitute the denominator and numerator of the eco-efficiency index. As shown in Table 1, this can also be measured as the economic value of each unit element, or we can use environmental impact as the denominator and conversion factor. In addition, environmental emissions and economic value can be applied as cradle-to-grave or cradle-to-gate during the evaluation of product eco-efficiency [7].
Second, there is a demand for an alternative to weakness of eco-efficiency as a relative index. If the economic value of a product increases by four times and the environmental impact increases by two times, then the eco-efficiency of the product is increased by two times. However, this leaves some doubt as to whether it is appropriate to increase environmental emissions by two times.
Third, eco-efficiency evaluation is done in the form of an index.
An index is a dimensionless value that requires the denominator and numerator to have the same dimension. It is difficult to convert eco-efficiency into an index because its denominator and numerator have different dimensions.
The fourth point relates to the method of including the effects of recycling in the evaluation of eco-efficiency from a lifecycle perspective. An increase in eco-efficiency due to recycling is not included in the scope of evaluation.
For example, industries and companies that use large amounts of recycled resources pursue environmental management to reduce their environmental impact. Regardless, such efforts are not reflected in the evaluation of eco-efficiency according to the methodology herein.
2.3. Research Trends
The WBCSD has been developing eco-efficiency indicators that can be used to measure economic development and environmental sustainability in corporate management. It defines eco-efficiency as a means to minimize environmental impact from the use of resources, waste, and pollution, and to maximize the creation of corporate value.
To use indicators more effectively based on the same concept, the WBCSD classifies indicators into two types. The first type includes generally applicable indicators, which can be effectively applied to all companies, although the indicators do not have the same value or importance across varying companies. The second type includes business-specific indicators, which reflect specific characteristics of each business. Examples of generally applicable indicators include financial profitability and value-added benefits of companies in terms of product and service value, and emissions of acidification substances to the atmosphere and the total amount of waste in terms of the environmental impact of products and services.
Pacheco has introduced important problems related to crude oil, the main feedstock of most polymer-based materials. These problems include interstate wars and environmental disasters. The latter is the most worrisome, such as the recent Deep Water Horizon oil spill that released approximately 780 million liters of crude oil on the Gulf of Mexico. Some historical examples on the use of bio-admixtures in construction materials are presented [8].
Zuoren et al. has focused on the following major issues: (1) introduction to eco-materials; (2) life-cycle thinking and LCA methodology; and (3) LCA practice for materials products and development of eco-materials [9].
Agustin et al. has presented the environmental value proposed by the Multilayer Structural Panels technology. This is an overall approach that considered the structural aspects and the environmental problems involved [10].
Jiaying et al. has analyzed the eco-footprint and eco-efficiency for the life cycle assessment of an exhibition hall in China. In addition, the measures were presented to reduce the eco-footprint and improve the eco-efficiency [11].
Dezhi et al. has presented an analysis methodology for energy evaluation of building construction. In addition, the amount of energy consumed is selected as the indicator of product value and the environmental impact [12].
3. Proposed Assessment Method for the Eco-Efficiency of Concrete
3.1. Overview
3.2. Definition of Concrete Eco-Efficiency
There are limitations to assessing the eco-friendliness of concrete according to environmental emissions alone, without consideration of functionality (durability) and economic performance of concrete as an essential construction material.
Therefore, the concept of eco-efficiency was applied to assess the eco-friendliness of concrete, as shown in Figure 4.
The proposed concrete eco-efficiency assessment method is a technique to ensure the production of highly durable and environment-friendly concrete, while minimizing both the environmental load and manufacturing costs on the ecological environment based on the results of the assessment of environmental load, manufacturing costs, and the service life of concrete. Concrete eco-efficiency is improved by increasing the service life (years) of concrete and reducing the costs (KRW, Korea Won) of production. Thus, concrete with a low eco-efficiency value (KRW/year) among other concrete samples of the same strength is regarded as concrete with improved eco-efficiency.
Equation (2) shows the calculation method for concrete eco-efficiency.
CEI = (EC + MC)/SL
Here, CEI is the concrete eco-efficiency index (KRW/year), EC is the environmental cost (KRW/m3), MC is the manufacturing cost (KRW/m3), and SL is the service life of concrete (year/m3).
3.3. Eco-Efficiency Assessment Process
Concrete eco-efficiency assesses the environmental performance, cost performance, and durability performance of concrete according to input materials and energy sources during the production of concrete (cradle-to-gate). The environmental aspect assesses the environmental load of raw materials and energy sources used during the production of concrete based on a lifecycle assessment (LCA) technique.
The lifecycle impact assessment of concrete was performed separately for raw materials, transportation, and manufacturing stages. For the impact assessment, a damage-oriented (endpoint) method was applied to identify the degree of effects of environmental emissions from concrete production on human beings and the ecosystem [14].
Six types of environmental impacts, global warming, acidification, eutrophication, resource consumption, effects on the ozone layer, and creation of photochemical oxides, were selected as subjects of assessment. We analyzed the effects of these six environmental impact categories on safeguard subjects, including human health, social assets, fauna, flora, and primary manufacturing.
Database presented in the previous study [15] was applied to convert the effects into cost values.
The previous study is the first research of its kind in Korea to create lifecycle environmental impact indicators in the current unit. Because there are no other theories or DB specialized for construction materials and concrete in Korea, the DB of our previous work is appropriate for calculating the environmental costs of concrete herein.
Economic performance is deduced by combining different lifecycle costs, such as raw materials and energy sources (oil and electric). This study used DB on standard unit prices of materials for the production of concrete and energy sources provided by the Korean Price Information System [16].
Durability evaluates the expected service life of concrete based on carbonation among diverse deterioration phenomena. Among existing carbonation prediction equations, a formula presented by the Japanese Society of Civil Engineers was used herein to derive this study’s equations for the service life of concrete.
3.4. Eco-Efficiency Assessment Method of Concrete
3.4.1. Environmental Performance (EP)
For the assessment of concrete eco-efficiency, environmental performance was assessed using a lifecycle assessment (LCA) technique.
- (1)
- Definition of purpose and scope
General concrete was selected as the product subject to LCA, and the formation of concrete structure and concrete product was selected as the primary function of concrete. The functional unit was defined as 1 m3 of concrete based on the primary function.
- (2)
- Life Cycle Impact Assessment (LCIA)
Life Cycle Impact Assessment (LCIA) is a process that assesses the potential effects of indicators (input and output) created during lifecycle impact analysis on the environment.
Concrete is a mixture of cement, aggregates, and admixtures. Large amounts of energy are consumed during the collection of limestone or clay and the manufacture of clinker. Soil erosion or destruction of the ecosystem may occur from the collection of aggregates. In addition, because energy is also used during the transport of materials such as cement and aggregate to concrete manufacturers and during the production of concrete, diverse substances that incur environmental loads on air, water systems, and soil are emitted.
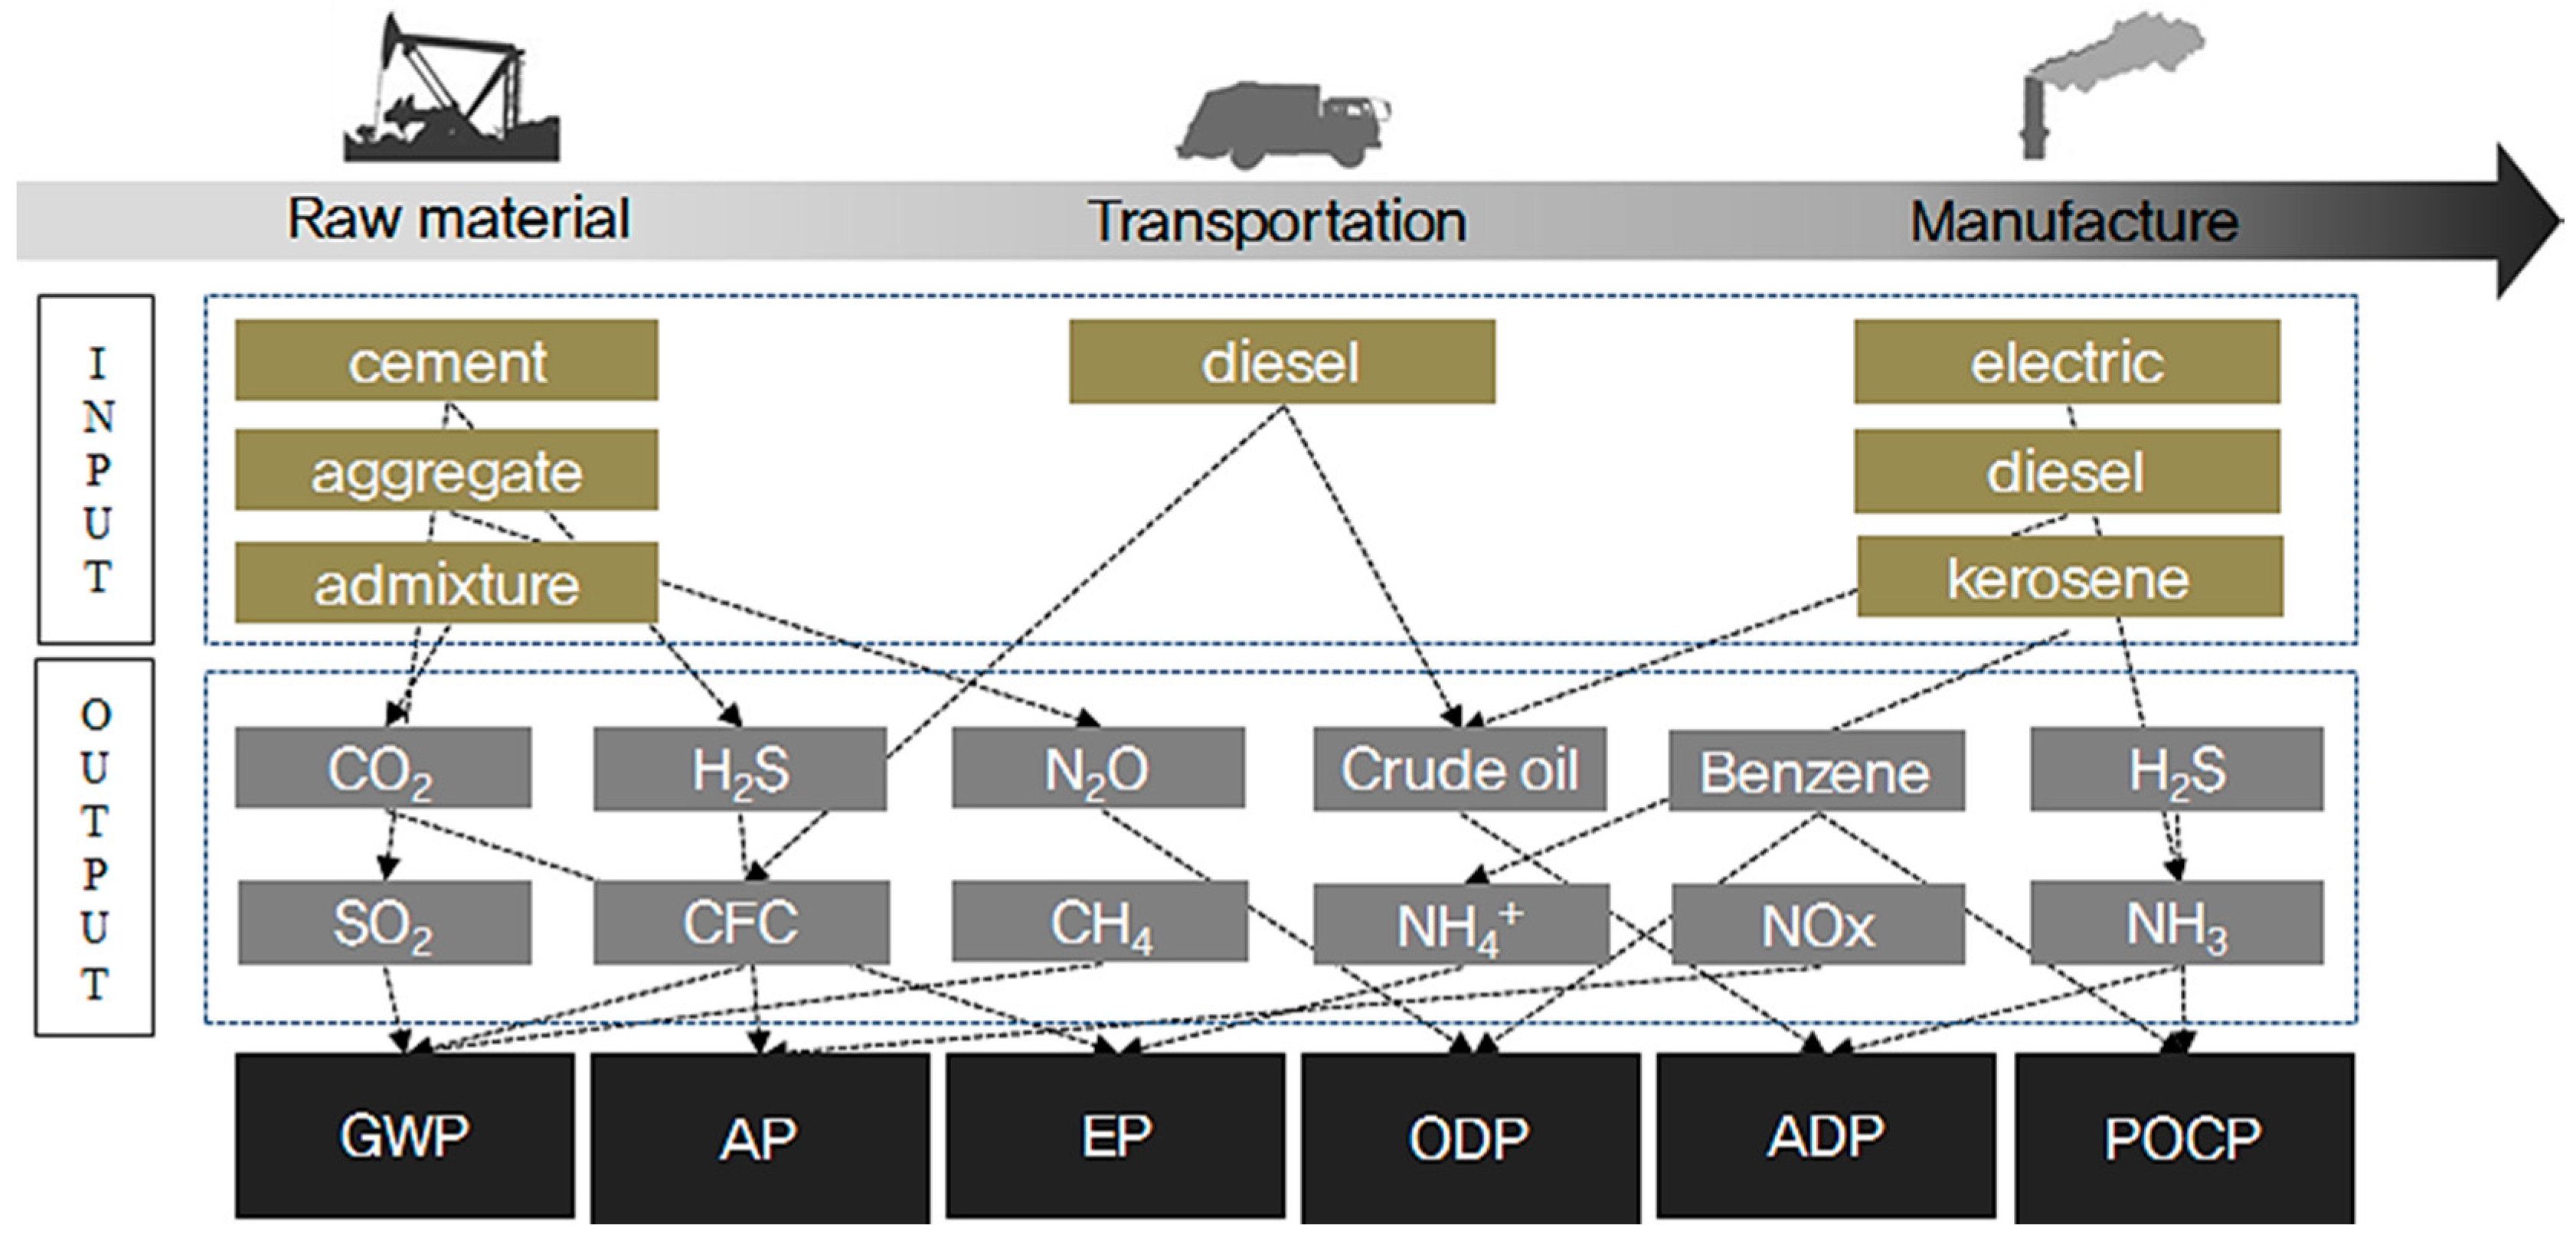
Because different environmental impacts occur during the lifecycle of concrete, multiple environmental impact assessments must be conducted on various aspects from production to use and disposal of functional units of concrete. Indeed, the assessment of a single environmental impact, such as global warming, fails to comprehensively assess the environmental performance of concrete (Figure 5). Accordingly, Life Cycle Impact Assessment (LCIA) on concrete was conducted based on standard substances and impact indicators for each of the six environmental impact categories, global warming, resource consumption, acidification, eutrophication, effects on the ozone layer, and creation of photochemical oxides [17].
Life Cycle Impact Assessment (LCIA) is divided into four steps: (1) classification in which the inventory items extracted from the inventory analysis are assigned to the corresponding impact categories; (2) characterization in which the impact of each item classified into its impact category on each category is quantified; (3) normalization in which the environmental impact exerted on the environmental categories are divided into local or global environmental impacts; and (4) weighting in which relative importance among the impact categories is determined. According to ISO 14044 [18], the classification and characterization steps are mandatory assessment steps, and the normalization and weighting steps may be optionally assessed depending on the assessment purpose. In this study, assessment was performed for the classification and characterization steps because factors for concrete-related normalization and weighting suitable for Korean situations are yet to be developed.
The standard substances and impact potentials for environmental impact categories were applied in accordance with the respective databases used in the Ministry of Environment for the eco-labeling of the Environmental Declaration of Products [19,20]. The classification and characterization steps of assessment were performed on the basis of the previously selected LCI (Life Cycle Inventory) database [21].
Classification is done by categorizing and compiling the inventory items according to the environmental impact categories. By linking the inventory items derived from the LCI database to the pertinent environmental impact categories and integrating them by category, the environmental impact of each inventory item can be clearly identified.
CO2, CH4, and N2O belong to the 23 GHGs specified in the Intergovernmental Panel on Climate Change (IPCC) guidelines [22], of which the standard substance is CO2.
The classification of abiotic depletion potential (ADP) based on the standards provided by Guinee (1995) [23], takes into account a total of 89 resource items including crude oil, natural gas, and uranium (U). Acidification potential (AP) varies widely according to regional characteristics and atmospheric environments, and we applied the AP index presented by Heijung et al. and Hauschild and Wenzel [24] applicable to all regional types. A total of 23 inventory items linked to acidification category, including sulfur dioxide (SO2), hydrogen sulfide (H2S), and hydrogen fluoride (HF), are expressed in terms of their standard substance SO2. Likewise, the index proposed by Heijung et al. and Hauschild and Wenzel was applied for the classification of the eutrophication potential (EP), with phosphate (PO43−) used as the standard substance for a total of 11 inventory items including phosphate (PO43−), ammonia (NH3), and nitrogen oxides (NOx). For the ozone depletion potential (ODP), we applied the ODP index specified in the World Meteorological Organization (WMO) [25] for a total of 23 inventory items, including CFC-11, Halon-1301, and CFC-114, with trichloro-fluoro-methane (CFC-11) as the standard substance. For the photochemical oxidant creation potential (POCP), a total of 128 inventory items were considered, including ethylene, NMVOC, and ethanol, with ethylene being the standard substance, thereby applying the POCP index proposed by Derwent et al. [26] and Jenkin and Hayman [27].
Characterization is a process of quantifying the environmental impact of inventory items itemized for each category in the classification step.
In the classification step, inventory items are assigned to their respective environmental impact categories, but there is a limitation in quantifying the potential impacts of inventory items in common metrics due to different impact potentials. Category indicator results, i.e., characterization values, are calculated in the characterization step where the environmental impact (=inventory data) of each inventory item is multiplied with the characterization factor (=impact potential) unique to the impact category concerned, and the resulting environmental impact thus converted into impacts are aggregated within each impact category to yield the overall environmental impact of that category (Equations (3)–(8)).
Global Warming Potential (GWP) = Environmental impact × Characterization factor for GWP
Ozone Depletion Potential (ODP) = Environmental impact × Characterization factor for ODP
Acidification Potential (AP) = Environmental impact × Characterization factor for AP
Abiotic Depletion Potential (ADP) = Environmental impact × Characterization factor for ADP
Photochemical Oxidant Creation Potential (POCP) = Environmental impact × Characterization factor for POCP
Eutrophication Potential (EP) = Environmental impact × Characterization factor for EP
- (3)
- Damage assessment
Environmental cost, shown by Equation (9), converts the damage done to human beings and the ecosystem by the production of concrete into an economic value. Environmental cost is calculated by multiplying the damage factor of each safeguard subject and the economic value of each damage indicator for influential substances that belong to an environmental impact category (Figure 6).
Dk = ∑(Loadi,j × DFk,i,j × Kc)
Here, Loadi,j is the environmental load of influential substance j that belongs to impact category i, DFk,i,j is the damage factor for the damage caused by influential substance j that belongs to impact category i on safeguard subject k, and Kc is the economic value (KRW) of safeguard subject k.
- (a)
- Safeguard subject
From the viewpoint of environmental ethics, the environment is mainly divided into the human environment and the ecosystem. The human environment can be subdivided into human health and social assets that sustain human society, such as crops and resources.
Accordingly, as shown in Table 2, human health, biodiversity, social assets, and primary production were selected in this study as four safeguard subjects. Rather than the Eco-indicator 99 [28] (which reflects the environmental situation of Europe), the Korean lifecycle impact assessment index based on damage-oriented modeling (KOLID) [29] benchmarks the lifecycle impact assessment method based on endpoint modeling (LIME) of Japan [30], which clearly describes the philosophical grounds for the selection of safeguard subjects. Therefore, it is appropriate for the current analysis to use the safeguard subjects of KOLID for the calculation of the environmental costs of concrete.
- (b)
- Damage indicators
Table 2 shows damage indicators for each safeguard subject, unit of each damage indicator, and scope of assessment necessary for quantification of damage received by the four safeguard subjects according to environmental load. For human health, the degree of damage on human health caused by specific disease or physical factor was quantified as Disability Adjusted Life Year (DALY), a value that expresses the degree of damage on human health using the concept of life year. DALY can be used to assess cases of early death from disease or accident and cases of unhealthy life due to disability. For example, one DALY means that life year during which death from disease or accident and unhealthy life occurs is 1 year. As shown by Equation (10), DALY can be expressed as the sum of “Years of Life Lost (YLL)” from disease or accident and “Years Lost due to Disability (YLD).” YLD can be derived by reflecting importance of disability (D) and social value of age upon death. However, only importance of disability was accounted without consideration on importance of age and time discount originally considered in DALY. DALY was used as an indicator to show combined years lost from death and disability [31,32].
DALY = YLL + YLD
Social assets [33] can be classified into “production capacity of the ecosystem” that corresponds to the biological world and “non-biological resources” related to non-biological elements. In this study, forest resources, marine resources, and agricultural crops correspond to production capacity of the ecosystem, and fossil fuels and mineral resources correspond to non-biological elements. Current value assessment method, which uses actual market price, was applied as an indicator to measure the amount of damage for each item. When assessing biodiversity, general method involves classification of species according to the Endangered Species Act of the United States, the Convention on international angered Species of Wild Flora and Fauna (CITES), and Red Data Book (RDB) published by the International Union for Conservation of Nature (IUCN) [34]. The conventional damage oriented methods of impact assessment reflect such reality and conduct assessment based on quantifiable species [35,36]. In this study, “Expected Increase in Number of Extinct Species (EINES)” based on preservation ecology was adopted as damage indicator for ease of interpretation and agreement with data from Red Data Book. EINES, obtained from the increase in number of extinct species caused by environmental load, can be expressed as Equation (11).
EINES = ∑Rs = ∑ [(1/Ta,s) – (1/Tb,s)]
Here, Rs is the extinction risk increase by environmental impact; Ta,s is the extinction hours after caused environmental impact; and Tb,s is the extinction hours ago caused environmental impact.
Damage indicators to assess the effects of primary production include gross primary production (GPP), net primary production (NPP), and plant biomass. From the perspective of plant supply to consumers, plant biomass seems to be an optimal indicator given that a certain critical mass of plants must be accumulated and secured. Considering, however, that this certain level of plant supply must be consistently maintained, the provision of large accumulations at specific points in time will not satisfy the long-term requirements for plants. Plants must be grown at a constant rate. Accordingly, the damage indicator for primary production is shown by the change of NPP per unit of environmental load.
- (4)
- Integrated DB for each safeguard subject
The marginal willingness to pay per unit of environmental property was the unit converted for each unit of the four safeguard subjects considered, as presented in Table 3 and Table 4. Economic values (KRW, Korea Won) in Table 5 form the integrated DB for each safeguard subject. For reference, the unit conversion assumed that the loss of social assets (national economy) and economic loss are identical.
3.4.2. Cost Performance (CP)
Economic performance assessment is performed on raw material production, transportation, and concrete manufacturing stages. The manufacturing cost per 1 m3 of concrete was calculated using the unit price (Korean price information DB), based on the amount of materials and energy sources used in each step (Equation (12)). As shown in Table 6, the standard price information DB of Korea was investigated and applied to calculate the manufacturing costs for the raw materials and energy sources used in the production of concrete. Manufacturing cost (MC) was calculated by multiplying the unit price (KRW/kg) of raw materials, such as normal cement, slag cement, aggregate, admixtures (GGBS and fly ash), and chemical admixtures used to manufacture 1 m3 of concrete, with the unit price (KRW/unit) of energy sources such as diesel, kerosene, electricity, and LNG used in the production of concrete by transport equipment and manufacturing facilities.
COSTpf = ∑(Inputi,j × UCi)
Here, Inputi,j is (i) step (j) material and energy and UCj is (j) unit price of material production (KRW). (i) Step: Raw material, Transportation, Manufacture. (j) Material: Cement; aggregate, admixture, etc.; electricity; and oil (diesel and kerosene) used by trains, trucks and batch plants.
3.4.3. Durability Performance (DP)
Durability performance assessment of concrete was assumed to assess the service life of concrete used on a reinforced concrete (RC) structure based on carbonation. In addition, the covering thickness was 30 mm. For our purposes, service life was defined as the duration of utility until the carbonation depth of concrete reaches the outermost reinforcement. The most appropriate equation was selected as the standard specification for concrete to indicate that equations other than the proposed equation should be used. For this, service life was assessed on covering thicknesses of 30 and 40 mm with a water-binder ratio of 60%.
- (1)
- Selection of prediction equation for the service life of concrete
Service life was assessed for covering thicknesses of 30 mm and 40 mm with a water-binder ratio of 60%. Although conditions for the calculation of service life differ, concrete comprised of ordinary Portland cement was assessed under outdoor conditions in order to apply identical parameters.
As shown in Table 7, an equation from the Architectural Institute of Japan (AIJ) [37] was used to deduce the results of assessment. The AIJ formula is appropriate because it yields results that are closest to the average service life of concrete.
- (2)
- Prediction factors of the service life of concrete
Among existing carbonation prediction equations, Equations (13) and (14) (originating from the Architectural Institute of Japan) were used to derive the service life of concrete in order to assess the durability performance of concrete. However, because conditions of temperature and humidity in Japan (as presented in the values of the equations) are different from the values in Korea for an average year, more apt coefficients for the conditions of Korea were derived with annual average values provided by the Korea Meteorological Administration.
Durabilitypf T = (C/A)2
A = K × α1 × α2 × α3 × β1 × β2 × β3
Here, T is the service life (year), C is the carbonation depth (mm), A is the carbonation velocity coefficient, K is the Kishitani coefficient, α1 is the coefficient by type of concrete, α2 is the coefficient by type of cement, α3 is the coefficient by the water-cement ratio, β1 is the coefficient by temperature, β2 is the coefficient by moisture, and β3 is the coefficient by the concentration of carbon dioxide.
- (3)
- Selection of covering thickness
Korean structural design standards for reinforced concrete have similar criteria to the code of the American Concrete Institute (ACI) [43]. Item 7.7.1 of ACI 318 suggests a covering thickness of 1.5 inches (38 mm) for reinforcement No. 14 and No. 18, and ¾ inches (19 mm) for reinforcement No. 11 and below in the case of slabs, walls, and joist structures. The Korean standards suggest a covering thickness of 1.5 inches (38 mm) for main reinforcement, hoop reinforcement, and stirrup spiral reinforcement of beams and columns. In addition, the Japanese Architectural Standard Specification (JASS) [44] suggests covering thicknesses of 30 mm for slabs and 40 mm for column and bearing walls under the same conditions (i.e., when the structures do not directly contact soil and air).
Japan does not apply different criteria according to varying thicknesses of reinforcement. This study applied version 8.1.1 of the durability assessment criteria of green building certification standards (2013) [45]. The criteria of green building certification (2013) were selected based on the “Korean Building Code (KBC-2009) [46] and Concrete Structure Design Standards (2012)” [47]. Green building certification presents the legal minimum covering thickness to ensure the safety of structures by reflecting errors in covering thickness during actual construction. Accordingly, the covering thickness of reinforced concrete was defined as 30 mm to assess the service life of concrete based on carbonation according to the standards of green building certification.
4. Case Analysis
Eco-efficiency was assessed according to compressive strengths of concrete and mixing rates of admixtures. Changes in eco-efficiency according to increasing compressive strengths were assessed, and the major causes of any changes were analyzed.
4.1. Results of Eco-Efficiency Assessment for Different Compressive Strengths
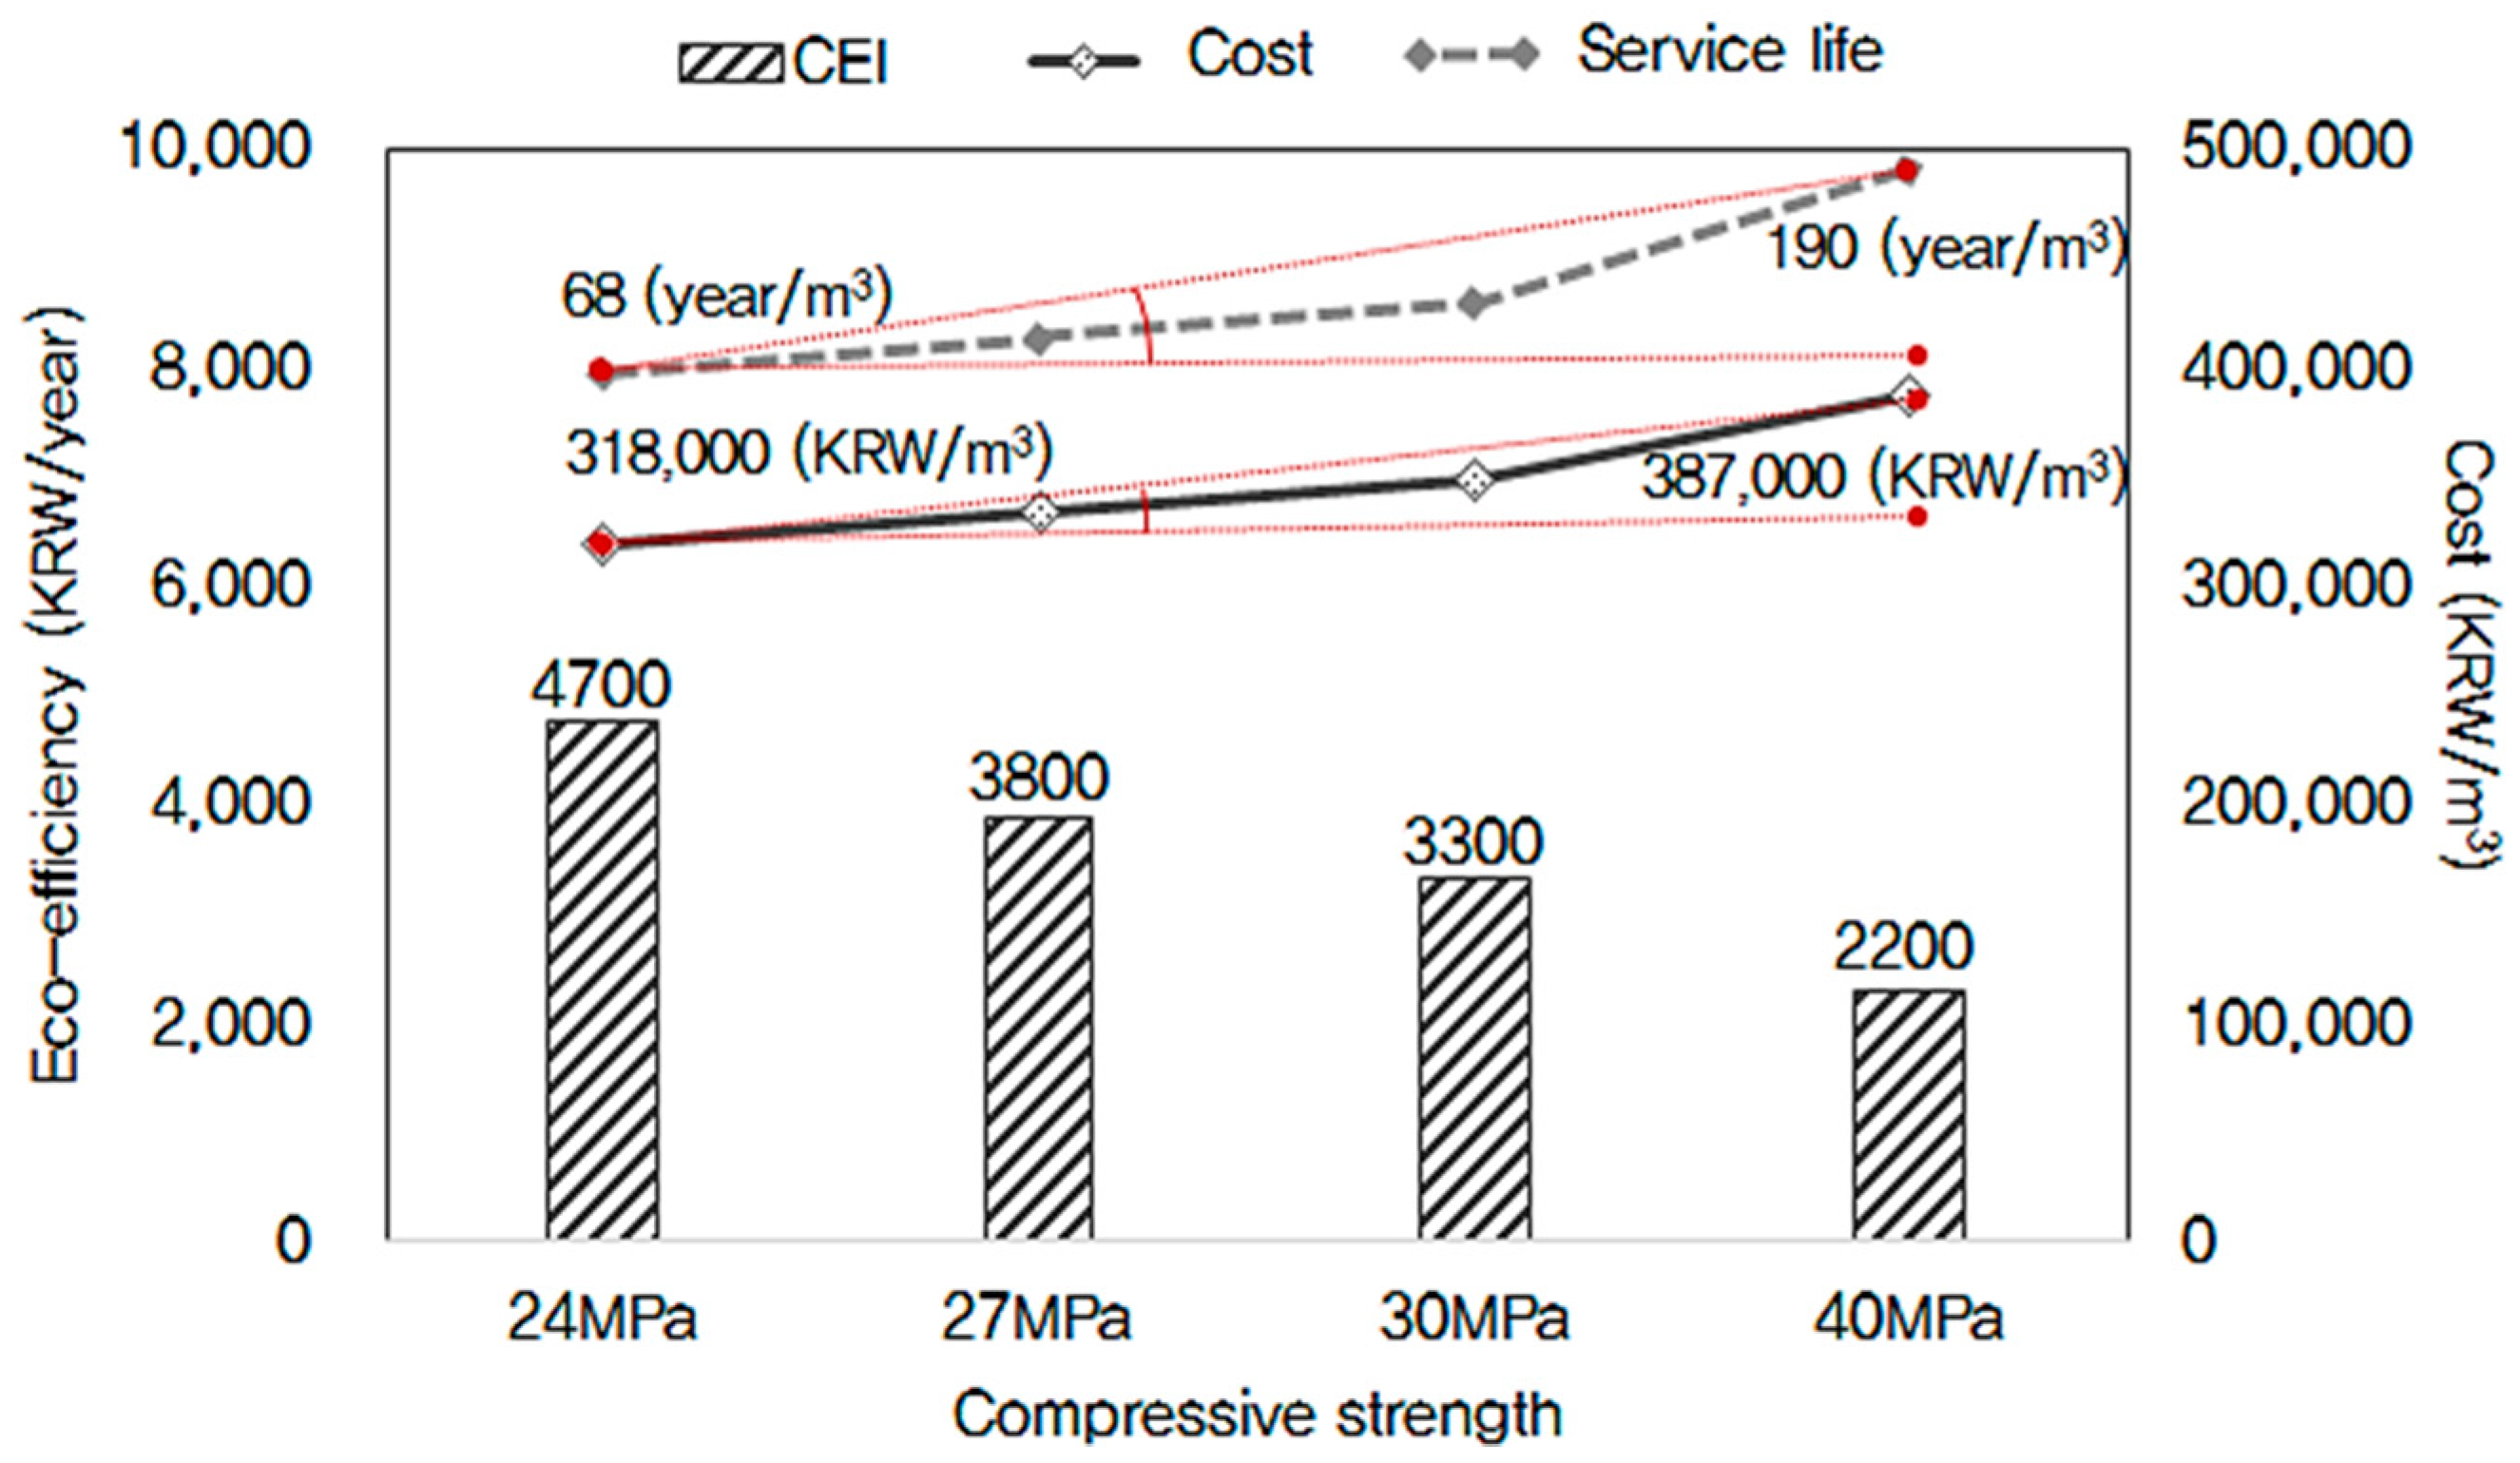
As shown in Table 8, average eco-efficiency increased from 5700 (KRW/year) to 2200 (KRW/year) with an increase of compressive strength from 21 MPa to 40 MPa. In the case of 24 MPa and 40 MPa concretes, average eco-efficiency was 4700 (KRW/year) and 2200 (KRW/year), respectively (Figure 7).
The eco-efficiency of 40 MPa concrete was increased by about 50% in comparison to the eco-efficiency of 24 MPa concrete.
As shown in Figure 7, cost (comprising environmental and manufacturing costs) increased by about 21% from 318,000 (KRW/m3) to 387,000 (KRW/m3) according to increasing compressive strengths from 24 MPa to 40 MPa. Importantly, however, the service life of concrete based on carbonation was greatly increased from 68 (year/m3) to 190 (year/m3) with rising compressive strengths as well. As such, eco-efficiency was found to increase with the increasing compressive strength of concrete, because the rate of increase in service life is larger than the rate of increase in cost [48].
4.2. Results of Eco-Efficiency Assessment for Different Mixing Rates of Admixtures
As shown in Table 9, eco-efficiency (KRW/year) was shown to increase at all concrete strengths as mixing rates of admixtures (GGBS) increased to 30% during concrete mix design. As representative examples, the eco-efficiency of 24 MPa and 40 MPa concretes was increased by 10%–23% in comparison to OPC when the mixing rates of admixtures increased from 10% to 30% [49].
As shown in Figure 8, the cost of 24 MPa concrete dropped from 362,000 (KRW/m3) to 274,000 (KRW/m3) according to increased mixing rates of admixtures due to reduced environmental impacts and manufacturing costs.
In addition, the service life of concrete based on carbonation was reduced from 89 (year/m3) to 79 (year/m3) according to increased mixing rates of admixtures. However, the rate of decrease in the service life was lower than the rate of decrease in the costs.
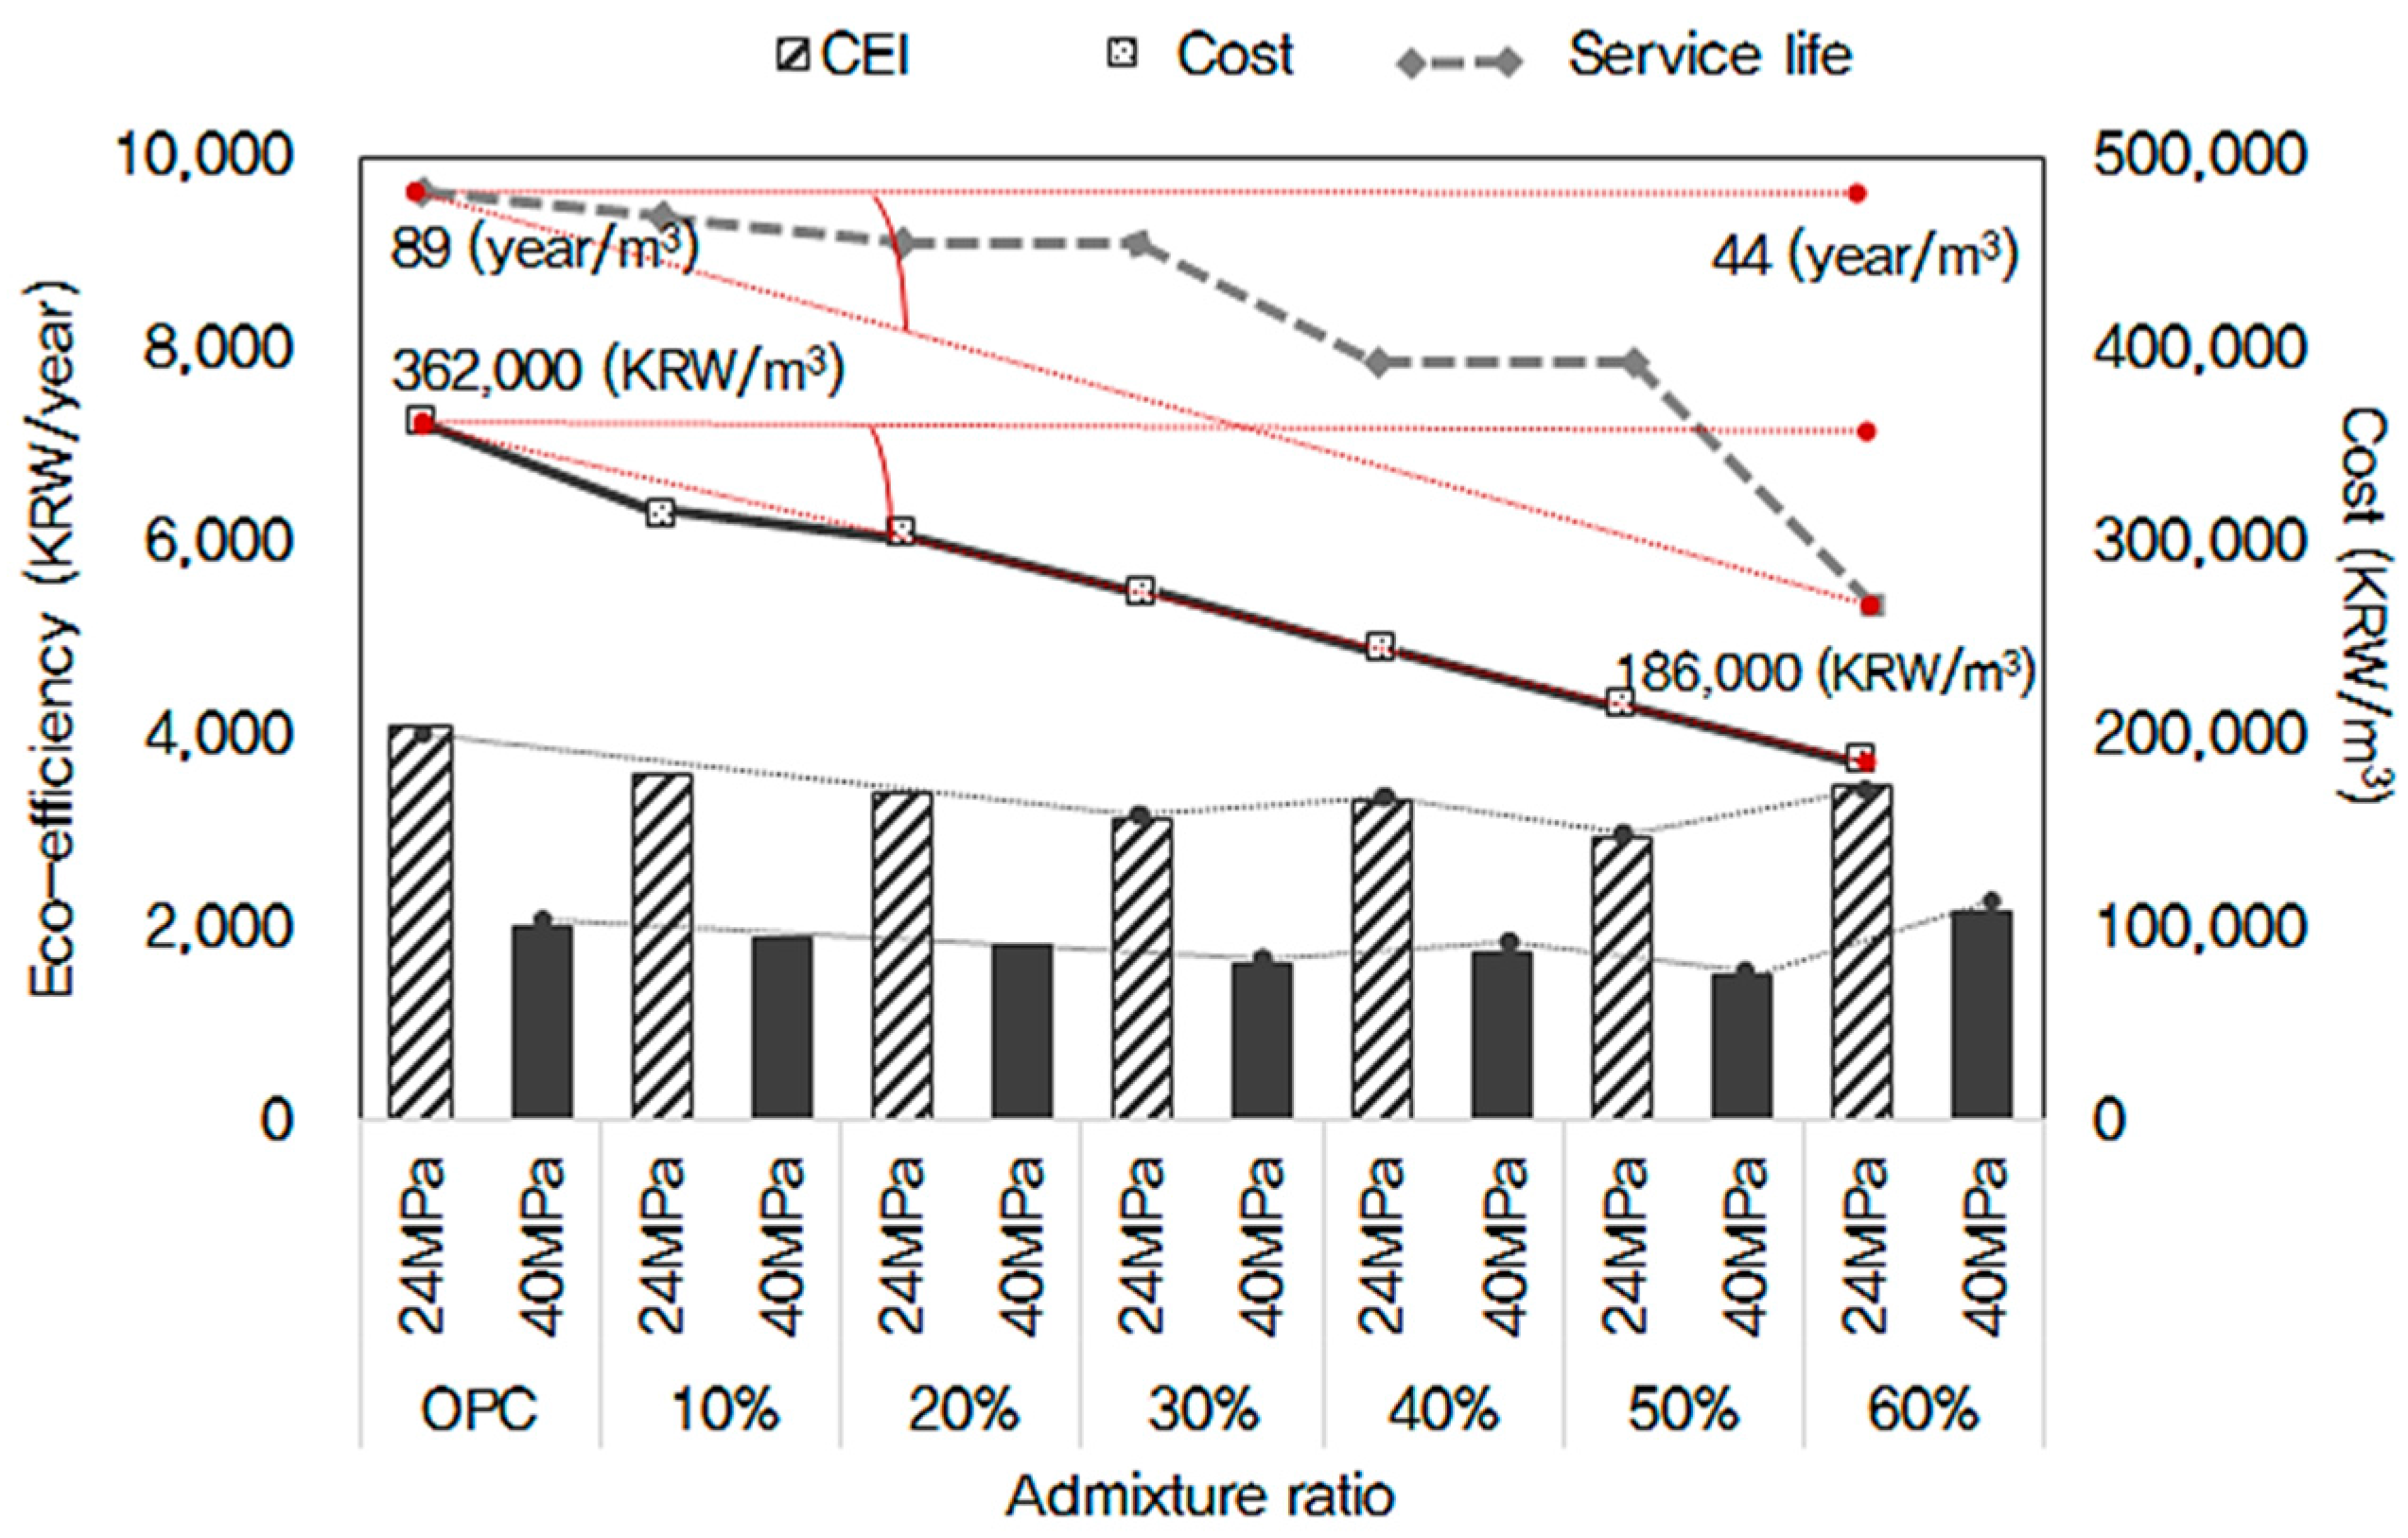
When mixing rates of admixtures were increased to 40% and 60%, however, the eco-efficiency of concrete samples dropped due to the rapid reduction of service life to 74 (year/m3) and 44 (year/m3), respectively (Figure 9).
This tendency was verified in 21 MPa, 27 MPa, 30 MPa, and 40 MPa concretes in addition to 24 MPa concrete.
5. Discussion and Study Limitations
Two limitations of this study are a need to expand the assessment factors for durability performance (service life) and to develop an eco-efficiency assessment method for high-strength concrete (above 40 MPa).
- (1)
- Expansion of assessment factors for durability performance (service life)
Among various deterioration phenomena, this study considers only neutralization as an assessment factor for durability performance. The assessment model for service life is based only on the neutralization of concrete, and the model fails to reflect durability performance for salt damage and freeze–thaw processes. Because the service life of concrete differs according to deterioration phenomena, differences may arise during eco-efficiency assessment of the same type of concrete. When assessment is conducted according to neutralization only, the service life of concrete is slightly reduced by the mixing of admixtures (GGBS). On the contrary, salt damage tends to show an increase in the service life of concrete due to the mixing of admixtures. Therefore, the measure of eco-efficiency will change according to differing service life values of concrete with the same mix design depending on the type of deterioration phenomenon. In future studies, the service life of concrete should be assessed according to various deterioration phenomena, such as neutralization and salt damage, simultaneously.
- (2)
- Development of an eco-efficiency assessment method for high-strength concrete (above 40 MPa)
The equation for calculating service life applied herein for the assessment of durability showed mostly effective results for concrete with a water-binder ratio between 40% and 60%. The equation was inappropriate for high-strength concrete with a water-binder ratio below 40%, however.
It is necessary to develop an equation that can calculate the service life of high-strength concrete against compound deterioration.
6. Conclusions
- (1)
- The concrete eco-efficiency index (CEI), an indicator for the eco-friendly concrete that accounts for environmental emissions, manufacturing costs, and durability performance in the production and use of concrete, is proposed as an advanced concept to assess the eco-friendliness of concrete.
- (2)
- An assessment method for concrete eco-efficiency is developed as a technique to ensure the manufacture of highly durable and eco-friendly concrete, while minimizing both the environmental load and manufacturing costs of concrete. The mechanism of eco-efficiency is based on the assessment results of environmental impact, manufacturing costs, and the service life of concrete.
- (3)
- According to our findings, eco-efficiency increased when the compressive strength of concrete increased from 21 MPa to 40 MPa. This is because the rate of increase in the service life due to increasing compressive strength is higher than the rate of increase in costs.
- (4)
- The eco-efficiency of 40 MPa concrete increased by about 50% in comparison to the eco-efficiency of 24 MPa concrete. While cost (comprising environmental and manufacturing costs) increased by about 21% from 318,000 (KRW/m3) to 387,000 (KRW/m3) according to the increase in compressive strength from 24 MPa to 40 MPa, the service life of concrete based on carbonation greatly increased from 68 (year/m3) to 190 (year/m3) between concretes with increasing compressive strength. Accordingly, eco-efficiency is found to increase with increasing compressive strength of concrete, because the rate of increase in the service life of concrete is larger than the rate of increase in costs.
- (5)
- Eco-efficiency (KRW/year) was shown to increase for all concrete strengths as mixing rates of admixtures (GGBS) increased to 30% during concrete mix design. As representative examples, the eco-efficiency of 24 MPa and 40 MPa concretes increased by 10 to 23% in comparison to OPC when the mixing rates of admixtures increased from 10% to 30%. However, when the mixing rates of admixtures were increased to 40% and 60%, the eco-efficiency dropped due to the rapid reduction of service life values to 74 (year/m3) and 44 (year/m3), respectively.
- (6)
- Environmental costs according to increasing compressive strengths of concrete were assessed, and the safeguard subjects and environmental impact categories responsible for the greatest part of overall environmental costs were analyzed. Environmental impact assessment according to the mixing of admixtures (GGBS) and recycled aggregate was performed to deduce a method of reducing environmental costs. In addition, manufacturing costs according to the compressive strength of concrete and the mixing of admixtures were assessed to analyze which material comprises the greatest proportion of manufacturing costs and to find a corresponding method of reduction.
Acknowledgments
This research was supported by Korea Institute of Civil Engineering and Building Technology (KICT) (No. 20160420-001).
Author Contributions
The paper was written by Taehyoung Kim and revised by Sungho Tae. Chang U. Chae and Kanghee Lee conducted the experimental and analytical work. All authors contributed to the analysis and approved the final manuscript.
Conflicts of Interest
The authors declare no conflict of interest.
Appendix
- (1)
- Example of environmental cost assessment for ordinary cement)= CO2 emission (kg-CO2) * Damage factor (DALY/kg-CO2)) * (Economic value (KRW/DARY)= 330 KRW (Korea Won)
- (2)
- Example of eco-efficiency assessment for concrete)
- (a)
- Cost = (Environmental Cost + Manufacture Cost)
- *
- Environmental cost
- *
- (b)
- Service life = 54 year (using Equations (11) and (12))
- (c)
- Eco-efficiency = (Cost/Service life) = (35260/54) = 652 (KRW/year)
References
- Ministry of Environment. The UNFCCC COP21 for a New Climate Regime to Take Place in Paris; Ministry of Environment: Paris, France, 2015. [Google Scholar]
- Roh, S.J.; Tae, S.H.; Shin, S.W.; Woo, J.H. A Study on the Comparison of Characterization of Environmental Impact of Major Building Material for Building Life Cycle Assessment. Archit. Inst. Korea 2013, 29, 93–100. [Google Scholar]
- Taehyoung, K.; Sungho, T.; Seungjun, R.; Rakhyun, K. Life Cycle Assessment for Carbon Emission Impact Analysis of Concrete Mixing Ground Granulated Blast-furnace Slag(GGBS). Archit. Inst. Korea 2013, 29, 75–84. [Google Scholar]
- Taehyoung, K.; Sungho, T.; KRWyoung, C.; Keunhyuk, Y. Development of the Eco-efficiency evaluation method for Concrete. Korea Concr. Inst. 2015, 35, 437–438. [Google Scholar]
- WBCSD. Eco-Efficiency: Creating More Value with Less Impact; WBCSD Research Report; WBCSD: Geneva, Switzerland, 2000. [Google Scholar]
- ISO 14045. Environmental Management-Eco-Efficiency Assessment of Product Systems-Principles, Requirements and Guidelines; ISO: Geneva, Switzerland, 2012. [Google Scholar]
- Ministry of Environment. Development & Diffusion of Eco-Efficiency Indicators and Software; Ministry of Environment: Sejong-si, Korea, 2007. [Google Scholar]
- Pacheco-Torgal, F. Introduction to biopolymers and biotech admixtures for eco-efficient construction materials. In Biopolymers and Biotech Admixtures for Eco-Efficient Construction Materials; Woodhead Publishing: Cambridge, UK, 2016; pp. 1–10. [Google Scholar]
- Zuoren, N. Chapter 3—Eco-Materials and Life-Cycle Assessment. In Green and Sustainable Manufacturing of Advanced Material; Elsevier: Amsterdam, The Netherlands, 2016; pp. 31–76. [Google Scholar]
- Agustín, P.G.; Arianna, G.V.; Guillermo, G.P. Building’s eco-efficiency improvements based on reinforced concrete multilayer structural panels. Energy Build. 2014, 85, 1–11. [Google Scholar]
- Jiaying, T.; Xianguo, W. Eco-footprint-based life-cycle eco-efficiency assessment of building projects. Ecol. Indic. 2014, 39, 160–168. [Google Scholar]
- Lia, D.; Zhua, J.; Huib, E.C.M.; Leungb, B.Y.P.; Qiming Li, Q. An emergy analysis-based methodology for eco-efficiency evaluation of building manufacturing. Ecol. Indic. 2011, 11, 1419–1425. [Google Scholar] [CrossRef]
- Taehyoung, K.; Sungho, T. Development of Environmental Performance Index in Concrete. Korea Concr. Inst. 2014, 26, 651–652. [Google Scholar]
- Taehyoung, K.; Sungho, T.; Sungjoon, S.; George, F.; Keunhyek, Y. An optimization System for Concrete Life Cycle Cost and Related CO2 Emissions. Sustainability 2016, 8, 361. [Google Scholar]
- Korea Environmental Industry Technology Institute. Development of Integrated Evaluation Technology on Product Value for Dissemination of Environmentally Preferable Products; Korea Environmental Industry Technology Institute (KEITI): Seoul, Korea, 2009. [Google Scholar]
- Korea Price Information. Available online: http://www.kpi.or.kr/ (accessed on 14 March 2016).
- Taehyoung, K.; Sungho, T.; Changu, C. Analysis of Environmental Impact for Concrete Using LCA by Varying the Recycling Components, the Compressive Strength and the Admixture Material Mixing. Sustainability 2016, 8, 361. [Google Scholar]
- Organización Internacional de Normalización. ISO 14044: Life Cycle Assessment-Requirements and Guidelines; ISO: Geneva, Switzerland, 2006. [Google Scholar]
- MOLIT. National Database for Environmental Information of Building Products; Ministry of Land, Transport and Maritime Affairs of the Korean Government: Sejong-si, Korea, 2008. [Google Scholar]
- National Life Cycle Index Database Information Network. Available online: http://www.edp.or.kr (accessed on 11 August 2015).
- The Ecoinvent Database. Available online: http://www.ecoinvent.org/database (accessed on 11 August 2015).
- IPCC Guidelines for National Greenhouse Gas Inventories, 2006. Available online: http://www.ipcc-nggip.iges.or.jp/public/2006gl/ (accessed on 13 April 2016).
- Guinee, J.B. Development of a Methodology for the Environmental Life Cycle Assessment of Products: With a Case Study on Margarines. Ph.D. Thesis, Leiden University, Leiden, The Netherlands, 1995. [Google Scholar]
- Heijungs, R.; Guinée, J.B.; Huppes, G.; Lamkreijer, R.M.; Udo de Haes, H.A.; Wegener Sleeswijk, A.; Ansems, A.M.M.; Eggels, P.G.; van Duin, R.; de Goede, H.P. Environmental Life Cycle Assessment of Products. Guide (Part1) and Background (Part 2); CML Leiden University: Leiden, The Netherlands, 1992. [Google Scholar]
- World Metrological Organization (WMO). Scientific Assessment of Ozone Depletion: Global Ozone Research and Monitoring Project; WHO: Geneva, Switzerland, 1991; p. 25. [Google Scholar]
- Derwent, R.G.; Jenkin, M.E.; Saunders, S.M.; Piling, M.J. Photochemical ozone creation potentials for organic compounds in Northwest Europe calculated with a master chemical mechanism. Atmos. Environ. 1998, 32, 2429–2441. [Google Scholar] [CrossRef]
- Jenkin, M.; Hayman, G. Photochemical Ozone Creation Potentials for oxygenated volatile organic compounds: Sensitivity to variation is in kinetic and mechanistic parameters. Atmos. Environ. 1999, 33, 1275–1293. [Google Scholar] [CrossRef]
- Goedkoop, M.; Spriensma, R. The Eco-Indicator 99-A Damaged Oriented Method for Life Cycle Impact Assessment; PRé: Amerfoort, The Netherlands, 1999. [Google Scholar]
- Pilju, P.; Mannyoung, K. The Development of Korean Life Cycle Impact Assessment Index Based on a Damage Oriented Modeling; Korea Environmental Industry & Technology Institute: Seoul, Korea, 2010; pp. 499–508. [Google Scholar]
- Itsubo, N.; Inaba, A. A new LCIA Method: LIME Has Been Completed. Int. J. Life Cycle Assess. 2003, 8, 305. [Google Scholar] [CrossRef]
- Ko, J.Y. Generation of DALYs for the Analysis of Damage to Human Health. Master’s Thesis, Konkuk University, Seoul, Korea, 2005. [Google Scholar]
- Murray, C.J.L. Quantifying the Burden of Disease, the Technical Basis for Disability Adjusted Life Years. Bull. World Health Organ. 1994, 72, 429–445. [Google Scholar] [PubMed]
- Lane, J.L. Life Cycle Impact Assessment—Chapter 4.6 Endpoint Assessment Methodologies for LCA; Wiley: Hoboken, NJ, USA, 2015; pp. 64–65. [Google Scholar]
- Jonathan, E.M.B.; Leon, A.B.; Thomas, M.B.; Stuart, H.M.B.; Janice, S.C.; Zoe, C.; Craig, H.T.; Michael, H.; Georgina, M.M.; Sue, A.M.; et al. 2004 IUCN Red List of Threatened Species: A Global Species Assessment; IUCN: Gland, Switzerland; Cambridge, UK, 2004. [Google Scholar]
- Robles Gil, P.; Pérez Gil, R.; Bolívar, A.; Bräutigam, A.; Jenkins, M.; Rabb, G.; Ceballos, G.; Ehrlich, P.; Dublin, H.T. The Red Book: The Extinction Crisis Face to Face. Available online: https://portals.iucn.org/library/node/7965 (accessed on 17 July 2016).
- Itsubo, N.; Inaba, A. Lifecycle Impact Assessment Method Based on Endpoint Modeling (LIME2)—Chapter 2. Characterization and Damage Evaluation Methods. Available online: http://lca-forum.org/english/pdf/No15_Chapter2.1-2.3.pdf (accessed on 16 July 2016).
- Architectural Institute of Japan (AIJ). Available online: https://www.aij.or.jp/ (accessed on 14 March 2016).
- Kishitany, K. Consideration on durability of reinforced concrete. Trans. Arch. Inst. Jpn. 1963, 65, 9–16. [Google Scholar]
- Hamada, M. Carbonation of concrete. In Proceedings of the Fifth International Symposium on the Chemistry of Cement, Tokyo, Japan, 31 December 1969; Volume 3, pp. 343–384.
- Shirayama, K. Research activities and administrative measures on durability of buildings. The state of the art in Japan. Mater. Constr. Mater. Struct. 1985, 18, 215–221. [Google Scholar] [CrossRef]
- Korea Concrete Institute (KCI). Available online: http://www.kci.or.kr/eng/introduce1.asp/ (accessed on 16 March 2016).
- Japan Society of Civil Engineers (JSCE). Available online: http://www.jsce-int.org/ (accessed on 16 March 2016).
- American Concrete Institute (ACI). Available online: https://www.concrete.org/ (accessed on 16 March 2016).
- Architectural Institute of Japan. Japanese Architectural Standard Specification (JASS); Architectural Institute of Japan: Tokyo, Japan, 2012. [Google Scholar]
- Ministry of Land, Infrastructure and Transport. Green Standard for Energy and Environmental Design (G-SEED); Ministry of Land, Infrastructure and Transport: Sejong-si, Korea, 2013. [Google Scholar]
- Ministry of Land, Infrastructure and Transport. Korean Building Code (KBC); Ministry of Land, Infrastructure and Transport: Sejong-si, Korea, 2012. [Google Scholar]
- Korea Concrete Institute. Concrete Structure Design Standard; Korea Concrete Institute: Seoul, Korea, 2012. [Google Scholar]
- Junghoon, P.; Sungho, T.; Taehyoung, K. Life Cycle CO2 Assessment of Concrete by compressive strength on Construction site in Korea. Renew. Sustain. Energy Rev. 2012, 16, 2940–2946. [Google Scholar]
- Taehyoung, K.; Sungho, T.; Seongjun, R. Assessment of the CO2 emission and cost reduction performance of a low-carbon-emission concrete mix design using an optimal mix design system. Renew. Sustain. Energy Rev. 2013, 25, 729–741. [Google Scholar]
Figure 1.
Environmental load considering environmental impact and durability aspect.

Figure 2.
Research vision.
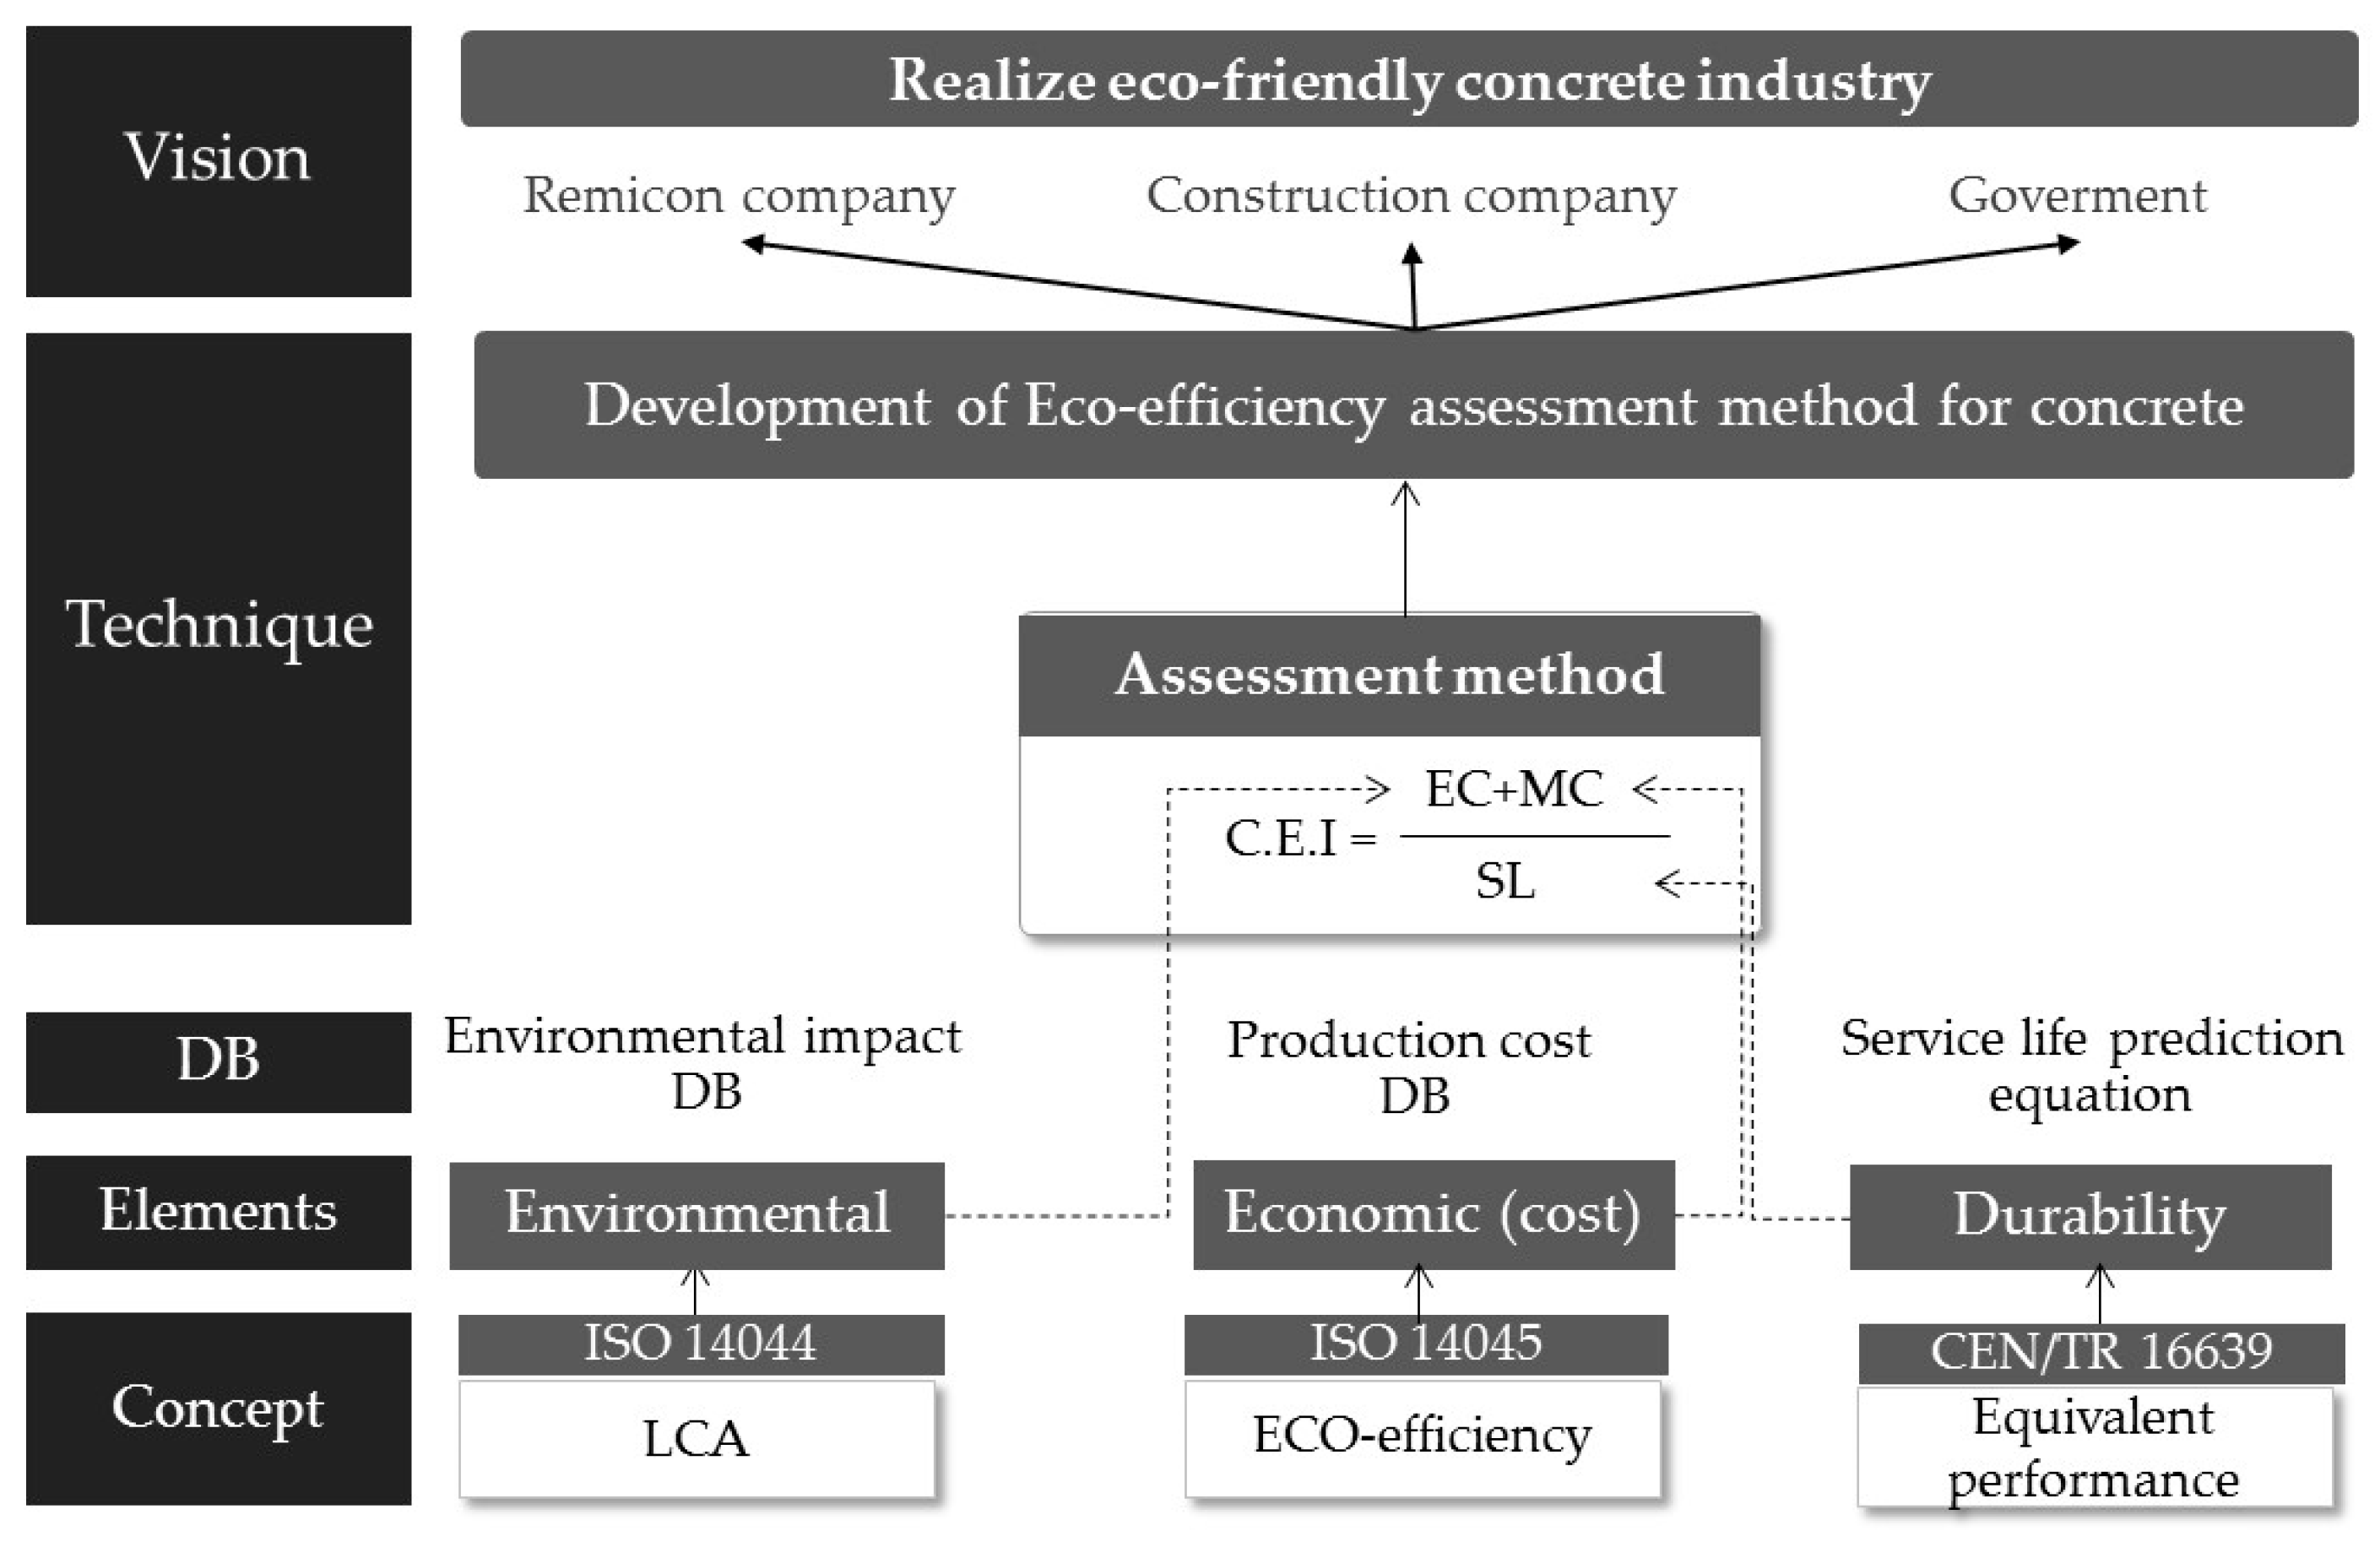
Figure 3.
Process for the assessment of the eco-efficiency of concrete

Figure 4.
Eco-efficiency concept for concrete.
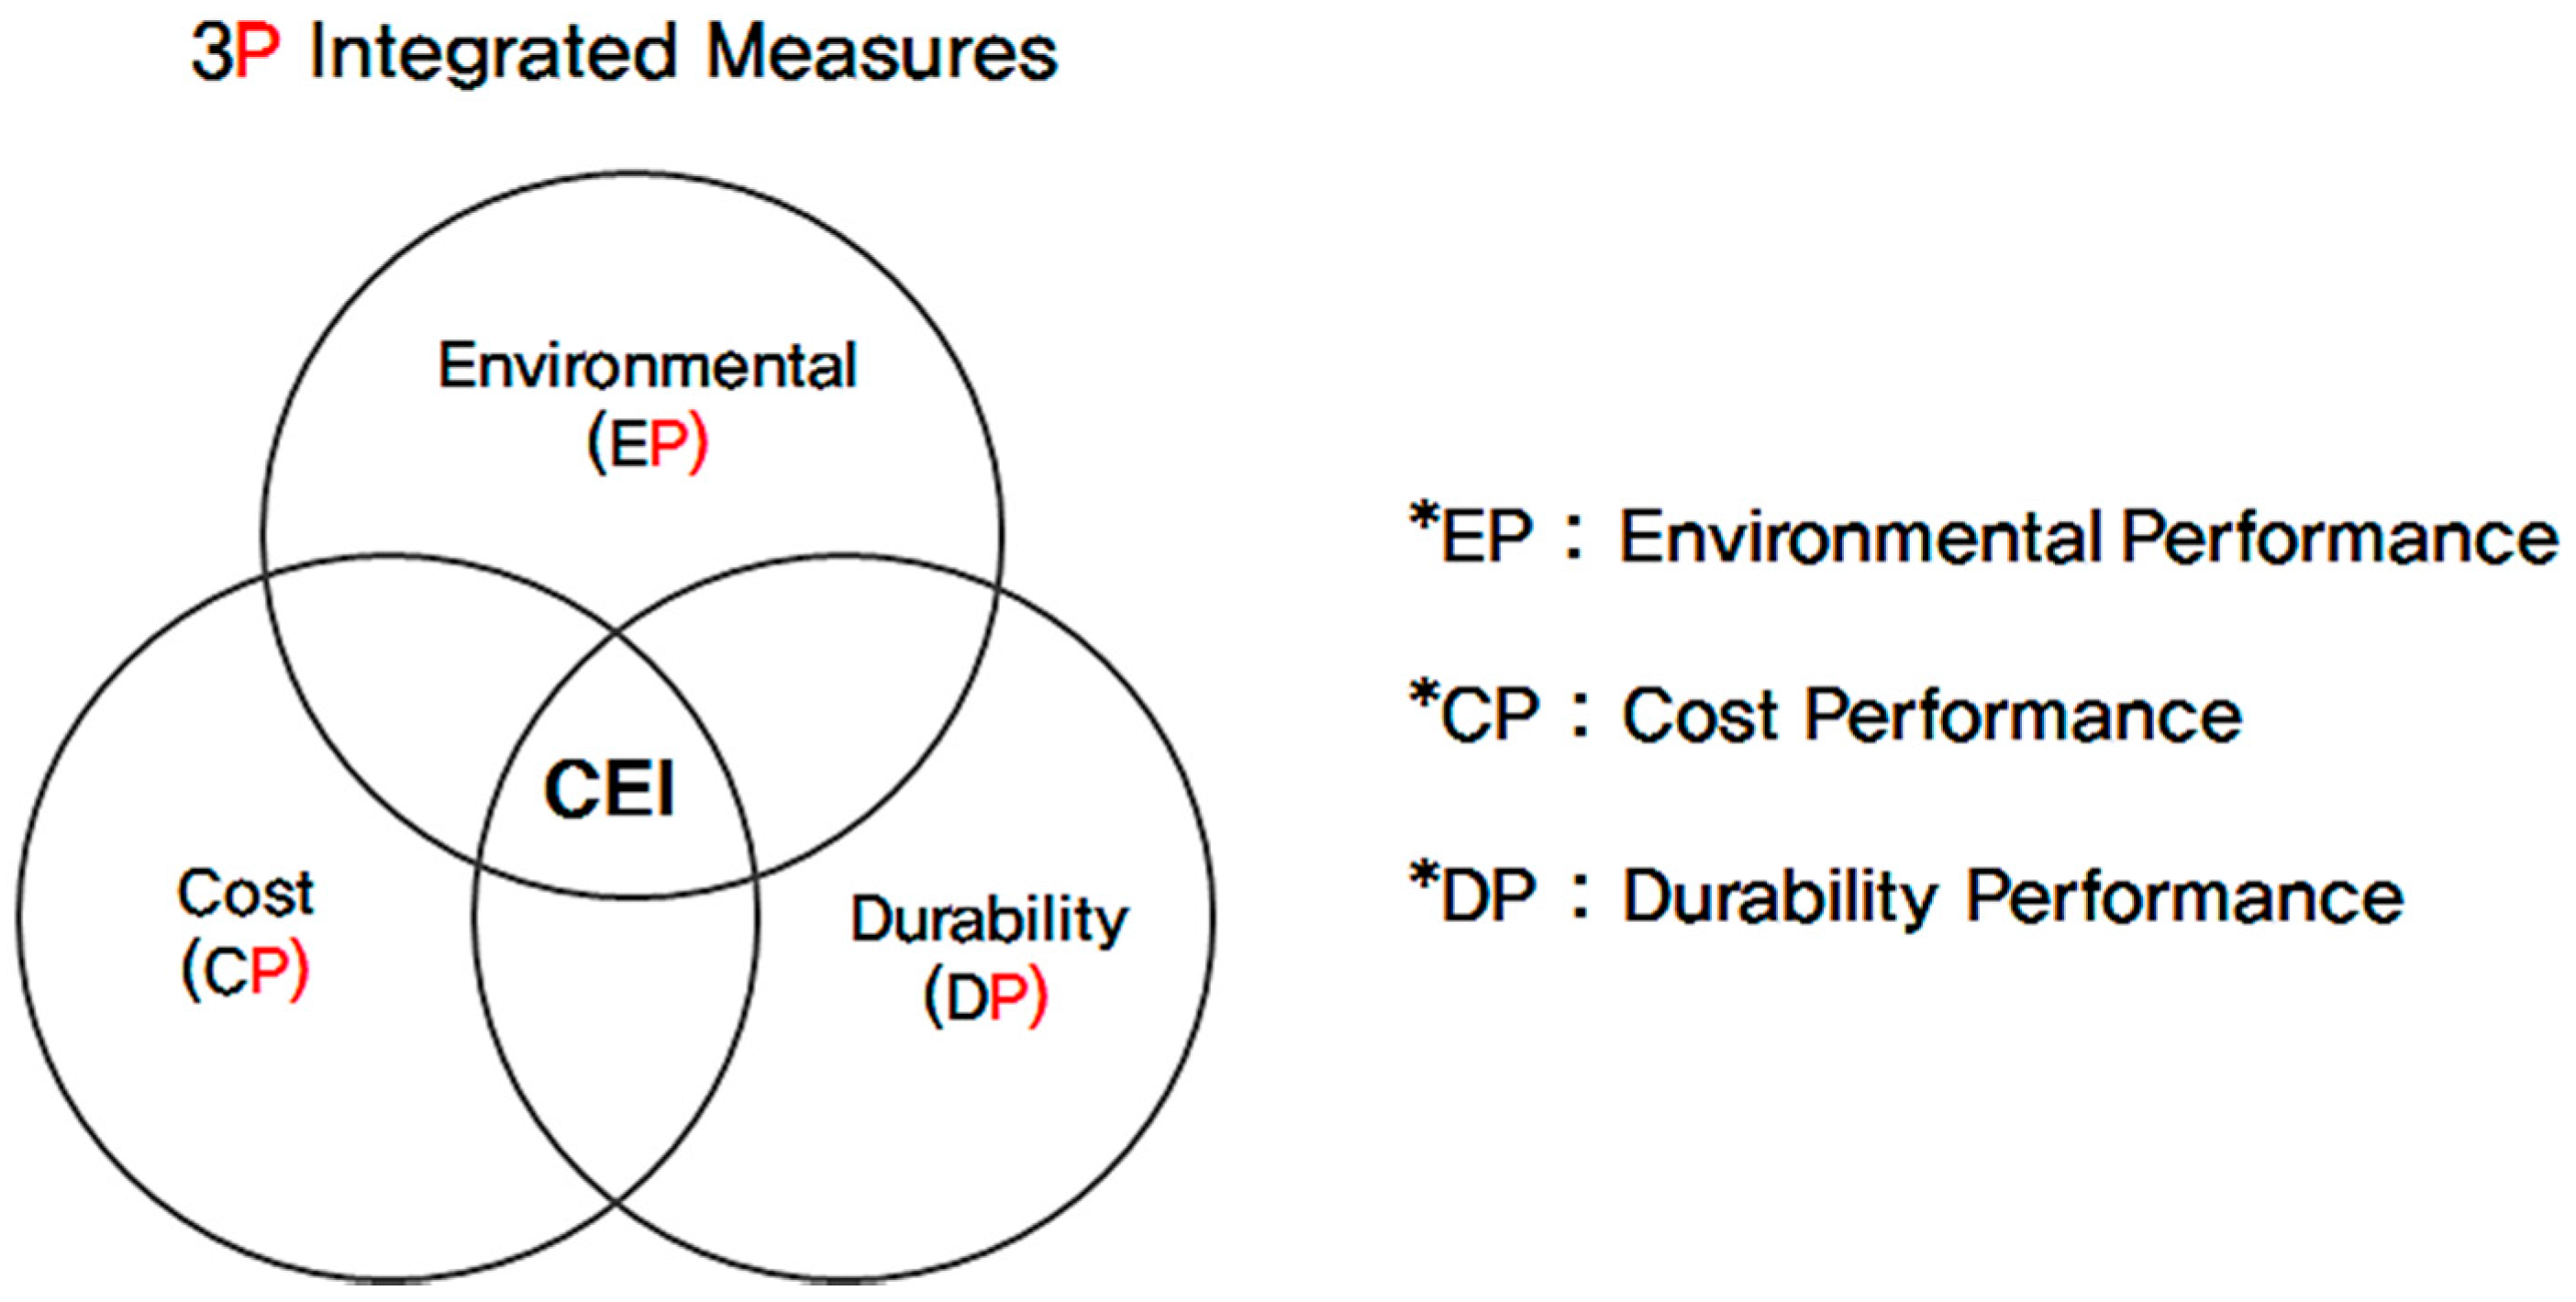
Figure 5.
Environmental impacts that occur during the product lifecycle of concrete.

Figure 6.
Assessment process for the environmental costs of concrete.
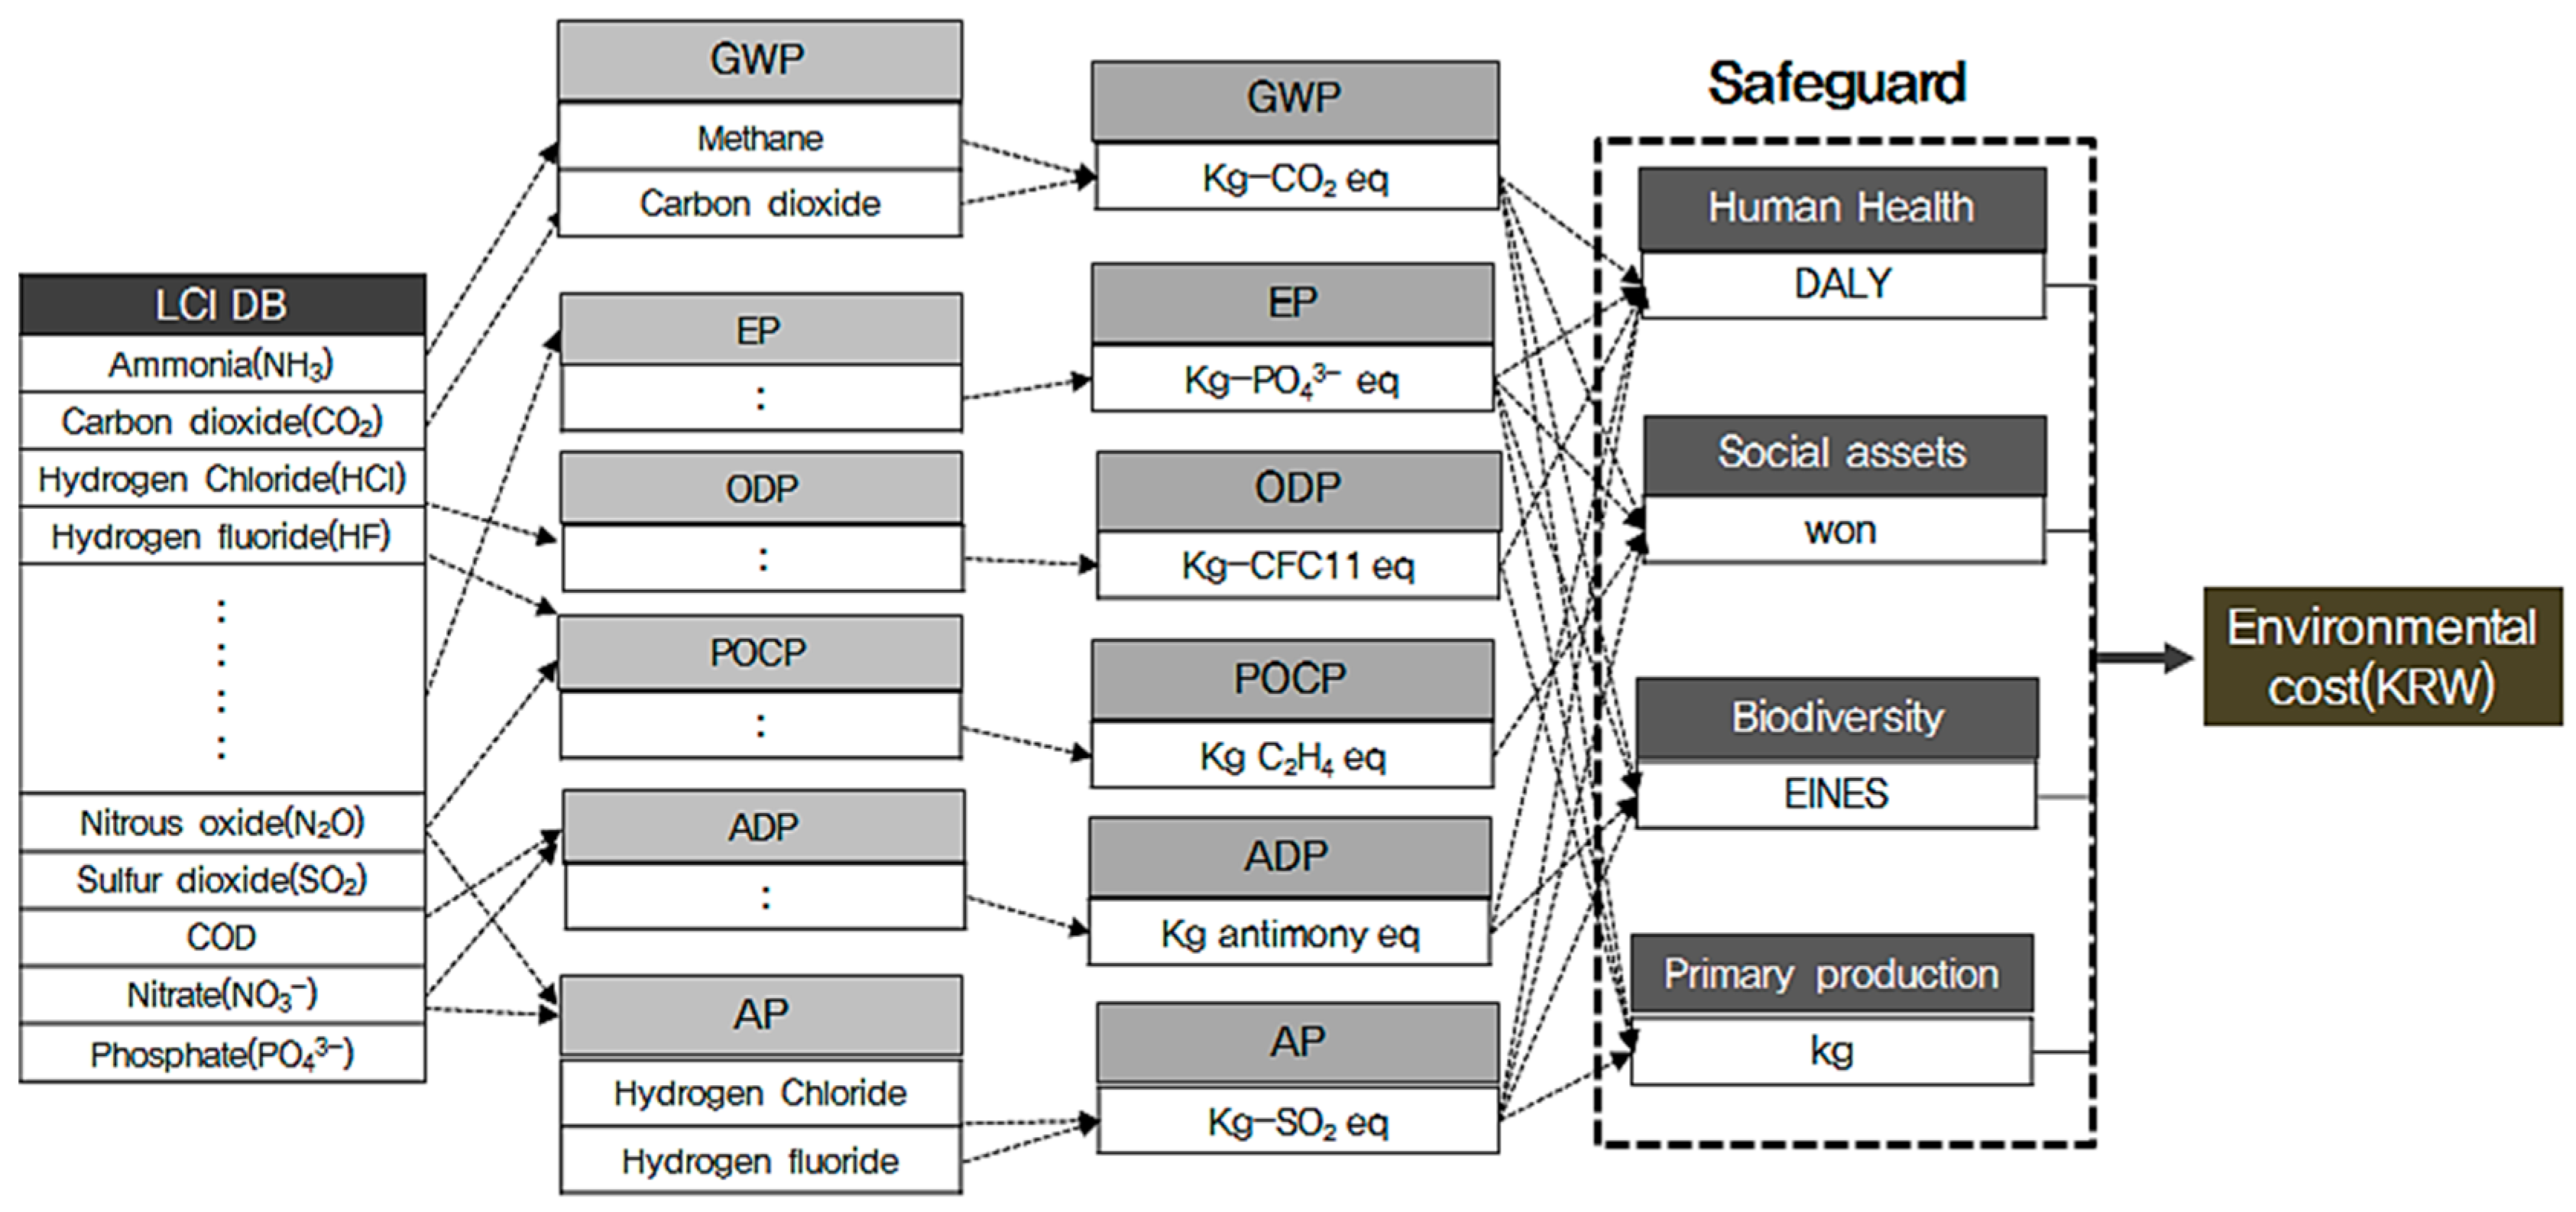
Figure 7.
Eco-efficiency according to increasing compressive strength.

Figure 8.
Analysis of eco-efficiency by admixture ratio (30%).
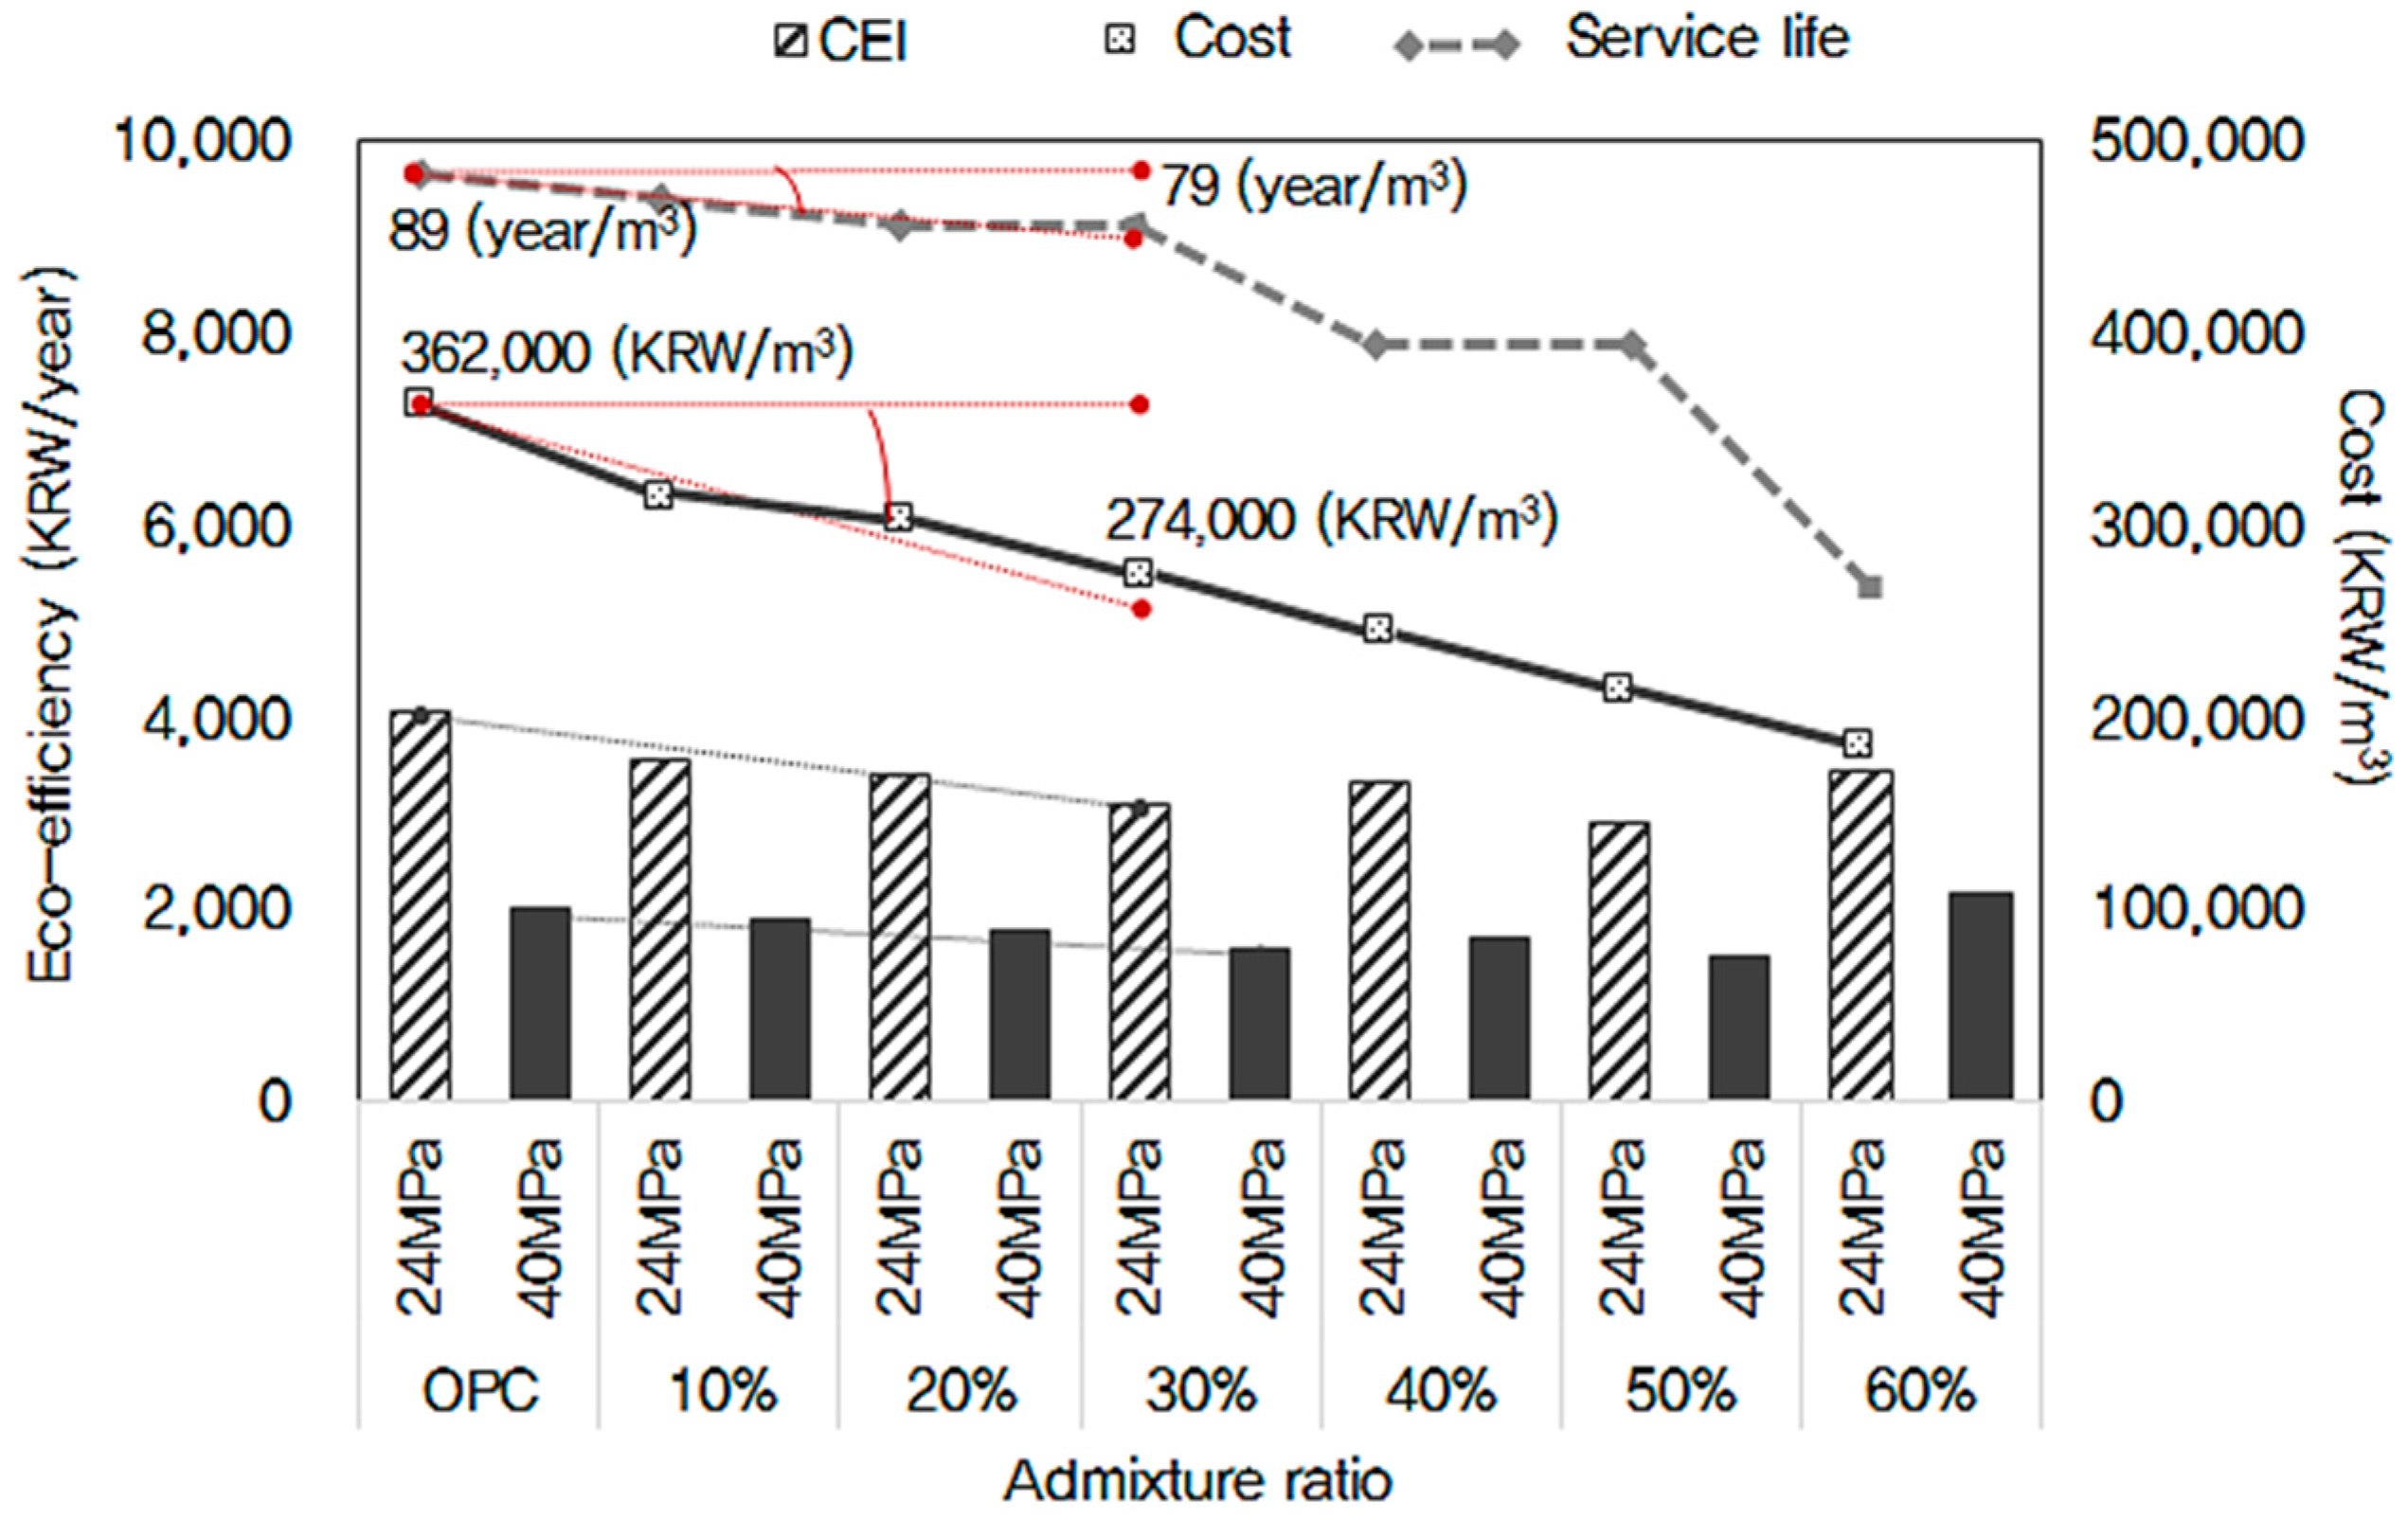
Figure 9.
Analysis of eco-efficiency by admixture ratio (60%).


| Category | Environmental Impact | Economic Value |
|---|---|---|
| Element type | Unit elements (resources, water, energy, waste) | Output |
| General elements (comprehensive environmental impact) | Sales | |
| Productivity | ||
| ROE, ROI | ||
| Evaluation boundary | Gate-to-gate | |
| Cradle-to-gate | ||
| Cradle-to-grave | ||
| Safeguard | Damage Indicators | ||
|---|---|---|---|
| Safeguard | Human | Human Health | DALY * |
| Social assets | Monetary value (KRW) | ||
| Ecosystem | Biodiversity | EINES ** | |
| Primary production | NPP *** | ||
| Final evaluation result | Monetary value (KRW) | ||
* DALY: disability-adjusted life year; ** EINES: expected increase in the number of extinct species; *** NPP: net primary production.
| GWP | Human Health (DALY/kg) | Social Assets (KRW/kg) | Biodiversity (EINES/kg) | Primary Production (kg/kg) |
|---|---|---|---|---|
| Ordinary Portland Cement | 1.17 × 10⁻⁷ | 2.58 | 0 | 0 |
| Coarse aggregate | 5.45 × 10⁻⁹ | 1.20 ×10⁻¹ | 0 | 0 |
| Blast furnace slag | 3.81 × 10⁻⁹ | 8.43 × 10⁻² | 0 | 0 |
| Electric | 7.91 × 10⁻⁹ | 1.75 × 10⁻¹ | 0 | 0 |
| Diesel | 4.71 × 10⁻⁵ | 1.04 × 10³ | 0 | 0 |
| ADP | Human Health (DALY/kg) | Social Assets (KRW/kg) | Biodiversity (EINES/kg) | Primary Production (kg/kg) |
|---|---|---|---|---|
| Ordinary Portland Cement | 0 | 2.72 × 10⁻² | 1.71 × 10⁻¹⁶ | 2.93 × 10⁻⁴ |
| Coarse aggregate | 0 | 2.58 × 10⁻¹ | 1.62 × 10⁻¹⁵ | 2.78 × 10⁻³ |
| Blast furnace slag | 0 | 3.17 × 10⁻³ | 1.98 × 10⁻¹⁷ | 3.41 × 10⁻⁵ |
| Electric | 0 | 6.26 × 10⁻³ | 3.92 × 10⁻¹⁷ | 6.75 × 10⁻⁵ |
| Diesel | 0 | 3.30 × 10² | 2.07 × 10⁻¹² | 3.55 |
Table 5.
Economic value of safeguard [34].
| Safeguard | Unit | Economic Value (KRW/unit) |
|---|---|---|
| Human health | DALY | 2.82 × 10⁷ |
| Social assets | One thousand KRW | 1.00 × 10³ |
| Biodiversity | Species | 5.69 × 10⁵ |
| Primary production | Ton | 4.93 × 10⁴ |
| Substance | Unit Price | Unit | Reference |
|---|---|---|---|
| Ordinary Portland Cement | 3410 KRW | 40 kg | National information |
| Aggregate | 13,000 KRW | ton | National information |
| Electric | 110 KRW | Kwh | National information |
| Diesel | 1700 KRW | L | National information |
| Prediction Formula | Coating Thickness | |
|---|---|---|
| 30 mm | 40 mm | |
| Kishitani [38] | 42 years | 76 years |
| Hamada [39] | 60 years | 109 years |
| Shirayama [40] | 43 years | 78 years |
| KCI [41], JSCE [42] | 63 years | 114 years |
| This study (AIJ) | 43 years | 87 years |
| Strength (MPa) | Eco-Efficiency (KRW/year) | Cost (KRW/m3) | Service Life (year/m3) |
|---|---|---|---|
| 21 | 5700 | 308,000 | 54 |
| 24 | 4700 | 318,000 | 68 |
| 27 | 3800 | 333,000 | 89 |
| 30 | 3300 | 347,000 | 110 |
| 40 | 2200 | 387,000 | 190 |
| Strength (MPa) | Admixture Ratio | ||||||
|---|---|---|---|---|---|---|---|
| 0% | 10% | 20% | 30% | 40% | 50% | 60% | |
| 21 | 5157 | 5092 | 4636 | 4195 | 4503 | 3973 | 5739 |
| 24 | 4066 | 3564 | 3407 | 3101 | 3324 | 2926 | 3450 |
| 27 | 3874 | 3860 | 3527 | 3179 | 3398 | 2980 | 4272 |
| 30 | 2801 | 2512 | 2401 | 2168 | 2322 | 2043 | 2938 |
| 40 | 2014 | 1900 | 1792 | 1614 | 1724 | 1510 | 2162 |
© 2016 by the authors; licensee MDPI, Basel, Switzerland. This article is an open access article distributed under the terms and conditions of the Creative Commons Attribution (CC-BY) license (http://creativecommons.org/licenses/by/4.0/).
Share and Cite
MDPI and ACS Style
Kim, T.; Tae, S.; Chae, C.U.; Lee, K. Proposal for the Evaluation of Eco-Efficient Concrete. Sustainability 2016, 8, 705. https://doi.org/10.3390/su8080705
AMA Style
Kim T, Tae S, Chae CU, Lee K. Proposal for the Evaluation of Eco-Efficient Concrete. Sustainability. 2016; 8(8):705. https://doi.org/10.3390/su8080705
Chicago/Turabian StyleKim, Taehyoung, Sungho Tae, Chang U. Chae, and Kanghee Lee. 2016. "Proposal for the Evaluation of Eco-Efficient Concrete" Sustainability 8, no. 8: 705. https://doi.org/10.3390/su8080705
Note that from the first issue of 2016, this journal uses article numbers instead of page numbers. See further details here.