Article

Geographical Variation of Climate Change Impact on Rice Yield in the Rice-Cropping Areas of Northeast China during 1980–2008

1
Department of Land Resources and Environment Studies, School of Geography and Planning, Sun Yat-Sen University, Guangzhou 510275, China
2
Key Laboratory of Agri-Informatics, Ministry of Agriculture, Institute of Agricultural Resources and Regional Planning, Chinese Academy of Agricultural Sciences, Beijing 100081, China
*
Author to whom correspondence should be addressed.
Sustainability 2016, 8(7), 670; https://doi.org/10.3390/su8070670
Submission received: 14 March 2016 / Revised: 18 June 2016 / Accepted: 6 July 2016 / Published: 14 July 2016
(This article belongs to the Section Economic and Business Aspects of Sustainability)

Abstract

:
Northeast China (NEC) is one of China’s major rice production areas and has experienced obvious climate warming over the past three decades, similar to other mid- to high-latitude regions in the Northern Hemisphere. The present study investigates the temporal and spatial impacts of climate warming on rice yield in mid–high latitude regions. In this study, two time series datasets of rice yield and climate records in the NEC, including 178 county sites and 105 climate stations and covering the period from 1980 to 2008, were compiled. From these data, the responses of rice yield to the rice-growing season temperature (GST), growing degree days (GDD), and precipitation (GSP) were estimated using a regression model. The results indicate that rice yield benefits from climate warming in the NEC. GST positively impacted rice yield in 64.6% of the counties, with an increase of approximately 3.65%; GDD positively impacted yield in 64% of the counties, an increase of approximately 3.2%; and GSP negatively impacted rice yield in 68% of the counties, with a decrease of approximately −2.3%. Spatial variation was observed in the climate-rice yield relationships. The statistical relationships of GST and GDD with rice yield were significantly and positively correlated with latitude, longitude, and altitude, while that of GSP and rice yield was significantly and negatively correlated with latitude and longitude and showed a nonsignificant positive correlation with altitude. In summary, climate warming has significantly increased rice yield over the last three decades in the region north of 42°N, east of 122.4°E, and at an elevation of 134–473 m, which covers the majority of the rice-growing areas in the NEC.

1. Introduction

The effective adaptation of agriculture to climate change in high-latitude regions such as Northeast China (NEC) requires greater concern, especially regarding crop response mechanisms to local climate trends and variability [1,2]. A number of studies have shown that rice responses to climate trends exhibit spatial variation [2,3], but these studies failed to determine to what degree geography impacted the climate-rice yield relationship, leading to uncertainty in how crop yields have been affected by climate change in middle- to high-latitude regions. High-latitude regions in the Northern Hemisphere have experienced significant climate warming, and crop productivity in these areas may benefit from warming trends [4]. The spatial patterns of the growing season climate and their impacts on rice yield at the county scale are important for understanding the vulnerability and adaptation of regional agricultural practices for rice planting in NEC, which is one of China’s most climate-sensitive areas.
The relationships between long-term crop yield and climate trends can help us more accurately assess climate impacts on crop yields. Statistical models and crop growth models are two types of models often used to assess these impacts [5]. Crop growth models consider crop growth as a function of dynamic, nonlinear interactions between weather, soil water and nutrient dynamics, management, and crop physiology [6]. Such models accurately reflect crop growth mechanisms and fully consider the impacts of climate factors; however, these models are more sensitive to their parameters and subject to error on larger scales [7]. Conversely, statistical models do not consider growth processes but instead employ statistical relationships between historical crop yields and climate trends; these models are easy to use and suitable for scales from site to global. However, statistical models often fail to consider the contributions of adaptation, technological advances, cultivar replacement, and farm management to crop yield [8]. Three types of regression model are used in statistical analysis: time series, cross-sectional, and panel regression models [8]. In statistical modeling, the first-difference method has been applied to eliminate the effect of technological changes, and linear [9,10,11] and nonlinear regression models [12,13] have been used to evaluate the responses of crop yield to climate trends in different scales and regions.
Climate-yield relationships are scale-dependent and exhibit spatial variation, which is closely tied to geographical factors [2]. Grid- and province-scale studies in China have shown that the climate-rice yield relationship exhibits opposite trends in South and Northeast China [3]. Many studies have indicated that geographical effects play a vital role in the climate-rice yield relationship. Previous researchers have found that increased nighttime temperatures due to climate warming have negative effects on rice yield in tropical regions [14], but others have found that site data from tropical and subtropical regions show significant differences [15], leading to contradictory conclusions. Thus, geographical effects are important in investigating the spatial pattern of the climate-rice yield relationship at the regional or global scale to reduce the uncertainty in impact assessments of climate change.
NEC is one of the major single rice-cropping system areas in China and represents the highest-latitude area in which rice is planted worldwide. The region has also experienced the world’s most significant climate warming, and rice planting in the area has expanded very rapidly over the past three decades [16] with an increase from 8.49 × 10⁵ ha in 1980 to 4.51 × 10⁶ ha in 2014. NEC has undoubtedly played a vital role in securing food production in China, and it is a region very suitable to investigate the climate-rice yield relationship [17]. Despite the preponderance of studies concerning climate trends and rice yield at multiple scales, research is still needed to assess the geographical effects on the climate-rice yield relationship and the impacts of climate at high latitudes. The objectives of this study are to analyze (1) the impact of climate trends on rice yield at the county scale in NEC; (2) the impact of climate trends on rice yield at the regional scale in NEC; (3) the impact of geographical effects on climate-rice yield statistical relationships at the county scale.

2. Data and Methods

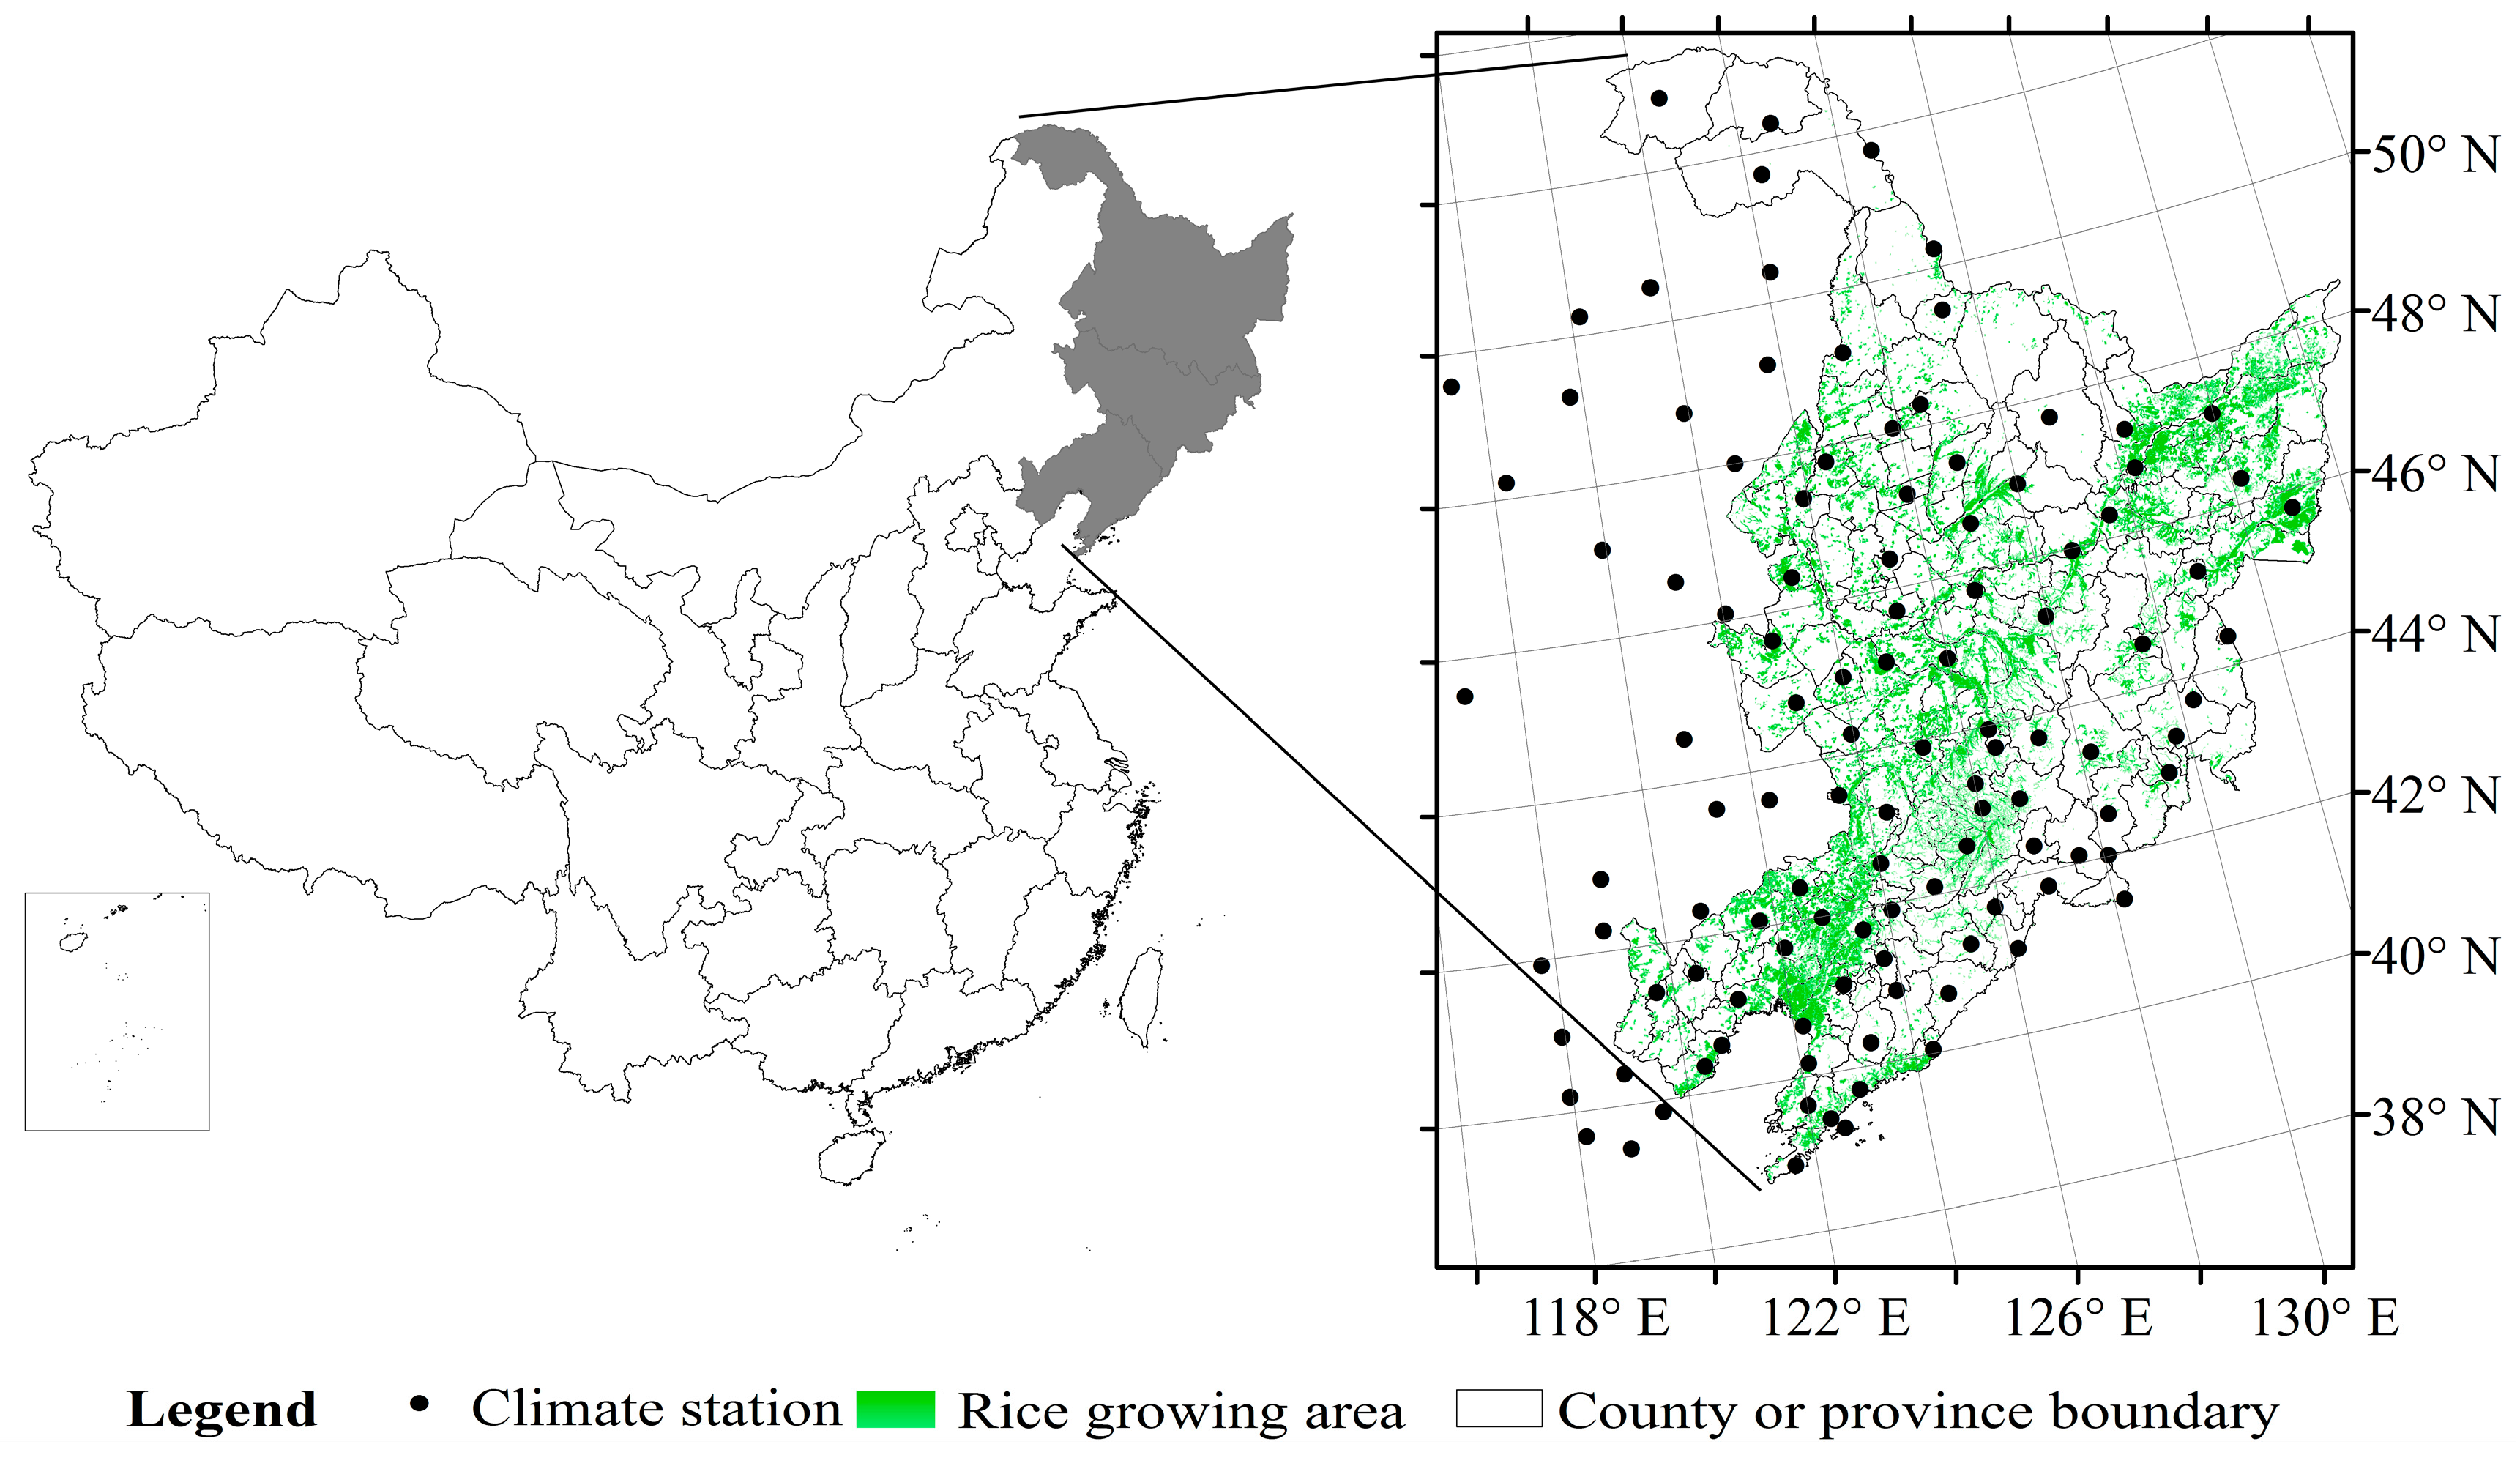
2.1. Site Description

The study area consists of three provinces and 181 counties in NEC containing 4.51 × 10⁶ ha of rice-sown area (Figure 1). The centroid of the counties’ latitudes of the study region is among 39.1°N–50.2°N and the longitude is between 119.3°E–134.3°E; the average altitude of the rice plant area in 178 counties ranges from 2 to 1093 m. The region sits in a cold temperature zone with a humid and semihumid climate. The seasons consist of cold, dry winters and warm, short summers. The average annual accumulated temperature above zero is 2500 °C–4000 °C, and the frost-free period normally begins on 28 March and ends on 2 October. Annual precipitation reaches 400–1000 mm, 80% of which falls from May to September. This climate, combined with good soil quality, makes NEC the main single rice-producing area in the country. The rice-growing season in the area begins in mid-April and ends in early October [17].

2.2. Rice Yield and Climate Data

Time series statistics of rice sown area and yield in the 178 counties of NEC (not including Huma, Tahe, and Mohe counties which do not have long-term rice planting areas) were obtained from China’s annual agricultural database, provided by the Ministry of Agriculture, China, from 1980 to 2008 [18,19,20]. Meteorological data derived from the Chinese Meteorological Data Sharing Network for roughly 105 observation sites in the study area and elsewhere in China contained daily and monthly temperature (T) and precipitation (P) data [21]. The inverse distance weighted interpolation method was used to interpolate these data to 1 km pixels for each year, which were then masked by the spatial distribution of paddy rice extracted from a 2005 land use/land cover data set for the NEC [22]. County-level time series data, consisting of yearly growing season temperature (GST), precipitation (GSP), and growing degree days (GDD), were averaged by pixel in the administrative boundaries from 1980 to 2008.
GST was calculated as follows:
GST = Mean   ( d = 1 n T m e a n )
where d is the days to maturity for rice in the study area, n is the length of the rice-growing season of 153 days, T m e a n is the daily mean temperature.
GSP was calculated as follows:
GSP = t = 1 n P
where d is the days to maturity for rice in the study area, n is the length of the rice-growing season of 153 days, P is the daily precipitation.
GDD were estimated from daily Tmin and Tmax at each site as follows [23]:
GDD b a s e , o p t = t = 1 N D D t    D D = { 0 i f T t < T b a s e T T b a s e i f T b a s e T t < T o p t T o p t T b a s e i f T t > T o p t
where t is an individual time step (day) within the growing season, T t is the daily average temperature of Tmin and Tmax during this time step, and N is the number of days between sowing and maturity. DD represents daily growing degree days; Tbase and Topt are the upper and lower limits of a given temperature range, respectively. Generally, in NEC, the single rice-cropping system is grown from May to September, the entire length of the growing period is 153 days, which was therefore used for all sites. Further, GDD 10 , 30 corresponds to the equation with Tbase = 10 °C and Topt = 30 °C for the growth stage of a single rice in NEC [24].

2.3. Statistical Analysis

We performed the following analyses to demonstrate the rice yield responses to changes in climate warming. To investigate the climate-rice yield relationship by province, we used ordinary least squares linear regression [25] based on the first-difference time series for yield (ΔYield) and growing season climate (ΔGDD, ΔGST and ΔGSP). This approach avoids the confounding influence of long-term variations such as changes in crop management. To remove the confounding influence of other factors, the original rice yield and climate variable data for each series were transformed by their de-trended values. To this end, the trends in the time series were first obtained by fitting the data with a smoothing spline in each series. The de-trended values from the time trends were then calculated as the differences of these trends from the observations in each year. The de-trended values of the county level rice yields were then correlated with the climate variables using a linear regression model for each series during the rice growing season. The regression coefficients calculated by this analysis can be viewed as metrics of the response of rice yield exclusively to climate change [9,10,26].
Δ Y r i c e i t = c i Δ C l i t + d i + Δ ε i
where Δ Y r i c e i t is the de-trended value of average rice yield for the ith county series in year t, which can be subtracted by year t’s yield and year t − 1’s yield, Δ C l i t is the de-trended value of a growing season climate variable (ΔGST, ΔGSP, ΔGDD), c i is the coefficient of the rice yield response to the climate variable for each series, d i represents an intercept for each series, and Δ ε i is the error term for each series.
To examine the spatial trends of the climate-rice yield regressions, linear and nonlinear regression were employed to analyze the relationships between yield change percentage and the latitude, longitude, and altitude of the counties. Here, the coefficients of the climate-rice yield de-trend regression can be used to divide the average yield in NEC to represent a yield change percentage. The fitness is compared by R2 and p-values for significant testing.

3. Results

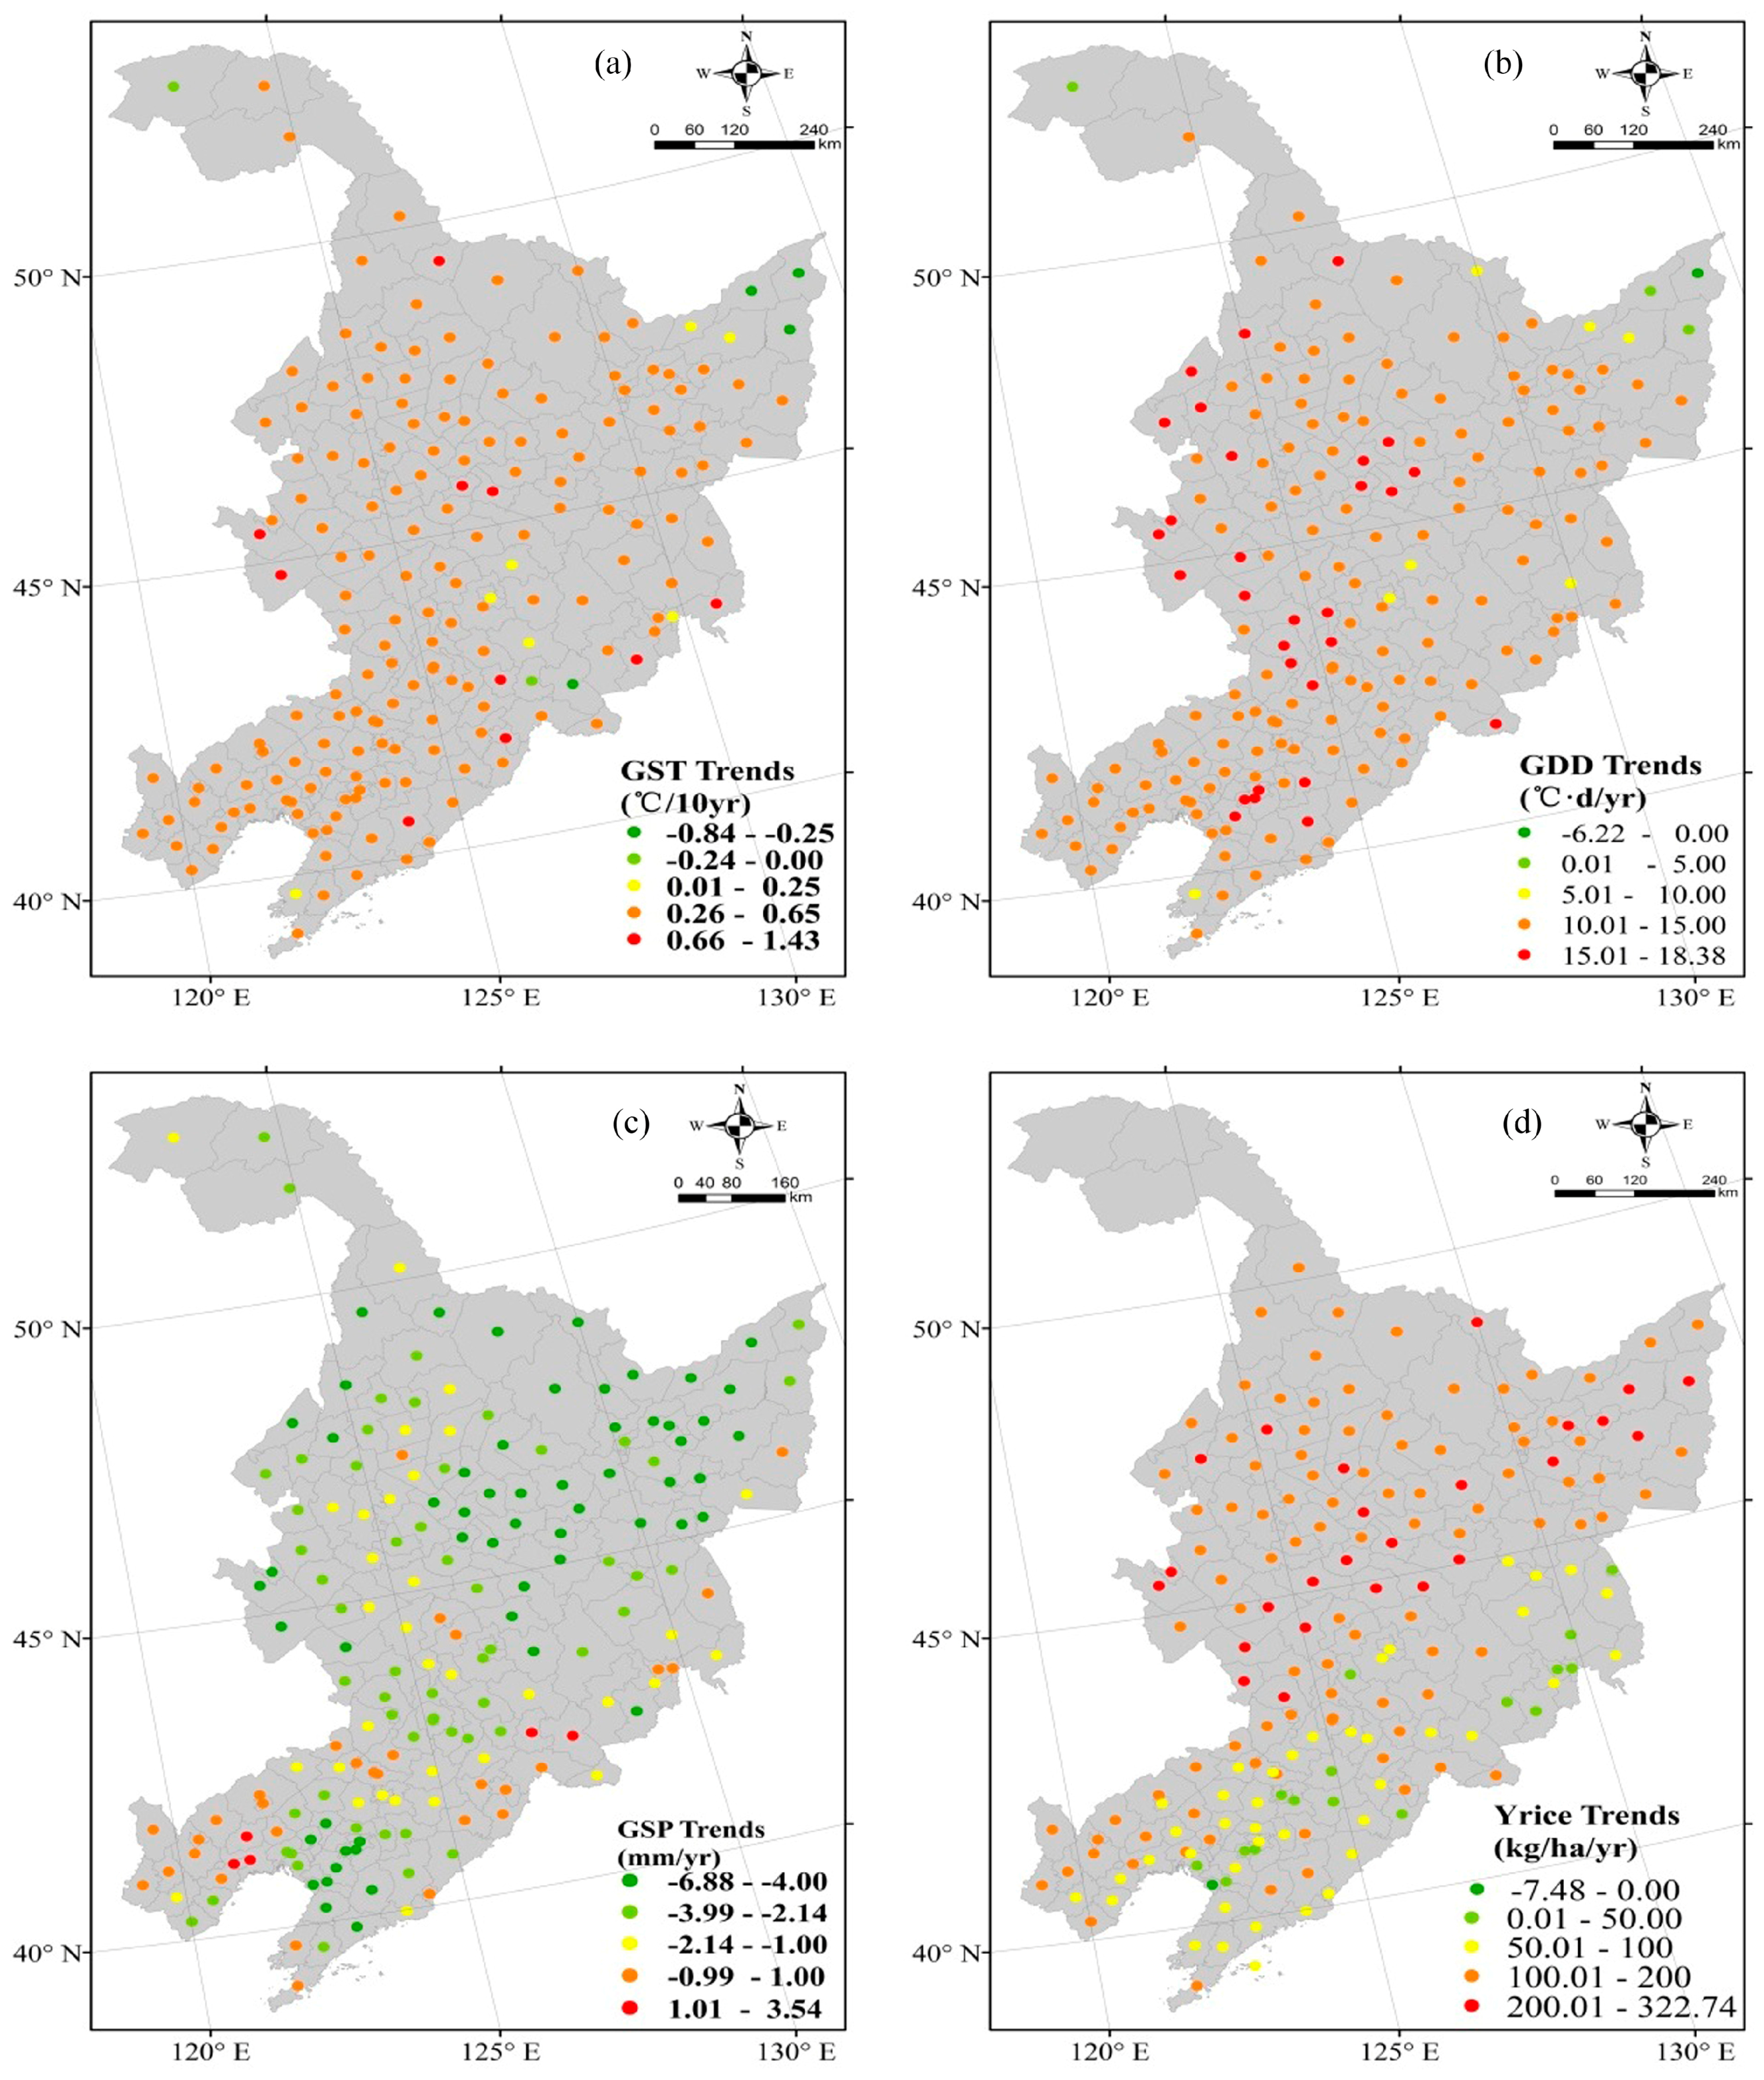
3.1. Climate and Rice Yield Trends during 1980–2008

3.1.1. Climate Trends in the Rice-Growing Season

As shown in Figure 2a–c and Table 1, the annual growing season temperature of rice increased for 173 counties (97.2%) in NEC. The average warming trend was 0.42 °C/10 years, ranging from −0.84 °C to 1.43 °C/10 years, with significant positive growth (p < 0.05) occurring in 94.8% of counties, ranging from 0.25 °C to 0.65 °C/10 years. The GDD of rice also increased in 177 (99.4%) of the counties in the study area, with 98.9% of these increases being significant (p < 0.05) increases and an average growth of 13.17 °C·day/ year (ranging from −6.23 °C to 18.38 °C·day/year) during the growing period. GSP decreased in 164 counties (92.1%) of the rice-growing areas during the growing season, but this decrease was non-significant in 89% of them. Only 14 counties (7.9%) showed an increasing trend for GSP, but this increase was significant (p < 0.05) in 71.4% of them. The average trend of GSP was −2.79 mm per year (ranging from −6.88 to 3.54 mm/year).

3.1.2. Rice Yield Trend

Figure 2d and Table 1 show that the average yield of rice was 5665.44 kg/ha (ranging from 3496.79 to 9093.34 kg/ha) during 1980–2008 in NEC. Yield increased in 99.1% of the counties, with 89.3% of these increases being significant (p < 0.05), and the average yield increase was 134.4 kg/ha per year (ranging from −7.48 to 322.74 kg/ha per year).

3.2. Climate-Rice Yield Relationship in the Northeast China (NEC)

The regression coefficients for the empirical relationships of the climate variables with rice yield are illustrated in Figure 3 and summarized in Table 2. Most of these regressions generated positive coefficients with GST and GDD but negative coefficients with GSP over the study area. GDD was positively correlated with rice yield in 64% of the counties, and this correlation was significant (p < 0.05) in 29.8% of them. This result indicated that a GDD increase of 1 °C·day increased rice yield by 1.18 kg/ha (range of −17.52 to 14.57 kg/ha); if the daily temperature during the entire growth period increased by 1 °C, rice yields (compared to the average rice yield of 5665.44 kg/ha in NEC during 1980–2008) would increase by approximately 3.2% (ranging from −47.3% to 39.3%). GST positively impacted rice yield in 64.6% of the counties, but this effect was significant (p < 0.05) in only 16.5% of them. This result indicates that an average temperature increase of 1 °C during the growing period would increase the rice yield by 206.63 kg/ha (ranging from −3061.5 to 2453.8 kg/ha), or approximately 3.65% (between −54% and 43.3%). GSP negatively impacted 68% of the counties in the rice cultivation area, with this effect being significant (p < 0.05) in 19% of them. This result indicates that a reduction of rainfall during the growing period of 1 mm decreases rice yield by 0.85 kg/ha (range of −6.96 to 12.71 kg/ha), or approximately −2.3% (range of −18.8% to 34.3%).

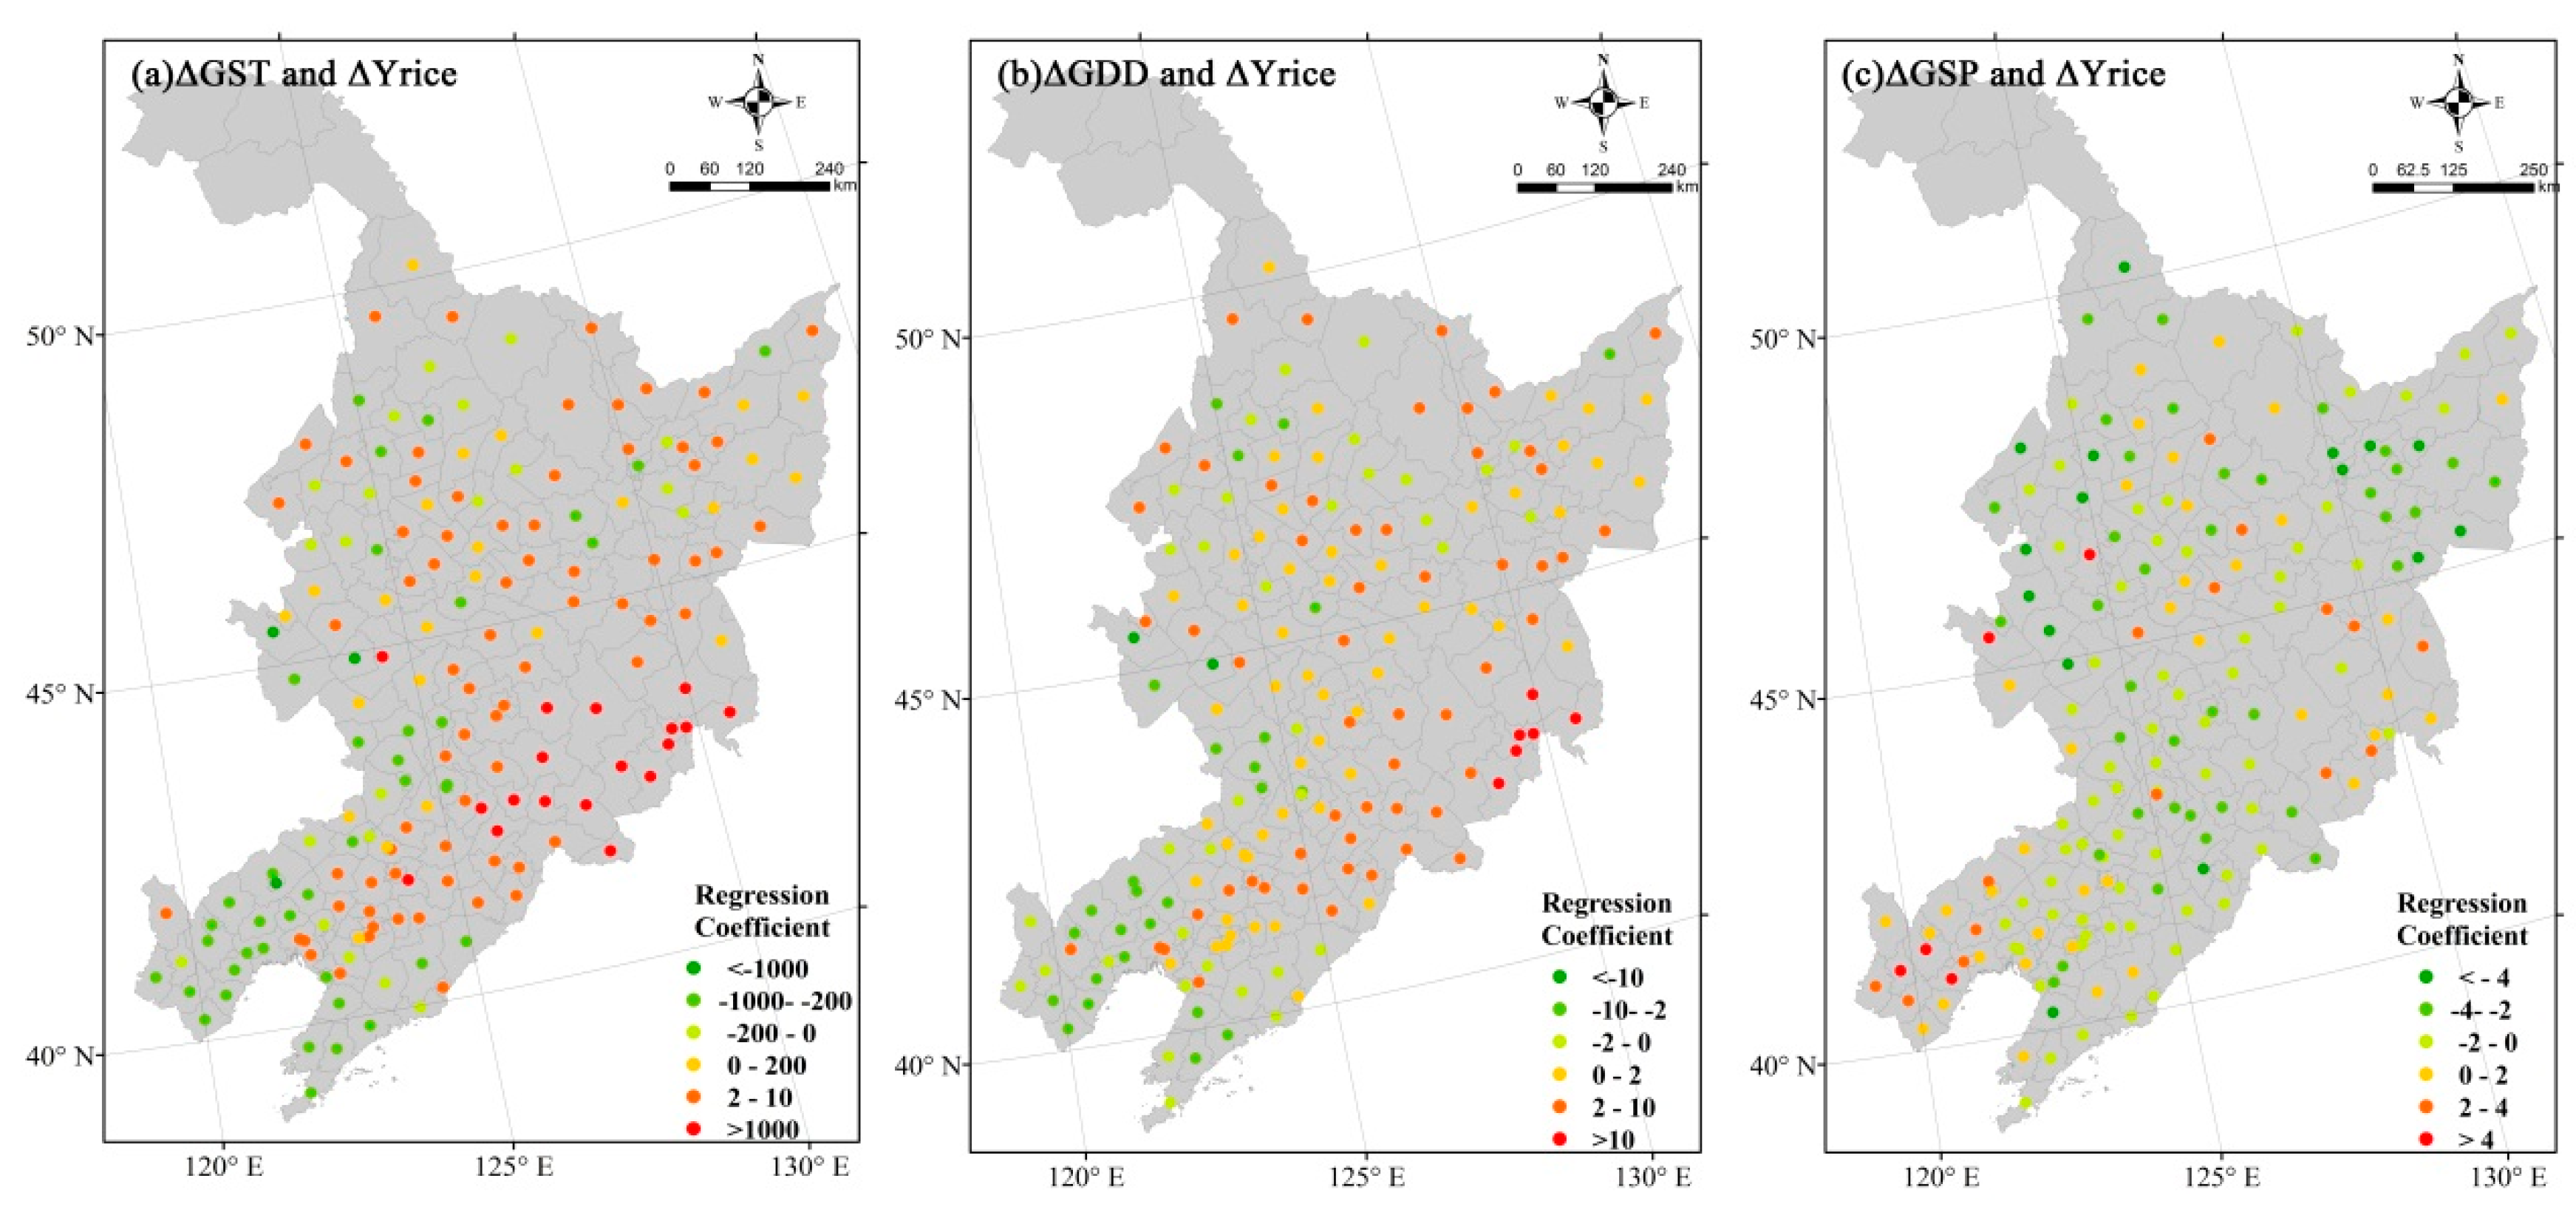
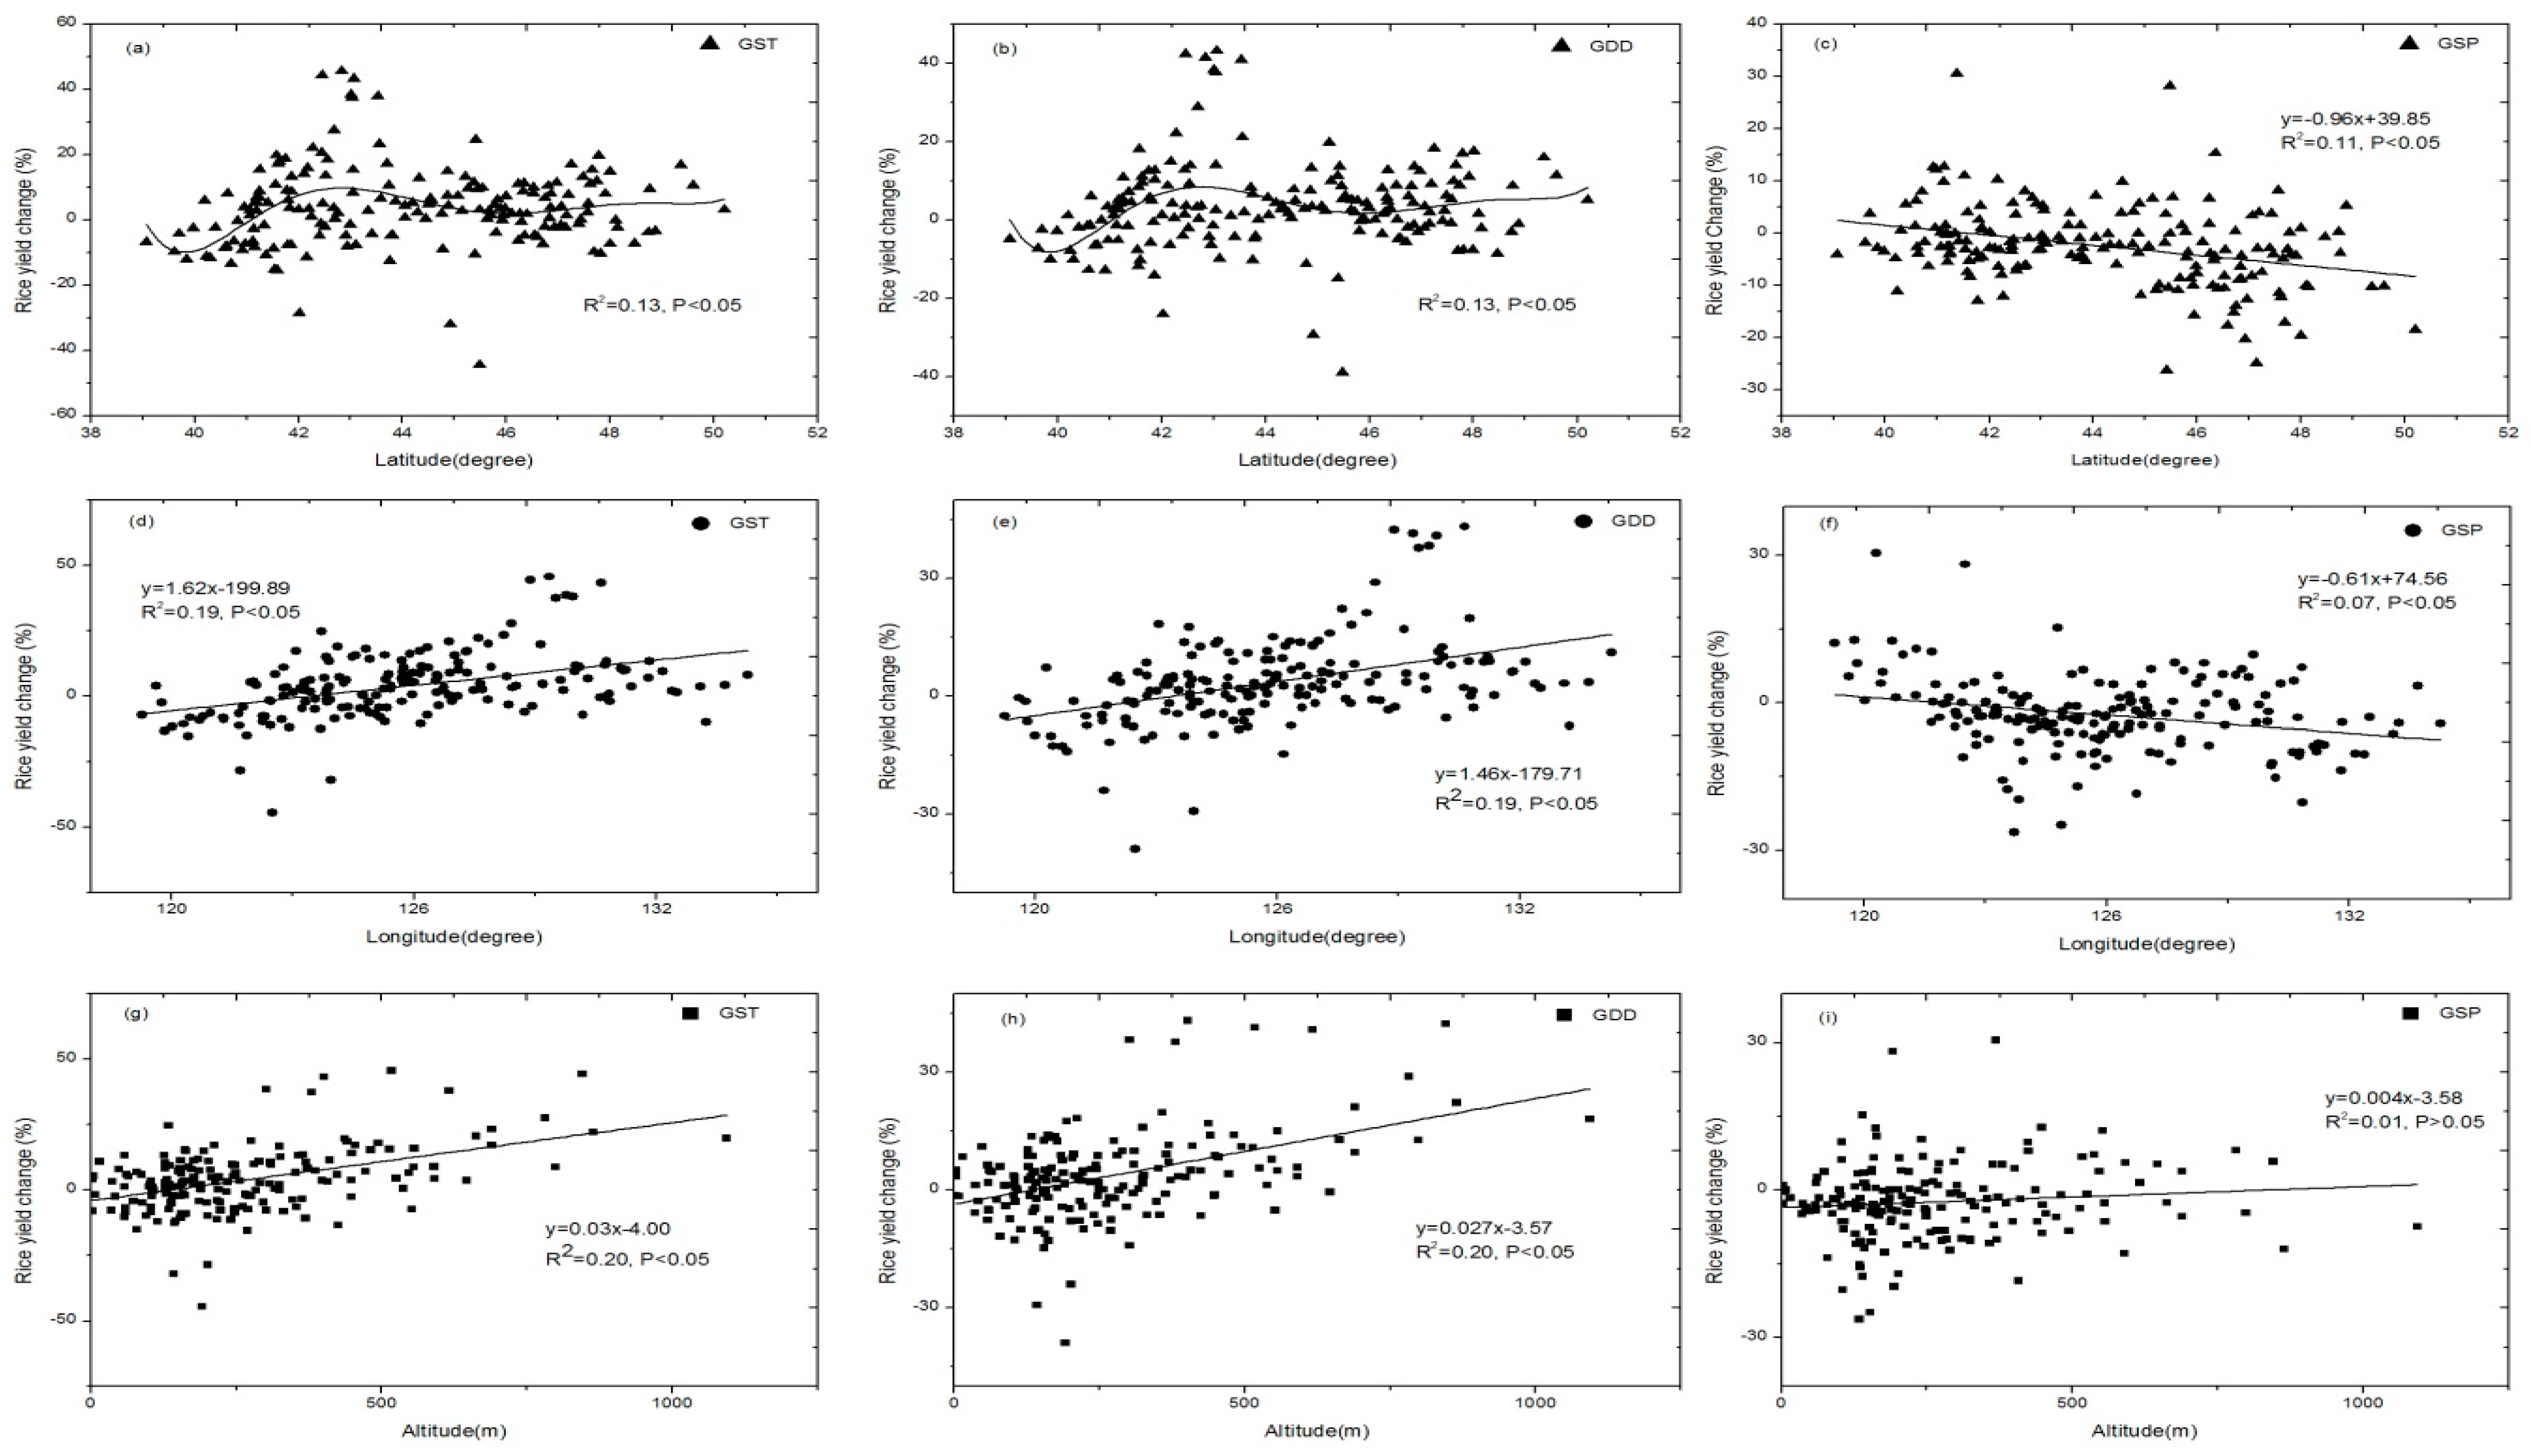
3.3. Geographical Variation of the Climate-Rice Yield Relationship

An obvious geographical effect was observed for the climate-rice yield statistical/empirical relationships (Figure 4). Figure 4a–c show the latitude effect on the climate-rice yield relationship in NEC. The GST impact on the percent of the rice yield change exhibited a six-fold polynomial relationship with increasing latitude (p < 0.05, R2 = 0.13). A negative impact was observed from 39.1°N to 41.2°N, averaging −4.87% (range of −13.43% to 8.22%), but positive impacts were observed from 41.2°N to 42.8°N, 46°N to 47.8°N, and 47.9°N to 50.2°N, averaging 6.71% (range of −28.51% to 45.62%), 3.85% (range of −10.17% to 19.68%), and 3.85% (range of −7.16% to 16.76%), respectively. Positive impacts were also observed for GST from 42.9°N to 45.9°N, averaging 5.15% (range of −44.36% to 43.20%), and from 46°N to 47.8°N, averaging 3.85% (range of −10.17% to 19.68%). GDD had similar impacts on rice yield, with greater positive effects after 47.9°N. The impact of GSP on the percentage change of the rice yield was linearly correlated with increasing latitude (slope = −0.96°/%, p < 0.05, R2 = 0.11), with a positive effect from 39.1°N to 41.9°N, averaging 0.24% (range of −12.95% to 30.52%), and a negative effect after 42.0°N, with an average of −3.5% (range of −26.32% to 28.17%).
As shown in Figure 4d–f, the impacts of GST and GDD on the rice yield percentage change exhibit positive linear relationships with longitude from west to east, with slopes of 1.62°/% (p < 0.05, R2 = 0.19) and 1.46°/% (p < 0.05, R2 = 0.19), respectively, while the impact of GSP exhibits a negative linear relationship (slope = −0.61°/%, p < 0.05, R2 = 0.07). At longitudes between 119.3°E and 122.7°E, GST negatively impacts rice yield by an average of −8.44% (range of −44.36% to 8.22%); from 125.3°E to 134.3°E, GST positively impacts rice yield by an average of 6.22% (range of −31.92% to 45.62%). GDD exhibits a similar trend as longitude changes from west to east. At longitudes between 119.3°E and 122.4°E, the influence of GSP on rice yield is a positive effect, but as longitude changed from west to east, the rice yield percentage change decreased by an average of 3.93% (range of −11.17% to 30.52%); at longitudes between 122.5°E and 134.3°E, the GSP effect on rice yield decreased with the longitude by an average of −3.56% (range of −26.32% to 28.17%).
Figure 4g–i show the effects of altitude on the climate-rice yield relationships in NEC. The impacts of GST, GDD, and GSP on the rice yield percentage change exhibit positive linear relationships with elevation increase, with slopes of 0.03 m/% (p < 0.05, R2 = 0.21), 0.027 m/% (p < 0.05, R2 = 0.20) and 0.0043 (p > 0.05, R2 = 0.01), respectively. As observed in the relationships of the coefficients of climate-rice yield and altitude factors, elevations lower than 134 m negatively influenced the GST and GDD effects on rice yield by approximately −1.24%, elevations between 134 and 473 m positively influenced these effects by less than 10%, and elevations higher than 473 m positively influenced the benefits of GST or GDD by greater than 10%. Altitude did not significantly influence the effects of rainfall on rice yield.

4. Discussion

A comprehensive analysis of the spatial variation of the rice yield response to past climate trends is rare in the existing literature; most previous studies have examined time series relationships of climate and rice yield at the site [11,14], provincial [2,27], national [3,28,29], and global scales [1,25]. All of these studies have omitted geographical heterogeneity from the analysis of the climate-rice yield relationship and its dependence on spatial patterns, leading to uncertainty in statistical modeling [30,31]. Several studies have found that temperature positively impacts rice yield, while others have reported a negative impact [14,15]. The present study indicated that climate warming significantly positively correlated with the rice yield increase in NEC, which is consistent with the findings of Zhang et al. [32], Tao et al. [2] and Xiong et al. [3] at the regional scale; the results also support the views that crops in high-latitude areas will benefit from climate warming [4].
Few studies have observed that spatial or temporal climate variability impacts the predictions of statistical models [33]; however, climate variability is related to geographic patterns. Lobell and Field found that climate trends account for −0.6% of the rice yield at the global scale by a first-difference de-trend statistical analysis [25], while Tao et al. [2] indicated that climate warming increased the rice yield between 4.6%–14.6% in Jilin and 4.5%–10.7% in Heilongjiang at the provincial scale. The present study shows that climate variability is very large at the county scale (Figure 2). The use of de-trended time series regression to analyze climate and rice yield at the county scale indicates that the uncertainty of spatial and temporal factors should receive much greater concern [34]. Lobell and Field [25] indicated that using statistic model results at a global scale may not explain the trend at the regional or local scale. In order to do a comparison with other results, the present analysis used the average impact of warming at the county scale to provide an uncertain assessment at the regional scale [33]. For example, the impact of GST ranged from −54% to 43.3% (R2 from 0.01 to 0.49) at the county scale in this study, but the average at the regional scale was 3.65%. Compared with uncertainty at the experimental site scale, that at the county or provincial scales can be large [35]. However, uncertainty can be reduced by considering geographical factors such as latitude, longitude, and altitude when applying statistical models at broader scales [25].
Many factors that contribute to the yield increase, such as changes in rice varieties, fertilizer, rice phenology dynamics [35,36], cultivar replacement [37], irrigation and crop management [38,39], have to be taken in account [40]. Because of the rapid expansion in rice area, the rice yield also benefited from this process [17]. In NEC, climate warming has been found as a contributor to the rapid expansion in rice area [41,42]. In order to separate the contribution of the yield increase or area expansion on the production, it is crucial to consider the geographical impact, which is usually ignored in these statistical models; however, climate usually exhibits significant geographic variation, as do other factors that impact rice yield, such as soil heterogeneity, crop management, and irrigation,[26]. Recent trends in the climate-rice yield statistical relationship appear to have increased yields in some areas but decreased them in other areas [1,32,43], which may imply that geographical factors are recessive factors that impact the climate-rice yield relationships. This study shows that coefficients of the climate-rice yield relationship all exhibit linear or nonlinear relationships with latitude, longitude, and altitude, which indicates that the rice yield impacted by climate can be limited by the spatial gradient of geographical factors (Figure 4). Although the climate-rice yield statistical model in the present study minimized the impacts of these other factors by employing the first-difference method, geographical factors should receive further consideration at the county scale [44].

5. Conclusions

The present study illustrates the general response of rice yield to past climate trends that have occurred during the rice growing season in the majority of NEC. Significant climate warming has occurred in NEC over the past three decades, with the mean temperature and effective accumulated temperature in the rice-growing season increasing by 0.42 °C/10 years and 13.17 °C·day/years, respectively. Rice yield also significantly increased in most of the counties in the NEC by an average of 134.4 kg/ha per year, and the average rice yield in the region was 5665.44 kg/ha.
The climate-rice yield relationships at the county scale demonstrate that rice yield growth benefitted from climate warming in most of the counties in NEC, which is consistent with the previous report of the Intergovernmental Panel on Climate Change (IPCC) [4]. GST positively impacted the rice yield in 64.6% of the counties, with an increase of approximately 3.65%; GDD positively impacted the rice yield in 64% of the counties, an increase of approximately 3.2%; and GSP negatively impacted the rice yield in 68% of the counties, with a decrease of approximately −2.3%. However, the impacts of the climate trends exhibited spatial variation. The statistical relationships of GST and GDD with the rice yield were significantly and positively correlated with latitude, longitude, and altitude, while that of GSP and the rice yield was significantly and negatively correlated with latitude and longitude and showed a non-significant positive correlation with altitude. Climate warming has significantly increased rice yield over the last three decades in the region north of 42°N, east of 122.4°E, and at an elevation of 134–473 m, which covers the majority of the rice-growing areas in NEC. The latitude, longitude, and altitude factors of the rice planting area play a vital role in the impact on the spatial pattern of the climate-rice yield relationship. These results indicate that if the adjustment policy of the crop pattern in Northeast China will be planned by manager, it would be considered as an adaptation to climate change, especially the benefit of the rice yield at different geographic distributions due to climate warming. It is a reasonable choice for a food security strategy and regional agricultural sustainable development.

Acknowledgments

We are grateful for the financial support for our initial and ongoing research from the Fundamental Research Funds for the Central Universities (No. 15lgpy23) and the National Natural Science Foundation of China (No. 41571172).

Author Contributions

Z.L. and P.Y. conceived and designed the experiments; Z.L. performed the experiments; Z.L. analyzed the data; Z.L. and Z.G. contributed reagents/materials/analysis tools; Z.L. wrote the paper. All authors have read and approved the final manuscript.

Conflicts of Interest

The authors declare no conflict of interest.

References

  1. Lobell, D.B.; Schlenker, W.; Costa-Roberts, J. Climate trends and global crop production since 1980. Science 2011, 333, 616–620. [Google Scholar] [CrossRef] [PubMed]
  2. Tao, F.; Yokozawa, M.; Liu, J.; Zhang, Z. Climate-crop yield relationships at provincial scales in China and the impacts of recent climate trends. Clim. Res. 2008, 38, 83–94. [Google Scholar] [CrossRef]
  3. Xiong, W.; Holman, I.P.; Yang, J.; Li, Y.; Wu, W.; Yang, P. Impacts of observed growing-season warming trends since 1980 on crop yield in China. Reg. Environ. Chang. 2014, 14, 7–16. [Google Scholar] [CrossRef]
  4. Cruz, R.V.; Harasawa, H.; Lal, M.; Wu, S.; Anokhin, Y.; Punsalmaa, B.; Honda, Y.; Jafari, M.; Li, C.; Huu Ninh, N. Asia. Climate change 2007. In Impacts, Adaptation and Vulnerability. Contribution of Working Group II to the Fourth Assessment Report of the Intergovernmental Panel on Climate Change; Parry, M.L., Canziani, O.F., Palutikof, J.P., van der Linden, P.J., Hanson, C.E., Eds.; Cambridge University Press: Cambridge, UK, 2007; pp. 469–506. [Google Scholar]
  5. Shi, W.; Tao, F.; Zhang, Z. A review on statistical models for identifying climate contributions to crop yields. J. Geogr. Sci. 2013, 23, 567–576. [Google Scholar] [CrossRef]
  6. Hansen, J.W.; Challinor, A.; Ines, A.V.M.; Wheeler, T.; Moron, V. Translating climate forecasts into agricultural terms: Advances and challenges. Clim. Res. 2006, 33, 27–41. [Google Scholar] [CrossRef]
  7. Iizumi, T.; Yokozawa, M.; Nishimori, M. Parameter estimation and uncertainty analysis of a large-scale crop model for paddy rice: Application of a Bayesian approach. Agric. For. Meteorol. 2009, 149, 333–348. [Google Scholar] [CrossRef]
  8. Lobell, D.B.; Burke, M.B. On the use of statistical models to predict crop yield responses to climate change. Agric. For. Meteorol. 2010, 150, 1443–1452. [Google Scholar] [CrossRef]
  9. Nicholls, N. Increased Australian wheat yield due to recent climate trends. Nature 1997, 387, 484–485. [Google Scholar] [CrossRef]
  10. Lobell, D.B.; Asner, G.P. Climate and management contributions to recent trends in U.S. agricultural yields. Science 2003, 299, 1032. [Google Scholar] [CrossRef] [PubMed]
  11. Zhang, T.; Zhu, J.; Wassmann, R. Responses of rice yields to recent climate change in China: An empirical assessment based on long-term observations at different spatial scales (1981–2005). Agric. For. Meteorol. 2010, 150, 1128–1137. [Google Scholar] [CrossRef]
  12. Lobell, D.B.; Banziger, M.; Magorokosho, C.; Vivek, B. Nonlinear heat effects on African maize as evidenced by historical yield trials. Nat. Clim. Chang. 2011, 1, 42–45. [Google Scholar] [CrossRef]
  13. Schlenker, W.; Lobell, D.B. Robust negative impacts of climate change on African agriculture. Environ. Res. Lett. 2010, 5, 014010. [Google Scholar] [CrossRef]
  14. Peng, S.; Huang, J.; Sheehy, J.E.; Laza, R.C.; Visperas, R.M.; Zhong, X.; Centeno, G.S.; Khush, G.S.; Cassman, K.G. Rice yields decline with higher night temperature from global warming. Proc. Natl. Acad. Sci. USA 2004, 101, 9971–9975. [Google Scholar] [CrossRef] [PubMed]
  15. Welch, J.R. Rice yields in tropical/subtropical Asia exhibit large but opposing sensitivities to minimum and maximum temperatures. Proc. Natl. Acad. Sci. USA 2010, 107, 14562. [Google Scholar] [CrossRef] [PubMed]
  16. Gao, J.; Liu, Y. Climate warming and land use change in Heilongjiang Province, Northeast China. Appl. Geogr. 2011, 31, 476–482. [Google Scholar] [CrossRef]
  17. Chen, C.Q.; Qian, C.R.; Deng, A.X.; Zhang, W.J. Progressive and active adaptations of cropping system to climate change in Northeast China. Eur. J. Agron. 2012, 38, 94–103. [Google Scholar] [CrossRef]
  18. Ministry of Agriculture, PRC. The Statistics Database of Crops Sown Area and Production. 2012; Ministry of Agriculture, PRC. Available online: http://www.zzys.moa.gov.cn/ (accessed on 6 May 2013). (In Chinese) [Google Scholar]
  19. Ministry of Agriculture, PRC. New China Agricultural 60 Yearbook; Chinese Agriculture Press: Beijing, China, 2009. (In Chinese)
  20. Ministry of Agriculture, PRC. China Agriculture Statistical Report; Chinese Agriculture Press: Beijing, China, 2009. (In Chinese)
  21. Climatic Data Center, National Meteorological Information Center, China Meteorological Administration, PRC. The Data Set of Daily Ground Climate of China 1980–2010. 2012. Climatic Data Center. Available online: http://data.cma.cn/ (accessed on 15 June 2013). (In Chinese)
  22. Liu, J.; Zhang, Z.; Xu, X.; Kuang, W.; Zhou, W.; Zhang, S.; Li, R.; Yan, C.; Yu, D.; Wu, S.; et al. Spatial patterns and driving forces of land use change in China in the Early 21st Century. Acta Geogr. Sin. 2009, 64, 1411–1420. (In Chinese) [Google Scholar] [CrossRef]
  23. Wang, P.; Zhang, Z.; Song, X.; Chen, Y.; Wei, X.; Shi, P.; Tao, F. Temperature variations and rice yields in China: Historical contributions and future trends. Clim. Chang. 2014, 124, 777–789. [Google Scholar] [CrossRef]
  24. Yang, X.G.; Yu, H.N. Chinese Climatic Resources and Agriculture; Meteorological Press: Beijing, China, 2006. (In Chinese) [Google Scholar]
  25. Lobell, D.B.; Field, C.B. Global scale climate-crop yield relationships and the impacts of recent warming. Environ. Res. Lett. 2007, 2, 014002. [Google Scholar] [CrossRef]
  26. Zhang, T.; Huang, Y.; Yang, X. Climate warming over the past three decades has shortened rice growth duration in China and cultivar shifts have further accelerated the process for late rice. Glob. Chang. Biol. 2013, 19, 563–570. [Google Scholar] [CrossRef] [PubMed]
  27. Abdur Rashid Sarker, M.; Alam, K.; Gow, J. Exploring the relationship between climate change and rice yield in Bangladesh: An analysis of time series data. Agric. Syst. 2012, 112, 11–16. [Google Scholar] [CrossRef]
  28. Lobell, D.B. Changes in diurnal temperature range and national cereal yields. Agric. For. Meteorol. 2007, 145, 229–238. [Google Scholar] [CrossRef]
  29. Yao, F.; Xu, Y.; Lin, E.; Yokozawa, M.; Zhang, J. Assessing the impacts of climate change on rice yields in the main rice areas of China. Clim. Chang. 2007, 80, 395–409. [Google Scholar] [CrossRef]
  30. Lobell, D.B. Errors in climate datasets and their effects on statistical crop models. Agric. For. Meteorol. 2013, 170, 58–66. [Google Scholar] [CrossRef]
  31. Yao, F.; Qin, P.; Zhang, J.; Lin, E.; Boken, V. Uncertainties in assessing the effect of climate change on agriculture using model simulation and uncertainty processing methods. Chin. Sci. Bull. 2011, 56, 729–737. [Google Scholar] [CrossRef]
  32. Zhang, Z.; Song, X.; Tao, L.F.; Zhang, S.; Shi, W.J. Climate trends and crop production in China at county scale, 1980 to 2010. Theor. Appl. Climatol. 2016, 123, 291–302. [Google Scholar] [CrossRef]
  33. Lobell, D.B.; Burke, M.B. Why are agricultural impacts of climate change so uncertain? The importance of temperature relative to precipitation. Environ. Res. Lett. 2008, 3, 034007. [Google Scholar] [CrossRef]
  34. Lobell, D.B. Crop Responses to Climate: Time-Series Models. In Climate Change and Food Security: Adapting Agriculture to a Warmer World; Lobell, D., Burk, M., Eds.; Springer: Dordrecht, The Netherlands; Heidelberg, Germany; London, UK; New York, NY, USA, 2010. [Google Scholar]
  35. Tao, F.; Yokozawa, M.; Xu, Y.; Hayashi, Y.; Zhang, Z. Climate changes and trends in phenology and yields of field crops in China, 1981–2000. Agric. For. Meteorol. 2006, 138, 82–92. [Google Scholar] [CrossRef]
  36. Van Oort, P.A.J.; Zhang, T.; de Vries, M.E.; Heinemann, A.B.; Meinke, H. Correlation between temperature and phenology prediction error in rice (Oryza sativa L.). Agric. For. Meteorol. 2011, 151, 1545–1555. [Google Scholar] [CrossRef]
  37. Zhang, T.; Zhu, J.; Yang, X.; Zhang, X. Correlation changes between rice yields in North and Northwest China and ENSO from 1960 to 2004. Agric. For. Meteorol. 2008, 148, 1021–1033. [Google Scholar] [CrossRef]
  38. Yu, Y.; Huang, Y.; Zhang, W. Changes in rice yield in China since 1980 associated with cultivar improvement, climate and crop management. Field Crops Res. 2012, 136, 65–75. [Google Scholar] [CrossRef]
  39. Sun, W.; Huang, Y. Global warming over the period 1961–2008 did not increase high-temperature stress but did reduce low-temperature stress in irrigated rice across China. Agric. For. Meteorol. 2011, 151, 1193–1201. [Google Scholar] [CrossRef]
  40. Zhang, H.; Tao, F.L.; Xiao, D.P.; Shi, W.J.; Liu, F.S.; Zhang, S.; Liu, Y.J.; Wang, M.; Bai, H.Z. Contributions of climate, varieties, and agronomic management to rice yield change in the past three decades in China. Front. Earth Sci. 2016, 10, 315–327. [Google Scholar] [CrossRef]
  41. Li, Z.G.; Liu, Z.H.; Anderson, W.; Yang, P.; Wu, W.B.; Tang, H.J.; You, L.Z. Chinese Rice Production Area Adaptations to Climate Changes, 1949–2010. Environ. Sci. Technol. 2015, 49, 2032–2037. [Google Scholar] [CrossRef] [PubMed]
  42. Liu, Z.H.; Yang, P.; Tang, H.J.; Wu, W.B.; Zhang, L.; Yu, Q.Y.; Li, Z.G. Shifts in the extent and location of rice cropping areas match the climate change pattern in China during 1980–2010. Reg. Environ. Chang. 2015, 15, 919–929. [Google Scholar] [CrossRef]
  43. Amin, R.M.D.; Zhang, J.B.; Yang, M.M. Effects of climate change on the yield and cropping area of major food crops: A case of Bangladesh. Sustainability 2015, 7, 898–915. [Google Scholar] [CrossRef]
  44. Schlenker, W.; Roberts, M.J. Nonlinear temperature effects indicate severe damages to US crop yields under climate change. Proc. Natl. Acad. Sci. USA 2009, 106, 15594–15598. [Google Scholar] [CrossRef] [PubMed]
Figure 1. Location of the study sites in Northeast China (NEC).
Sustainability 08 00670 g001
Figure 2. Trends in (a) growing season temperature (GST); (b) growing degree days (GDD); (c) growing season precipitation (GSP); and (d) rice yield (Yrice) in NEC during 1980–2008.
Sustainability 08 00670 g002
Figure 3. Distribution of de-trended regression coefficients at the county scale in (a) ΔGST and ΔYrice; (b) ΔGDD and ΔYrice; (c) ΔGSP and ΔYrice in NEC during 1980–2008.
Sustainability 08 00670 g003
Figure 4. Geographical effects of the climate-rice yield relationships at the county scale: (a) The percentage of rice yield changed by ΔGST and Latitude; (b) the percentage of rice yield changed by ΔGDD and latitude; (c) the percentage of rice yield changed by ΔGSP and latitude; (d) the percentage of rice yield changed by ΔGST and longitude; (e) the percentage of rice yield changed by ΔGDD and longitude; (f) the percentage of rice yield changed by ΔGSP and longitude; (g) the percentage of rice yield changed by ΔGST and altitude; (h) the percentage of rice yield changed by ΔGDD and altitude; (i) the percentage of rice yield changed by ΔGSP and altitude in NEC during 1980–2008.
Sustainability 08 00670 g004
Table 1. Historical climate and rice yield trends of the rice single-cropping system over the study period for all counties in NEC during 1980–2008.
VariablenNeg_AllNeg_SigPos_AllPos_SigTrendminTrendmaxTrendmean
Yrice17810177158−7.48322.74134.4
GST17854173164−0.841.430.42
GSP178164181410−6.883.54−2.79
GDD17811177175−6.2318.3813.17
n: number of counties in NEC. Neg_All/Pos_All: number of time series showing negative/positive linear regression slopes. Neg_Sig/Pos_Sig: proportion of series showing significantly negative/positive slope coefficients (p < 0.05). Trendmin/max/mean: min/max/mean of time trends at the county level. Units: Yrice: kg/ha; growing season temperature (GST): 10 °C/year; precipitation (GSP): mm/year; growing degree days (GDD): °C·day/year.
Table 2. Summary of ΔYrice of rice responses to changes in Δclimate using de-trended at the county level in NEC during 1980–2008.
Climate VariablenNeg_AllNeg_SigPos_AllPos_SigTrendminTrendmaxTrendmean
ΔGST17863311519−3061.52453.8206.63
ΔGSP17812123575−6.9612.71−0.85
ΔGDD17864611434−17.5214.571.18
n: number of counties in NEC. Neg_All/Pos_All: number of time series showing negative/positive linear regression slopes. Neg_Sig/Pos_Sig: proportion of series showing significantly negative/positive slope coefficients (p < 0.05). Trendmin/max/mean: min/max/mean of time trends at the county level. Units: Yrice: kg/ha; GST: 10 °C/year; GSP: mm/year; GDD: °C·day/year.

