Article

Assessing the Impacts of Chinese Sustainable Ground Transportation on the Dynamics of Urban Growth: A Case Study of the Hangzhou Bay Bridge

Institute of Agriculture Remote Sensing and Information Technology, College of Environment and Natural Resource, Zhejiang University, Hangzhou 310058, China
*
Authors to whom correspondence should be addressed.
Sustainability 2016, 8(7), 666; https://doi.org/10.3390/su8070666
Submission received: 10 May 2016 / Revised: 28 June 2016 / Accepted: 11 July 2016 / Published: 13 July 2016

Abstract

:
Although China has promoted the construction of Chinese Sustainable Ground Transportation (CSGT) to guide sustainable development, it may create substantial challenges, such as rapid urban growth and land limitations. This research assessed the effects of the Hangzhou Bay Bridge on impervious surface growth in Cixi County, Ningbo, Zhejiang Province, China. Changes in impervious surfaces were mapped based on Landsat images from 1995, 2002, and 2009 using a combination of multiple endmember spectral mixture analysis (MESMA) and landscape metrics. The results indicated that the area and density of impervious surfaces increased significantly during construction of the Hangzhou Bay Bridge (2002–2009). Additionally, the bridge and connected road networks promoted urban development along major roads, resulting in compact growth patterns of impervious surfaces in urbanized regions. Moreover, the Hangzhou Bay Bridge promoted the expansion and densification of impervious surfaces in Hangzhou Bay District, which surrounds the bridge. The bridge also accelerated socioeconomic growth in the area, promoting rapid urban growth in Cixi County between 2002 and 2009. Overall, the Hangzhou Bay Bridge is an important driver of urban growth in Cixi County, and policy suggestions for sustainable urban growth should be adopted in the future.

1. Introduction

1.1. Introduction of Research Significance and Research Method

China started to implement reform and opening up policy in 1978, resulting in the evolution of the urban land market because most economic activities were centered in urban areas [1]. These changes led to considerable urban sprawl [2,3,4]. In this sense, ground transportation has played a significant role in the socio-economic development of China. However, sustainable transportation continues to be a topic of interest as China looks to adopt best practices for environmental protection, economic efficiency, and social progress. Sustainable ground transportation can be defined as the capacity to support the mobility needs of people, freight and information in a manner that is least damaging to the environment [5]. One of the more comprehensive programs that utilize transportation investments to create a sustainable transportation infrastructure is Chinese Sustainable Ground Transportation (CSGT) (e.g., super expressways, high-speed railways and cross-sea bridges). In an attempt to build a new CSGT-based comprehensive transportation system and promote sustainable social development, the central government enacted the “11th and 12th five-year comprehensive traffic system development plan”. It focused on alleviating transportation pressure, reducing fuel use, and decreasing labor costs [6].
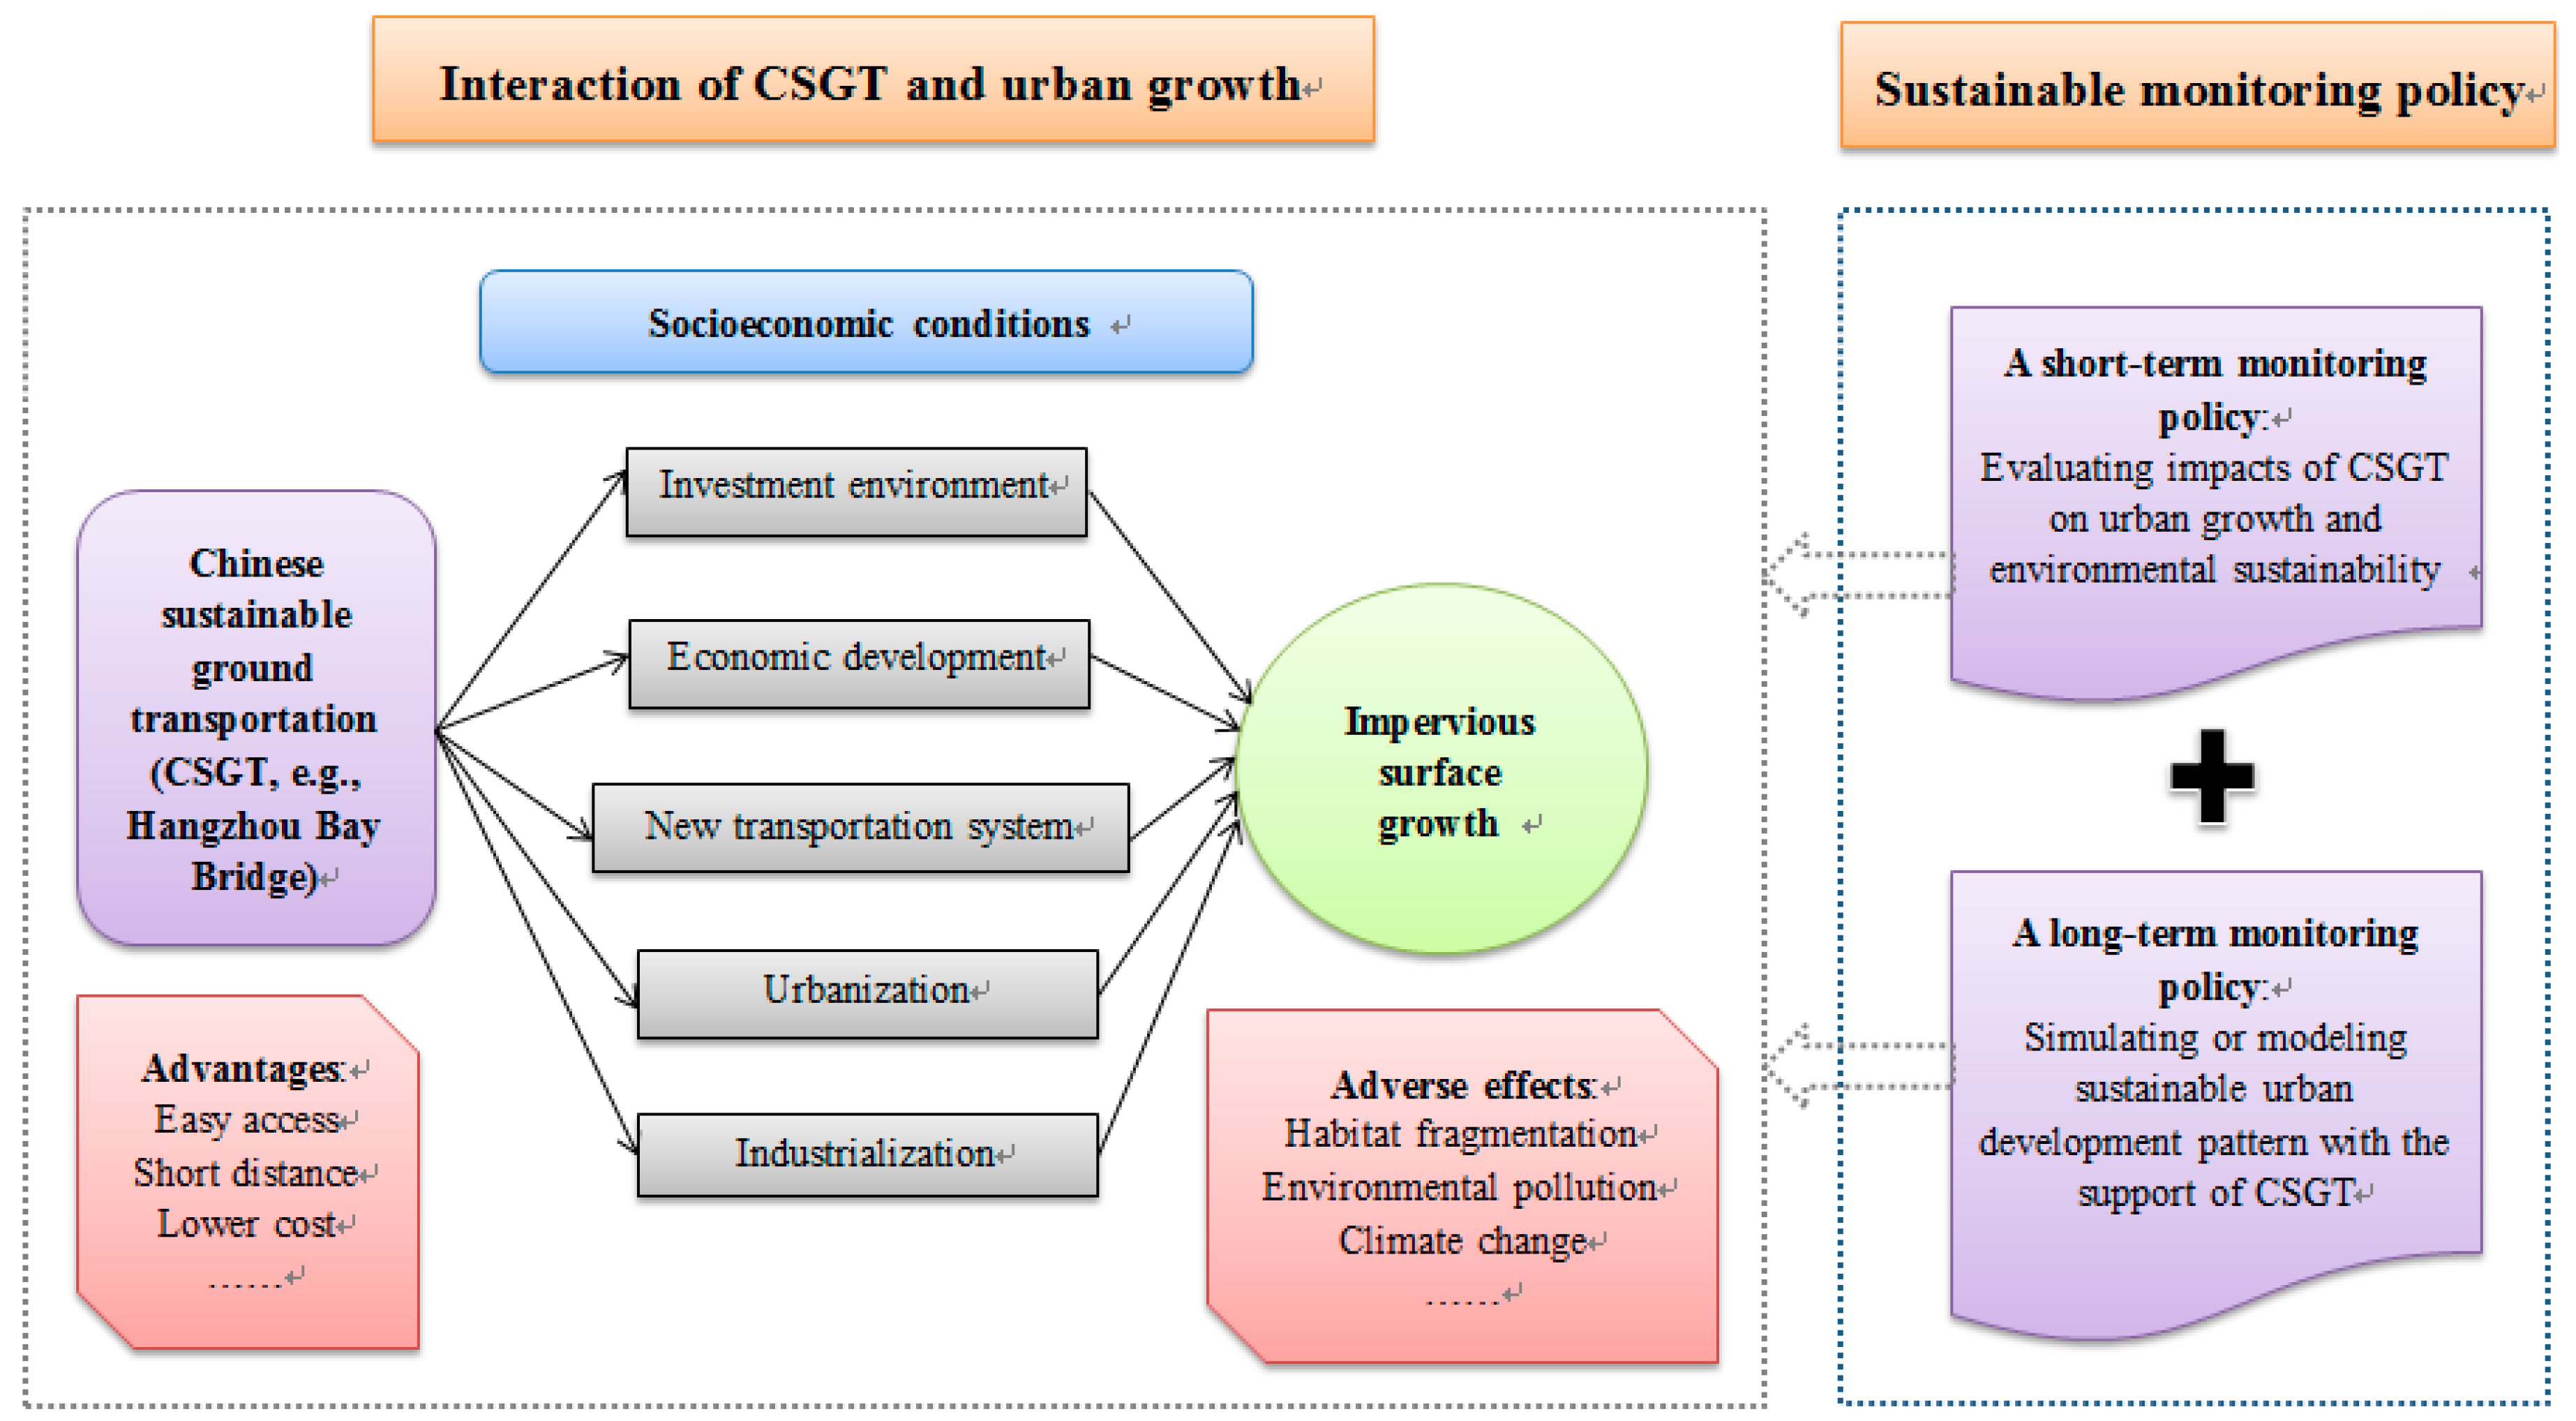
Despite the goal of promoting CSGT, the program has inherent challenges related to land use and land cover change (LULCC), such as the conversion of non-urban lands to impervious surfaces. CSGT may contribute to the growth of impervious surfaces in two critical ways. Firstly, by constructing ground transportation systems, such as highways and railways, creates anthropogenic features through which water cannot infiltrate into the soil [7,8,9,10]. Secondly, sustainable or improved transportation infrastructure that has economic advantages, such as lower commuting times, may encourage the conversion of farmland or vegetation cover to impervious surfaces [11,12,13,14]. Combined, these factors are likely to lead to deterioration of natural ecosystems in urban regions.
As a critical aspect of sustainable urban and transportation development, controlling the growth of impervious surfaces is a common goal of environmental management and urban planning [7,14]. Previous studies have characterized the dynamics of impervious surface changes and their relationship with environmental degradation [7,10,13]. However, the relationships between sustainable transportation infrastructure, such as CSGT, and impervious surface changes are poorly understood.
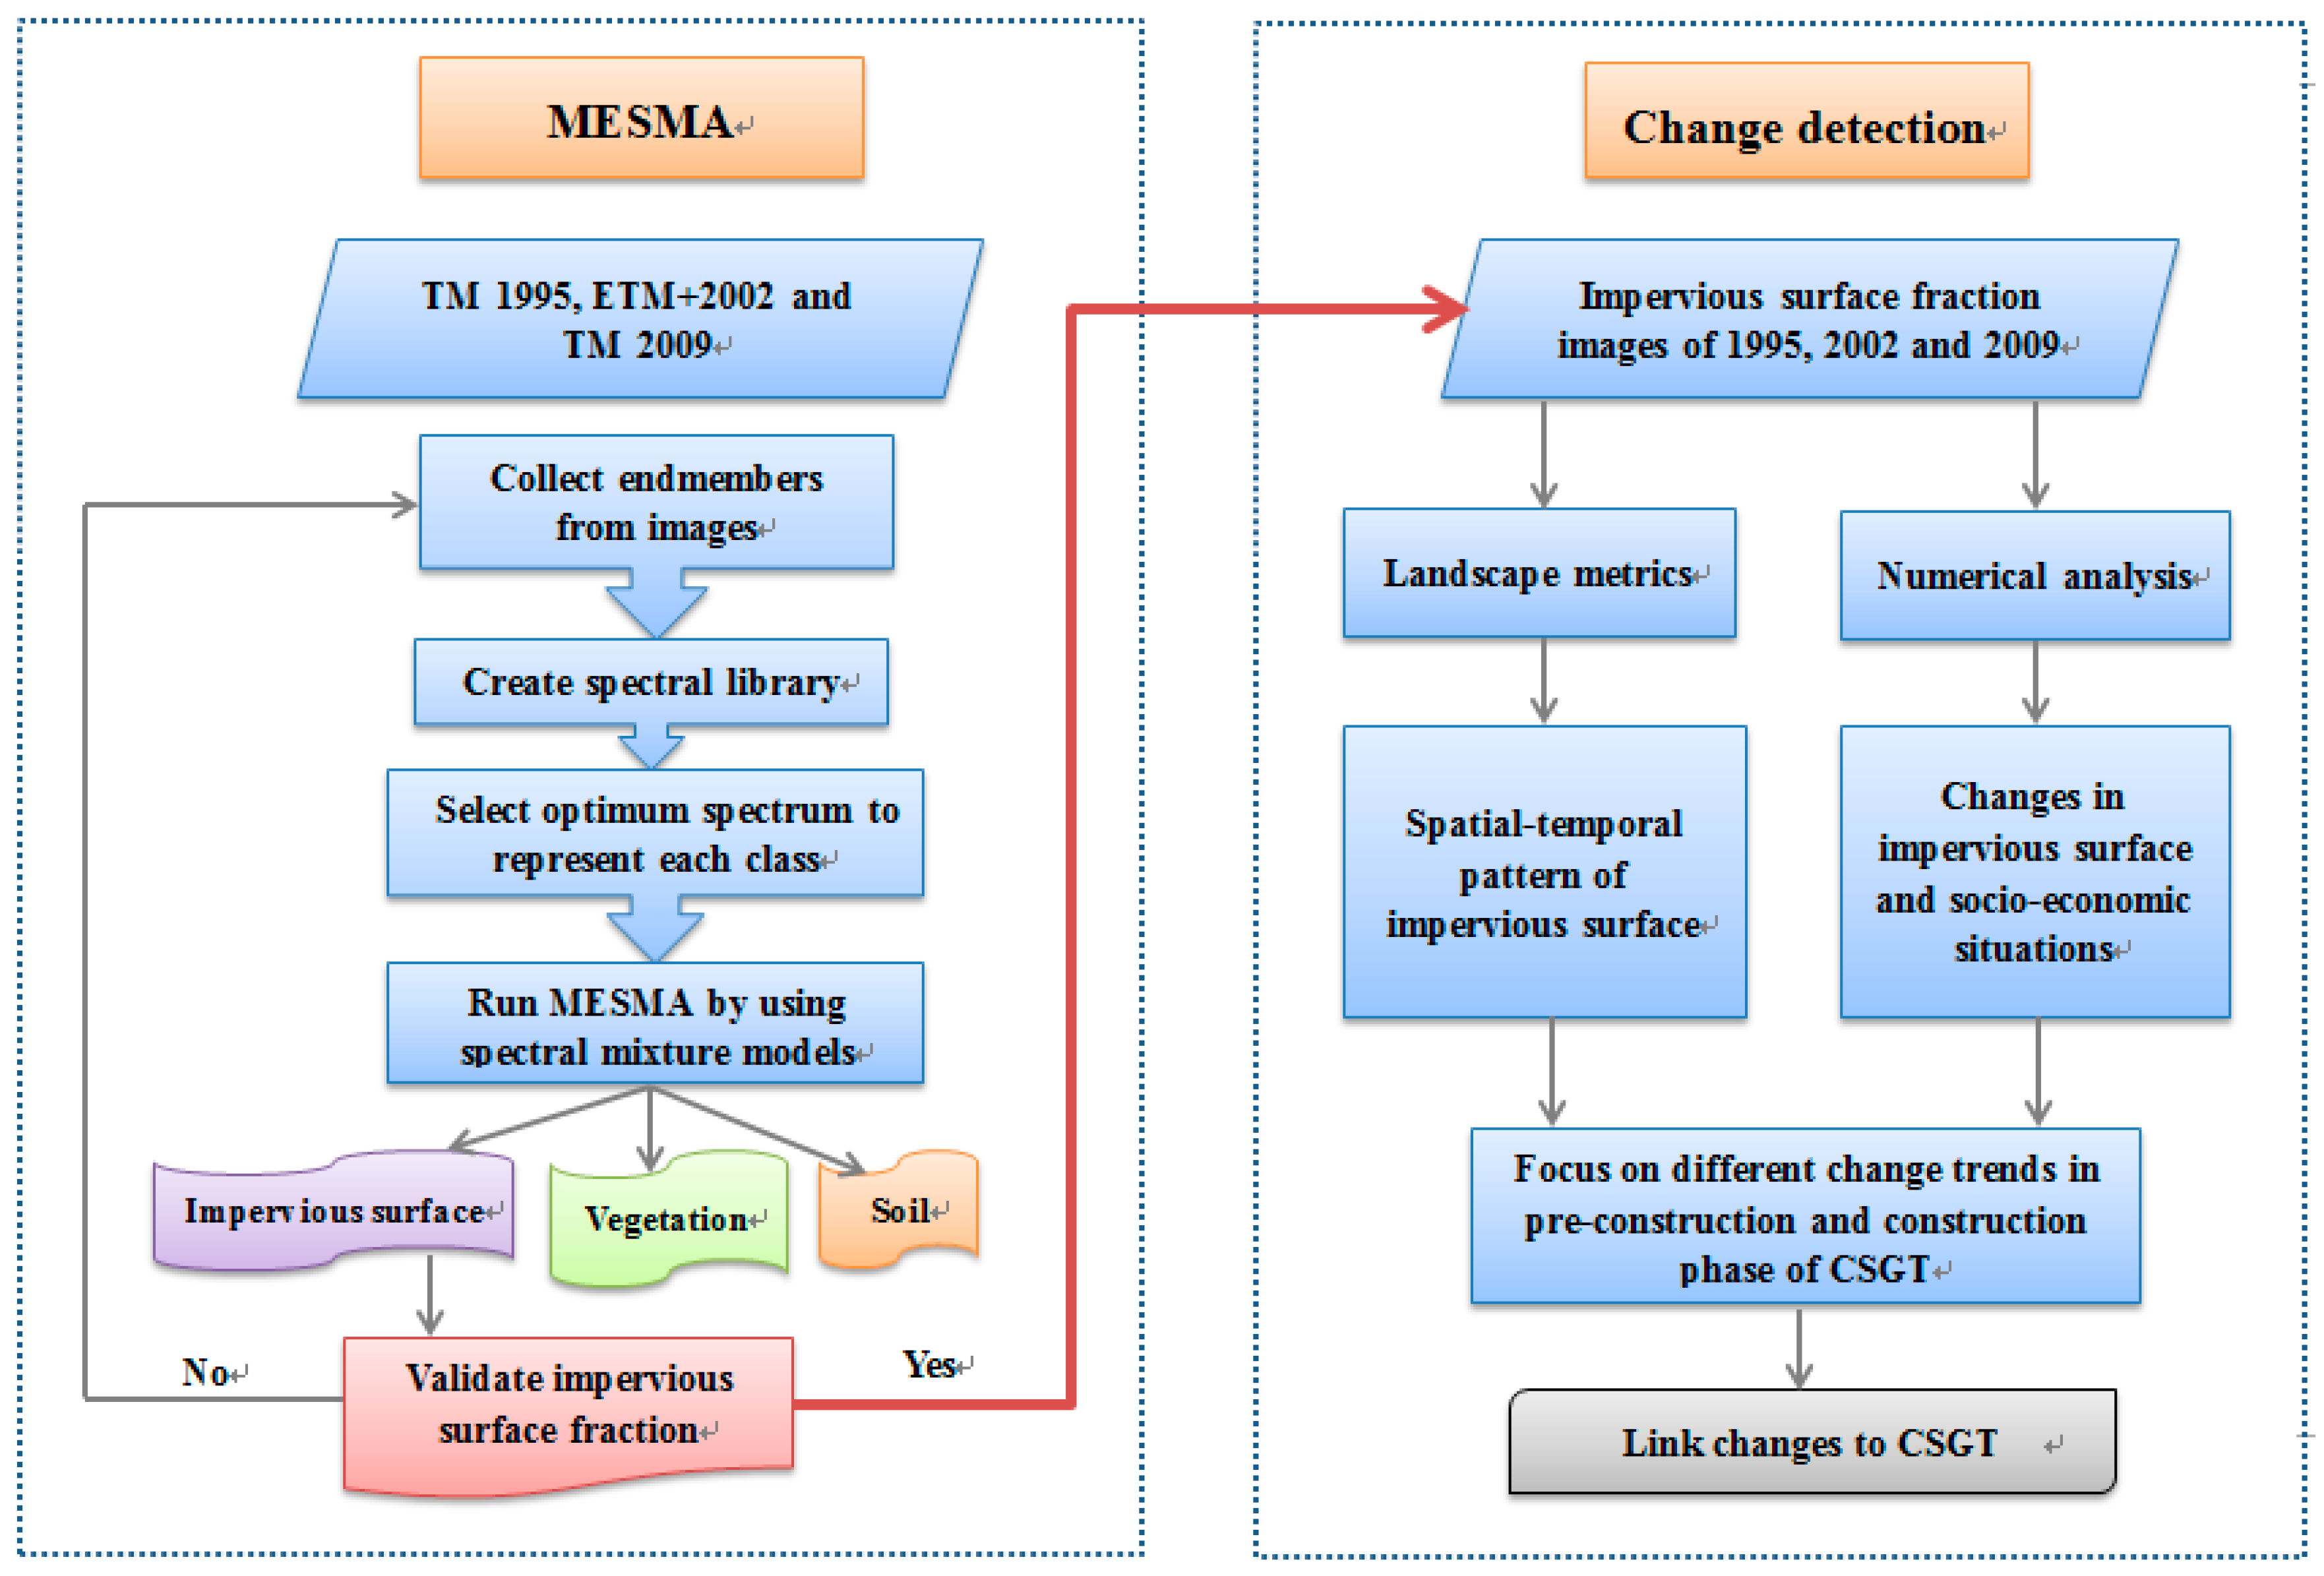
Multiple endmember spectral mixture analysis (MESMA) and landscape metrics can be used to quantify impervious surfaces and detect the adverse consequences of CSGT on the environment over time [15,16,17]. MESMA can effectively measure the expansion and densification of impervious surfaces and the degree of urbanization because the approach is based on impervious surface fractions (ISFs) derived from remotely-sensed imagery [18,19,20]. This method provides estimates of the impervious surfaces at the sub-pixel level and minimizes the impacts of mixed pixels [14]. Furthermore, landscape metrics can explain the spatial structures and patterns of landscapes because they account for spatial information, such as location, distance, direction, and linkage [15,21].
Methods for identifying impervious surfaces via remote sensing, such as MESMA and landscape metrics, have been used in two different ways. In the main approach, MESMA has been used for urban growth analyses, impact assessments, and policy evaluations [14,16,20]. Additionally, a considerable number of studies have integrated remotely-sensed data and landscape metrics to analyze the negative effects of ground transportation, such as fragmentation, loss of biodiversity, and creation of edge habitats [22,23,24]. However, few studies have explored the combined application of MESMA and landscape metrics to analyze the impacts of CSGT, such as sea bridges, on changes in impervious surfaces.
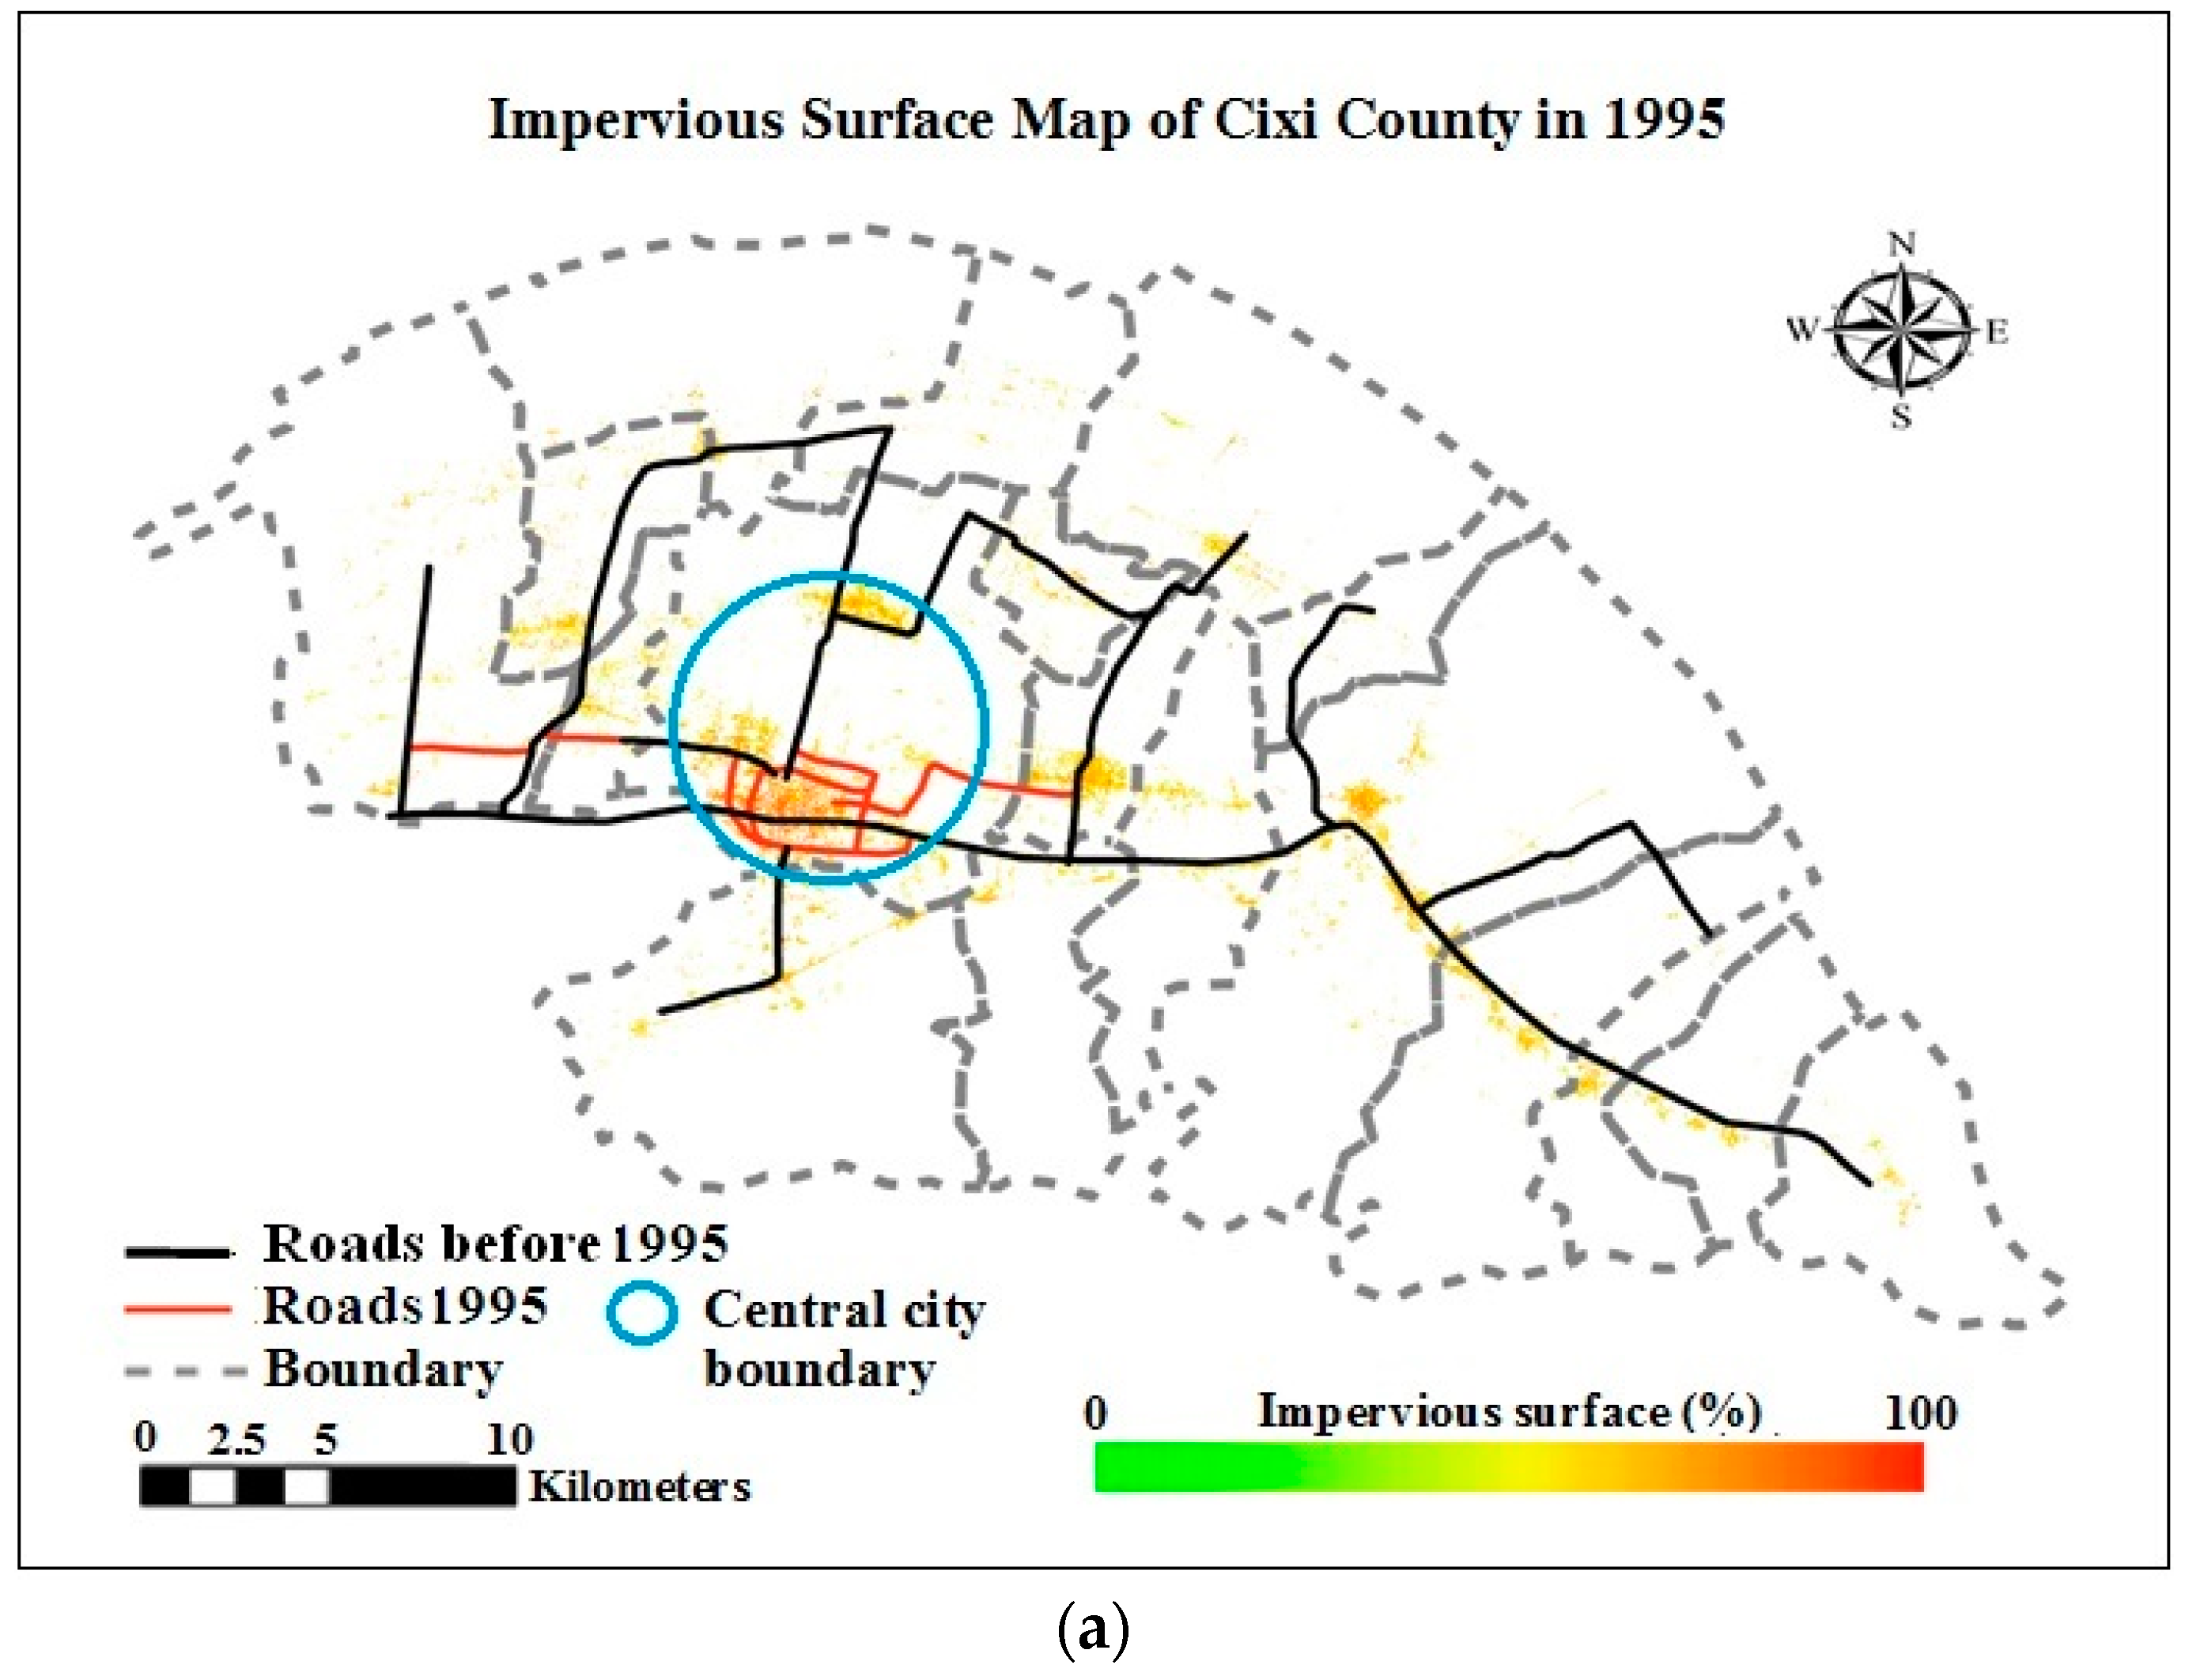
This study investigated the potential impacts of CSGT on the growth of impervious surfaces by combining MESMA and landscape metrics. A historical analysis from 1995 to 2009 was based on ISFs from the Landsat archive. In this paper, we apply this approach to examine the spatial and temporal dynamics of impervious surfaces in the pre-construction (1995–2002) and construction phase (2002–2009) of the Hangzhou Bay Bridge, as a representative of CSGT. The objectives of this paper are as follows: (1) demonstrate the ability of MESMA to monitor the impacts of the Hangzhou Bay Bridge on impervious surface changes; (2) quantify the impacts of the bridge on impervious surface structures using landscape metrics; and (3) analyze the effects of the bridge on the intensity and extent of impervious surfaces.
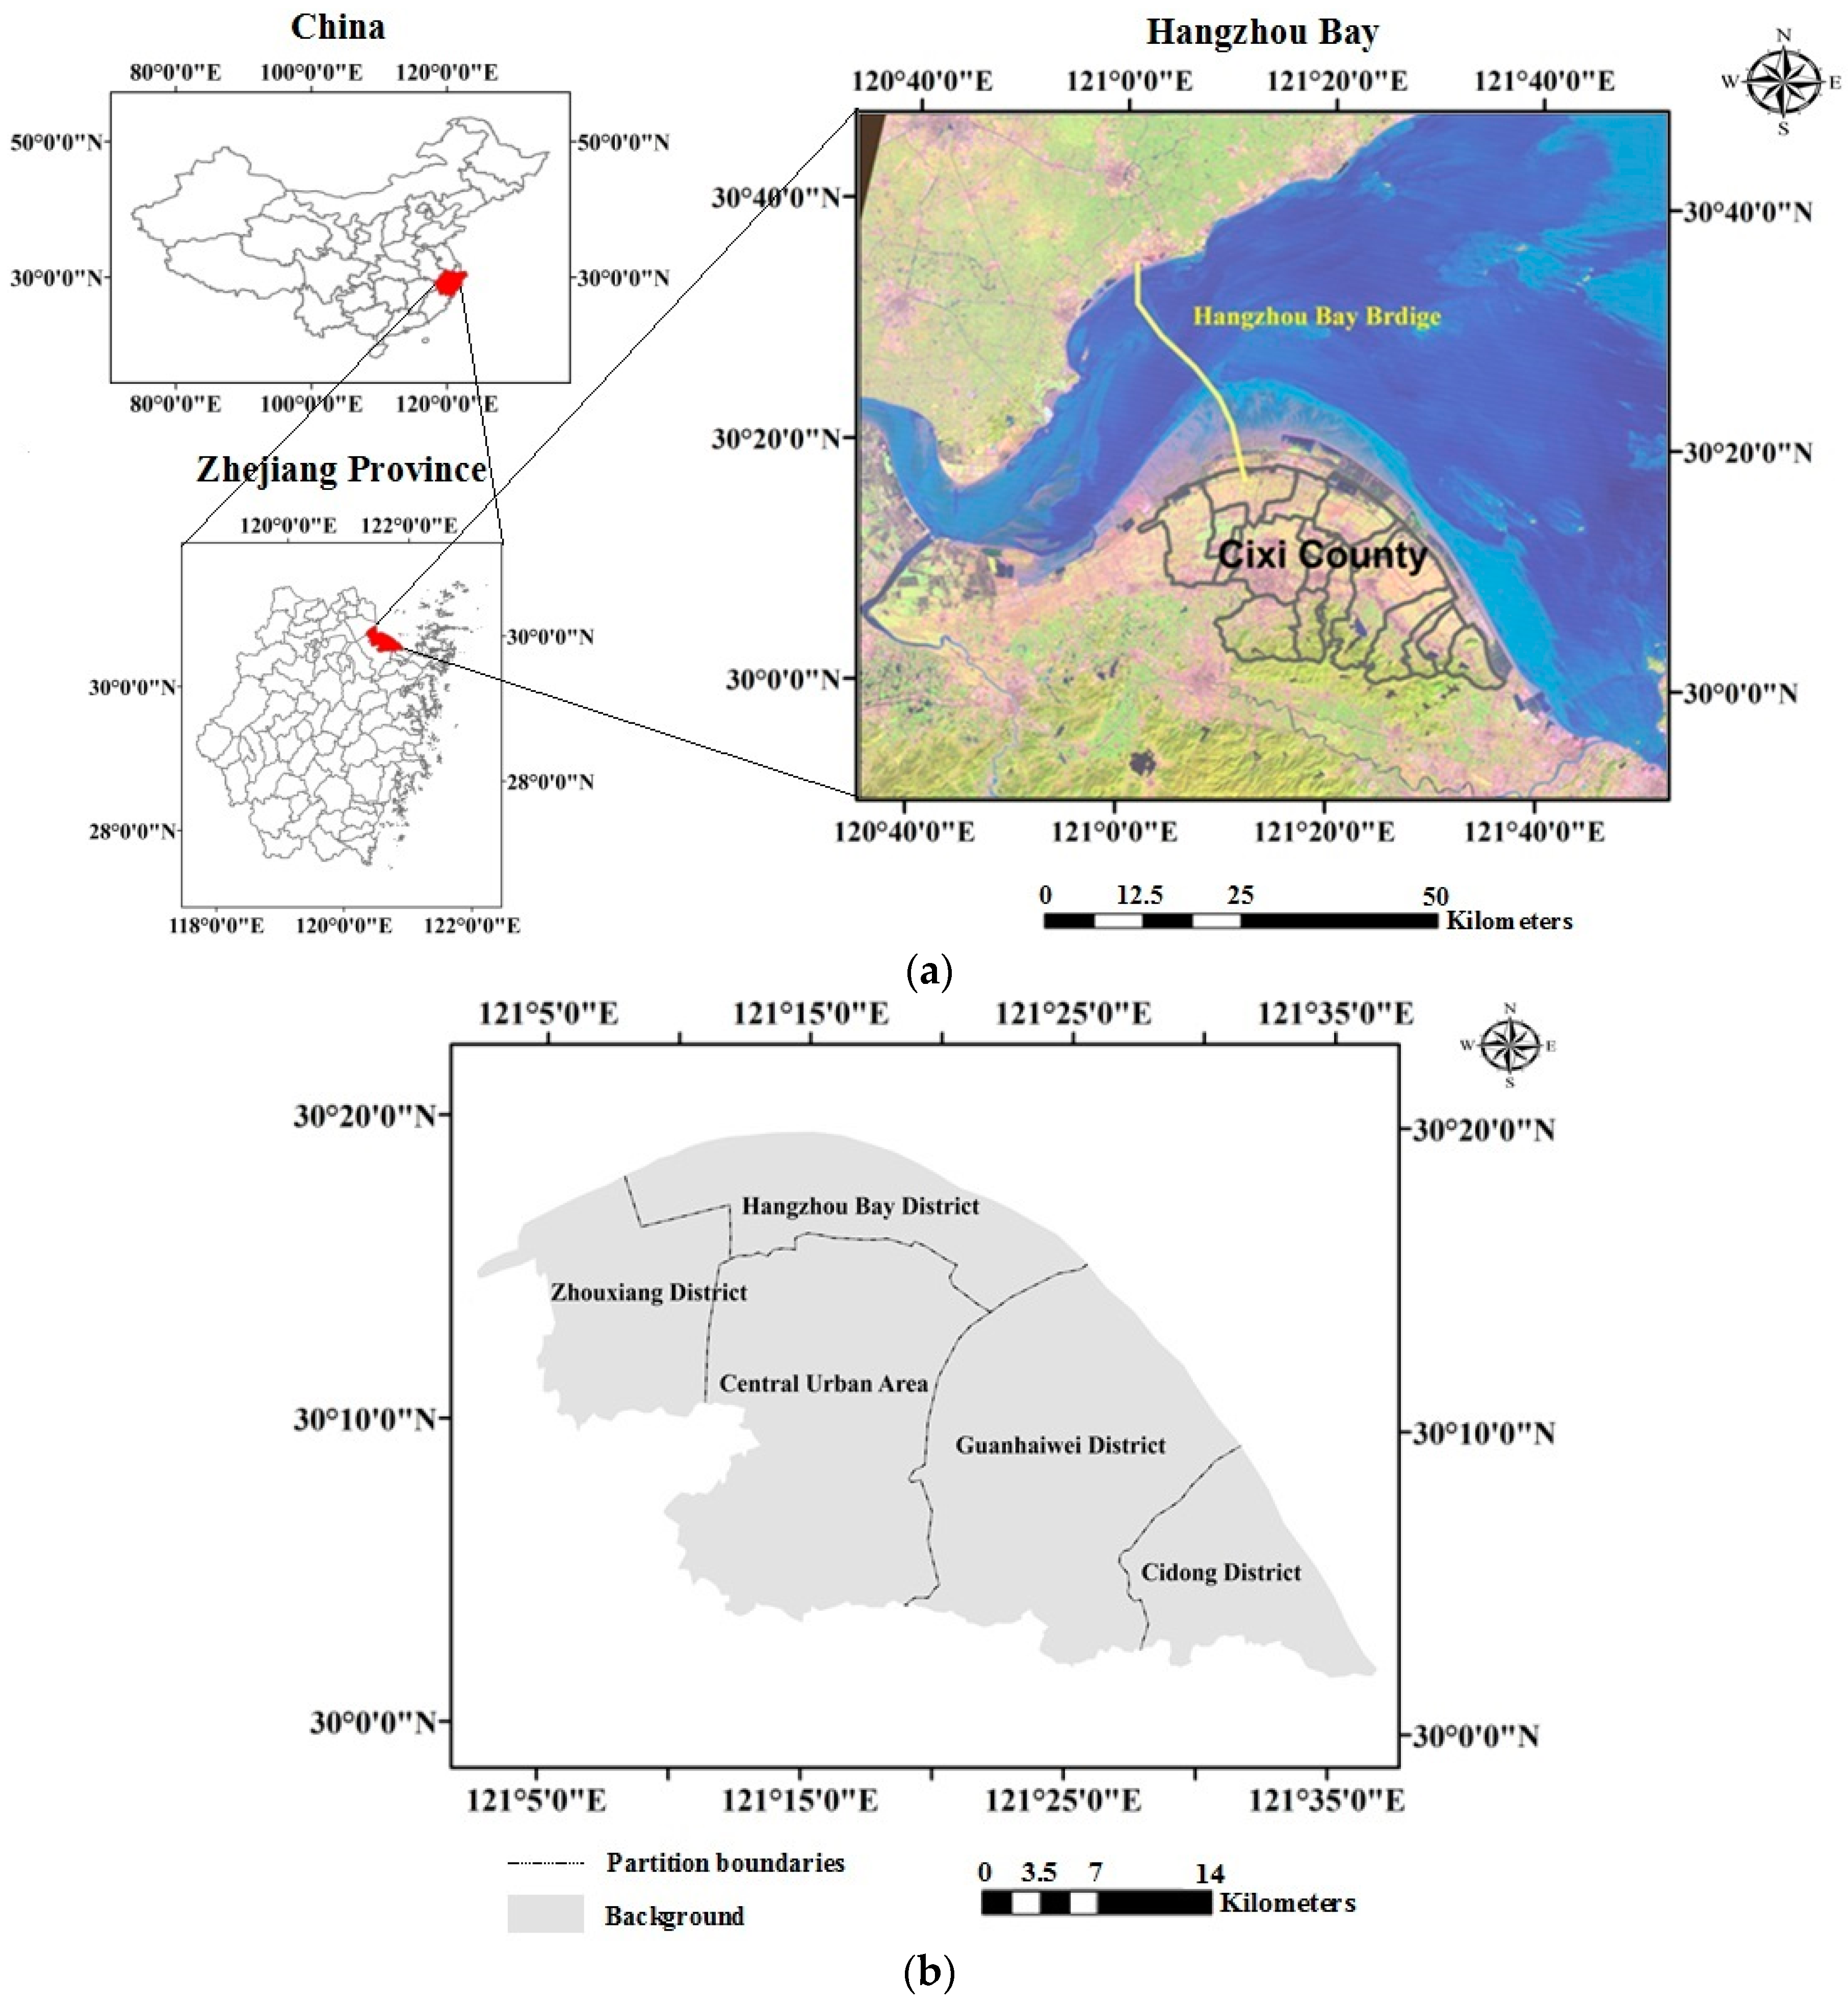
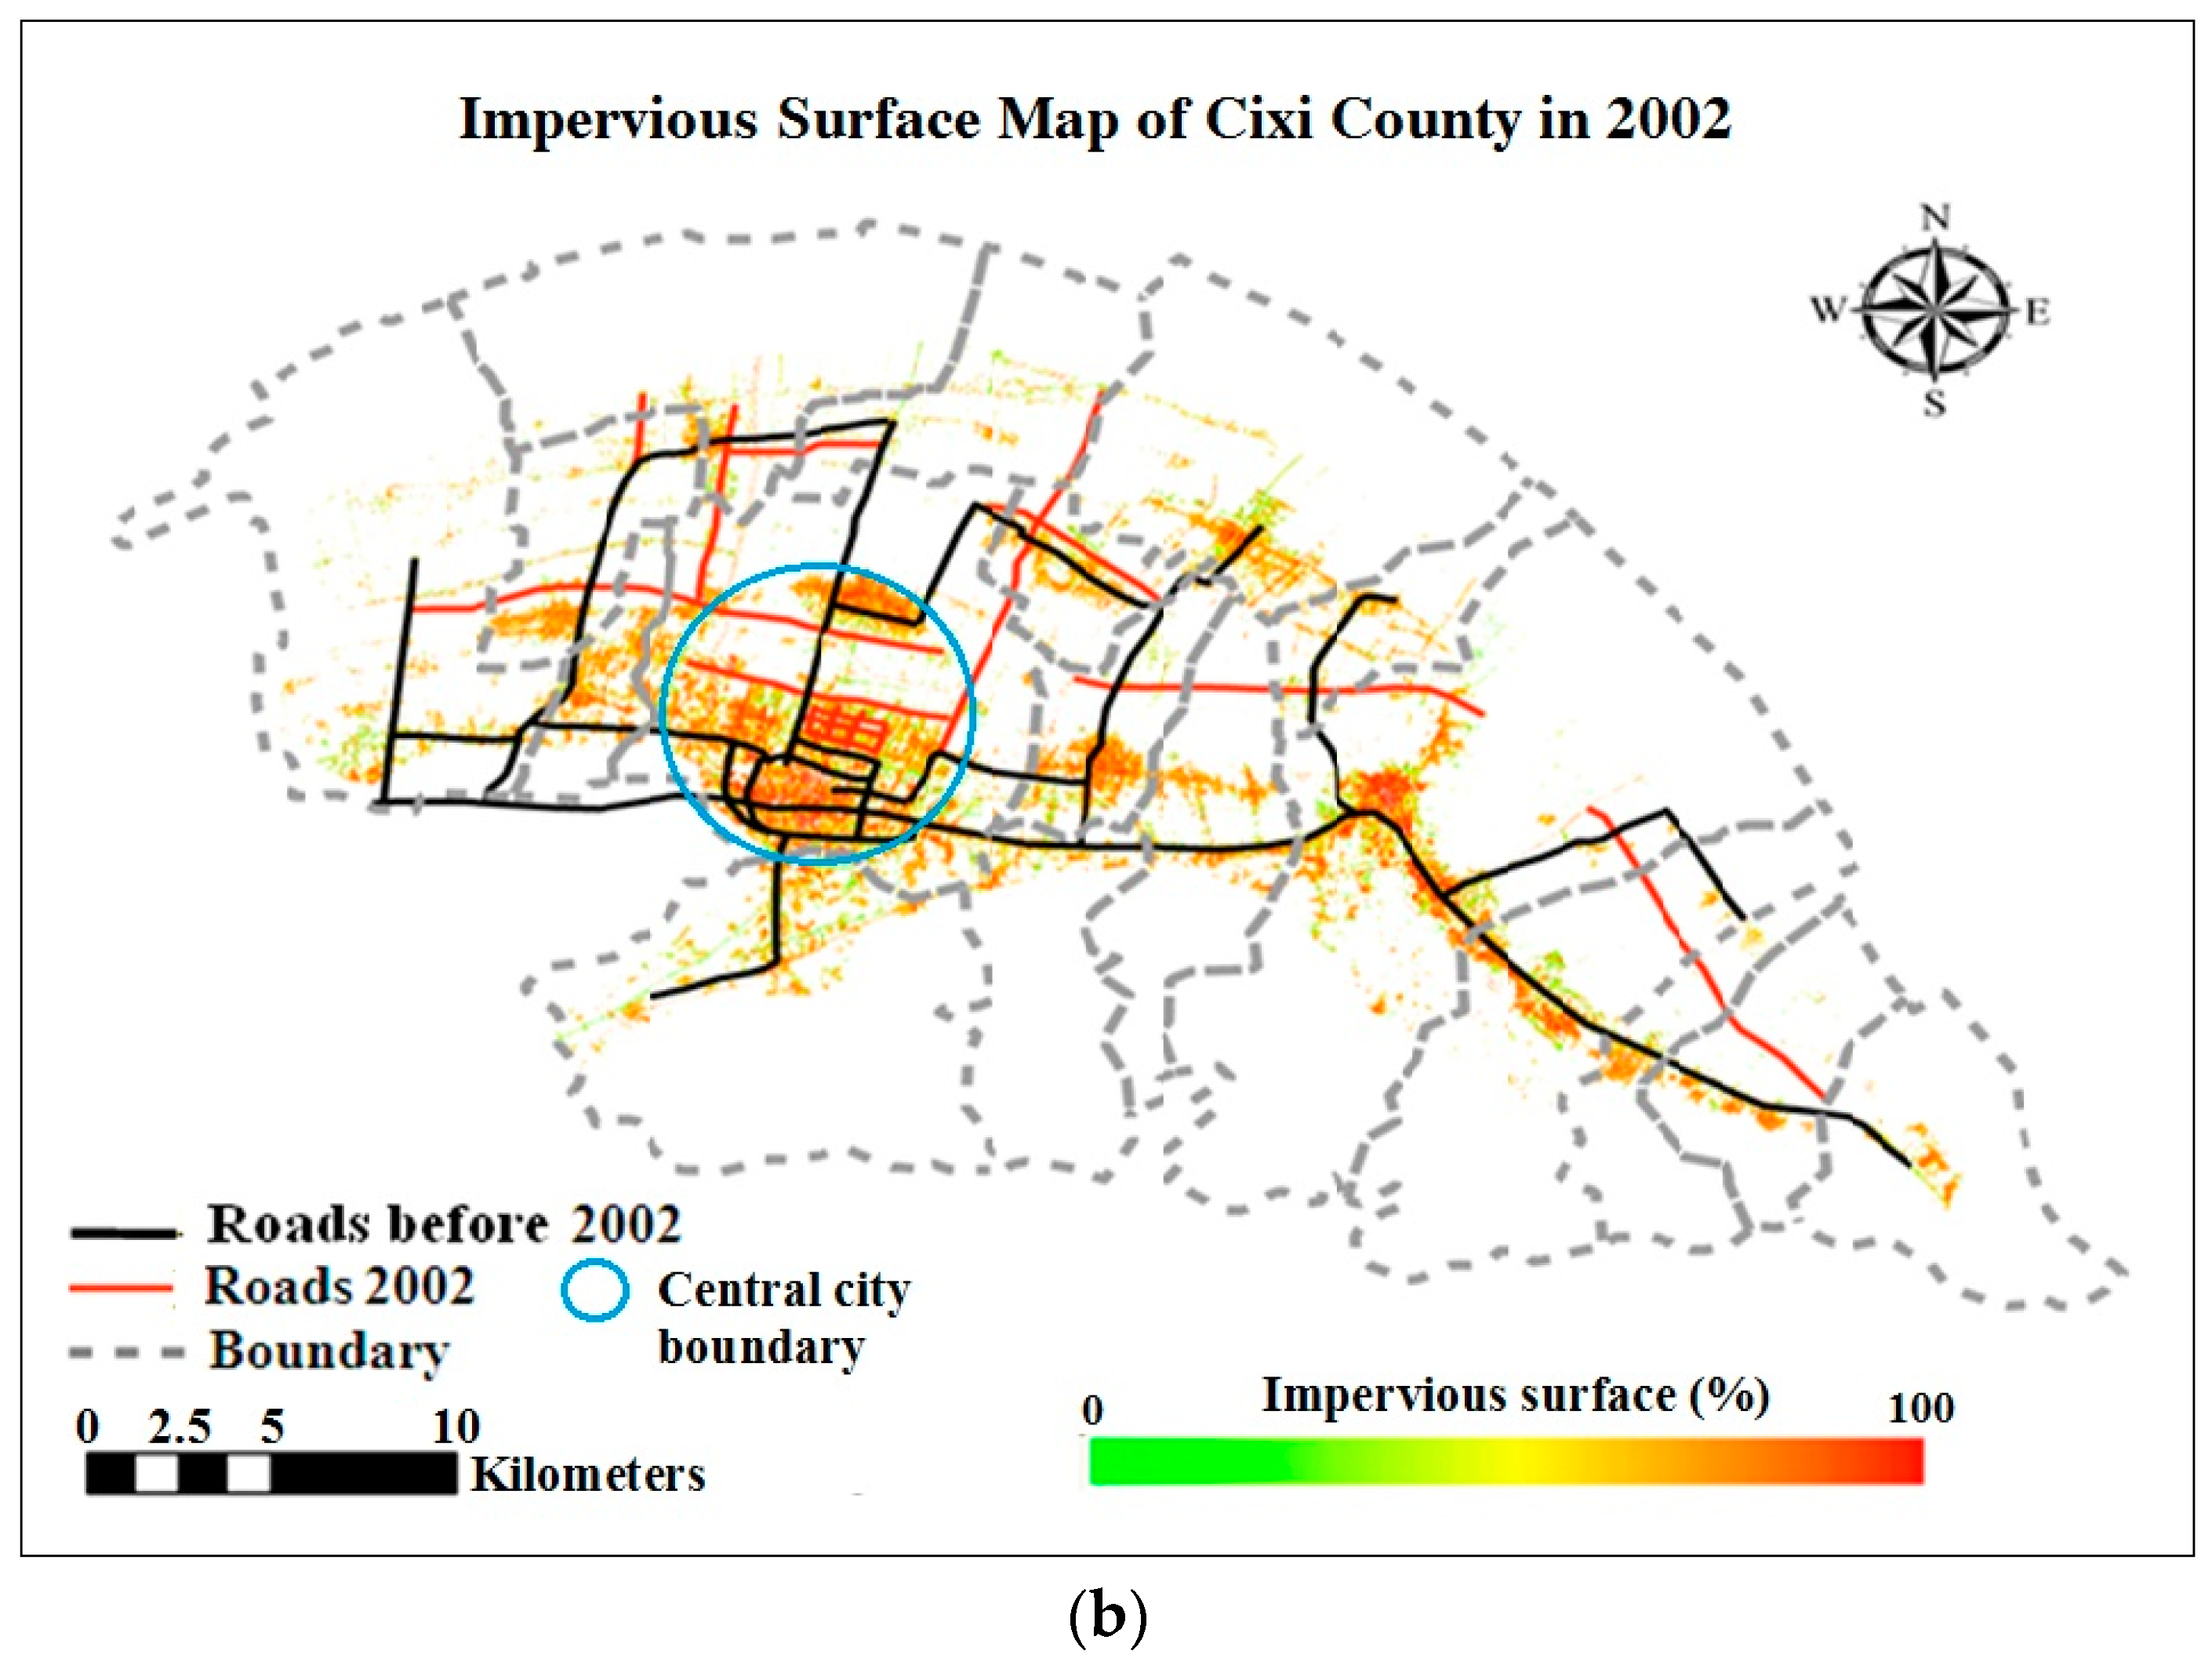
It is worth noting that it would be difficult to separate the impacts of ground transportation factors, such as the Hangzhou Bay Bridge, from other factors when assessing changes in urban impervious surfaces. To minimize this problem, we selected Cixi County, Ningbo, Zhejiang Province, as our study area because part of the bridge is located in this county. The county is isolated by mountains and the sea and, prior to the construction of the Hangzhou Bay Bridge, it had not received large-scale infrastructure investment. Therefore, the study assumed that the construction and opening of the Hangzhou Bay Bridge accelerated the growth of impervious surfaces.
The following subsection supplies a brief introduction to CSGT in China. In Section 2, we present the study area, data, and methodology. Section 3 and Section 4 provide the results and discussion, respectively. The conclusions are then presented in Section 5.

1.2. Brief Background on Chinese Sustainable Ground Transportation (CSGT)

Ground transportation networks have been identified as one of the most important drivers of rapid industrialization and urbanization in China [25,26]. The transportation corridors were initially inadequate in the People’s Republic of China. However, China has concentrated on efficient and modern transportation systems since 1978, specifically expressways, high-speed trains, and cross-sea bridges. In this context, CSGT has facilitated sustainable economic and urban growth in China.
Road networks are convenient and flexible means of transportation, and they connect cities, airports, harbors, and railways. Recently, China has rapidly developed its expressways. According to [27], China began constructing its first motorway, the Shenyang Dalian Expressway, in 1984. Widespread expressway construction in China began in the early 1990s. At that time, the total length of expressways was 271 km, and the total expressway length in China reached 2141 km in 1995. China built a 5583 km expressway in 2002, increasing the total expressway length to 25,200 km. By the end of 2009, the total expressway length had increased to 651,000 km [28,29].
With the rapid development of China’s economy, the scale and technical level of Chinese railway construction has continuously improved. China’s railway length is 76,580 km, ranking third in the world (after the United States and Russia) and first in Asia [30]. Additionally, China has developed high-speed railways based on the “11th five-year plan”. In 2008, China began operating its first high-speed railway, which was named the Beijing-Tianjin intercity railway. By the end of 2011, the total length of China’s high-speed railways had increased to more than 10,000 km [31].
Additionally, China has constructed long-distance cross-sea bridges to accelerate economic growth in coastal cities. The most important bridges are summarized in Table 1. The starting point of the Qingdao Bay Bridge is a national high-speed highway that connects Qingdao and Lanzhou. This bridge is part of the “five vertical, four horizontal and one ring” highway network in Shandong Province [32] and is the world’s second longest cross-sea bridge [33]. The Hangzhou Bay Cross-sea Bridge extends southward from Jiaxing to Cixi [34]. Zhoushan Sea-crossing Bridge connects Hangzhou Bay Bridge with the ring road in Ningbo and has a total length of 50 km [35]. Finally, the East Sea Bridge connects Shanghai’s Luchao Port and Shengsi County in Zhejiang Province [33].
The Hangzhou Bay Bridge is the third longest ocean-crossing bridge in the world, spanning Hangzhou Bay in the East China Sea, crossing the Qiantang River at the Yangtze River Delta, and connecting Shanghai to Cixi County. The bridge shortened the ground transportation distance from Ningbo to Shanghai by 120 km and reduced the travel time from four hours to two and a half hours. During its first year of operation (i.e., from May 2008 to May 2009), approximately 50,000 vehicles used the bridge daily. The bridge is expected to improve communication and the development of the bay [36]. In addition, the bridge will reduce transportation costs, decrease travel time, and reduce traffic accidents, saving 44.37 billion RMB during the first 20 years of operation [37].

2. Study Area, Data Preparation, and Methodology

2.1. Study Area

This study focused on Cixi County in Ningbo, Zhejiang Province, China, where part of the Hangzhou Bay Bridge is located. Cixi County is located on the southern shore of Hangzhou Bay between longitudes 121°02′ E and 121°42′ E and latitudes 30°02′ N and 30°24′ N (Figure 1a). Cixi County has a total area of 1154 km2 (excluding the sea area), and this region is characterized by a subtropical monsoon climate, with an average annual temperature of 16.0 °C and an average annual rainfall of 1272.8 mm. Topographically, it is high in the south and low in the north, changing from hills to plains and beaches toward Hangzhou Bay. Cixi is an important industrial and commercial city in the greater Shanghai economic region of the Yangtze River Delta. Since the completion of the bridge in 2008, the favorable geographic location of Cixi has made it become a gold node city on the southern Yangtze River Delta.

2.2. Data Preparation

The following Landsat TM/ETM+ images were used to perform the study over a 14-year interval: a LANDSAT 5-TM image from 13 September 1995; a LANDSAT 7-ETM+ image from 11 November 2002; and a LANDSAT 5-TM image from 10 October 2009.
These data were previously radiometrically and atmospherically corrected [20].
Road maps were extracted from visual inspection and digitization of satellite data combined with a transportation map of Cixi County in 2003. In addition, socioeconomic statistics in 1995, 2002, and 2009 were derived from the Ningbo Statistical Year Books [38] and the Zhejiang Statistical Year Books [39].

2.3. Methodology

The proposed algorithm consists of two sequential phases, as shown in Figure 2: (1) estimating the amount of impervious surfaces at the sub-pixel level using MESMA and (2) change detection involving landscape metrics and numerical analysis.

2.3.1. Estimating the Amount of Impervious Surface within a Pixel

Based on the complexity of city features and the characteristics of spectral variability, the traditional method of spectral mixture analysis (SMA) may not fully satisfy the requirements of studying urban growth dynamics. MESMA, an extension of the SMA method, may solve this technical problem. In MESMA, each pixel’s spectrum is the linear sum of N pure spectra or endmembers, and the number and types of endmembers can vary from one pixel to another [40]. Therefore, MESMA can effectively address mixed pixel problems in complicated urban environments. Many previous studies have demonstrated the applicability of MESMA to the study of coastal salt marshes [41], Amazonia [40], and urban regions [16,18,20,42,43]. However, few studies have performed sub-pixel change detection using MESMA in the context of CSGT [44].
MEMSA includes three sequential steps: endmember selection, optimization and modeling. In this case study, MESMA was implemented following the procedure reported in [45]. First, based on the V-I-S (vegetation-impervious surface-soil) conceptual model [46], three endmembers—impervious surfaces, vegetation cover, and soil—were separately selected from Landsat images from 1995, 2002, and 2009. Then, a spectral library was constructed from the selected endmembers. Second, we implemented three optimization techniques to determine the spectrum within a spectral library that best represented the characteristics of the associated class variability [45]. These three optimization techniques included count-bsed selection (CoB), endmember average root mean square error (EAR), and minimum average spectral angle (MASA). The criteria used to select the optimum spectrum for each endmember were as follows: the highest CoB, lowest EAR, and lowest MASA [20,43]. Third, the MESMA method was executed using a range of spectral mixture models after construction of the optimum library. Finally, the best single model for each pixel was selected based on the minimum value of the root mean square error (RMSE), which was 0.025. The RMSE value was based on research on Cixi County [20,43]. Three fractional images were generated by the optimal models for each Landsat image: an impervious surface image, a soil image, and a vegetation image. The impervious surface fraction (ISF) images from the different periods were used to analyze urban development.
Given the focus of this paper on change detection and impact assessment, further information regarding the calculation of impervious surfaces based on MESMA can be found in the VIPER TOOL user manual [45] and relevant papers [18,20,40,43].
An accuracy assessment was performed using error matrices built from 300 stratified-random samples from each ISF image, with overall accuracies of 93.33% in 1995, 92.67% in 2002 and 90.33% in 2009.

2.3.2. Landscape Metrics at the Pixel Level

In this study, spatial metrics at the pixel level were used to analyze the spatial structure and morphological characteristics of impervious surface growth with respect to the construction of the Hangzhou Bay Bridge. Metric selection was based on the ability to depict the evolution of urban forms, as demonstrated in previous studies [15,22,23,24,47]. In practical terms, the degree of landscape fragmentation can be expressed by the number of patches (NP), Euclidian mean nearest-neighbor distance (ENN-MN) and percentage of like adjacencies (PLADJ); the landscape complexity can be represented by edge density (ED); and the dominant landscape can be measured using largest patch index (LPI) (Table 2).
Prior to calculating the landscape metrics, thematic maps of impervious surfaces were generated using a thresholding technique. First, all values less than 0.0 and greater than 1.0 were removed from each impervious surface fraction image. Then, all impervious pixels between 0.0 and 1.0 were classified as impervious cover. Finally, each thematic map was imported into FRAGSTATS 3.3 [48] to calculate the landscape metrics.

2.3.3. Numerical Analysis of Impervious Surfaces and Socio-Economic Situation

The numerical analysis provided an auxiliary analysis of the impact of the Hangzhou Bay Bridge on impervious surface growth in Cixi County. First, we performed a numerical analysis of impervious surface growth in the five districts of Cixi County. The scope of each district was based on the spatial partition map shown in Figure 1b. Note that districts refer to large blocks; therefore, the scope of the central city is less than that of central urban area. According to the spatial partitions, we extracted impervious surfaces in different districts using the spatial analyst tools in ArcGIS 9.3 (ESRI, Redlands, CA, USA). Then, the area and density of impervious surfaces in each district were calculated and compared. This analysis focused on illustrating the different impacts of the construction of the Hangzhou Bay Bridge on urban development in the five districts within the county.
Another numerical analysis compared socioeconomic index and impervious surface trends in Cixi County. This analysis focused on graphically linking different socioeconomic factors and impervious surface changes based on the convenience condition of the Hangzhou Bay Bridge. Eight indexes were selected to represent two demographic aspects (non-agricultural population and number of practitioner), two economic aspects (GDP and the amount of actual use of foreign capital) and four transportation dimensions (road mileage, civilian cars, passenger capacity, and volume of freight traffic).

3. Results

3.1. Expansion and Densification of Impervious Surfaces

In 1995, Cixi County was dominated by non-impervious surfaces, which accounted for 87% of the total area (Table 3). In contrast, the impervious surface area covered only 6665 ha, merely 13% of the total area. Therefore, Cixi County was largely an agricultural area, and urban development was still in its initial stages at that time. From 1995 to 2009, urbanization progressed at a rapid speed. Consequently, the area of impervious land increased to 9829 ha. This increase was mainly due to the conversion of pervious lands, resulting in the loss of approximately 21% of the total area during the study period. In 2009, the impervious surface area increased to 16,494 ha, more than twice that in 1995. In other words, impervious surfaces grew by 3539 ha from 1995 to 2002, while in the second period (2002–2009), they expanded drastically by 6290 ha (Table 3). Additionally, the average density of impervious surfaces (%) in 2009 was vastly different than the densities in the other years (Figure 3). This change indicated that the rapid expansion of impervious surfaces mainly occurred between 2002 and 2009, when the bridge was under construction. In addition, the rate of impervious surface development in Cixi County outstripped the rate of population growth in both periods.
A visual inspection of impervious surface fractions confirmed that the area and density of impervious surfaces in 2009 were higher than the areas and densities in 1995 and 2002 (Figure 4 and Figure 5). The fractional abundance of impervious surfaces is represented by the continuous color strip. The growth patterns of urban areas in Cixi County can be shown by the impervious surface fraction, illustrating the finer features of urban coverage. Some changes can be readily observed in the maps, as shown by the increased brightness of the impervious surface fraction and the regional expansion of impervious surfaces between 1995 and 2009. Densification was observed in the central city, while expansion was detected along major roads.
The increases in impervious surfaces after 2002 suggested a new pattern of urban development along major roads in the county (Figure 6). In general, land use is more stable as the distance from roads increases [49]. Our investigation also confirmed that the density of land development was stable as the distance from roads increased in Cixi County from 1995 to 2002; however, this pattern changed between 2002 and 2009. Not only was land development concentrated near roads (within approximately 250 m) but also urban growth occurred at distances far from roads between 2002 and 2009 (Figure 6).

3.2. Spatial and Temporal Patterns of Impervious Surfaces

Landscape metrics were used to quantify the temporal and spatial properties of impervious surface development (Table 4). In Cixi County, the number of patches (NP) decreased dramatically between 1995 and 2002, as individual development cores grew together to form larger, more fragmented patches. After 2002, NP increased due to urbanization between the individual and fragmented patches. As demonstrated by ENN-MN and PLADJ, impervious surfaces became more compact via the infilling of vacant lands between urban patches, reflecting coalescence [24] or compact growth. One example of this infilling process is visible in Figure 7, which includes impervious surface images of the central city in 1995, 2002, and 2009. Blue arrows indicate non-built-up areas in 1995 and 2002 that became impervious cover in 2009. These areas were surrounded by substantial urban development in 1995 and 2002 and infilled by 2009.
The increase in LPI reflected the spatial growth of the urban core and increased connections between individual urban patches and the central city. The urbanization rate within the historic urban core was slow during bridge construction (2002–2009), when LPI increased by only 447. This trend suggests that most urban expansion took place around the historic urban core, forming a new, larger central city. Additionally, it reflects the compact growth of impervious surfaces in Cixi County during this period. This conclusion is confirmed by visual interpretation of Figure 7 (the blue circles).

3.3. The Different Impacts of Hangzhou Bay Bridge on the Growth of Impervious Surface and Social Economy

The first numerical analysis of impervious surface growth in Cixi County suggested that the Hangzhou Bay District experienced the most substantial urban development between 2002 and 2009. Table 5 and Figure 8 show that although the Central Urban Area and Guanhaiwei District had large impervious surface areas, the Hangzhou Bay District and Zhouxiang District (i.e., the areas surrounding the Hangzhou Bay Bridge) exhibited high average annual growth rates (AAGR) of impervious surfaces from 1995 to 2009, especially from 2002 to 2009. Hangzhou Bay District had the fastest impervious surface expansion, with an AAGR of 18.67%, as the area of impervious surfaces increased by 1168.47 ha from 2002 to 2009. Moreover, Zhouxiang District, Central Urban Area and Guanhaiwei District had high densities of impervious surfaces with moderate AAGRs over the entire period (Table 6). Hangzhou Bay District had a low density of impervious surfaces in 1995 at 55.69%; however, the district increased in density to 64.28% in 2002 and to 69.89% in 2009, respectively, reflecting the highest AAGR of 1.64% (Table 6).
The change trend comparison of social economy and impervious surfaces in Cixi County revealed that impervious surfaces and socio-economic indexes exhibited similar trends of rapid growth, especially from 2002 to 2009. The non-agricultural population and number of practitioners both exhibited steady growth throughout the study period, with low AAGRs of 3.53% and 3.24%, respectively. The population growth rate was clearly less than that of impervious surfaces between 2002 and 2009 (Figure 9a,b). In the context of economy, GDP and the amount of actual use of foreign capital both exhibited dramatic increases, mainly from 2002 to 2009 (AAGRs of 14.43% and 20.61%, respectively, during the study period). Additionally, the growth rates of these two economic indexes exceeded the growth rate of impervious surfaces from 2002 to 2009 (Figure 9c,d). Finally, Cixi displayed gradual increases in the passenger capacity and volume of freight traffic, which were consistent with the trend of impervious surface growth (Figure 9g,h). However, Cixi had particularly evident increases in road mileage and the number of civilian cars, with AAGRs of 8.10% and 24.19%, respectively. These growth rates have been significantly larger than that of impervious surfaces since 2002 (Figure 9e,f).

4. Discussion

4.1. Application of Methods

A considerable number of studies have used conventional classification (e.g., SVM classifier) and change detection (e.g., post-classification) techniques to analyze the impacts of transportation on land cover and land use changes [23,50,51,52,53,54,55]. Although these approaches have proven effective, to some degree, when applied to remotely-sensed data, such methods may have limitations. In these techniques, each pixel is assigned a single land cover class [56]; therefore, change detection can only quantify interclass conversion, resulting in incomplete analysis of urban landscape dynamics [57]. The proposed indicator, the impervious surface fraction (ISF) derived from MESMA, can be used to effectively analyze development patterns in urban regions because it predicts the proportions of urban classes within each pixel, providing a more informative and appropriate representation of urban cover. Potential uses of the additional information in our ISF images are substantial, such as assessing sub-pixel changes in urban regions, identifying increased density of impervious surfaces, documenting the expansion of impermeable cover and linking this index with other factors (such as climate, environment, and policy).
In this study, the combined application of MESMA and landscape metrics was superior to using only one of the techniques. Change detection based on these two methods enables us not only to obtain details of impervious surface growth in urban areas but also to characterize the spatiotemporal patterns of urban growth. Furthermore, incorporating impervious surface information enables us to efficiently analyze the potential impacts of CSGT on urban growth.

4.2. The Hangzhou Bay Bridge Promoted the Growth of Impervious Surfaces

This paper was an initial attempt at understanding the growth of impervious surfaces during the pre-construction (1995–2002) and construction (2002–2009) phase of the Hangzhou Bay Bridge. The results showed that the area and density of impervious surfaces in 2002–2009 were larger than those in 1995–2002. Additionally, the rate of impervious surface development in Cixi County was larger than the population growth rate, especially from 2002 to 2009. This trend suggests that urbanization is occurring at an accelerated rate and that the per capita consumption of land increased considerably over the seven years of bridge construction.
Our findings also indicate increases in the area and density of impervious surfaces along road networks, particularly from 2002 to 2009. Urban development may have caused clustering in areas with high transportation accessibility and promoted the intensive utilization of these lands [58,59,60], particularly near transportation segments connected to large infrastructure projects, such as the Hangzhou Bay Bridge. This impact of the bridge and road network on the spatial structure of the city is especially obvious in the suburbs, such as in the northern and eastern parts of Cixi County (Figure 4 and Figure 5).
Notably, the effect of the Hangzhou Bay Bridge and the connected road network in 2009 increased the growth of impervious surfaces and contributed to the compact growth pattern in the central city of Cixi County. Compact growth is one of the most significant approaches to smart growth, which aims to restrict urban sprawl and guide sustainable development by increasing building density and encouraging infill zoning and land management within urban regions [61]. It attempts to relieve the developmental pressure on lands around existing urban regions [51,62]. Additionally, in order to better achieve sustainable development, the full impacts and performances of sustainable transportation on smart growth should be evaluated in the future study.
The construction of the Hangzhou Bay Bridge may have accelerated the growth of impervious surfaces in Cixi County, particularly in the area surrounding the bridge, i.e., Hangzhou Bay District. This finding is consistent with the result of the numerical analysis of impervious surface growth at the district level in Cixi County, which suggested that Hangzhou Bay District had the highest rates of impervious surface expansion and densification during bridge construction (2002–2009) (Table 5 and Table 6). This explanation is supported by the development of the Hangzhou Bay New Zone in Hangzhou Bay District. In 2009, the Hangzhou Bay New Zone encompassed 35 km2 and has since expanded. In this zone, 254 industrial projects have been completed, and new companies are being established there each month [63]. Additional evidence of coastal reclamation in Hangzhou Bay District reflects the increased accessibility provided by the Hangzhou Bay Bridge, which has stimulated urban expansion. Since 2000, construction has occurred on 538.02 km2 of land in Ningbo, with Cixi, Ninghai, and Yuyao accounting for areas of 257.47 km2, 107.05 km2, and 66.07 km2, respectively [64].

4.3. A Socioeconomic Perspective on How the Hangzhou Bay Bridge Accelerated Urban Growth

The potential impacts of the Hangzhou Bay Bridge on urban growth can be reflected by the change trends in impervious surface and socio-economic indexes. The results of this study suggest that the Hangzhou Bay Bridge has significantly promoted the growth of impervious surfaces and social economy in Cixi County during bridge construction (2002–2009) (Figure 9). In terms of the population and economy, the Hangzhou Bay Bridge increased the non-agricultural population and number of practitioners (Figure 9a,b) due to labor-intensive industries transferring from Shanghai and other developed regions to Cixi, as well as human resources shifting from agricultural industries to industrial and service industries between 2002 and 2009. In addition, the Hangzhou Bay Bridge has stimulated a sharp rise in the GDP and brought considerable foreign investments to Cixi since 2002 (Figure 9c,d). This growth in capital flows may be derived from the new establishment of foreign companies and industrial transfer parks that were originally constructed in developed regions. This trend offset the limitations of land resources in developed regions and increased the impervious surface cover in Cixi County. Additionally, the development trend in Cixi is similar to that in the Western Pearl River Delta during construction (2009–2016) of the Hong Kong-Zhuhai-Macau Bridge [65]. In the context of transportation, the Hangzhou Bay Bridge has substantially increased the total road mileage, number of civilian cars and flows of passengers and goods, particularly from 2002–2009 (Figure 9e–h), thus creating essential conditions for urban sprawl to take place and increasing the area of impervious surfaces [58].

4.4. Policy Suggestions for Sustainable Urban Development

Although CSGT aims to shorten traffic distances; save energy, costs and time; and reduce the adverse impacts on the environment, CSGT itself and the growth of impervious surfaces are associated with eco-environmental effects that can diminish environmental sustainability. CSGT, particularly expressways and high-speed railways, separates previously large patches into fragmented patches, creating barriers to movement between adjacent life spaces [11]. Moreover, roads and automobiles have cumulative physical and chemical impacts on the environment, such as the spread of exotic species and emission of noxious gases [12]. Additionally, increases in impervious cover and runoff directly impact the transport of non-point source pollutants, such as pathogens, nutrients, toxic contaminants, and sediment to lakes, rivers, and the sea [8,9]. These processes inevitably alter in-stream and riparian habitats, resulting in the loss of critical aquatic habitats [66]. In addition, vegetation cover decreases as impervious surfaces increase, placing considerable pressure on natural resources and regional climates [13,14].
There is a considerable need to design a sustainable monitoring program that can evaluate the effects of CSGT on urban growth and ecological environments, creating a healthy urban development pattern that minimizes the adverse effects of transportation infrastructure and impervious surfaces and coordinates rapid urbanization and environmental sustainability. Based on our findings, we proposed a conceptual model (Figure 10) that is divided into two parts. The first part shows how the bridge is related to socioeconomic factors that affect impervious surface growth (landscape patterns) and result in environmental problems. The second part indicates the importance of sustainable monitoring policies that document short-term changes in impervious surfaces and the ecological environment, stimulating long-term patterns of sustainable urban development.

5. Conclusions

CSGT, such as sea bridges, can play a significant role in improving sustainable transportation systems and accelerating the urbanization process in China. In this paper, we investigated the impacts of CSGT on changes in impervious surfaces based on three objectives: (1) verifying the utility of MESMA for analyzing impervious surface changes; (2) quantifying impervious surface densification and expansion during the pre-construction (1995–2002) and construction (2002–2009) stage of the Hangzhou Bay Bridge; and (3) evaluating the effects of the bridge on impervious surface changes. In terms of the first objective, the results showed that MESMA allowed us to effectively analyze subtle changes in impervious surfaces.
In terms of the second objective, the results of MESMA indicated that the rapid growth of impervious surfaces (both expansion and densification) mainly occurred between 2002 and 2009. The calculated landscape metrics suggested that densification and expansion of impervious surfaces led to a compact growth pattern through the infilling of vacant lands in urban regions and outlier growth.
Finally, with respect to the third objective, a road buffer analysis revealed that impervious surfaces were concentrated along road networks connected to the Hangzhou Bay Bridge. The results of the first numerical analysis showed that Hangzhou Bay District exhibited the fastest growth rates of impervious surface area and density in Cixi County under the favorable conditions of bridge construction. The second numerical analysis demonstrated that Cixi County experienced considerable population, economic, and transportation evolution during the construction of the Hangzhou Bay Bridge (2002–2009), which was synchronous with the growth of impervious surfaces. However, increasing CSGT and impervious surface cover could diminish environmental sustainability. More policies and administrative measures should be implemented to guide sustainable social development.
Furthermore, the Hangzhou Bay Bridge may only be one of many factors influencing urban growth. Thus, any explanation that suggests the bridge is directly responsible for the expansion of impervious surfaces is an oversimplification. However, the bridge may promote the construction of additional transportation corridors and industrial zones and increase the population growth in the Yangtze River Delta Region. Therefore, further investigation, particularly modeling, is needed to explore the full impacts of the Hangzhou Bay Bridge or other CSGT on sustainable, environmentally-friendly, urban development.

Acknowledgments

The research presented in this paper was supported by the Technology Support Foundation, China (2006BAJ05A02). We offer our sincere thanks to James B. Campbell from Virgina University, Keith Clarke from University of California, Jie Song from Zhejiang University for their valuable comments on our paper. We also thank the anonymous reviewers for their constructive comments.

Author Contributions

Qing Zheng, Shan He, Zhoulu Yu and Ke Wang conceived and designed the experiments; Zhoulu Yu and Ke Wang were responsible for recruitment and follow-up of study participants; Lingyan Huang, Xinyu Zheng and Amir Reza Shahtahmassebi were responsible for data collection; Qing Zheng, Yi Pan and Zhangquan Shen carried out the analyses; Qing Zheng drafted the manuscript, which was revised by all authors. All authors read and approved the final manuscript.

Conflicts of Interest

The authors declare no conflict of interest.

References

  1. Cheng, J.; Turkstra, J.; Peng, M.; Du, N.; Ho, P. Urban land administration and planning in China: Opportunities and constraints of spatial data models. Land Use Policy 2013, 23, 604–616. [Google Scholar] [CrossRef]
  2. Kuang, W.H.; Liu, J.Y.; Zhang, Z.X.; Lu, D.S.; Xiang, B. Spatial temporal dynamics of impervious surface areas across China during the early 21st century. Chin. Sci. Bull. 2013, 28, 1691–1701. [Google Scholar] [CrossRef]
  3. Long, H.; Tang, G.; Li, X.; Heiling, G.K. Socio-economic driving forces of land-use change in Kunshan, the Yangtze River Delta economic area of China. J. Environ. Manag. 2007, 83, 351–364. [Google Scholar] [CrossRef] [PubMed]
  4. Lichtenberg, E.; Ding, C. Assessing farmland protection policy in China. Land Use Policy 2008, 25, 59–68. [Google Scholar] [CrossRef]
  5. Chen, C.H. Reshaping Chinese Space-economy through high-speed trains opportunities and challenges. J. Transp. Geogr. 2012, 22, 312–316. [Google Scholar] [CrossRef]
  6. Gan, L. Globalization of the automobile industry in China: Dynamics and barriers in greening of the road transportation. Energy Policy 2003, 31, 538–551. [Google Scholar] [CrossRef]
  7. Arnold, C.L.; Gibbons, C.J. Impervious surface coverage: The emergence of a key environmental indicator. J. Am. Plan. Assoc. 1996, 62, 243–258. [Google Scholar] [CrossRef]
  8. Brun, S.E.; Band, L.E. Simulating runoff behavior in an urbanizing watershed. Comput. Environ. Urban Syst. 2000, 24, 5–22. [Google Scholar] [CrossRef]
  9. Hurd, J.D.; Civco, D.L. Temporal Characterization of Impervious Surfaces for the State of Connecticut. In Proceedings of the ASPRS Annual Convention Denver, Denver, CO, USA, 23–28 May 2004.
  10. Esch, T.; Himmler, V.; Schorcht, G.; Thiel, M.; Wehrmann, T.; Bachofer, F.; Conrad, C. Large-area assessment of impervious surface based on integrated analysis of single-date Landsat-7 images and geospatial vector data. Remote Sens. Environ. 2009, 113, 1678–1690. [Google Scholar] [CrossRef]
  11. Reed, R.A.; Johnson-Barnard, J.; Baker, W.L. Contribution of roads to forest fragmentation in the Rocky Mountains. Conserv. Biol. 1996, 10, 1098–1106. [Google Scholar] [CrossRef]
  12. Liu, S.; Deng, L.; Zhao, Q.; Degloria, S.D.; Dong, S. Effects of road network on vegetation pattern in Xishuangbanna, Yunnan Province, Southwest China. Transp. Res. Part. D Transp. Environ. 2010, 16, 591–594. [Google Scholar] [CrossRef]
  13. Xian, G.; Homer, C. Updating the 2001 national land cover database impervious surface products to 2006 using Landsat imagery change detection methods. Remote Sens. Environ. 2010, 114, 1676–1686. [Google Scholar] [CrossRef]
  14. Weng, Q. Remote sensing of impervious surfaces in the urban areas: Requirements, methods, and trends. Remote Sens. Environ. 2012, 117, 34–49. [Google Scholar] [CrossRef]
  15. Herold, M.; Couclelis, H.; Clarke, K.C. The role of spatial metrics in the analysis and modeling of urban land use change. Comput. Environ. Urban Syst. 2005, 29, 369–399. [Google Scholar] [CrossRef]
  16. Franke, J.; Roberts, D.A.; Halligan, K.; Menz, G. Hierarchical multiple endmember spectral mixture analysis (MESMA) of hyperspectral imagery for urban environments. Remote Sens. Environ. 2009, 113, 1712–1723. [Google Scholar] [CrossRef]
  17. Weng, Q.; Rajasekar, U.; Hu, X. Modeling urban heat islands and their relationship with impervious surface and vegetation abundance by using aster images. IEEE Trans. Geosci. Remote Sens. 2011, 49, 4080–4089. [Google Scholar] [CrossRef]
  18. Rashed, T. Remote sensing of within-class in urban neighborhood structures. Comput. Environ. Urban Syst. 2008, 32, 343–354. [Google Scholar] [CrossRef]
  19. Michishita, R.; Jiang, Z.; Xu, B. Monitoring two decades of urbanization in the Poyang Lake area, China through spectral unmixing. Remote Sens. Environ. 2012, 117, 3–18. [Google Scholar] [CrossRef]
  20. Shahtahmassebi, A.R.; Pan, Y.; Lin, L.; Shortridge, A.; Wang, K.; Wu, J.X.; Wu, D.; Zhang, J. Implications of land use policy on impervious surface cover change in Cixi County, Zhejiang Province, China. Cities 2014, 39, 21–36. [Google Scholar] [CrossRef]
  21. McGarigal, K.; Cushman, S.A.; Neel, M.C.; Ene, E. Fragstats: Spatial Pattern Analysis Program for Categorical Maps. Available online: http://www.umass.edu/landeco/research/fragstats/fragstats.html (accessed on 10 December 2010).
  22. Yu, X.J.; Ng, X.J. Spatial and temporal dynamics of urban sprawl along two urban-rural transects: A case study of Guangzhou, China. Landsc. Urban Plan. 2007, 79, 96–109. [Google Scholar] [CrossRef]
  23. Deng, J.S.; Wang, K.; Hong, Y.; Qi, J.G. Spatio-temporal dynamics and evolution of land use change and landscape pattern in response to rapid urbanization. Landsc. Urban Plan. 2009, 92, 187–198. [Google Scholar] [CrossRef]
  24. Araya, Y.H.; Cabral, P. Analysis and Modeling of urban land cover change in Setubal and Sesimbra, Portugal. Remote Sens. 2010, 2, 1549–1563. [Google Scholar] [CrossRef]
  25. Sun, A.J.; Wu, J.; Liu, G.G.; Pang, J.L. The study of coupling degree between traffic and urbanization: A case study of Jiangsu Province. Urban Transp. China 2007, 5, 42–46. (In Chinese) [Google Scholar]
  26. Wu, J.L. Exploring a new road to industrialization which is supported by modern transportation and communication. Chengdu Daily 2010, 21, 8. (In Chinese) [Google Scholar]
  27. Li, S.M.; Shum, Y.M. Impacts of the National Trunk Highway System on accessibility in China. J. Transp. Geogr. 2001, 9, 39–48. [Google Scholar]
  28. Cai, Z.H. A Brief History of China’s Expressway Mileage Development. Available online: http://blog.sina.com.cn/s/blog_47d5e5060100u7fl.html (accessed on 5 October 2014). (In Chinese)
  29. National Bureau of Statistics of China. Available online: http://www.stats.gov.cn/english/statisticaldata (accessed on 1 November 2014).
  30. Luo, R.H. The Present Situation and the Development of China’s Railway. Available online: http://wenku.baidu.com/link?url=92xf2s9QXTNQYubXw2papzFAPNFYECJXRLJuriYRVBTuwYiC4r_8hraPOJCcFiG6Qzm2fTFeBi6uk748LNwHvs2XMDp-rz0LDDmhMLlCJ_q (accessed on 27 June 2014). (In Chinese)
  31. Railway BBS. Present Situation Investigation and Analysis of the Development of our Country’s High Speed Railway. Available online: http://bbs.railcn.net/thread-942672–1-1.html (accessed on 27 June 2014). (In Chinese)
  32. China Highway. “Five Vertical, Four Horizontal and One Ring” of Highway Net Frame. Available online: http://www.chinahighway.com/news/2006/126610.php (accessed on 11 July 2014). (In Chinese)
  33. Shangguan, K.P. China’s Top Ten of the Most Powerful Cross-Sea Bridges. Available online: http://blog.sina.com.cn/s/blog_6b70a1720100tk4h.html (accessed on 11 July 2014). (In Chinese)
  34. Baidu Encyclopedia. The Hangzhou Bay Cross-Sea Bridge. Available online: http://baike.baidu.com/view/21028.htm?fr=Aladdin (accessed on 11 July 2014). (In Chinese)
  35. Baidu Encyclopedia. The Zhoushan Cross-Sea Bridge. Available online: http://baike.baidu.com/view/3018313.htm (accessed on 11 July 2014). (In Chinese)
  36. Invest in Ningbo. Available online: http://www.ningbochina.com/en/xqjj/3.html (accessed on 28 June 2011).
  37. Lu, X.Q.; Wang, Q. The influence of the construction of Hangzhou Bay Bridge on the development of the logistics industry in Ningbo area. Enterp. Econ. 2005, 9, 132–133. (In Chinese) [Google Scholar]
  38. Ningbo City Bureau of Statistics. Ningbo Statistical Year Book, 1996, 2003, 2010; China Statistics Press: Beijing, China, 1996, 2003, 2010.
  39. Statistics Bureau of Zhejiang Province. Zhejiang Statistical Year Book, 1996, 2003, 2010; China Statistics Press: Beijing, China, 1996, 2003, 2010.
  40. Powell, R.L.; Roberts, D.A.; Dennison, P.E.; Hes, L.L. Sub-pixel mapping of urban land cover using multiple endmember spectral mixture analysis: Manaus, Brazil. Remote Sens. Environ. 2007, 102, 253–267. [Google Scholar] [CrossRef]
  41. Li, C.L.; Du, J.K.; Su, Y.P.; Li, Q.; Chen, L. Extraction of impervious surface based on multi-source satellite data of Qinhuai River Basin from 1979 to 2009. In Proceedings of the 18th International Conference on Geoinformatics, Beijing, China, 18–20 June 2010.
  42. Rashed, T.; Weeks, J.; Roberts, D.A.; Rogan, J.; Powell, P. Measuring the physical composition of urban morphology using multiple endmember spectral mixture models. Photogramm. Eng. Remote Sens. 2003, 69, 1011–1020. [Google Scholar] [CrossRef]
  43. Shahtahmassebi, A.R.; Yu, Z.L.; Wang, K.; Xu, H.W.; Deng, J.S.; Li, J.D.; Luo, R.S.; Wu, J. Monitoring rapid urban expansion using multi-temporal RGB-impervious surface. J. Zhejiang Univ. Sci. A 2012, 13, 146–158. [Google Scholar] [CrossRef]
  44. Stone, B., Jr. Paving over paradise: How land use regulations promote residential imperviousness. Landsc. Urban Plan. 2004, 69, 101–113. [Google Scholar] [CrossRef]
  45. Roberts, D.; Halligan, K.; Dennison, P. VIPER Tools User Manual. Version 1.2. 2007. Available online: http://www.vipertools.org (accessed on 10 April 2011).
  46. Ridd, M.K. Exploring a V-I-S (vegetation-Impervious Surface-Soil) Model for Urban Ecosystem Analysis through Remote Sensing. Int. J. Remote Sens. 1995, 16, 2165–2185. [Google Scholar] [CrossRef]
  47. Rafiee, R.; Mahiny, A.S.; Khorasani, N. Assessment of changes in urban green spaces of Mashad City using satellite data. Int. J. Appl. Earth Obs. Geoinf. 2009, 11, 431–438. [Google Scholar] [CrossRef]
  48. McGarigal, K.; Cushman, S.A.; Neel, M.C.; Ene, E. FRAGSTATS v3: Spatial Pattern Analysis Program for Categorical Maps. Computer Software Program Produced by the Authors at the University of Massachusetts, Amherst. 2002. Available online: http://www.umass.edu/landeco/research/fragstats/fragstats.html (accessed on 10 December 2010).
  49. Lein, J.K.; Day, K.L. Assessing the growth-inducing impact of the Appalachian Development Highway System in southern Ohio: Did policy promote change? Land Use Policy 2008, 25, 523–532. [Google Scholar] [CrossRef]
  50. Ramadan, E.; Feng, X.-Z.; Chang, Z. Satellite remote sensing for urban growth assessment in Shaoxing City, Zhejiang Province. J. Zhejiang Univ. Sci. A 2004, 5, 1095–1101. [Google Scholar] [CrossRef] [PubMed]
  51. Li, X.; Yeh, G.O. Analyzing spatial restructuring of land use pattern in a fast growing region using remote sensing and GIS. Landsc. Urban Plan. 2004, 69, 335–354. [Google Scholar] [CrossRef]
  52. Lu, S.L.; Shen, X.H.; Zou, L.J. Land cover change in Ningbo and its surrounding area of Zhejiang Province, 1987~2000. J. Zhejiang Univ. Sci. A 2006, 7, 633–640. [Google Scholar] [CrossRef]
  53. Ding, H.; Wang, R.C.; Wu, J.P.; Zhou, B.; Shi, Z.; Ding, L.X. Quantifying land use change in Zhejiang coastal region, China using multi-temporal Landsat TM/ETM+ images. Pedosphere 2007, 17, 712–720. [Google Scholar] [CrossRef]
  54. Hepcan, S.; Hepcan, C.C.; Kilicaslan, C.; Ozkan, M.B.; Kocan, N. Analyzing Landscape Change and Urban Sprawl in a Mediterranean Coastal Landscape: A Case Study from Izmir, Turkey. J. Coast. Res. 2013, 29, 301–310. [Google Scholar] [CrossRef]
  55. Salvati, L.; Sateriano, A.; Bajocco, S. To grow or to sprawl? Land Cover Relationships in a Mediterranean City Region and implications for land use management. Cities 2013, 30, 113–121. [Google Scholar] [CrossRef]
  56. Fisher, P. The pixel: A snare and a delusion. Int. J. Remote Sens. 1997, 18, 679–685. [Google Scholar] [CrossRef]
  57. Yang, X.; Liu, Z. Use of satellite-derived landscape imperviousness index to characterize urban spatial growth. Comput. Environ. Urban Syst. 2005, 29, 524–540. [Google Scholar] [CrossRef]
  58. Rodrigue, J.P. The Geography of Transport Systems, 3rd ed.; Routledge: New York, NY, USA, 2013. [Google Scholar]
  59. Patarasuk, R. Road network connectivity and land-cover dynamics in Lop Buri province, Thailand. J. Transp. Geogr. 2013, 28, 111–123. [Google Scholar] [CrossRef]
  60. Shen, Y.; Silva, J.D.A.E.; Martínez, L.M. Assessing high-speed rail’s impacts on land cover change in large urban areas based on spatial mixed logit methods: A case study of Madrid Atocha railway station from 1990 to 2006. J. Transp. Geogr. 2014, 41, 184–196. [Google Scholar] [CrossRef]
  61. Bhatta, B. Analysis of urban growth pattern using remote sensing and GIS: A case study of Kolkata, India. Int. J. Remote Sens. 2009, 30, 4733–4746. [Google Scholar] [CrossRef]
  62. William, K. Urban intensification policies in England: Problems and contradictions. Land Use Policy 1999, 16, 167–178. [Google Scholar] [CrossRef]
  63. Allen, D. Hangzhou Bridge Bonanza. Available online: http://www.atimes.com/atimes/China_Business/MC31Cb02.html (accessed on 26 February 2016).
  64. Ningbo Municipal Bureau of National Land and Resources. Available online: http://www.nblr.gov.cn/showpage2/detail.jsp?id=1516681 (accessed on 20 November 2015). (In Chinese)
  65. Wong, B. New Bridge and Pearl River Delta West (1): Three-Hour Economic Circle. Available online: http://hkmb.hktdc.com/en/1X0A0NTA/hktdc-research/New-Bridge-and-Pearl-River-Delta-West-1-Three-hour-Economic-Circle (accessed on 26 February 2016).
  66. Gillies, R.R.; Box, J.B.; Symanzik, J.; Rodemaker, E.J. Effects of urbanization on the aquatic fauna of the Line Creek Watershed, Atlanta—A satellite perspective. Remote Sens. Environ. 2003, 86, 411–422. [Google Scholar] [CrossRef]
Figure 1. (a) Locations of the Hangzhou Bay Bridge and Cixi County on a color composite LANDSAT 5-TM image (bands 5, 4, and 3) from 10 October 2009 and (b) spatial partition map of Cixi County from the Cixi City regional plan (2005–2020).
Sustainability 08 00666 g001
Figure 2. Research flowchart.
Sustainability 08 00666 g002
Figure 3. Densification of impervious surfaces in Cixi County (1995–2009).
Sustainability 08 00666 g003
Figure 4. Impervious surface maps in (a) 1995 and (b) 2002. The range of impervious surface value (%) is 0%–100%. Dark (red) areas indicate a higher fractional abundance of impervious surfaces, while bright areas (light green) represent lower abundance.
Sustainability 08 00666 g004aSustainability 08 00666 g004b
Figure 5. Impervious surface map in 2009. The range of impervious surface values (%) is 0%–100%. Dark (red) areas indicate a higher fractional abundance of impervious surfaces, while bright areas (light green) represent lower abundance.
Sustainability 08 00666 g005
Figure 6. Density of land development along roads in Cixi County between 1995 and 2009.
Sustainability 08 00666 g006
Figure 7. Sequence of open space infilling and expansion of urban regions in 1995, 2002, and 2009 (central city of Cixi County).
Sustainability 08 00666 g007
Figure 8. Bar chart of the district level comparison of impervious surface areas in Cixi County (1995–2009).
Sustainability 08 00666 g008
Figure 9. Line charts of change trend comparison of the socio-economic index and impervious surfaces in Cixi County (1995–2009): (a) non-agricultural population and impervious surface area; (b) number of practitioner and impervious surface area; (c) GDP and impervious surface area; (d) the amount of actual use of foreign capital and impervious surface area; (e) road mileage and impervious surface area; (f) civilian cars and impervious surface area; (g) passenger capacity and impervious surface area; and (h) volume of freight traffic and impervious surface area.
Sustainability 08 00666 g009
Figure 10. A conceptual model comprising interactions between CSGT and urban growth and sustainable monitoring policy.
Sustainability 08 00666 g010
Table 1. Summary of cross-sea bridges.
NameLength (km)Starting TimeOpening Time
Qingdao Bay Bridge41.58May 200730 June 2011
Hangzhou Bay Cross-sea Bridge36June 20031 May 2008
Zhoushan Sea-crossing Bridge50September 199925 December 2009
East Sea Bridge32.5June 20022005
Table 2. Descriptions of the spatial metrics selected in this study [21].
MetricsDescriptionUnitMeasure
Number of Patches (NP)The number of patches of the corresponding patch type (class).No.Fragmentation
Edge-Density (ED)The sum of the lengths (m) of all edge segments involving the patch type, divided by the total landscape area (m2).m/m2Complexity
Largest Patch Index (LPI)The area (m2) of the largest patch of the corresponding patch type divided by total landscape area (m2), multiplied by 100.PercentDominance
Euclidian Mean Nearest Neighbor Distance (ENN-MN)Distance (m) to the nearest neighboring patch of the same type, based on shortest edge-to-edge distance.mFragmentation/Proximity
Percentage of Like Adjacencies (PLADJ)The number of like adjacencies involving the focal class divided by the total number of cell adjacencies involving the focal class, multiplied by 100.PercentFragmentation
Table 3. Comparison between impervious area growth and population growth in Cixi County.
YearPervious Land (ha)Impermeable Land (ha)Percentage Increase in Impervious Area (%)PopulationPercentage Growth in Population (%)
199545,9996665----986,300---
200242,46010,20453.11,005,8001.97
200936,17016,49461.631,031,2202.52
Table 4. Landscape indices and percent changes.
Metrics199520022009∆ % 02–95∆ % 09–02
NP510834814897−31.8540.67
LPI0.394.5925.141076.92447.71
ENN_MN98.1391.6268.22−6.63−25.54
PLADJ55.1475.8287.9237.515.95
ED16.8528.4149.2968.673.49
Table 5. District level comparison of impervious surface areas in Cixi County (ha).
YearHangzhou Bay DistrictZhouxiang DistrictCentral Urban AreaGuanhaiwei DistrictCidong District
1995150.12180.271018.62471.51136.62
2002480.42465.032856.151266.03333
20091648.891703.164797.092455.29696.24
AAGR (%)18.6717.4011.7012.5112.34
Table 6. District level comparison of the average density of impervious surfaces in Cixi County (%).
YearHangzhou Bay DistrictZhouxiang DistrictCentral Urban AreaGuanhaiwei DistrictCidong District
199555.6958.8265.1262.9058.24
200264.2862.1467.9467.6362.84
200969.8971.9970.3870.0469.13
AAGR (%)1.641.450.560.771.23

