Article

A Behavioral Model of Managerial Perspectives Regarding Technology Acceptance in Building Energy Management Systems

1
Department of Industrial Management, National Taiwan University of Science and Technology, Taipei 106, Taiwan
2
Department of Mechanical Engineering, Christian University of Indonesia, Jakarta 13630, Indonesia
*
Author to whom correspondence should be addressed.
Sustainability 2016, 8(7), 641; https://doi.org/10.3390/su8070641
Submission received: 6 June 2016 / Revised: 2 July 2016 / Accepted: 5 July 2016 / Published: 7 July 2016
(This article belongs to the Section Energy Sustainability)

Abstract

:
The Building Energy Management System (BEMS), a well-known system that has been implemented in some energy corporations, has become attractive to many companies seeking to better monitor their energy consumption efficiency. This study investigated the external factors that influence acceptance of the BEMS from managerial perspectives. An extended model based on the Technology Acceptance Model (TAM) was created to evaluate the implementation of the BEMS in the manufacturing industries. A structural equation modeling (SEM) approach was used to analyze the model by adopting compatibility, features, technology complexity, and perceived risk as the external variables, and integrating the five dimensions of perceived ease of use, perceived usefulness, attitude, user satisfaction, and behavioral intention. The analysis results indicated that the external factors positively influenced users’ behavioral intention to use the BEMS through expected satisfaction, perceived ease of use, and perceived usefulness. Suggestions for BEMS developers are provided as well.

1. Introduction

In 2014, the industrial sector became the leading sector among all sectors in Southeast Asia in terms of total energy consumption, with the sector’s consumption rising by an average of 4.2% per year [1]. Indonesia is currently the largest energy consumer in southeast Asia, accounting for 36% of the region’s total primary consumption [2]. As noted, the sector with the greatest share of total energy consumption is the industrial sector, which accounts for 33% of the total, followed by the residential sector and the transportation sector, at 27% each, and then the commercial sector combined with other sectors at 10% [3]. As a result of the competitive environment of the energy industry in the look of the current global economic challenges [4], Indonesia faces numerous challenges including the growing demand for energy and the increased costs associated with the energy. Achieving energy efficiency is undoubtedly one of the best strategies for companies to run and maintain sustainable processes. With a good monitoring system for controlling energy usage, companies can reduce the cost of energy consumption while also helping to preserve the environment. To mitigate the issues of high-costing energy and the growing demand for the energy, many industries have been seeking to increase the role of energy efficiency in their cost-saving program. There has also been a considerable amount of attention placed on the integration of energy-efficient technologies, including the transformation of the traditional energy control system to the smart building energy management system. However, the lack of the Indonesian companies that comply with the changes in industries also becomes a problem, and would thus affect the stability of the energy consumption in this industrial sector. The Indonesian Energy Council Report of 2014 revealed a lack of integration within energy management systems among industries. As a result [5], researchers, such as Maulidevi et al. [6], also explained how the low efficiency affects the acceptance of the technology within an industry. Another set of research data by Kim indicates that company decisions would be directly affected by the manager’s intention to use a new system [7]. In the end, a strong managerial intention to use an energy management system would attract potential employees with similar intention to use the new technology and thus, positively affecting the industry.
Success in implementing a new technology depends largely on the behavioral responses of users [8,9]. Within a company, individuals at the managerial level play an important role, not only in the direct implementation of a new technology, but also in ensuring that related systems are run successfully. In fact, leadership at the managerial level is the most critical factor for supporting the implementation of a system, particularly with regard to employees’ behavioral intention in terms of using the system. The aim of the present study was to investigate the factors that may influence managerial perspectives toward a particular energy management system that has been widely implemented in various industries.
In Southeast Asia, and in Indonesia in particular, a smart monitoring system has been introduced at a variety of companies in recent years [1,
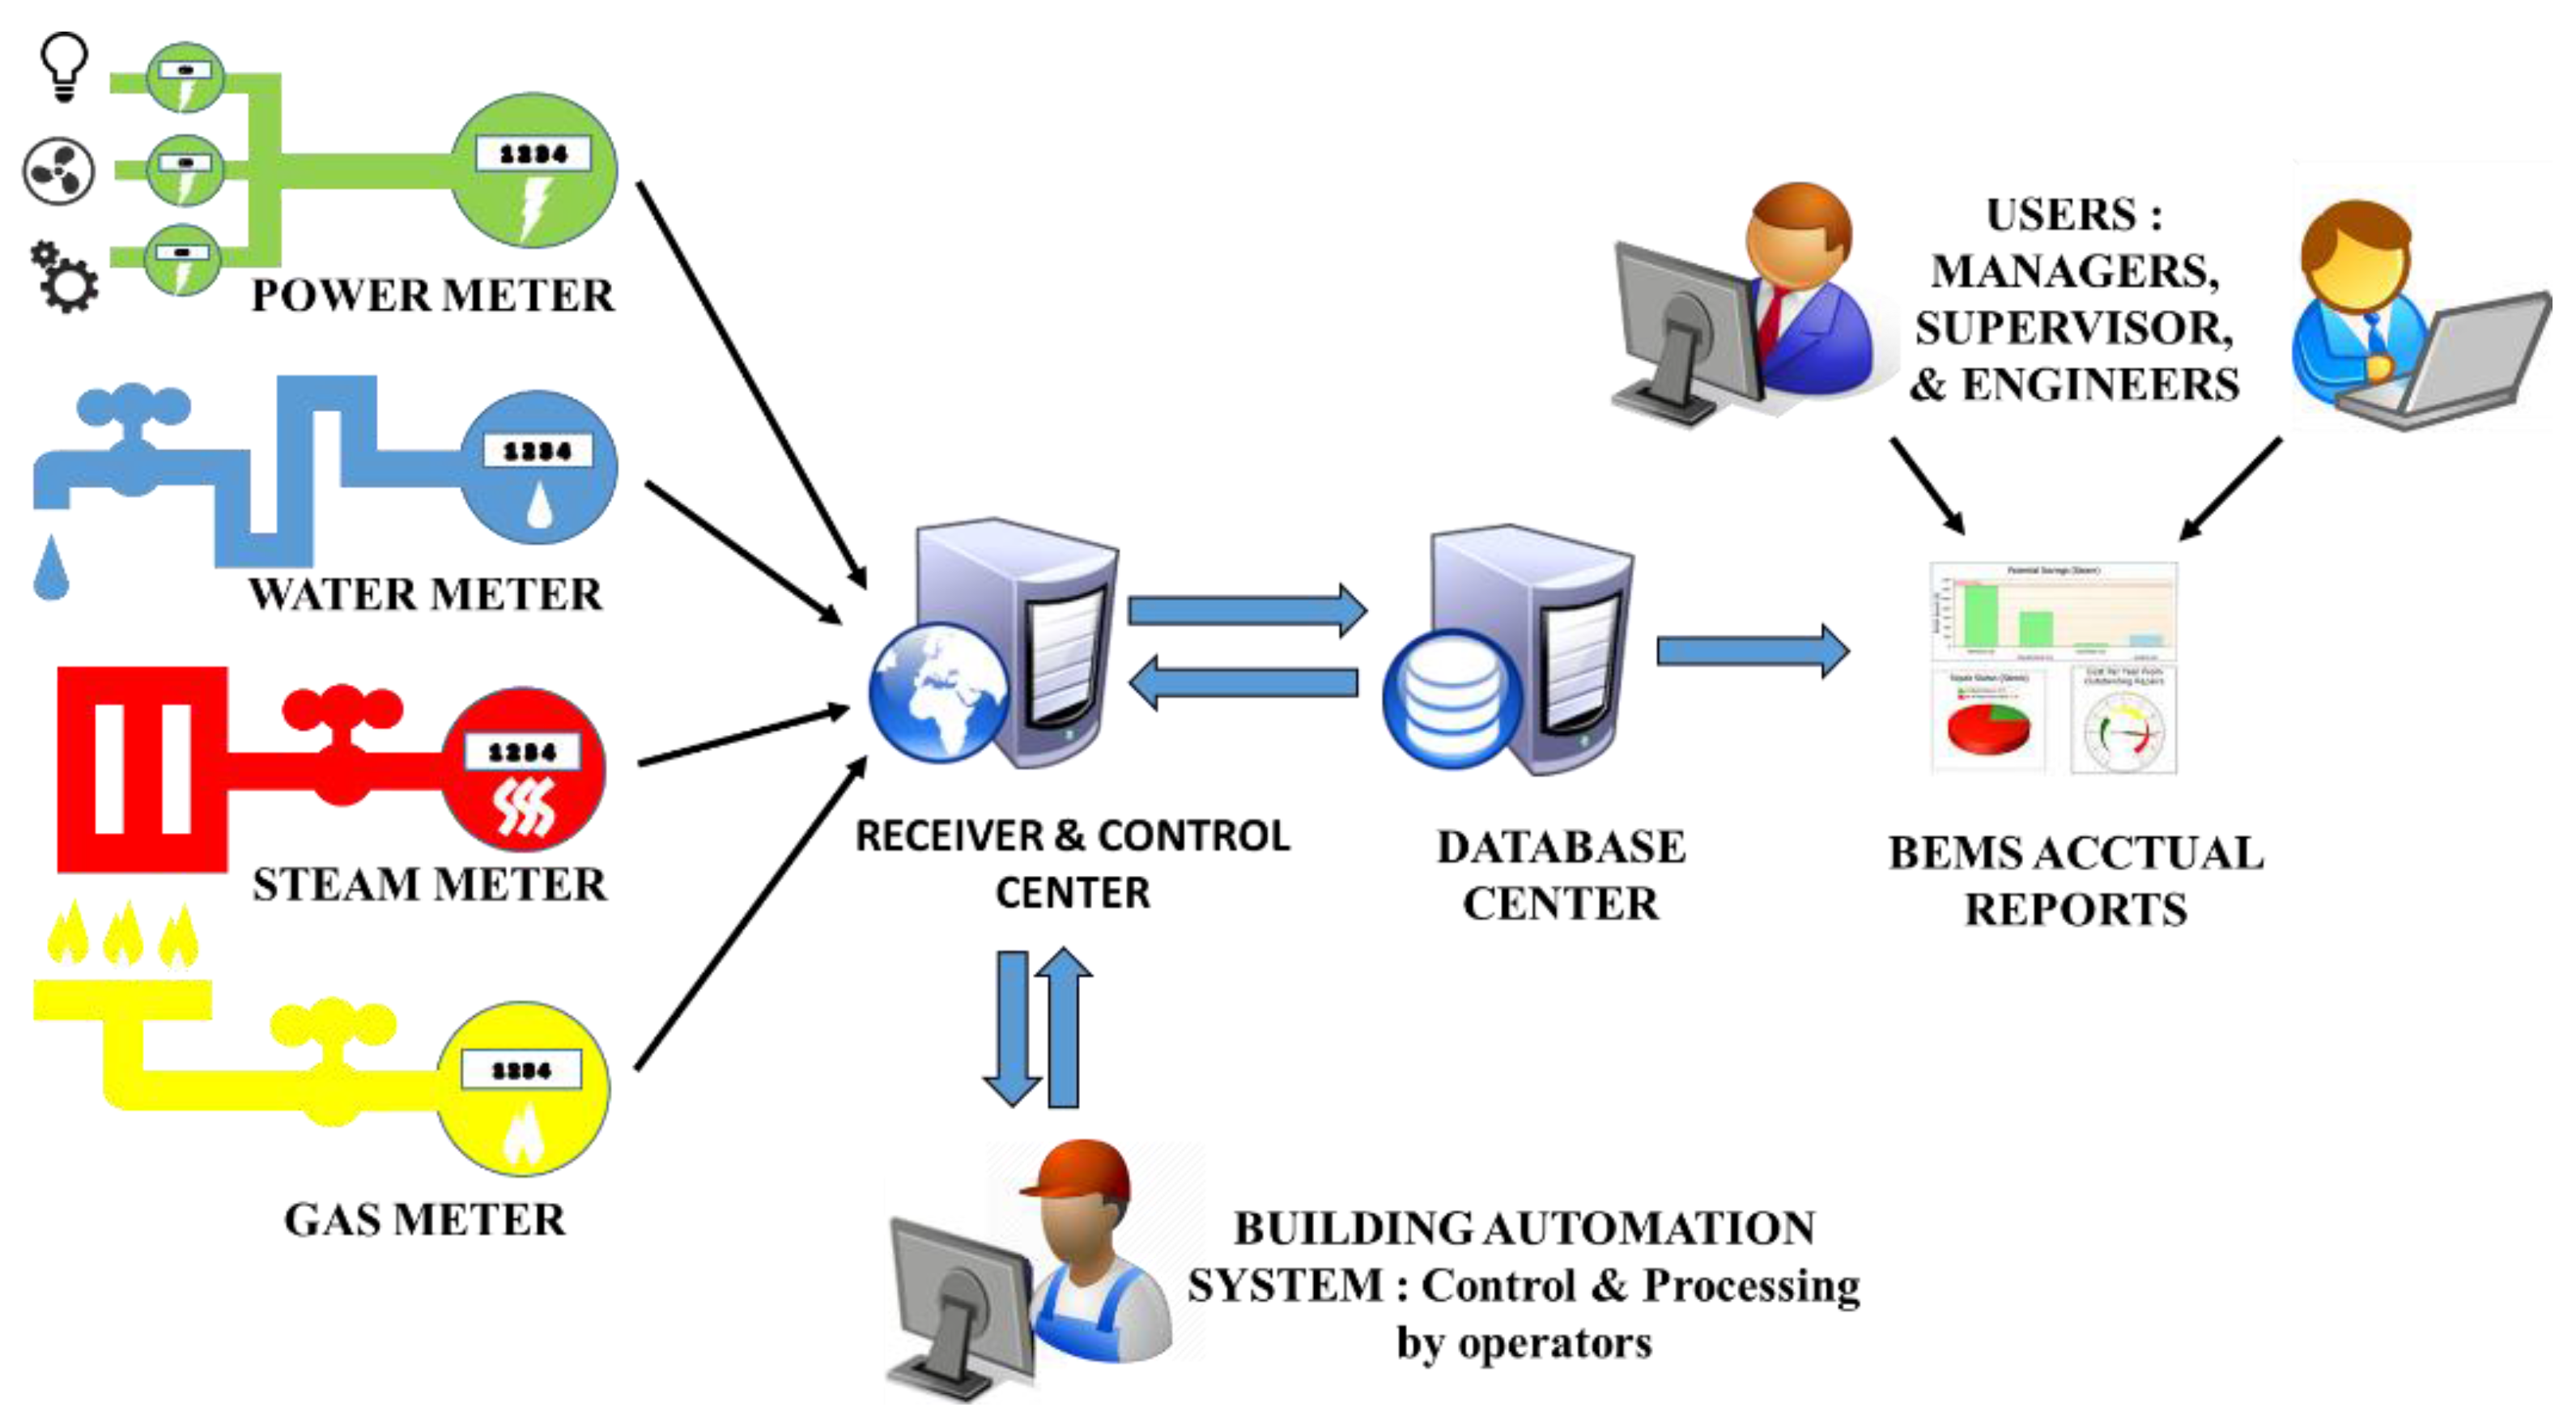
10]. In order to evaluate the effectiveness of energy consumption efficiency efforts, it is essential that a smart monitoring system be installed on-site at the location of interest. In industrial facilities, operators must continuously monitor and control many different utilities to ensure the proper operation of the facilities. The development of networking technology has made such monitoring and control increasingly feasible [9]. These industrial monitoring and control systems are commonly called Supervisory Control and Data Acquisition (SCADA) systems, with the Building Energy Management System (BEMS) being a prominent example. Some recent articles have described that the practical implementation of the BEMS strongly supports reducing energy consumption when compared to conventional approaches [11,12,13,14,15]. The present study investigated various factors that could potentially influence managerial acceptance of such systems. There have been several similar studies that successfully examined user behaviors toward a smart BEMS through the Technology Acceptance Model (TAM), although those studies were focused on residential housing, commercial housing, and general-purpose energy usage [8,10,16] instead of on energy usage in the manufacturing industry. This research, on the contrary, sought to examine the behaviors of BEMS users in manufacturing companies. The findings of this research can serve as a reference in designing guidelines for BEMS users, such as smart building grid meter companies, and BEMS providers and for improving a given BEMS in terms of managerial perceptions and behaviors.

2. Theoretical Framework

2.1. Building Energy Management System

SCADA, or BEMS, is a technology that covers supervision, control, monitoring, and data acquisition. Building energy management systems consist of a set of software, hardware, and communication networks that control variables through the remote operation of the whole system, as shown in Figure 1. In order to increase effectiveness and efficiency in the operation of a utility system, a BEMS can be used to improve the relevant conditions by integrating users’ responses in the control and monitoring of the building or buildings in question. Such a system also provides both the prevention of and detection of failures in the utility system. With a more conventional system, the operators would need to go to several locations in each building on an hourly basis to manually check and control the energy consumption via metering devices [3]. The inspection monitoring items consist of the electricity consumed in lighting, the supply of electricity to production machines, gases, water, heating, ventilation, air conditioning, and several other items [11,13].
In accordance with the European Committee of Standardization [17], the BEMS provides differing levels of display security options that allow different types of users (i.e., field level users such as technicians and engineer operators; supervisor level users such as supervisors, division heads, or managers; and administrator automation level users such as those individuals responsible for covering the outstation/controllers) to interact with the display information and to control the energy consumption. These different levels of display options are essential because users need to be able to recognize the energy consumption of their buildings and to analyze and improve their buildings’ energy performance at different user interest levels.
Some other researchers have examined the benefits of BEMS usage in companies in term of energy efficiency [11,12,13,14,18,19,20,21,22,23]. With those benefits in mind, this study sought to investigate the related factors that are useful to improve user responses from the perspectives of those in management.

2.2. Research Model

2.2.1. Technology Acceptance Model

The Technology Acceptance Model (TAM) explains the determinants of technology acceptance in general and traces the impact of external factors on Attitude and intention. This model can be used to investigate the factors affecting user behaviors with regard to using information technology or adopting a new technology. Many studies have been conducted on information systems in order to develop and predict the factors that could influence the adoption of a technology. While there are some studies that have used other established and vigorous models, such as the Theory of Reasoned Action (TRA), the Theory of Planned Behavior (TPB), the TAM 2, and the Unified Theory of Acceptance and Use of Technology (UTAUT), recently reported empirical support has made the TAM widely popular with IT researchers, and it is considered to be the most frequently used model for analyzing user behaviors in accepting technology [3,24,25,26].
Past studies regarding energy management employed variations of the TAM and TAM2 models to explain user behavior intentions toward smart grid technologies [3,27,28,29,30,31,32]. Within the most recent research, four constructs, perceived ease of use (PEOU), perceived usefulness (PU), attitude (ATT), and behavioral intentions (BI), are identified as internal factors of user acceptance and usage behavior. Perceived usefulness (PU) can be defined as the degree to which a user of a technology expect that using a particular system would enhance his or her job performance, while perceived ease of use (PEOU) can be explained as the degree to which a user of a technology expect that using a particular system will not have to make any special effort [3,10,28,33]. According to Davis [25], behavioral intention is determined by the attitude toward the PU and PEOU. Attitude (ATT) can be described as the degree to which a user of a technology is expected to follow his or her favorable or unfavorable feelings [3,10,27,34].

2.2.2. Expected User Satisfaction

Previous research investigations found that user expected satisfaction (UES) significantly affects behavioral intention to use, which is an important indicator of successful acceptance of new technology [10,35]. UES can be described as the degree to which a user expects that the information provided will meet their needs [10]. Son et al. [30] argued that UES has a significant amount of influence on behavior intention in using new technology of mobile computing devices. However, according to Chin and Lin’s study in 2015, Compatibility (C) and technological complexity (TC) have a positive influence on PU, PEOU, and ATT, which have direct positive influences on the operator’s behavioral intention to use Energy Management System (EMS) [3]. Thus, we include the UES variable in our proposed model based on previous research.

2.2.3. External Factors

Compatibility (C), features (F), technological complexity (TC), and perceived risk (PR) are used as additional or external latent factors in this study, as shown in Table 1.

Compatibility

Compatibility (C) processes a technology’s consistency with the existing users’ values, past experience, and needs [36]. Although Lowry (2002) identified the relationship between PEOU and complexity of building management system, the study did not explore the relationship between PU and compatibility. As a result, the relationship between PU and compatibility is still unclear, and it was suggested by Lowry for further investigation in future implementation of various information systems [8]. In our recent research, it is revealed that the correlation between compatibility and PU was consistent with high correlations [3]. In the development of our previous model, compatibility has been shown to be related to the BI through PU, and has significant relationship with PU, rather than PEOU [3]. Based on the results, we propose that C has a positive influence on PU (H1).

Features

Features (F) can be explained as the abilities of a designed system to complete user requested tasks [10]. Kim et al. (2009) found that when advanced features were implemented, PU had a stronger impact on system usage [29]. As a result, this investigation assumes that system’s features significantly and positively affect the adoption of technology through PU. Since BEMS can be used to online monitor and control energy consumption [21], this research further argues that features increase PU and so increase users acceptance of energy management technology (H2).

Technological Complexity

Technological complexity (TC) represents as individual users perceptions regarding the effort of understanding a new technology or system [3,35]. The influence of technological complexity on PEOU has been confirmed in previous studies [3]. Due to the difficulties of working with the new system as well as difficulties of understanding information from the system displays [35], TC has become a major issue in the acceptance of the new system. In this BEMS study, we argue that TC positively affects PEOU (H3).

Perceived Risk

From a managerial perspective, since the BEMS is connected with the IT networking within a company, and there are many forms of confidential data in the IT systems, perceived risk (PR) is an essential factor affecting BEMS acceptance [40]. According to Chou and Gusti (2014), PR can be defined as uncertainty that affects individuals’ confidence in their decisions to use a system regarding the confidentiality and accessibility of information [10]. This study argues that perceived risk is a consideration in BEMS adoption decisions. Previous studies have argued that PR, in turn, significantly affects BI through PEOU (H9) and UES (H10).
In addition, Chou and Gusti [10] have focused on developing an acceptance model for use in residential areas, and these factors have been proven to affect user acceptance of a smart grid technology. However, since that research only focused on residential users [3], it cannot be regarded as representative of industrial users. The present study, in contrast, did focus on industrial users, with particular attention given to managerial perspectives. To fill this research gap, we also added compatibility to the TAM (Figure 2) and empirically evaluated this model using a sample of 157 employees at the managerial level.

3. Methods

The framework of this study employed the Technology Acceptance Model (TAM) in order to examine the implementation of BEMS in the manufacturing industries. The proposed research model is shown in Figure 2. This study performed Structural Equation Modeling (SEM) testing for confirmatory factor analysis and goodness-of-fit for the model [43] to confirm our hypotheses.
The respondents of this study were selected from among the managerial workers of several large scale Indonesia-based manufacturing companies that have implemented the BEMS for monitoring their energy consumptions. Although a few respondents were expatriate workers from other countries such as Nigeria, Vietnam, and India, most of the managerial respondents were of Indonesian origins. This study contacted the companies and distributed 200 online questionnaire surveys from January 2015 to April 2015, with 157 valid surveys retrieved. Some of the questionnaire items were removed, due to the content failing to meet the recommended minimum measurements for either reliability or validity. The measurement items for research variables are shown in Table 2, the responses to which were viewed as representative of the nine latent factors of technology acceptance towards the BEMS. All the responses to the questions were made and scored using a five-point Likert scale, with the individual responses ranging from “I strongly disagree” to “I strongly agree”.

4. Results Analysis

The analysis was carried out based on the 157 valid surveys, which were properly filled out by the managerial professional respondents. All of the respondents were from manufacturing companies in Indonesia that use the building energy management system for energy consumption monitoring. In terms of age, 24% of the respondents were 25–34 years old, while 76% were older than 34 years old. In terms of work experience, 19% of the respondents had between one and five years of experience at their current workplace, while 81% had more than five years.
As SEM is appropriate for testing the proposed model, we used the maximum likelihood method to test the fit of the model. The first step was to test the reliability and convergent validity of the survey items [43]. As illustrated in Table 3, every single value of the factors loading in the proposed model was satisfactory and exceeded the recommended minimum measurement (0.7) [44,45,46]. The resulting values indicated that our model was an appropriate explanation for the dimensionality of all the factors. The next measurement was Cronbach’s α. Testing results showed that all questionnaire items exceeded the recommended minimum measurement of the Cronbach’s α value (0.7). The measurements of composite reliability for all items exceeded the minimum requirement (>0.6), showed that all the items pass the reliability test. All of the nine factors showed an adequate convergent validity, as they exceeded the recommended minimum measurement for the AVE measures.
In order to check the discriminant validity among the constructs, the AVE square root must be greater than the correlations with all constructs [47,48,49,50]. Table 4 presents the square root of the AVE and the correlations among the constructs. The given values indicate the adequate discriminant validity of the measurements [51].
The experimental results showed that our model surpassed the requirements of model fit. All of the indicator results meet five conditions for the recommendation of model fit. As mentioned in the measurement model testing in Table 5, the chi-square test (X2/df) [52], the root mean square error approximation (RMSEA) [53], the goodness of fit statistic (GFI) [54], the Tucker–Lewis index (TLI) [55], and the comparative fit index (CFI) [56], and these indices were chosen in order to determine how well the model fits the data [57,58].
As shown in 
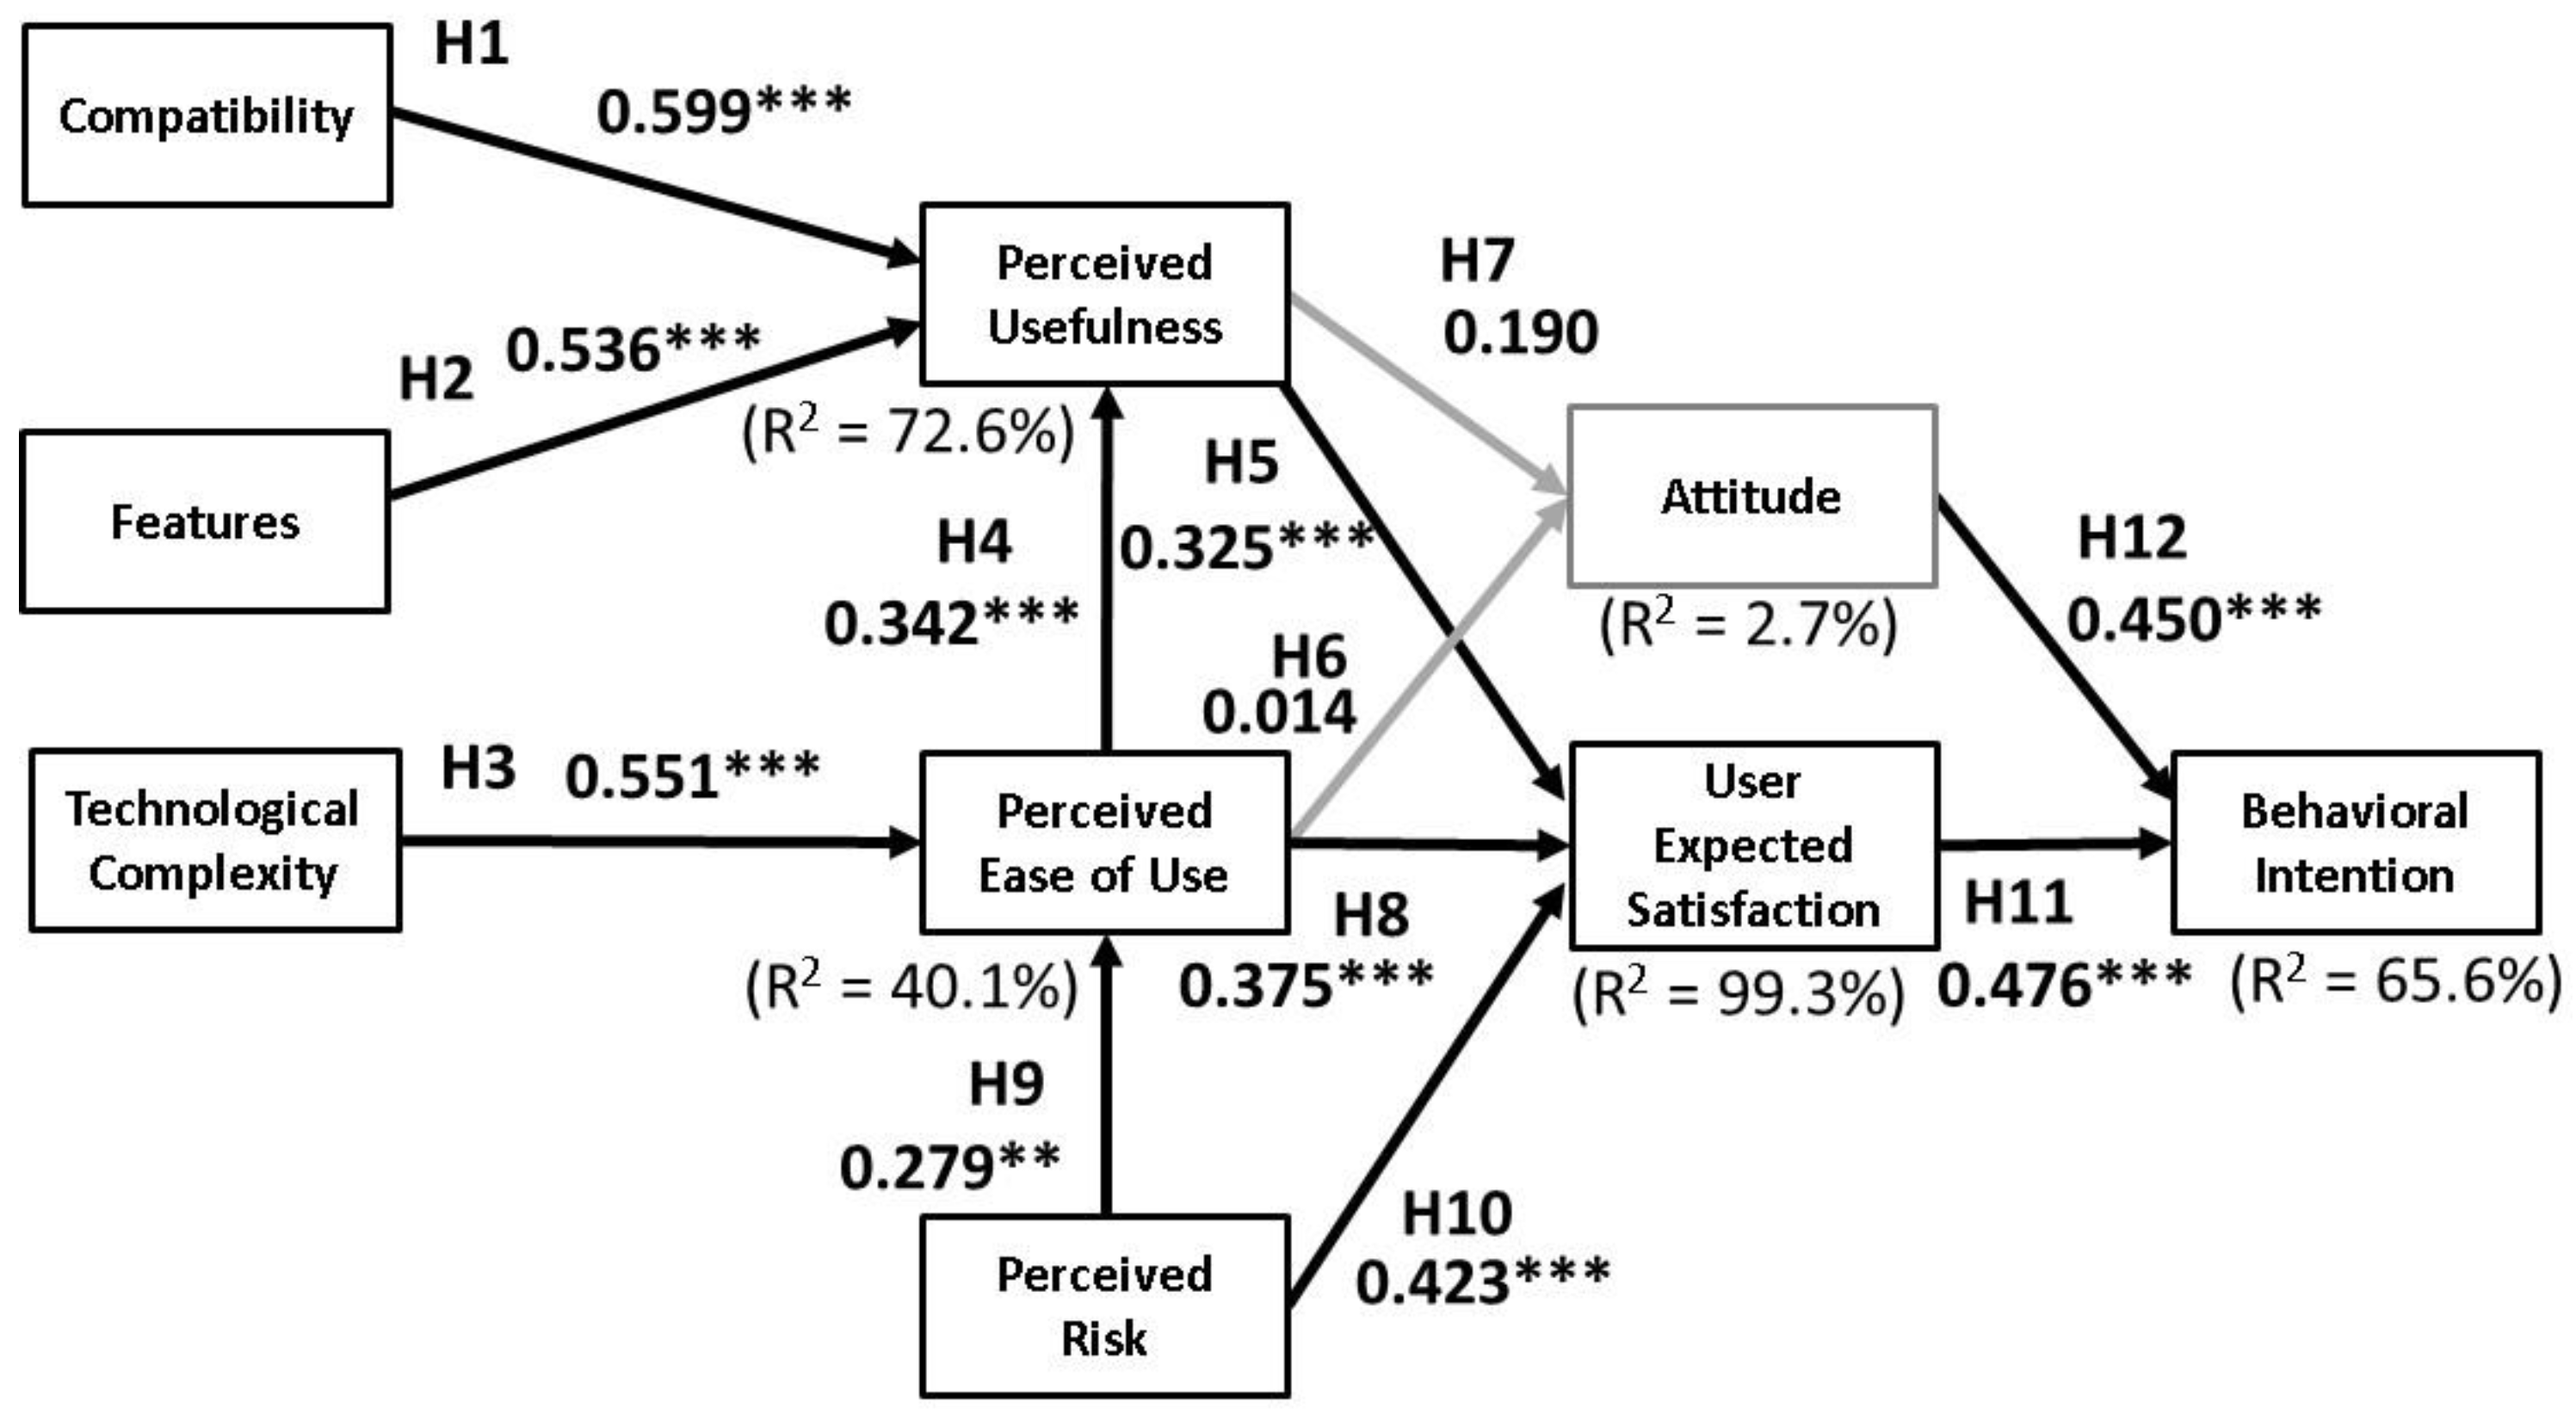
Table 6, all nine of the factors of this study have positive path correlations. However, out of the 12 proposed hypotheses, two were rejected (H6 and H7), and the rest were accepted. Furthermore, other findings indicated that C, F, TC, and PR would be positive predictors of behavior intention to use BEMS toward PU and PEOU.
R2 values indicate the amount of variance in the construct from the path model [47,59]. The results indicate that the model explained 65.6% of the variance in behavior intention to use the BEMS. Similarly, 99.3% of the variance in user expected satisfaction, 2.7% of the variance in attitude, 72.6% of the variance in perceived of usefulness and 40.1% of the variance in perceived ease of use were explained by the result of paths model.
The relationship between the TAM and the external factors of BEMS is supported by the data given within Table 6. The result shown is consistent with the previous finding within Chin and Lin’s study (2015) in predicting users’ intention through the PU and PEOU. All of the relationships between C (β = 0.599, p < 0.001), F (β = 0.536, p < 0.001) and PU were positive and statistically significant, and thus support H1 and H2. Furthermore, these antecedents explained 72.6% of the variance in perceived usefulness as well. The large variance of PEOU is explained by the perceived ease of use (R2 = 0.401) being affected significantly and positively by technological complexity (β = 0.551, p < 0.001) and perceived risk (β = 0.279, p < 0.005), thus supporting H3 and H4. This meant that high compatibility, features, perceived risk, and technological complexity were strongly associated with perceived usefulness and perceived ease of use.
The results showed that neither PU (β = 0.014; p = 0.921) nor PEOU (β = 0.190; p = 0.159) had a significant effect on attitudes. In other words, since there was no sufficient statistical evidence to confirm the influence of PU and PEOU on ATT, H6 and H7 were not supported. Other findings showed that PU (β = 0.325, p < 0.001), PEOU (β = 0.375, p < 0.001), and PR (β = 0.423, p < 0.001) had significant influences on user expected satisfaction, which largely explains the large variance of user expected satisfaction (R2 = 0.993). Similarly, the results also showed that there is a positive and significant relationship between PU, PEOU, PR, and UES, and thus H5, H8 and H10 were supported. The coefficient in between behavioral intention, user expected satisfaction (H11), and attitude (H12) were also found to be significant with a value of UES (β = 0.476, p < 0.001) and ATT (β = 0.450, p < 0.001), which again largely explained the large variance of BI (R2 = 0.656).

5. Conclusions

This study addresses nine variables from the extended technology acceptance model regarding the building energy management system, and explores their causal relationships from a managerial perspective. The potential factors of compatibility, features, technological complexity, and perceived risk were incorporated as external factors into our proposed model. All of those factors influence user intention through the user expected satisfaction, perceived ease of use, and perceived usefulness factors. The results of the theoretical TAM from a managerial perspective were very useful for providing an understanding of aspects of user acceptance of BEMS technology in the manufacturing industry in Indonesia.
Overall, the SEM results supported the major hypotheses of this study and that the model adoption of the TAM was positively related to all the external factors, including compatibility, features, technological complexity, and perceived risk. These findings are consistent with previous findings related to the interactions of users with a smart grid [10,16]. In the proposed model, most of the direct relationship hypotheses between C, F, TC, PEOU, PU, UES and BI were supported, except those regarding direct relationships with ATT. The high positive correlation between external factors and original TAM factors are consistent with previous studies [8,10,16]. This shows that the managerial level recognizes compatibility, features, technology complexity, and perceived risk as the dominant factors in the acceptance of BEMS. Through the factor analysis, we found that there were only insignificant direct relationships between perceived ease of use and perceived usefulness and attitude. Perceived ease of use and perceived usefulness did, however, have significant impacts on the UES. Another significant finding is that both PU and PEOU have a direct influence on user satisfaction, despite the absence of a direct relationship observed between PU, PEOU, and ATT. This result suggests that both factors, UES and ATT, were gained through PU and PEOU, differing from a prior study by Chou and Gusti [10]. In other words, this finding specifically emphasizes the importance of developing a smart-building energy management system with a satisfactory decision-maker, which was not addressed in previous studies. Nevertheless, the attitude still significantly influenced the behavior intention in line as described in TAM by Davis [24]. In our previous study, we have explored the factors affecting the acceptance of BEMS from the operator’s perspective in the manufacturing sector, and concluded that compatibility and technology complexity influenced the user’s intention through attitude, perceived usefulness and perceived ease of use [3]. Although all were conducted in the same industry, these studies, which were conducted at different job levels, showed different conclusions, indicating that relationships among factors are affected by differences within the job level. This is due to managers’ behaviors varying from that of the operators or the field engineers, as they are the decision-makers of the industry. As a result, in our current study, the respondents are employees in managerial position. Based on the results of the present study, it clearly shows that, from a managerial perspective, user satisfaction with the system is viewed as being more important than the attitude of the users with the system. In addition, even if managerial level workers do not directly use the system, they can feel the effects of its usability after the system is up and running.
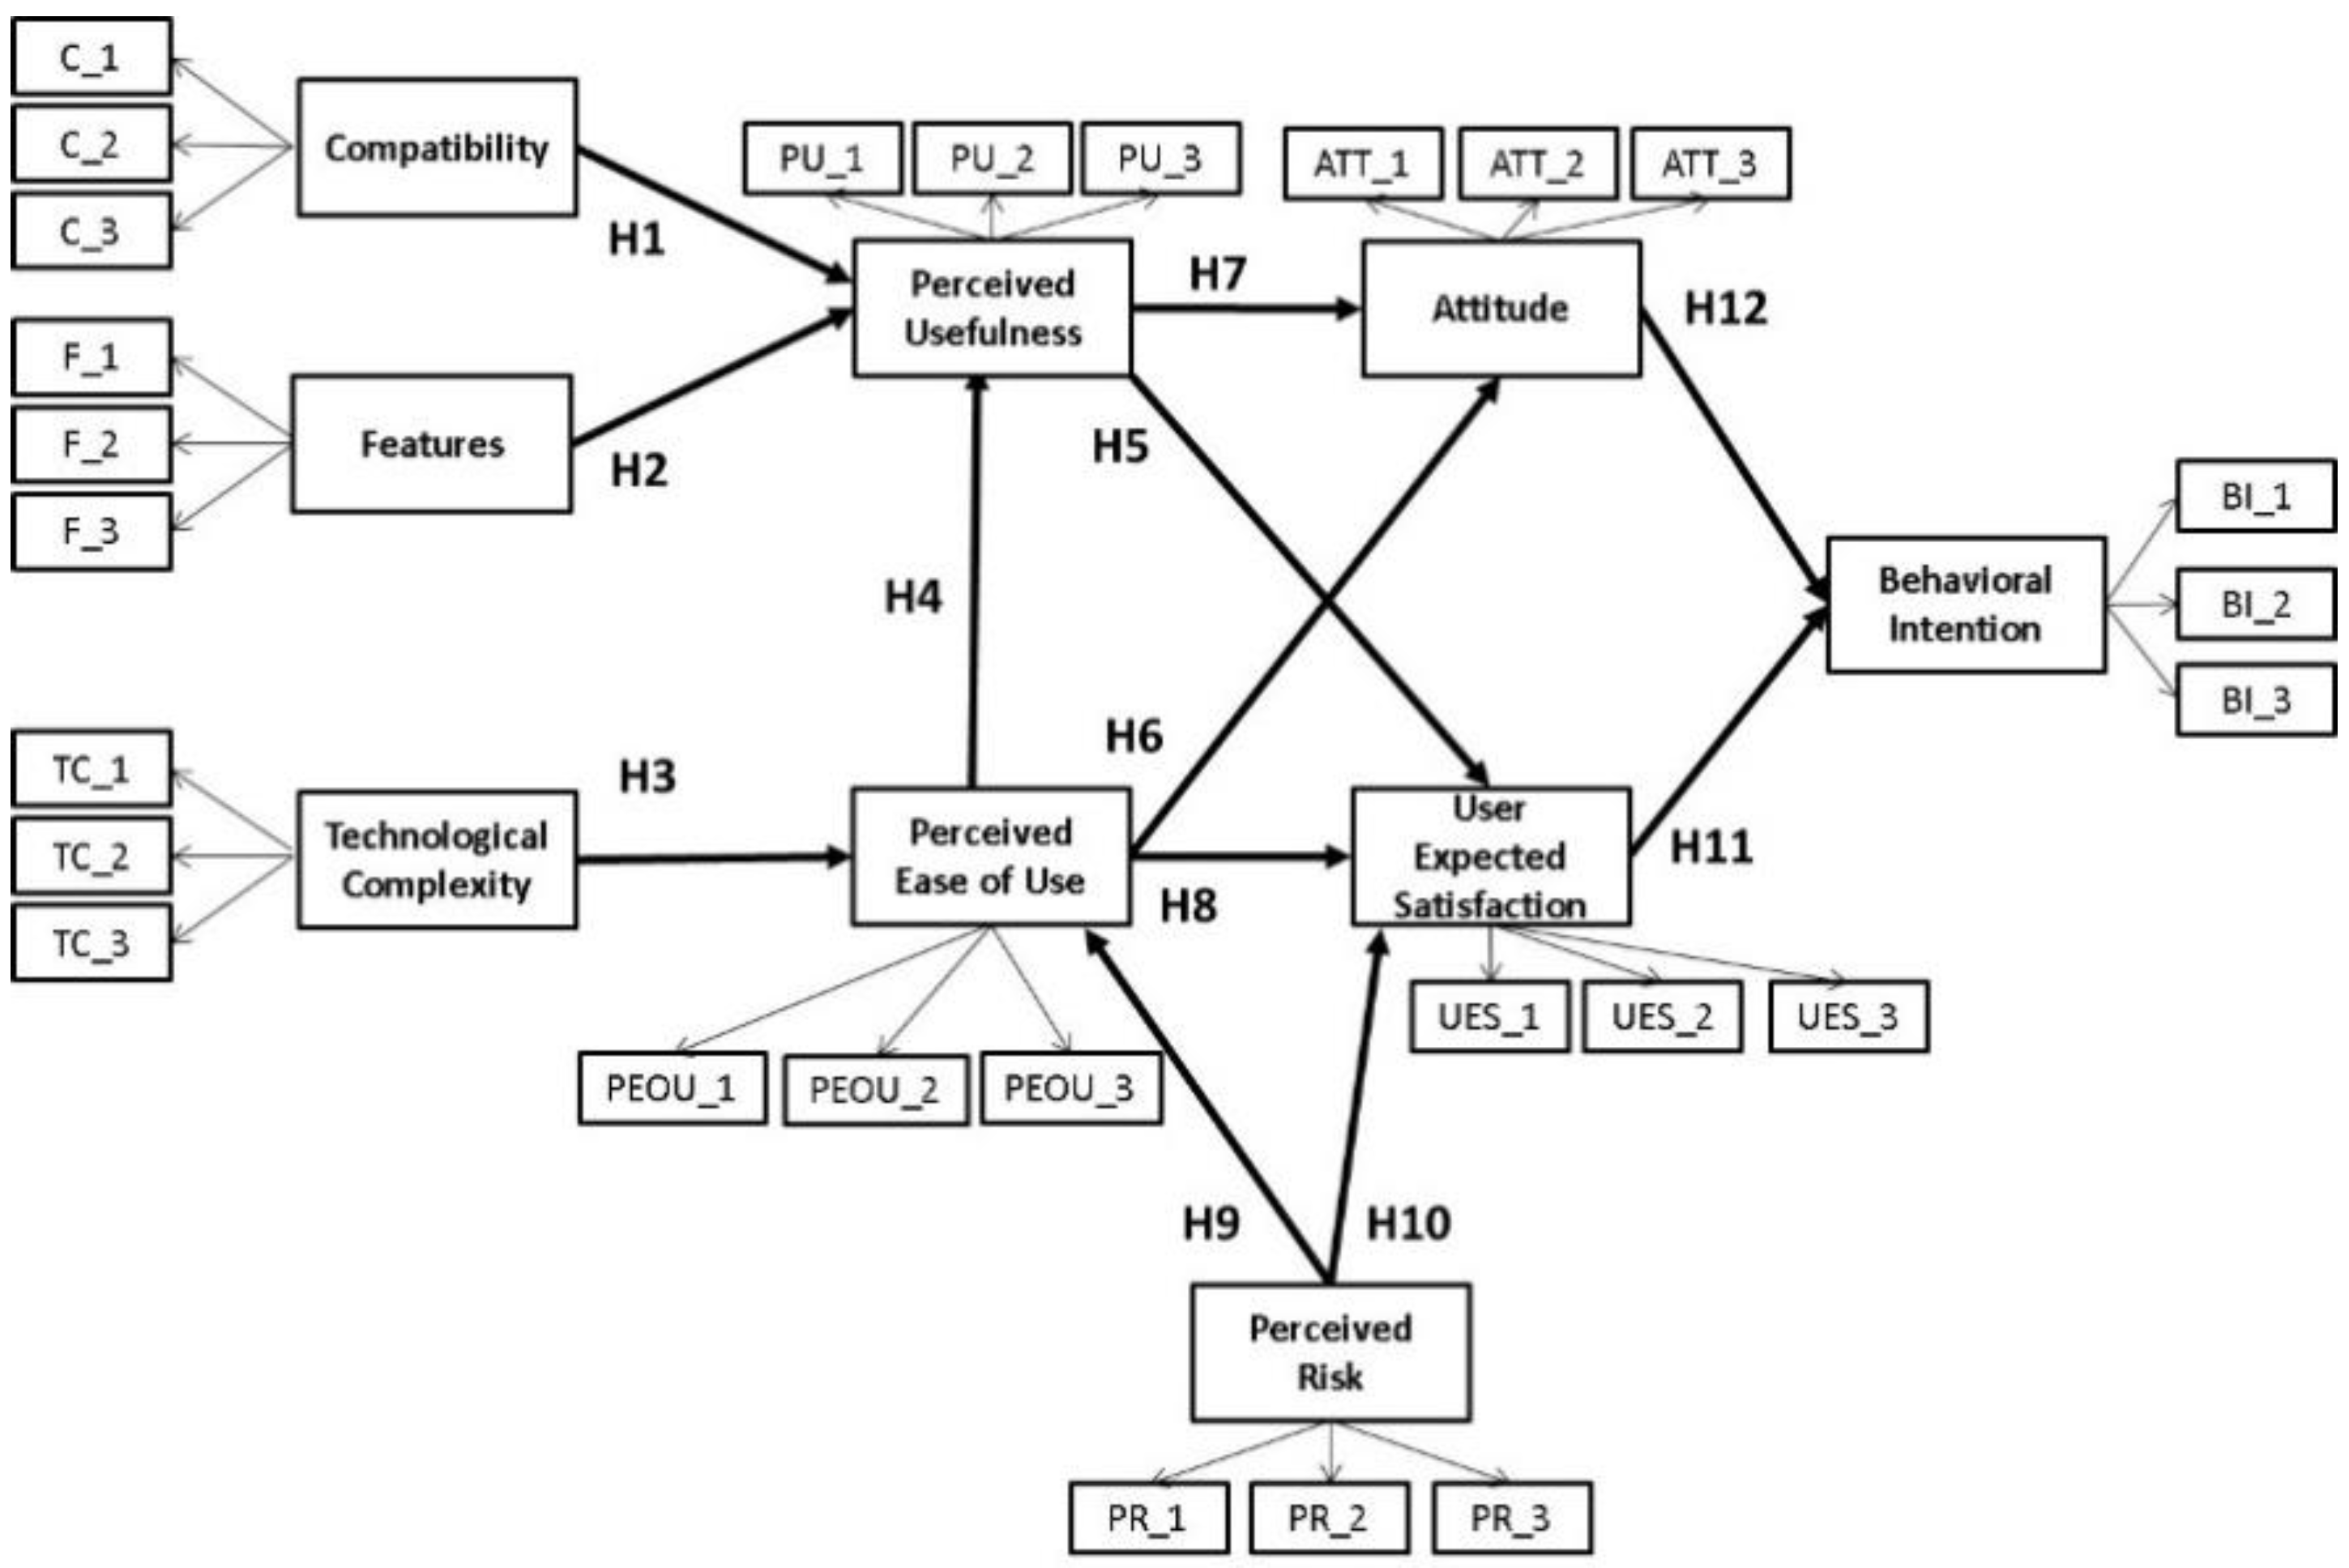
In order to understand technology acceptance from a managerial perspective, we developed a revised model with reconstructed variables from the proposed model. The relationships among the primary factors were significant in the final model, as explained in the path relation model (Figure 3). The contribution of this study is to examine the relation of compatibility, features, technology complexity, and perceived risk as important variables to the behavioral intention. The results of our study support the conclusion that technical factors, such as compatibility, features, and technological complexity, are important concerns in the BEMS acceptance study. Therefore, the BEMS are supposed to deliver diverse duties into suitable computational systems in order to minimize their complexity, while still providing many features to meet management needs. The BEMS corporation ought to consider compatibility in their program application and features, as well as the technological complexity of their interface system to enhance the user experience in using the system. In light of these results, BEMS developers should maximize both the usefulness and ease of use of the BEMS since satisfaction depends heavily on these two factors. Specifically, BEMS developers should improve the user expected satisfaction of BEMS in terms of supporting energy-savings programs and government sustainability programs. Moreover, for data safety concerns and other risks, BEMS developers must also be able to ensure that data are secure from hackers and data error by implementing a cloud networking system that users would be able to access in order to monitor the history of energy consumption in their department from anywhere and at any time. The results of this managerial perspective study also indicate that various industries, especially those in developing countries, are willing to use BEMS in order to control, monitor, and analyze their energy consumption levels.
This study gives two implications for practitioners and researchers studying BEMS. The first implication is the ability of the extended TAM to be applied within the context of the new smart-building energy management system. As shown in the results of our proposed model, the four external variables have a positively significant impact on the acceptance of BEMS by those within the managerial level. The second implication is the tendency of users within the managerial level to put more emphasis on the amount of user satisfaction received during use of the system rather than on their attitude of the user towards the system itself. As a result, managerial users in industry have an increased tendency to make rational decisions based on the total satisfaction received while using the system. However, users within the operator level put more emphasis on the technical factors of the system such as compatibility and technology complexity on their attitudes to use a new technology. Therefore, the developers should factor in considerably the managerial perspective when planning to develop smart grid technology.
There were several limitations of this study, with the most noticeable limitation being the respondents’ demographic profiles. Since the respondents were all managerial workers in large scale manufacturing companies, the participants may not represent all of the workers within the industrial sector. Additionally, all of the participants were residing in Indonesia, which, although currently the largest energy consumer country in ASEAN, is still a developing country. It may also be noted that the results of similar studies conducted within developed countries and in sectors outside the manufacturing sector may vary from those of this study. As a result, further research on the implementation of BEMS, such as a comparative study, is suggested to be conducted between the managerial level and operator level as well as within other countries and sectors in order to balance the theoretical aspects of both management and operations, and thus be able to develop a more comprehensive model for BEMS.

Acknowledgments

Along with the two anonymous reviewers who provided their insight, the authors would like to thank Albert L. Lin, a student from BASIS San Antonio North Central in San Antonio, TX, USA, for his contributions in reviewing and rewording the earlier and final versions of the manuscript.

Author Contributions

Jacky Chin performed research, collected original data, analyzed the data, and wrote the draft paper with results checking; Shu-Chiang Lin guided the methodology and research process, gave final review suggestions of the manuscript on the whole writing process. All authors read and approved the final manuscript.

Conflicts of Interest

The authors declare no conflict of interest.

References

  1. World Energy Outlook. Southeast Asia Energy Outlook & Weo 2013 Special Report; World Energy Outlook Special Report, IEA: Bangkok, Thailand, 2013. [Google Scholar]
  2. MEMR. Handbook of Energy & Economic Statistic of Indonesia; Ministry of Energy and Mineral Resources: Jakarta, Indonesia, 2014. [Google Scholar]
  3. Chin, J.; Lin, S.-C. Investigating users’ perspectives in building energy management system with an extension of technology acceptance model: A case study in indonesian manufacturing companies. Procedia Comput. Sci. 2015, 72, 31–39. [Google Scholar] [CrossRef]
  4. Rosen, M.A. Energy sustainability: A pragmatic approach and illustrations. Sustainability 2009, 1, 55–80. [Google Scholar] [CrossRef]
  5. Dewan Energi Nasional. Outlook Energi Indonesia; DEN: Jakarta, Indonesia, 2014. [Google Scholar]
  6. Maulidevi, N.U.; Khodra, M.L.; Susanto, H.; Jadid, F. Smart online monitoring system for large scale diesel engine. In Proceedings of the International Conference on Information Technology Systems and Innovation (ICITSI), Bandung, Indonesia, 23–24 November 2014; IEEE: Bandung, Indonesia, 2014; pp. 235–240. [Google Scholar]
  7. Kim, J. Managerial beliefs and incentive policies. J. Econ. Behav. Organ. 2015, 119, 84–95. [Google Scholar] [CrossRef] [Green Version]
  8. Lowry, G. Modelling user acceptance of building management systems. Autom. Constr. 2002, 11, 695–705. [Google Scholar] [CrossRef]
  9. Igure, V.M.; Laughter, S.A.; Williams, R.D. Security issues in scada networks. Comput. Secur. 2006, 25, 498–506. [Google Scholar] [CrossRef]
  10. Chou, J.-S.; Gusti Ayu Novi Yutami, I. Smart meter adoption and deployment strategy for residential buildings in indonesia. Appl. Energy 2014, 128, 336–349. [Google Scholar] [CrossRef]
  11. Aslam, W.; Soban, M.; Akhtar, F.; Zaffar, N.A. Smart meters for industrial energy conservation and efficiency optimization in pakistan: Scope, technology and applications. Renew. Sustain. Energy Rev. 2015, 44, 933–943. [Google Scholar] [CrossRef]
  12. Rocha, P.; Siddiqui, A.; Stadler, M. Improving energy efficiency via smart building energy management systems: A comparison with policy measures. Energy Build. 2015, 88, 203–213. [Google Scholar] [CrossRef]
  13. Figueiredo, J.; Sá da Costa, J. A scada system for energy management in intelligent buildings. Energy Build. 2012, 49, 85–98. [Google Scholar] [CrossRef]
  14. Fong, K.F.; Hanby, V.I.; Chow, T.T. Hvac system optimization for energy management by evolutionary programming. Energy Build. 2006, 38, 220–231. [Google Scholar] [CrossRef]
  15. Cellucci, L.; Burattini, C.; Drakou, D.; Gugliermetti, F.; Bisegna, F.; Vollaro, A.D.L.; Salata, F.; Golasi, I. Urban lighting project for a small town: Comparing citizens and authority benefits. Sustainability 2015, 7, 14230–14244. [Google Scholar] [CrossRef]
  16. Fung, C.; Tang, S.; Wong, K. A proposed study on the use of ict and smart meters to influence consumers’ behavior and attitude towards renewable energy. In Proceedings of the IEEE Power and Energy Society General Meeting, Minneapolis, MN, USA, 25–29 July 2010; IEEE: Minneapolis, MN, USA, 2010; pp. 1–5. [Google Scholar]
  17. Heinemann, B. Building Control Systems Cibse Guide H; CIBSE: London, UK, 2000. [Google Scholar]
  18. Missaoui, R.; Joumaa, H.; Ploix, S.; Bacha, S. Managing energy smart homes according to energy prices: Analysis of a building energy management system. Energy Build. 2014, 71, 155–167. [Google Scholar] [CrossRef]
  19. Introna, V.; Cesarotti, V.; Benedetti, M.; Biagiotti, S.; Rotunno, R. Energy management maturity model: An organizational tool to foster the continuous reduction of energy consumption in companies. J. Clean. Prod. 2014, 83, 108–117. [Google Scholar] [CrossRef]
  20. Vikhorev, K.; Greenough, R.; Brown, N. An advanced energy management framework to promote energy awareness. J. Clean. Prod. 2013, 43, 103–112. [Google Scholar] [CrossRef]
  21. Stromback, J.; Dromacque, C.; Yassin, M.H.; VaasaETT, Global Enery Think Tank. The Potential of Smart Meter Enabled Programs to Increase Energy and Systems Efficiency: A Mass Pilot Comparison Short Name: Empower Demand; Vaasa ETT: Helsinki, Finland, 2011. [Google Scholar]
  22. Windapo, A.O. Examination of green building drivers in the south african construction industry: Economics versus ecology. Sustainability 2014, 6, 6088–6106. [Google Scholar] [CrossRef]
  23. Burford, N.; Jones, R.; Reynolds, S.; Rodley, D. Macro micro studio: A prototype energy autonomous laboratory. Sustainability 2016, 8, 500. [Google Scholar] [CrossRef] [Green Version]
  24. Davis, F.D. User acceptance of information technology: System characteristics, user perceptions and behavioral impacts. Int. J. Man-Mach. Stud. 1993, 38, 475–487. [Google Scholar] [CrossRef]
  25. Davis, F.D.; Bagozzi, R.P.; Warshaw, P.R. User acceptance of computer technology: A comparison of two theoretical models. Manag. Sci. 1989, 35, 982–1003. [Google Scholar] [CrossRef]
  26. Venkatesh, V.; Davis, F.D. A theoretical extension of the technology acceptance model: Four longitudinal field studies. Manag. Sci. 2000, 46, 186–204. [Google Scholar] [CrossRef]
  27. Park, E.; Baek, S.; Ohm, J.; Chang, H.J. Determinants of player acceptance of mobile social network games: An application of extended technology acceptance model. Telemat. Inform. 2014, 31, 3–15. [Google Scholar] [CrossRef]
  28. Park, N.; Rhoads, M.; Hou, J.; Lee, K.M. Understanding the acceptance of teleconferencing systems among employees: An extension of the technology acceptance model. Comput. Hum. Behav. 2014, 39, 118–127. [Google Scholar] [CrossRef]
  29. Kim, H.-J.; Mannino, M.; Nieschwietz, R.J. Information technology acceptance in the internal audit profession: Impact of technology features and complexity. Int. J. Account. Inf. Syst. 2009, 10, 214–228. [Google Scholar] [CrossRef]
  30. Lin, H.-C. An investigation of the effects of cultural differences on physicians’ perceptions of information technology acceptance as they relate to knowledge management systems. Comput. Hum. Behav. 2014, 38, 368–380. [Google Scholar] [CrossRef]
  31. Jan, A.U.; Contreras, V. Technology acceptance model for the use of information technology in universities. Comput. Hum. Behav. 2011, 27, 845–851. [Google Scholar] [CrossRef]
  32. Wallace, L.G.; Sheetz, S.D. The adoption of software measures: A technology acceptance model (tam) perspective. Inf. Manag. 2014, 51, 249–259. [Google Scholar] [CrossRef]
  33. Pai, F.-Y.; Huang, K.-I. Applying the technology acceptance model to the introduction of healthcare information systems. Technol. Forecast. Soc. Chang. 2011, 78, 650–660. [Google Scholar] [CrossRef]
  34. Choi, Y.K.; Totten, J.W. Self-construal’s role in mobile tv acceptance: Extension of tam across cultures. J. Bus. Res. 2012, 65, 1525–1533. [Google Scholar] [CrossRef]
  35. Son, H.; Park, Y.; Kim, C.; Chou, J.-S. Toward an understanding of construction professionals’ acceptance of mobile computing devices in south korea: An extension of the technology acceptance model. Autom. Construct. 2012, 28, 82–90. [Google Scholar] [CrossRef]
  36. Ghazizadeh, M.; Lee, J.D.; Boyle, L.N. Extending the technology acceptance model to assess automation. Cognit. Technol. Work 2012, 14, 39–49. [Google Scholar] [CrossRef]
  37. Chiu, C.-M.; Lin, H.-Y.; Sun, S.-Y.; Hsu, M.-H. Understanding customers’ loyalty intentions towards online shopping: An integration of technology acceptance model and fairness theory. Behav. Inf. Technol. 2009, 28, 347–360. [Google Scholar] [CrossRef]
  38. Lee, M.-C. Explaining and predicting users’ continuance intention toward e-learning: An extension of the expectation-confirmation model. Comput. Educ. 2010, 54, 506–516. [Google Scholar] [CrossRef]
  39. Mah, D.N.-Y.; van der Vleuten, J.M.; Hills, P.; Tao, J. Consumer perceptions of smart grid development: Results of a hong kong survey and policy implications. Energy Policy 2012, 49, 204–216. [Google Scholar] [CrossRef]
  40. Im, I.; Kim, Y.; Han, H.-J. The effects of perceived risk and technology type on users’ acceptance of technologies. Inf. Manag. 2008, 45, 1–9. [Google Scholar] [CrossRef]
  41. Johnson, M.S.; Sivadas, E.; Garbarino, E. Customer satisfaction, perceived risk and affective commitment: An investigation of directions of influence. J. Serv. Mark. 2008, 22, 353–362. [Google Scholar] [CrossRef]
  42. Al-Gahtani, S.S.; King, M. Attitudes, satisfaction and usage: Factors contributing to each in the acceptance of information technology. Behav. Inf. Technol. 1999, 18, 277–297. [Google Scholar] [CrossRef]
  43. Cronbach, L.J. Coefficient alpha and the internal structure of tests. Psychometrika 1951, 16, 297–334. [Google Scholar] [CrossRef]
  44. Hulland, J. Use of partial least squares (pls) in strategic management research: A review of four recent studies. Strateg. Manag. J. 1999, 20, 195–204. [Google Scholar]
  45. Eisenberger, R.; Armeli, S.; Rexwinkel, B.; Lynch, P.D.; Rhoades, L. Reciprocation of perceived organizational support. J. Appl. Psychol. 2001, 86, 42–51. [Google Scholar] [PubMed]
  46. Agudo-Peregrina, Á.F.; Hernández-García, Á.; Pascual-Miguel, F.J. Behavioral intention, use behavior and the acceptance of electronic learning systems: Differences between higher education and lifelong learning. Comput. Hum. Behav. 2014, 34, 301–314. [Google Scholar] [CrossRef]
  47. Barclay, D.; Higgins, C.; Thompson, R. The partial least squares (pls) approach to causal modeling: Personal computer adoption and use as an illustration. Technol. Stud. 1995, 2, 285–309. [Google Scholar]
  48. Fornell, C.; Larcker, D.F. Evaluating structural equation models with unobservable variables and measurement error. J. Mark. Res. 1981, 18, 39–50. [Google Scholar] [CrossRef]
  49. Nicholas, J.; Ledwith, A.; Aloini, D.; Martini, A.; Nosella, A. Searching for radical new product ideas: Exploratory and confirmatory factor analysis for construct validation. Int. J. Technol. Manag. 2015, 68, 70–98. [Google Scholar] [CrossRef]
  50. Persada, S.; Lin, S.; Nadlifatin, R.; Razif, M. Investigating the citizens’ intention level in environmental impact assessment participation through an extended theory of planned behavior model. Glob. Nest J. 2015, 17, 847–857. [Google Scholar]
  51. Lin, S.-C.; Persada, S.F.; Nadlifatin, R. A study of student behavior in accepting the blackboard learning system: A technology acceptance model (tam) approach. In Proceedings of the IEEE 18th International Conference on Computer Supported Cooperative Work in Design (CSCWD), Hsinchu, Taiwan, 21–23 May 2014; IEEE: London, UK; pp. 457–462.
  52. Schermelleh-Engel, K.; Moosbrugger, H.; Müller, H. Evaluating the fit of structural equation models: Tests of significance and descriptive goodness-of-fit measures. Methods Psychol. Res. Online 2003, 8, 23–74. [Google Scholar]
  53. Steiger, J.H. Structural model evaluation and modification: An interval estimation approach. Multivar. Behav. Res. 1990, 25, 173–180. [Google Scholar] [CrossRef] [PubMed]
  54. Hair, J.F.; Black, W.C.; Babin, B.J.; Anderson, R.E.; Tatham, R.L. Multivariate Data Analysis; Pearson Prentice Hall: Upper Saddle River, NJ, USA, 2006; Volume 6. [Google Scholar]
  55. Cheung, G.W.; Rensvold, R.B. Evaluating goodness-of-fit indexes for testing measurement invariance. Struct. Equ. Model. 2002, 9, 233–255. [Google Scholar] [CrossRef]
  56. Gerbing, D.W.; Anderson, J.C. Monte carlo evaluations of goodness of fit indices for structural equation models. Sociol. Methods Res. 1992, 21, 132–160. [Google Scholar] [CrossRef]
  57. Hooper, D.; Coughlan, J.; Mullen, M. Structural equation modelling: Guidelines for determining model fit. Electron. J. Bus. Res. Methods 2008, 6, 53–60. [Google Scholar]
  58. Lin, S.-C.; Persada, S.F.; Nadlifatin, R.; Tsai, H.-Y.; Chu, C.-H. Exploring the influential factors of manufacturers’ initial intention in applying for the green mark ecolabel in taiwan. Int. J. Precis. Eng. Manuf. Green Technol. 2015, 2, 359–364. [Google Scholar] [CrossRef]
  59. Wu, J.-H.; Tennyson, R.D.; Hsia, T.-L. A study of student satisfaction in a blended e-learning system environment. Comput. Educ. 2010, 55, 155–164. [Google Scholar] [CrossRef]
Figure 1. Building energy management system architecture.
Sustainability 08 00641 g001
Figure 2. Proposed model.
Sustainability 08 00641 g002
Figure 3. Results of structural equation modeling.
Sustainability 08 00641 g003
Table 1. Research hypothesis.
ItemHypothesis
H1:Compatibility (C) positively affects the Perceived Usefulness (PU) of using the BEMS [3,36].
H2:Features (F) positively affect the Perceived Usefulness (PU) of using the BEMS [10,29,34].
H3:Technological complexity (TC) positively affects the Perceived Ease of Use (PEOU) of using the BEMS [3,35].
H4:Perceived Ease of Use (PEOU) positively affects the Perceived Usefulness (PU) of using the BEMS [3,24,37].
H5:Perceived Usefulness (PU) positively affects the User Expected Satisfaction (UES) of using the BEMS [10,38].
H6:Perceived Ease of Use (PEOU) positively affects Attitude (ATT) towards using the BEMS [3,10,25].
H7:Perceived Usefulness (PU) positively affects Attitude (ATT) towards using the BEMS [3,10,25].
H8:Perceived Ease of Use (PEOU) positively affects the User Expected Satisfaction (UES) of using the BEMS [10,35].
H9:Perceived Risk (PR) positively affects the Perceived Ease of Use (PEOU) of using the BEMS [10,39,40].
H10:Perceived Risk (PR) positively affects the User Expected Satisfaction (UES) of using the BEMS [10,41].
H11:User Expected Satisfaction (UES) positively affects Behavioral Intention (BI) toward using the BEMS [10,35,42].
H12:Attitude (ATT) positively affect Behavioral Intention (BI) toward using the BEMS [3,24,42].
Table 2. The questionnaire items regarding the research constructs.
ConstructMeasurement Items
CC1Using the BEMS is compatible with all aspects of my subordinates’ work [3]
C2I think using the BEMS fits well with the way my subordinates like to work [3]
C3I believe my subordinates’ work style is in line with the BEMS [3]
FF1Management can control the energy consumption
F2Management can see the effectiveness of the energy consumption
F3Management can compare the efficiency of the energy consumption
TCTC1I have no difficulty using the BEMS menus to check records [3]
TC2I have no difficulty working with the BEMS [3]
TC3I have no difficulty importing and exporting data from other devices [3]
PRPR1I do not worry about internet access risk to use of the BEMS
PR2Using the BEMS is not a risky decision
PR3I do not worry about cyber attacks
UESUES1Using the BEMS meets management needs
UES2Using the BEMS is a wise decision for management
UES3Using EMS is the right thing for management
PEOUPEOU1I believe the BEMS is easy to understand
PEOU2Overall, I believe that the BEMS is easy to use
PEOU3Learning to operate the BEMS is easy for my subordinates
PUPU1Using the BEMS improves the quality of my subordinates’ work
PU2The BEMS is useful for improving my work
PU3Using BEMS to measure the energy usage is useful for management
ATTATT1I have a positive view toward using the BEMS for monitoring energy usage
ATT2I feel that using the BEMS is a wise idea for monitoring energy usage
ATT3Using BEMS is positive for management
BIBI1Using the BEMS is a very wise idea
BI2I am positive toward the idea of using the BEMS
BI3Using BEMS is a good idea to support management program
Table 3. Reliability and validity analysis results.
FactorItemFactors Loading (≥0.7) [43,48]Cronbach’s α (≥0.7) [43,48]Composite Reliability (CR) (≥0.6) [43,48]AVE (≥0.5) [43,48]
CompatibilityC10.7960.7800.8240.610
C20.814
C30.709
FeaturesF10.780.8180.8610.674
F20.815
F30.867
Technology ComplexityTC10.7010.7520.7680.536
TC20.767
TC30.784
Perceived of UsefulnessPU10.7990.7630.7810.588
PU20.730
PU30.751
Perceived Ease of UsePEOU10.7320.7710.7870.602
PEOU20.771
PEOU30.823
Perceived RiskPR10.7340.7460.7390.562
PR20.767
PR30.754
User Expected SatisfactionUES10.7910.7630.7920.614
UES20.743
UES30.769
AttitudeATT10.8320.7890.8180.625
ATT20.792
ATT30.768
Behavior IntentionBI10.7880.7390.7340.561
BI20.713
BI30.704
Table 4. The correlations among the constructs.
TCFCPRPEOUPUUESATTBI
TC0.603
F0.0000.935
C0.0000.0000.843
PR0.0000.0000.0000.934
PEOU0.3330.0000.0000.2610.632
PU0.0000.5550.5050.0000.1960.782
UES0.1250.1810.1640.4930.3470.2540.611
ATT0.0230.0610.0770.0010.0220.140.3640.437
BI0.0740.1070.0.980.2930.2070.1510.3640.3120.517
Table 5. Model fit test.
Goodness of Fit Model IndexMinimum Value [57]Result
X2/df<21.436
RMSEA<0.050.045
GFI>0.900.911
TLI>0.900.920
CFI>0.900.932
Table 6. Test results of hypothesis.
HypothesisEst. (β)Sig. (p)Result
H1: PU ← C0.5990.001 ***Supported
H2: PU ← F0.5360.001 ***Supported
H3: PEOU ← TC0.5510.001 ***Supported
H4: PU ← PEOU0.3420.001 ***Supported
H5: UES ← PU0.3250.001 ***Supported
H6: ATT ← PEOU0.0140.921Not Supported
H7: ATT ← PU0.1900.159Not Supported
H8: UES ← PEOU0.3750.001 ***Supported
H9: PEOU ← PR0.2790.002 **Supported
H10: UES ← PR0.4230.001 ***Supported
H11: BI ← UES0.4760.001 ***Supported
H12: BI ← ATT0.4500.001 ***Supported
** p < 0.01; *** p < 0.001.

