
Inequalities in Human Well-Being in the Urban Ganges Brahmaputra Meghna Delta

Abstract
:1. Introduction
2. Data and Methods
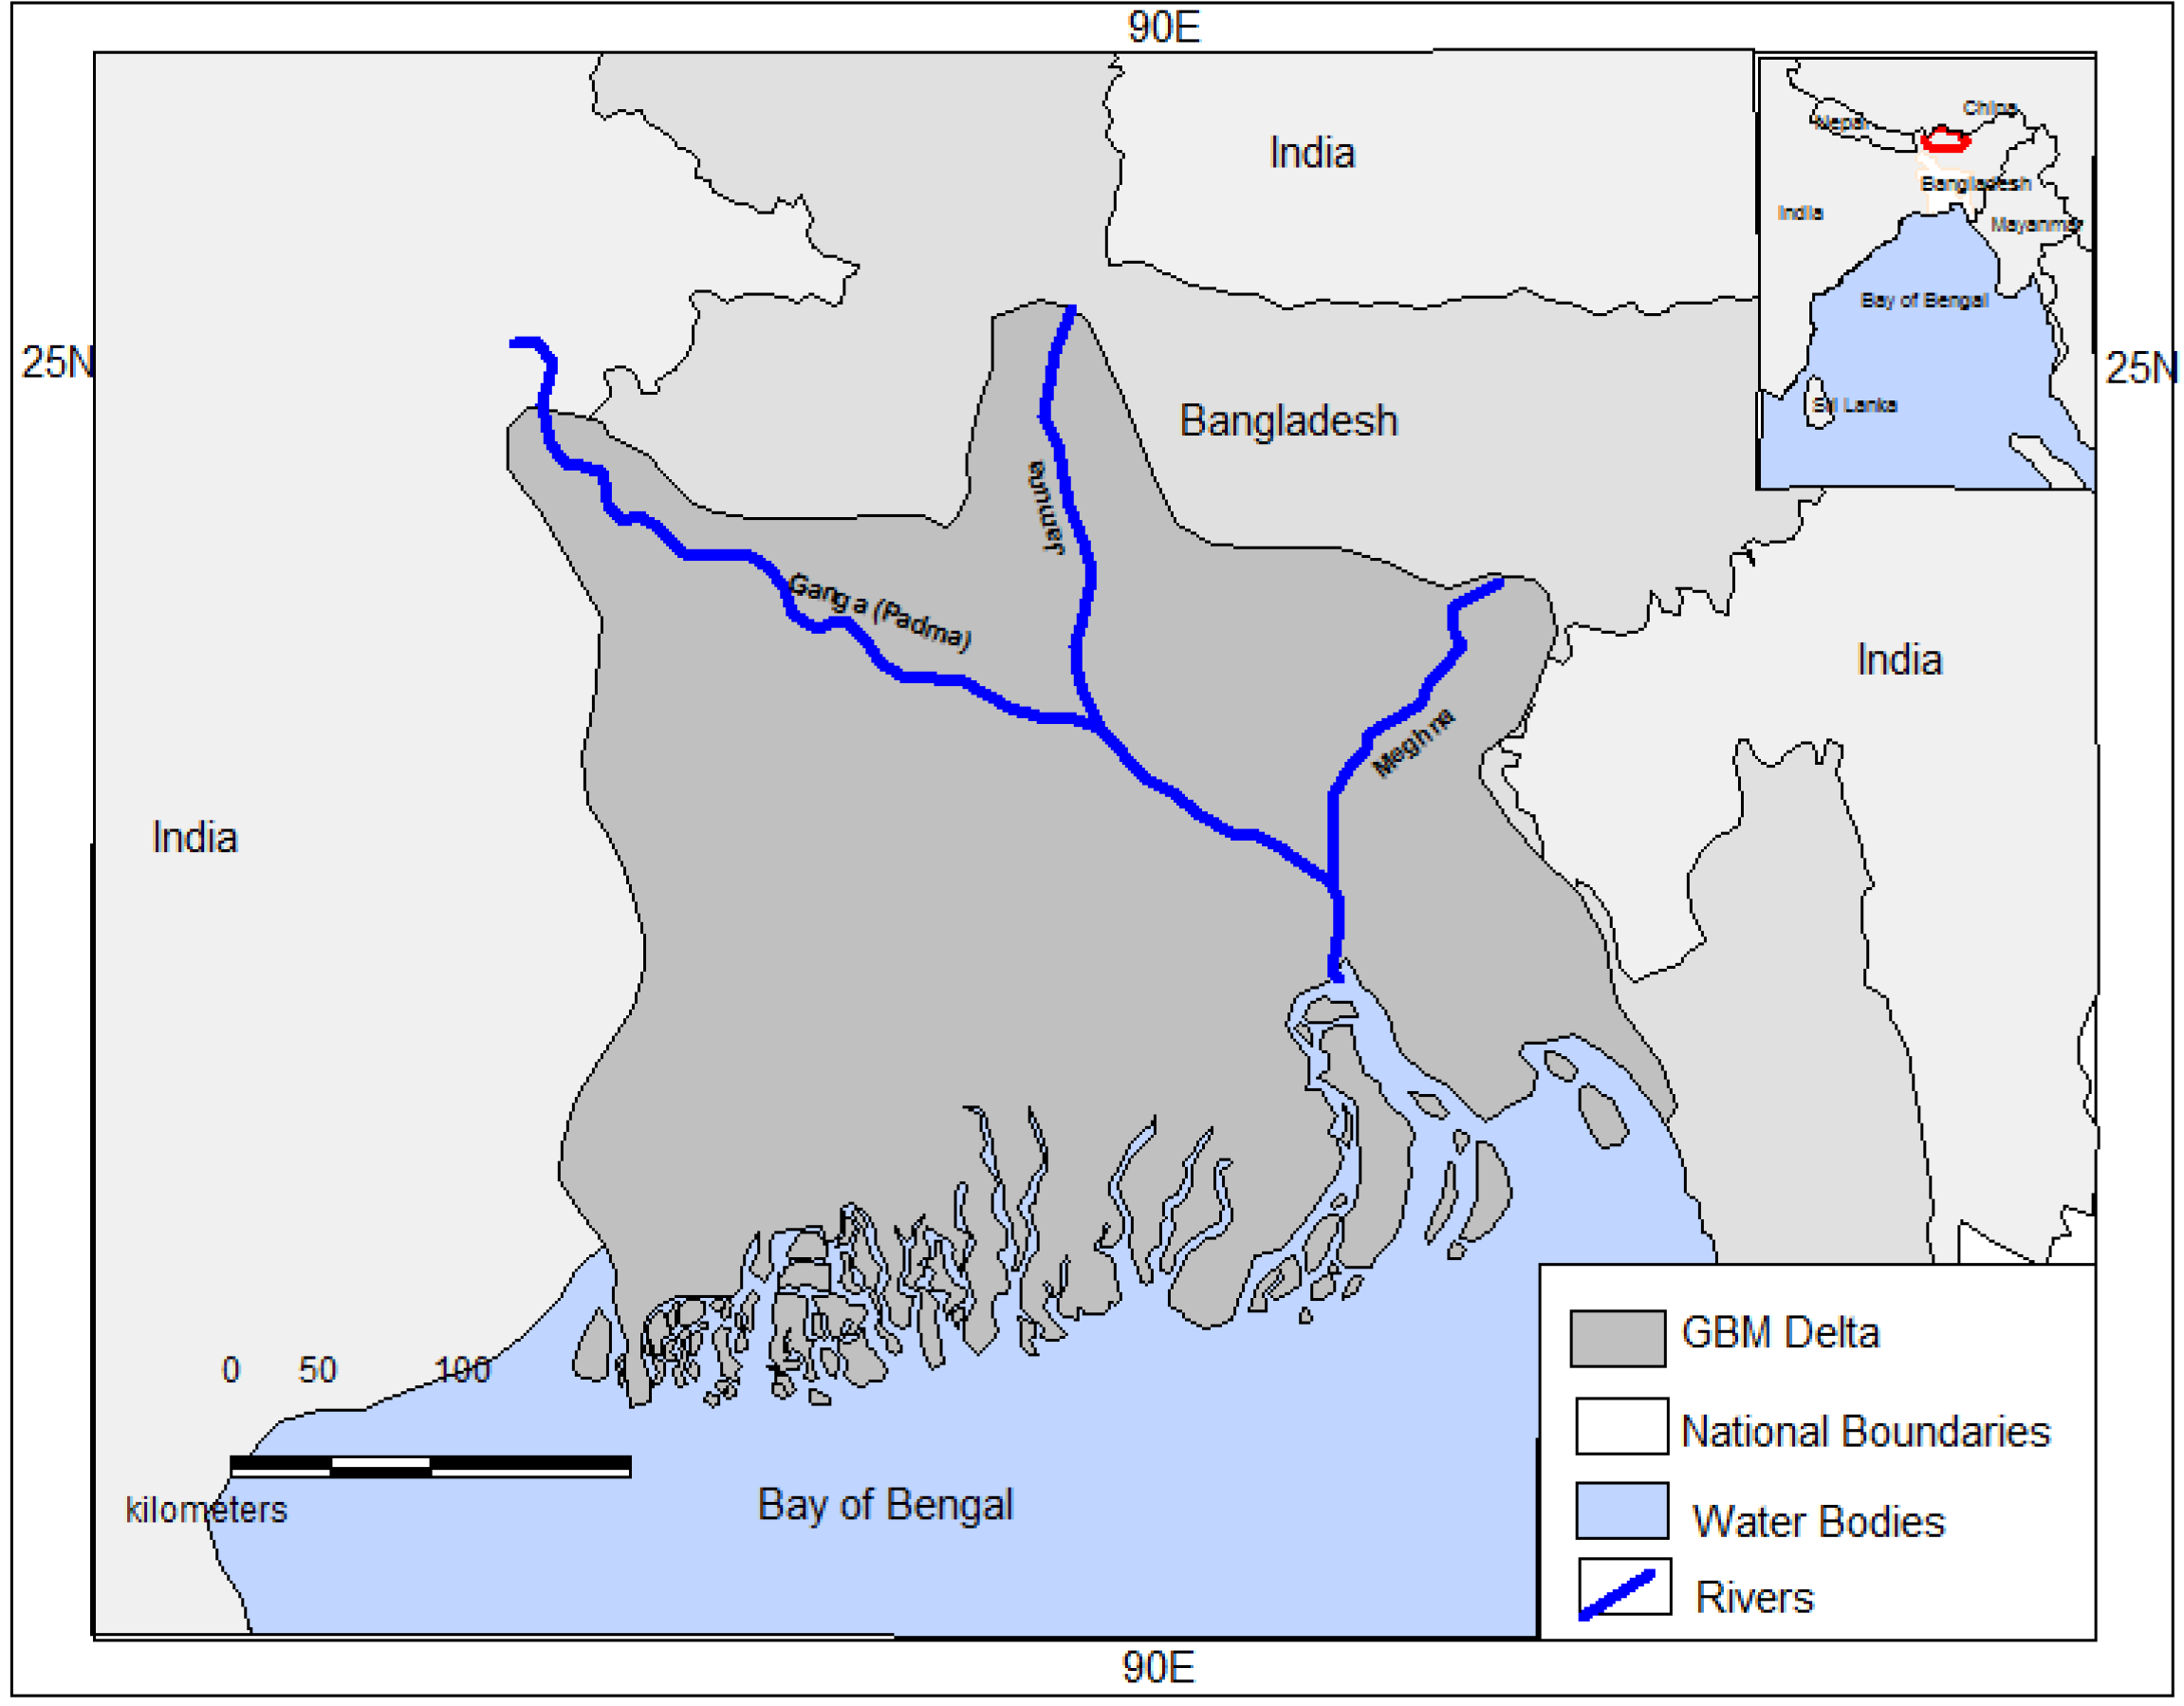
2.1. The Study Area
2.2. The Dataset
2.3. Methods
3. Results
3.1. Descriptive Statistics
3.2. Inequality Measures
3.3. Results of Multivariate Analysis
4. Conclusions
Acknowledgments
Author Contributions
Conflicts of Interest
References
- United Nations (UN). World Urbanization Prospects, the 2014 Revision, 2014. Available online: http://esa.un.org/unpd/wup/DataQuery/ (accessed on 26 May 2015).
- Castells-Quintana, D. Malthus living in a slum: Urban concentration, infrastructure and economic growth. J. Urban Econ. 2016. [Google Scholar] [CrossRef]
- United Nations Habitat (UNHABITAT). State of the World’s Cities Report 2012/2013: Prosperity of Cities, 2012; United Nations Human Settlements Programme UN: Nairobi, Kenya, 2014. [Google Scholar]
- Szabo, S. Urbanisation and inequalities in a post-Malthusian context: Implications for sustainable development. Springer, 2016. [Google Scholar]
- Rana, M.M. Urbanization and sustainability: challenges and strategies for sustainable urban development in Bangladesh. Environ. Dev. Sustain. 2011, 13, 237–256. [Google Scholar] [CrossRef]
- Leal Filho, W. Climate Change and the Sustainable Use of Water Resources; Springer Science & Business Media: Berlin, Germany, 2011. [Google Scholar]
- United Nations (UN). World Urbanization Prospects, The 2011 Revision; UN: New York, NY, USA, 2012. [Google Scholar]
- Mallick, B.; Vogt, J. Cyclone, coastal society and migration: Empirical evidence from Bangladesh. Int. Dev. Plan. Rev. 2012, 34, 217–240. [Google Scholar] [CrossRef]
- Alam, S. Environmentally induced migration from Bangladesh to India. Strateg. Anal. 2008, 27, 422–438. [Google Scholar] [CrossRef]
- Hossain, S. Rapid urban growth and poverty in Dhaka city. Bangladesh e-J. Sociol. 2008, 5, 57–80. [Google Scholar]
- Banks, N.; Roy, M.; Hulme, D. Neglecting the urban poor in Bangladesh: Research, policy and action in the context of climate change. Environ. Urban. 2011, 23, 487–502. [Google Scholar] [CrossRef]
- Khan, H.A. Challenges for Sustainable Development: Rapid Urbanization, Poverty and Capabilities in Bangladesh. Available online: http://mpra.ub.uni-muenchen.de/9290/1/MPRA_paper_9290.pdf (accessed on 10 April 2014).
- Szabo, S. Urbanisation and food insecurity risks: Assessing the role of human development. Oxf. Dev. Stud. 2016, 44, 28–48. [Google Scholar] [CrossRef]
- Szabo, S. Urbanisation and Inequalities in a Post-Malthusian Context. Challenges for the Sustainable Development Agenda; Springer: Berlin, Germany, 2016. [Google Scholar]
- Marx, B.; Stoker, T.; Tavneet, S. The economics of slums in the developing world. J. Econ. Perspect. 2013, 27, 187–210. [Google Scholar] [CrossRef]
- Sanderson, D. Building livelihoods to reduce risk among the most marginalized in urban areas: Strategic approaches from Dhaka. Environ. Hazards Hum. Policy Dimens. 2012, 11, 112–122. [Google Scholar] [CrossRef]
- Chowdhury, A.M.R.; Bhuiya, A.; Chowdhury, M.E.; Rasheed, S.; Hussain, Z.; Chen, L.C. The Bangladesh paradox: Exceptional health achievement despite economic poverty. Lancet 2013, 382, 1734–1745. [Google Scholar] [CrossRef]
- United Nations. Introduction and Proposed Goals and Targets on Sustainable Development for the Post 2015 Development Agenda. Available online: https://sustainabledevelopment.un.org/content/documents/4528zerodraft12OWG.pdf (accessed on 21 June 2016).
- Cohen, B. Urbanization in developing countries: Current trends, future projections, and key challenges for sustainability. Technol. Soc. 2006, 28, 63–80. [Google Scholar] [CrossRef]
- Allen, A.; You, N.; Atkinson, A.B. Sustainable Urbanization: Bridging the Green and Brown Agendas; UN-Habitat: Nairobi, Kenya, 2002. [Google Scholar]
- United Nations. Open Working Group Proposal for Sustainable Development Goals. Available online: https://sustainabledevelopment.un.org/content/documents/1579SDGs%20Proposal.pdf (accessed on 20 January 2016).
- UNICEF. Understanding Urban Inequalities in Bangladesh: A Prerequisite for Achieving Vision 2021; United Nations Children’s Fund (UNICEF): Dhaka, Bangladesh, 2010. [Google Scholar]
- Khan, M.M.; Kramer, A.; Khandoker, A.; Prufer-Kramer, L.; Islam, A. Trends in sociodemographic and health-related indicators in Bangladesh, 1993–2007: Will inequities persist? Bull. World Health Organ. 2011, 89, 583–593. [Google Scholar] [CrossRef] [PubMed]
- Castells-Quintana, D.; Royuela, V. Agglomeration, inequality and economic growth. Ann. Reg. Sci. 2014, 52, 343–366. [Google Scholar] [CrossRef] [Green Version]
- Jahan, F.; Shahan, A.M.; Rashid, M.M.; Khan, S.R. Poverty and Climate Change in Urban Bangladesh (ClimUrb): A Case Study of Magbara, Khulna. Available online: r4d.dfid.gov.uk/pdf/outputs/ESRC_DFID/60723_Poverty_Climate.pdf (accessed on 21 June 2016).
- Filmer, D.; Pritchett, L.H. Estimating wealth effects without expenditure data—Or tears: An application to educational enrollments in states of India. Demography 2001, 38, 115–132. [Google Scholar] [PubMed]
- Rutstein, S.O.; Johnson, K. The DHS Wealth Index; ORC Macro: Calverton, NY, USA, 2004. [Google Scholar]
- World Bank. In Introduction to Poverty Analysis; World Bank: Washington, DC, USA, 2005.
- United Nations Development Programme (UNDP). Human Development Report 2013. The Rise of the South: Human Progress in a Diverse World; United Nations Development Program (UNDP): New York, NY, USA, 2013. [Google Scholar]
- BBS. Report of the Household Income and Expenditure Survey 2010; Bangladesh Bureau of Statistics (BBS): Dhaka, Bangladesh, 2011. [Google Scholar]
- United Nations Development Programme (UNDP). International Human Development Indicators; United Nations Development Program (UNDP): New York, NY, USA, 2011. [Google Scholar]
- O’Donnell, O.; van Doorslaer, E.; Wagstaff, A.; Lindelow, M. Analyzing Health Equity Using Household Survey dAta: A Guide to Techniques and Their Implementation; World Bank: Washington, DC, USA, 2008. [Google Scholar]
- De Maio, F.G. Income inequality measures. J. Epidemiol. Commun. Health 2007, 61, 849–852. [Google Scholar] [CrossRef] [PubMed]
- Van Duynhoven, Y.T.H.P.; de Jonge, R. Transmission of Helicobacter pylori: A role for food? Bull. World Health Organ. 2001, 79, 455–460. [Google Scholar] [PubMed]
- MEASURE Evaluation; ICDDR, B. Bangladesh District Level Socio-Demographic and Health Care Utilization Indicators. Available online: http://www.cpc.unc.edu/measure/resources/publications/tr-11-84/at_download/document (accessed on 6 June 2016).
- Hossain, S. Poverty, household strategies and coping with urban life: Examining “livelihood framework” in Dhaka city, Bangladesh. Bangladesh e-J. Sociol. 2005, 2, 45–52. [Google Scholar]
- Bushamuka, V.N.; de Pee, S.; Talukder, A.; Kiess, L.; Panagides, D.; Taher, A.; Bloem, M. Impact of a homestead gardening program on household food security and empowerment of women in Bangladesh. Food Nutr. Bull. 2005, 26, 17–25. [Google Scholar] [CrossRef] [PubMed]
- Uddin, M.N.; Jones, E.M. Sanitation: The Crisis of the Urban Poor. Available online: http://wedc.lboro.ac.uk/resources/conference/26/Uddin.pdf (accessed on 6 June 2016).
- Alirol, E.; Getaz, L.; Stoll, B.; Chappuis, F.; Loutan, L. Urbanisation and infectious diseases in a globalised world. Lancet Infect. Dis. 2011, 11, 131–141. [Google Scholar] [CrossRef]
- Dragomirescu-Gaina, C.; Elia, L; Weber, A. A fast-forward look at tertiary education attainment in Europe 2020. J. Policy Model. 2015, 37, 804–819. [Google Scholar] [CrossRef]
- Girardet, H. Creating Sustainable Cities; Green Books: Cambridge, UK, 1999. [Google Scholar]
- United Nations Statistical Commission (UNSC). Technical Report by the Bureau of the United Nations Statistical Commission (UNSC) on the Process of the Development of an Indicator Framework for the Goals and Targets of the Post-2015 Development Agenda; United Nations United Nations Statistical Commission (UNSC): New York, NY, USA, 2015. [Google Scholar]


| Variable | Mean | Minimum | Maximum | n |
|---|---|---|---|---|
| Outcome variables | ||||
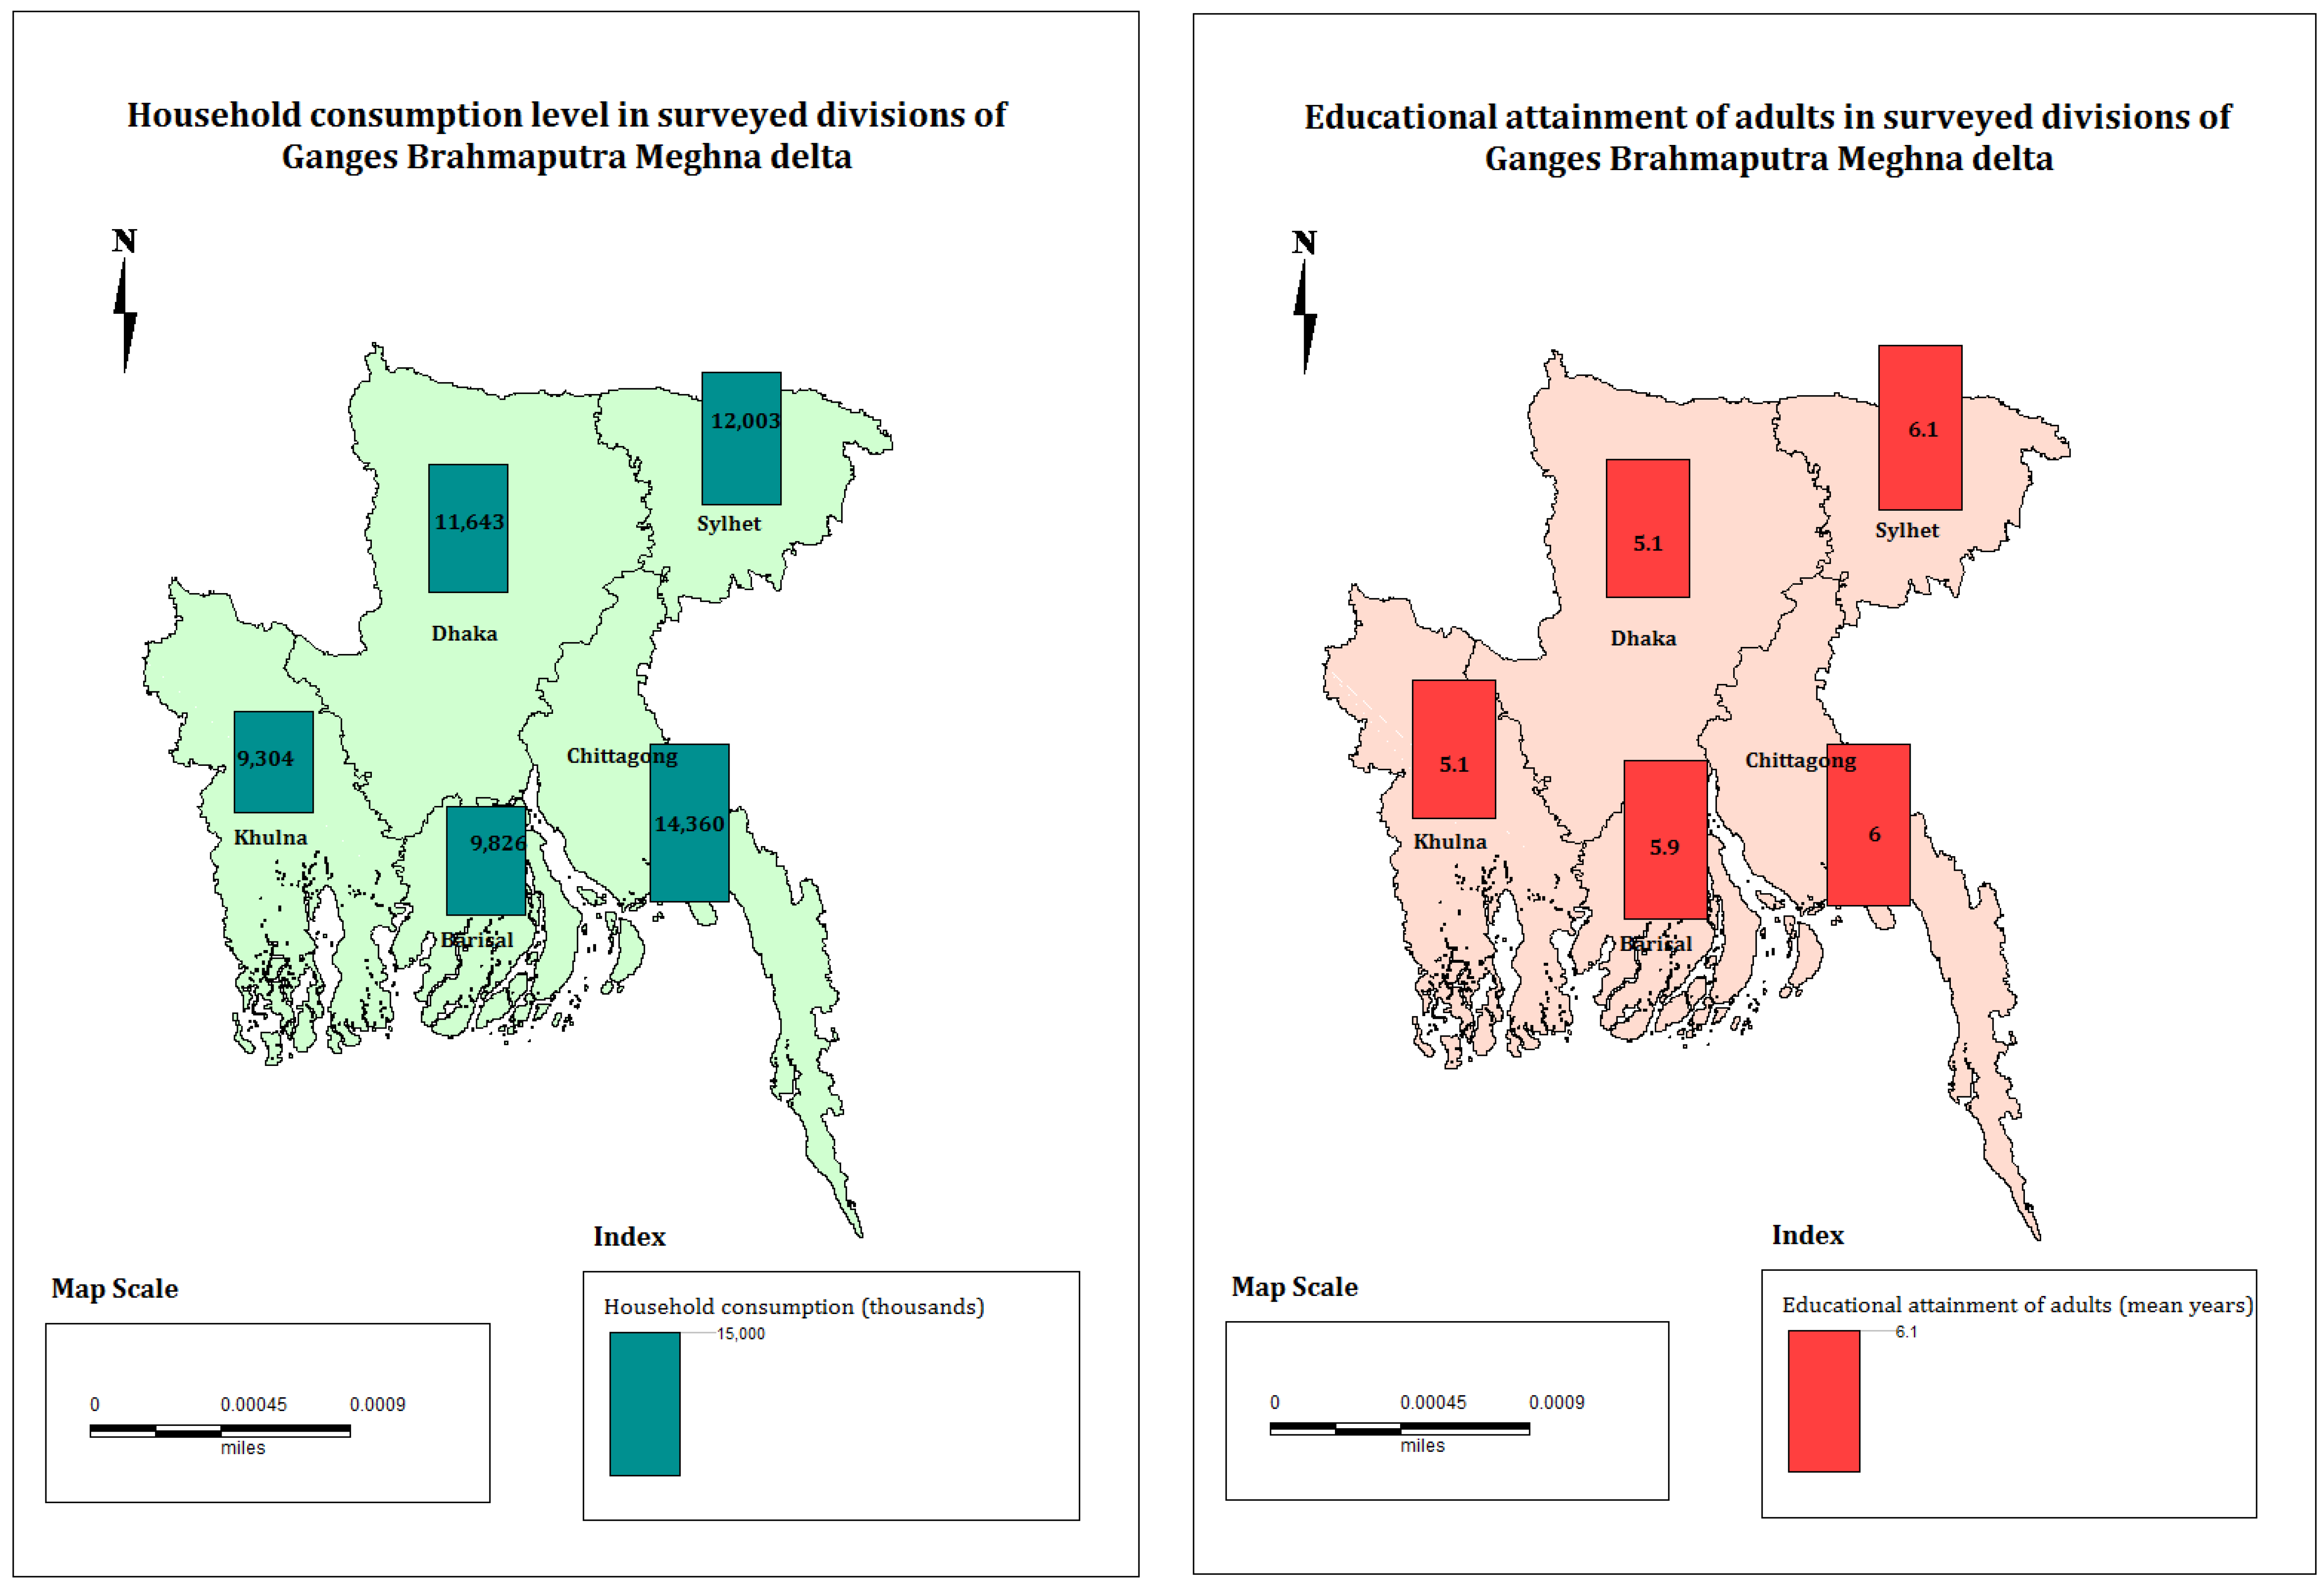
| HH consumption | 16,102 | 702 | 215,048 | 3300 |
| Educational attainment | 5.7 | 0 | 19 | 7235 |
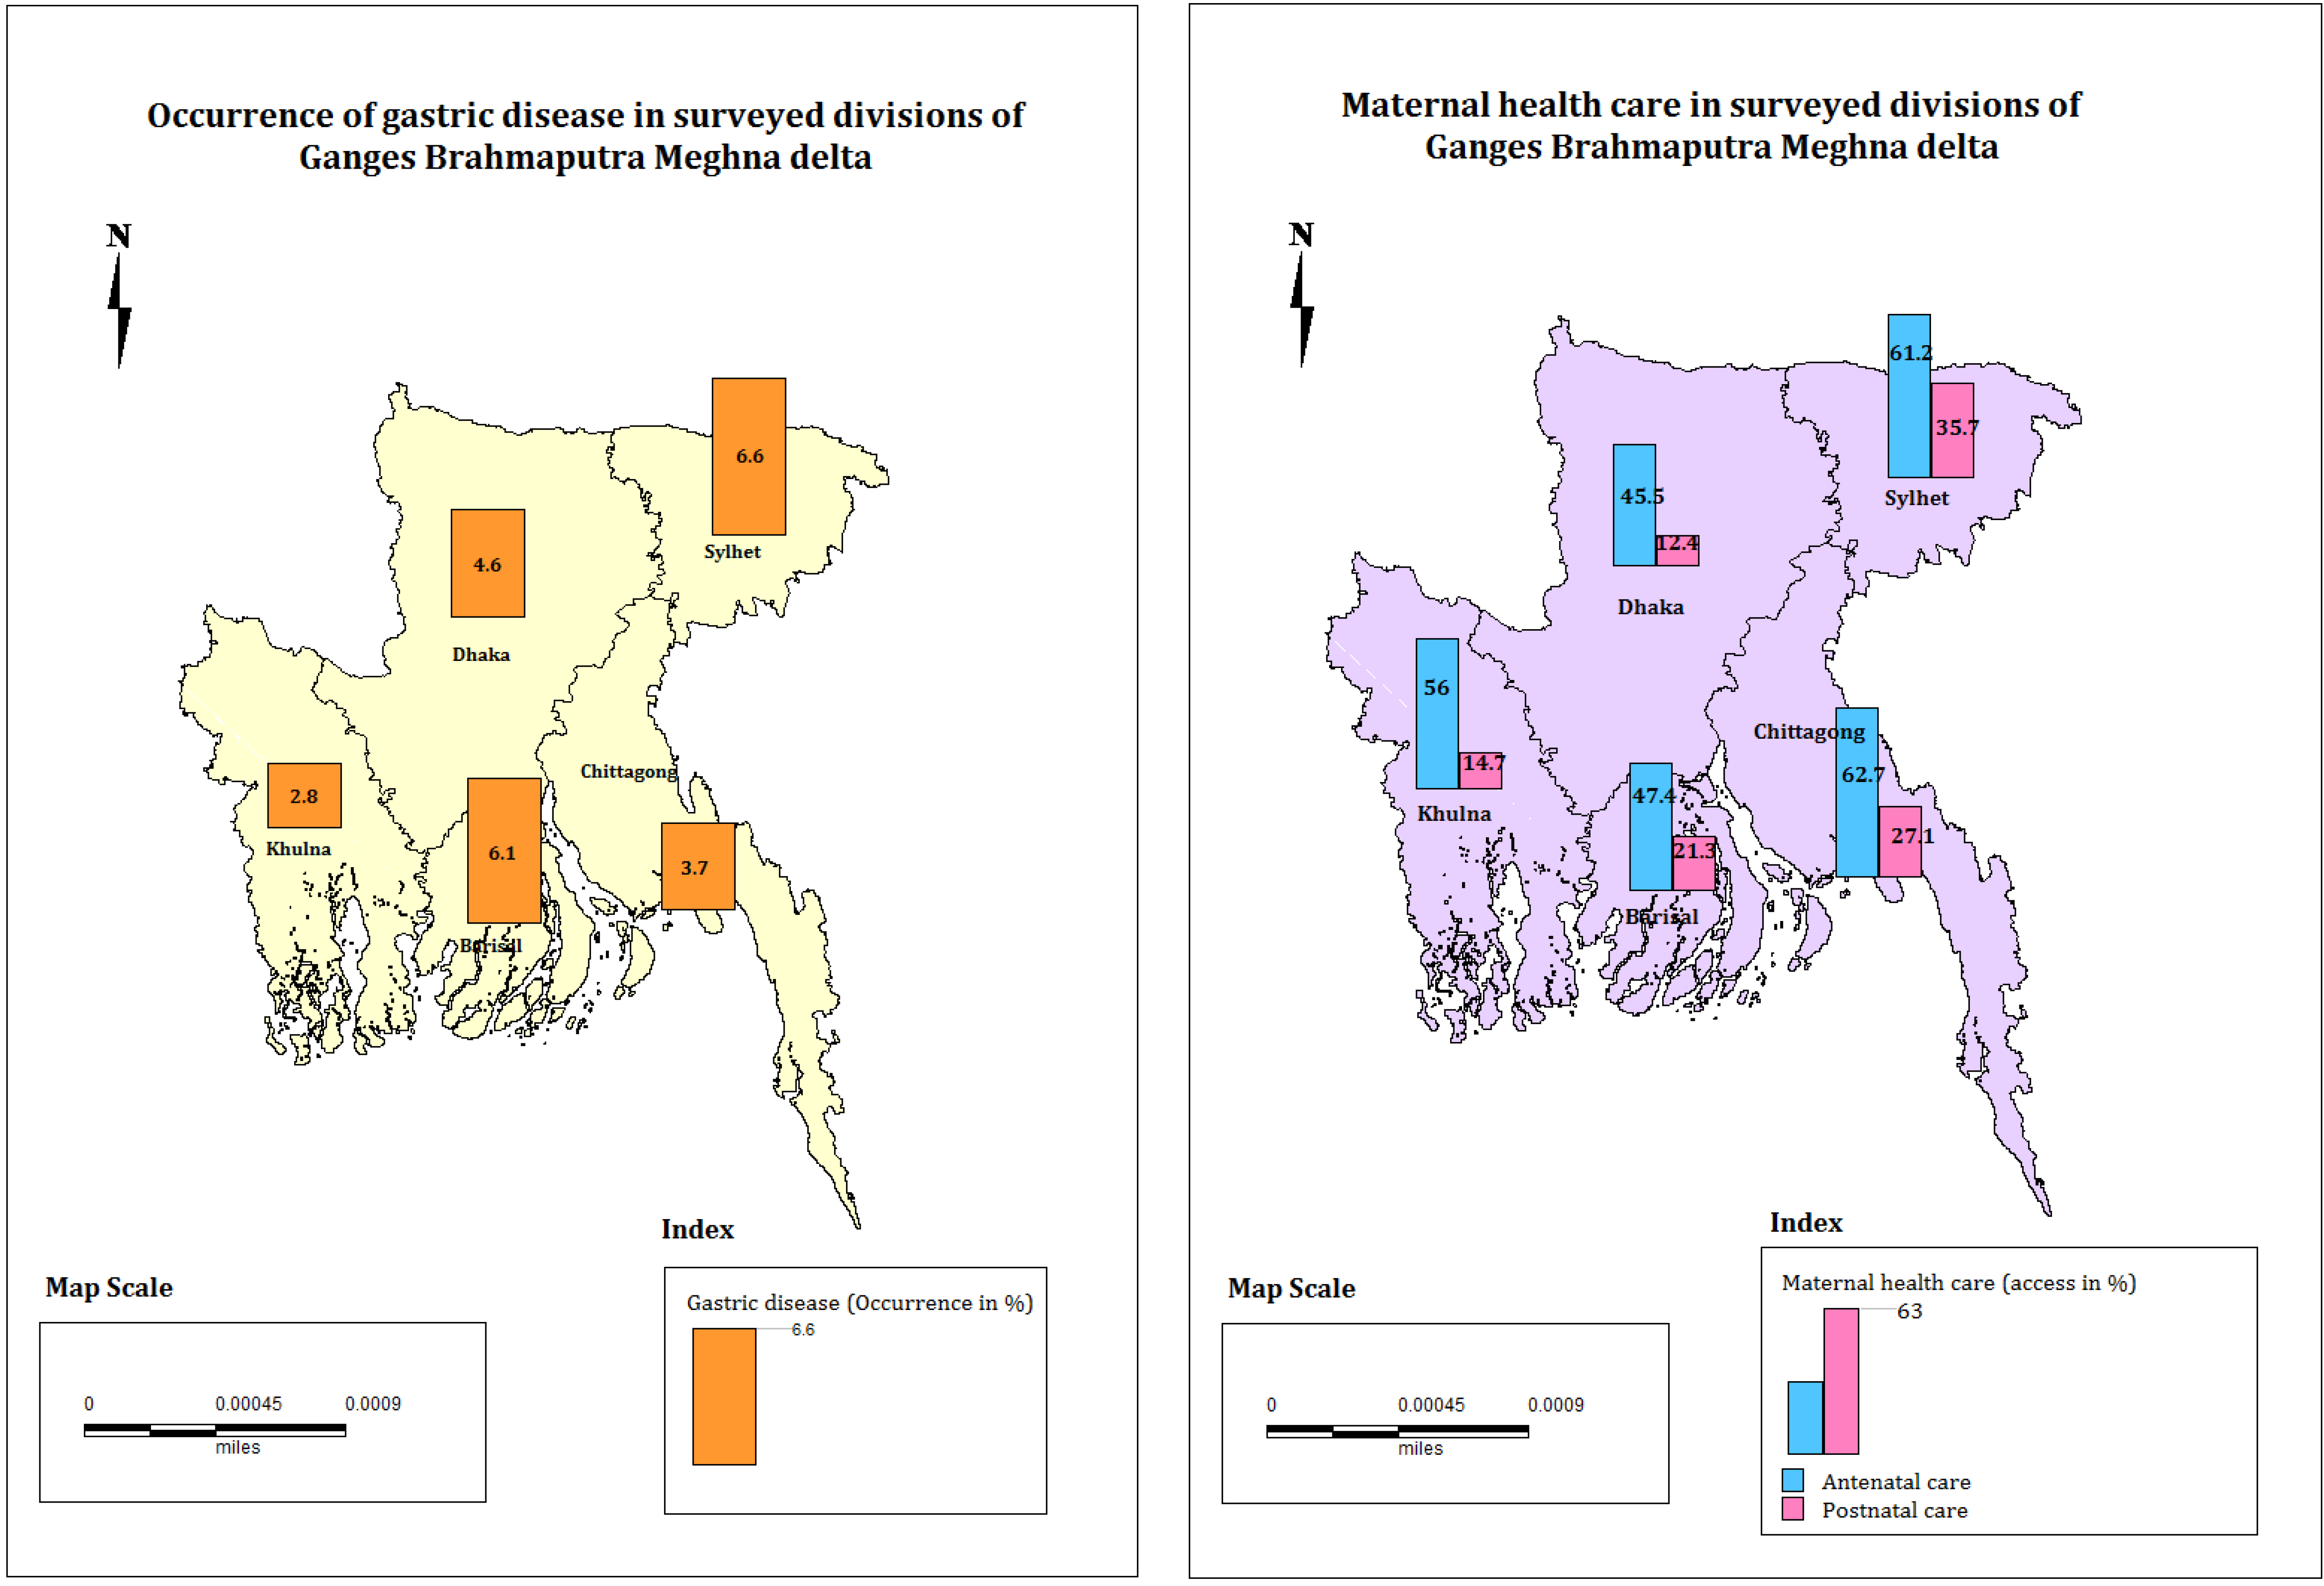
| Access to antenatal care | 56.3 | - | - | 3986 |
| Access to postnatal care | 21.4 | - | - | 3986 |
| Gastric diseases | 3.5 | - | - | 14,880 |
| HH Level Explanatory Variables (Outcome Variable: Consumption) | Mean | Minimum | Maximum | n |
| HH characteristics | ||||
| Education of HH head | 5.9 | 0 | 19 | 3300 |
| Age of HH head | 44.1 | 11 | 100 | 3300 |
| HH head is female | 11.6 | - | - | 383 |
| HH size | 4.4 | 1 | 17 | 3300 |
| HH received remittances | 8.6 | - | - | 284 |
| Region | ||||
| Barisal | 4.59 | - | - | 151 |
| Chittagong | 18.66 | - | - | 616 |
| Khulna | 12.43 | 410 | ||
| Sylhet | 3.66 | - | - | 121 |
| Dhaka | 60.66 | - | - | 2002 |
| Dimension of Poverty | Q1 | Q2 | Q3 | Q4 | Q5 | Total | n |
|---|---|---|---|---|---|---|---|
| HH consumption (mean) | 7576 | 9548 | 11,252 | 14,270 | 28,340 | 16,102 | 3300 |
| Educational attainment of adults (mean) | 1.5 | 3.0 | 3.9 | 5.9 | 9.2 | 5.7 | 7235 |
| Antenatal care (% with access) | 40.4 | 47.5 | 52.7 | 57.4 | 67.6 | 56.3 | 3986 |
| Postnatal care (% with access) | 9.6 | 9.3 | 11.1 | 21.2 | 38.9 | 21.4 | 3986 |
| Gastric diseases/ulcer (% suffering from) | 5.1 | 3.7 | 4.4 | 2.7 | 3.0 | 3.5 | 14,880 |
| Dimension of Poverty | Indicator | CC | AI | Unadjusted β | Adjusted β |
|---|---|---|---|---|---|
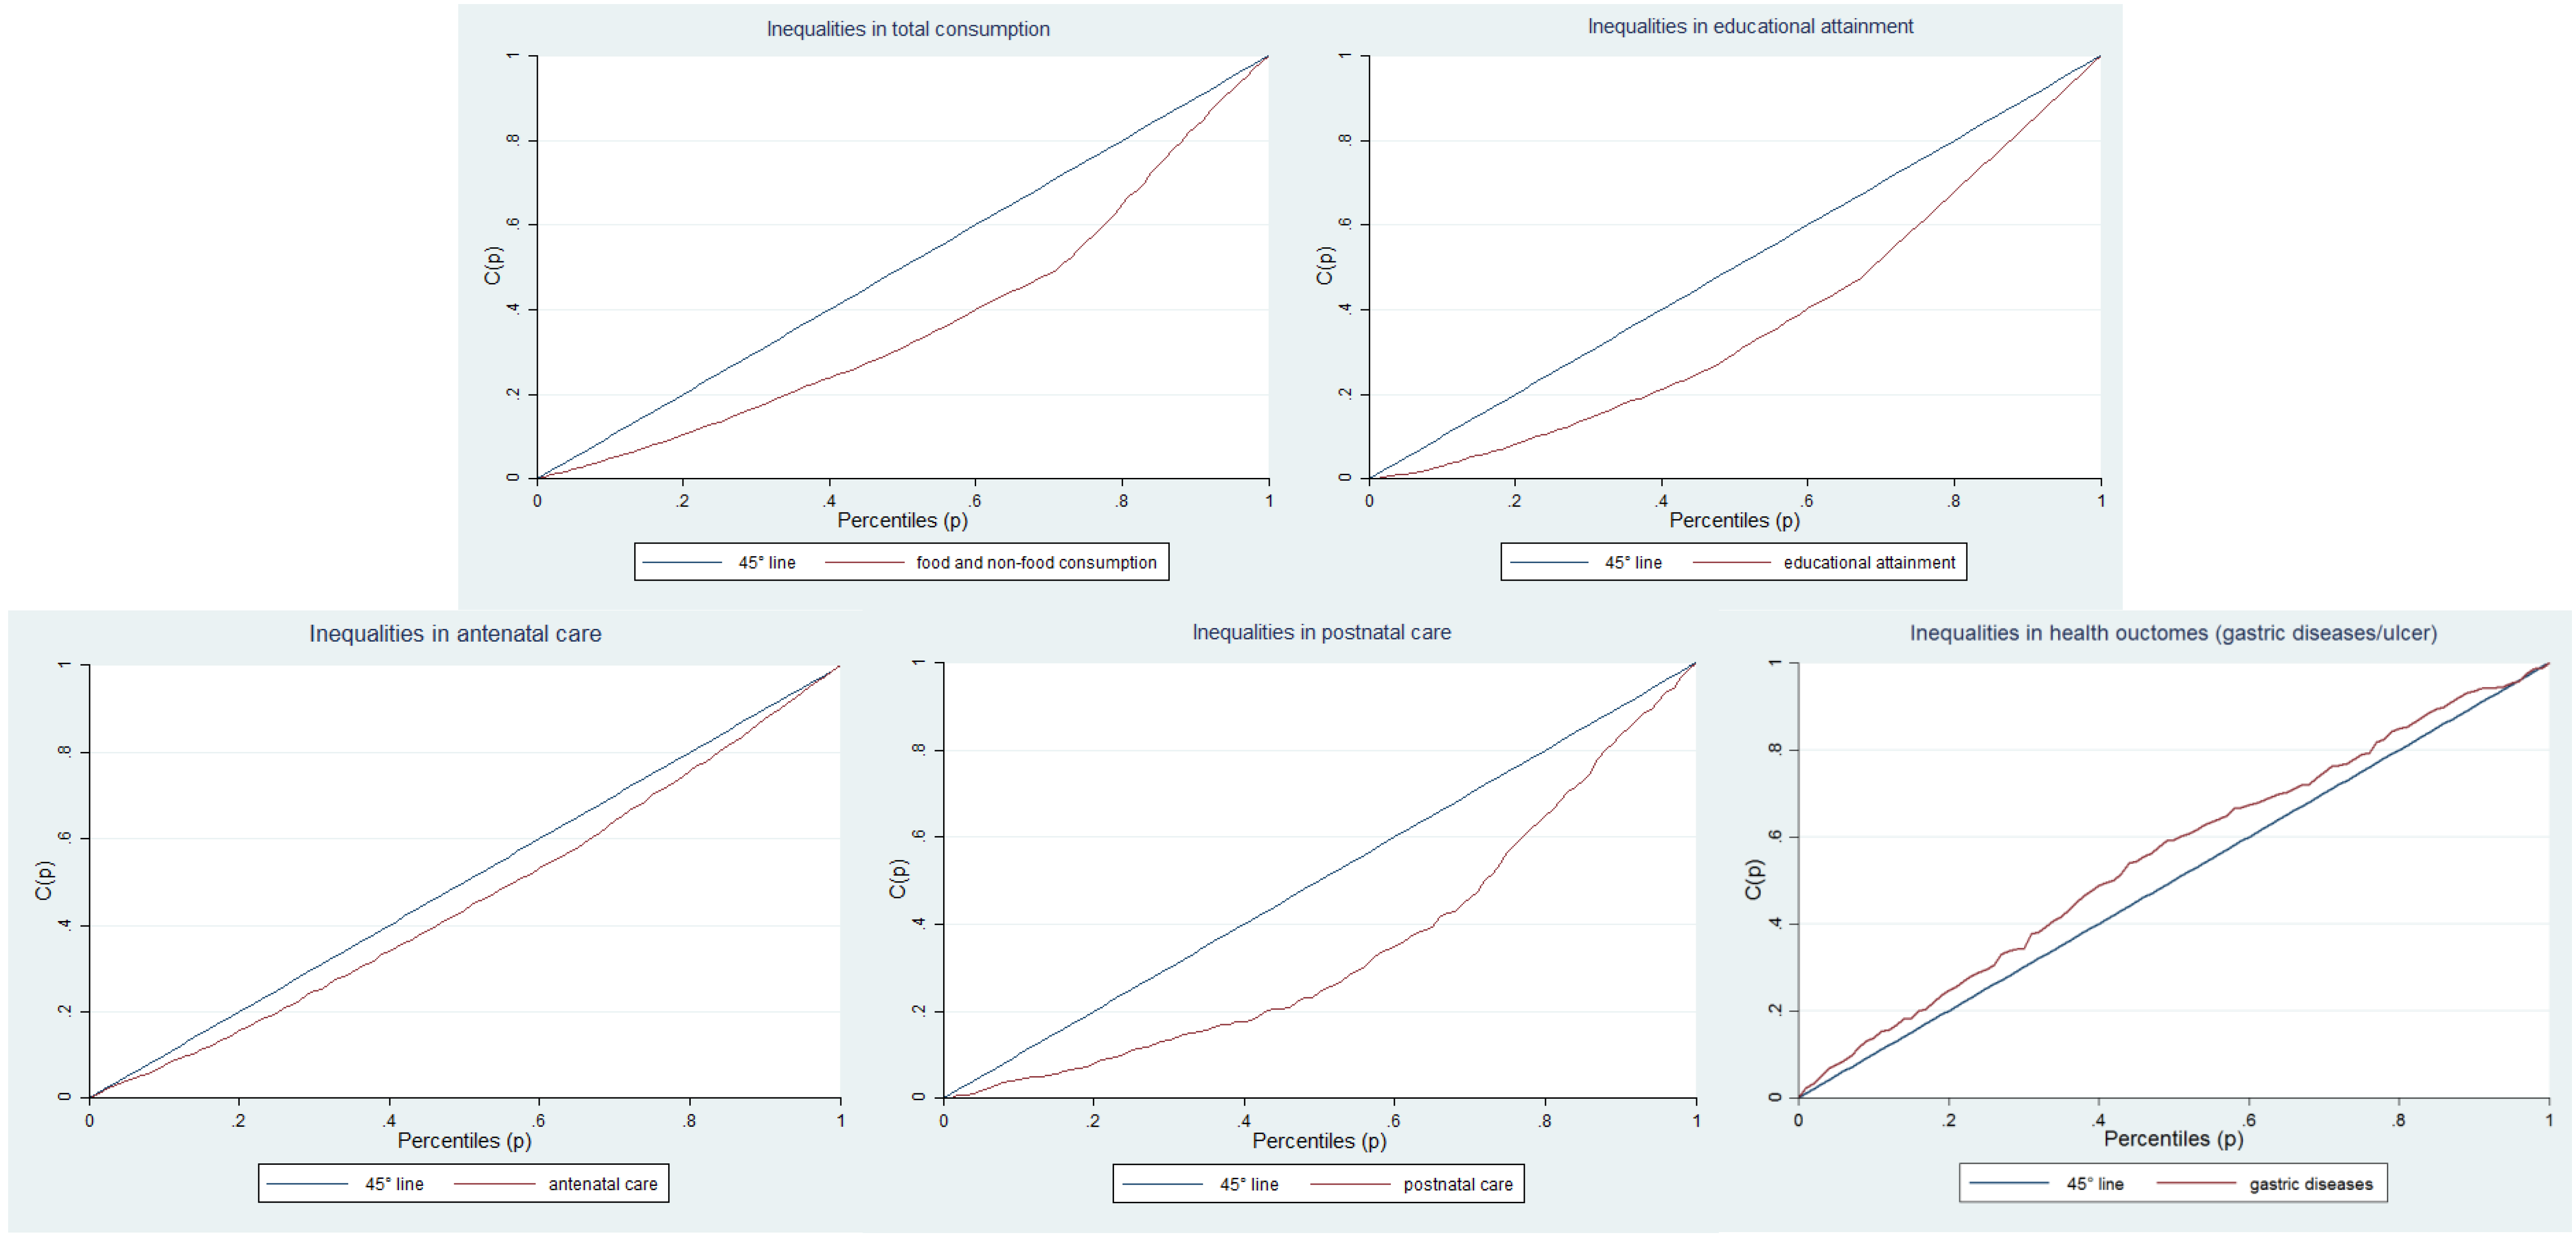
| Overall consumption | Food and non-food expenditure | 0.242 | 0.117 | 1.28 1 | 0.90 1 |
| Education | Educational attainment of adults | 0.256 | 0.373 | 7.66 | 7.93 |
| CC | AI | Unadjusted OR | Adjusted OR | ||
| Health | Antenatal care (% with access) | 0.090 | 0.437 | 3.08 | 2.56 |
| Postnatal care (% with access) | 0.273 | 0.786 | 6.00 | 2.70 | |
| Gastric disease/ulcer | −0.102 | 0.965 | 0.58 | 0.39 |
| Variable | Model 1 Consumption | Model 2 Education | Model 3 Antenatal care | Model 4 Postnatal care | Model 5 Gastric diseases |
|---|---|---|---|---|---|
| log β (SE) | β (SE) | OR (CI) | OR (CI) | OR (CI) | |
| Wealth | |||||
| Poorer | 0.19 (0.03) *** | 1.48 (0.33) *** | 1.23 (0.86; 1.76) | 0.75 (0.45; 1.24) | 0.68 (0.46; 0.99) ** |
| Medium | 0.35 (0.03) *** | 2.43 (0.28) *** | 1.61 (1.13; 2.30) *** | 0.83 (0.50; 1.37) | 0.83 (0.57; 1.20) |
| Richer | 0.47 (0.04) *** | 4.41 (0.32) *** | 1.65 (1.12; 2.42) ** | 1.49 (0.92; 2.41) | 0.47 (0.30; 0.72) *** |
| Richest | 0.90 (0.05) *** | 7.93 (0.30) *** | 2.56 (1.72; 3.82) *** | 2.70 (1.63; 4.46) *** | 0.39 (0.26; 0.60) *** |
| Baseline: poorest | 0.00 | 0.00 | 1.00 | 1.00 | 1.00 |
| Other HH characteristics | |||||
| Education 1 | 0.03 (0.00) *** | - | 1.12 (1.09; 1.15) *** | 1.20 (1.15; 1.25) *** | 1.04 (1.01; 1.06) *** |
| Age 1 | 0.005 (0.00) *** | −0.08 (0.01) *** | 0.92 (0.91; 0.93) *** | 0.96 (0.95; 0.97) *** | 1.05 (1.04; 1.05) *** |
| Gender 1 | −0.03 (0.03) | −1.66 (0.10) *** | - | - | 1.39 (1.10; 1.76) *** |
| Baseline: male | 0.00 | 0.00 | - | - | 1.00 |
| HH size | 0.13 (0.01) *** | −0.13 (0.10) ** | 0.95 (0.90; 1.01) | 0.94 (0.89; 0.99) ** | 1.04 (0.98; 1.09) |
| HH received remittances | 0.15 (0.04) *** | - | 0.96 (0.66; 1.41) | 1.00 (0.68; 1.49) | 1.30 (0.89; 1.89) |
| Baseline: HH did not receive remittances | 0.00 | - | 1.00 | 1.00 | 1.00 |
| Region | |||||
| Barisal | −0.13 (0.07) * | 1.92 (0.46) *** | 0.91 (0.68; 2.24) | 1.84 (1.29; 2.63) *** | 1.75 (1.28; 2.40) *** |
| Chittagong | 0.18 (0.05) *** | 1.08 (0.45) ** | 3.27 (2.48; 4.32) *** | 4.26 (3.17; 5.73) *** | 1.62 (1.20; 2.19) *** |
| Khulna | −0.13 (0.04) *** | 0.68 (0.30) ** | 1.44 (1.14; 1.83) *** | 1.14 (0.83; 1.57) | 0.66 (0.48; 0.92) ** |
| Sylhet | −0.03 (0.04) | 0.52 (0.44) | 2.27 (1.55; 3.31) *** | 4.49 (3.04; 6.64) *** | 2.28 (1.63; 3.18) *** |
| Baseline: Dhaka | 0.00 | 0.00 | 1.00 | 1.00 | 1.00 |
| Constant | 7.99 (0.05) *** | 5.93 (0.48) *** | 10.63 (6.21; 18.21) *** | 0.19 (0.10; 0.34) *** | 0.01 (0.00; 0.01) *** |
| Wald chi 2 | - | - | 468.7 | 430.1 | 626.3 |
| p-value | - | - | 0.000 | 0.000 | 0.000 |
| AIC | - | - | 2242.2 | 1730.8 | 598.1 |
| R2 | 0.645 | 0.400 | - | - | - |
| F-test | 143.9 | 178.8 | - | - | - |
| p-value | 0.000 | 0.000 | - | - | - |
| Number of observations | 3286 | 7211 | 3969 | 3969 | 14,824 |
© 2016 by the authors; licensee MDPI, Basel, Switzerland. This article is an open access article distributed under the terms and conditions of the Creative Commons Attribution (CC-BY) license (http://creativecommons.org/licenses/by/4.0/).
Share and Cite
Szabo, S.; Hajra, R.; Baschieri, A.; Matthews, Z. Inequalities in Human Well-Being in the Urban Ganges Brahmaputra Meghna Delta. Sustainability 2016, 8, 608. https://doi.org/10.3390/su8070608
Szabo S, Hajra R, Baschieri A, Matthews Z. Inequalities in Human Well-Being in the Urban Ganges Brahmaputra Meghna Delta. Sustainability. 2016; 8(7):608. https://doi.org/10.3390/su8070608
Chicago/Turabian StyleSzabo, Sylvia, Rituparna Hajra, Angela Baschieri, and Zoe Matthews. 2016. "Inequalities in Human Well-Being in the Urban Ganges Brahmaputra Meghna Delta" Sustainability 8, no. 7: 608. https://doi.org/10.3390/su8070608