1. Introduction
Creating more sustainable urban development patterns for cities has become an important focus of planning in recent decades. As of 2008, United Nation estimates showed that more than half the world’s population resides in urban areas and that by 2050 two thirds of the world’s 9 billion people are expected to live in cities [
1,
2]. Rapid rates of urbanization, sprawling development patterns, health issues, environmental hazards, and economically distressed urban communities have all resulted in a call for the creation of more livable and sustainable urban environments for the world’s citizenry.
Many urban scholars believe that mankind has the ability to make the greatest impact on developing a more sustainable world through practicing urban sustainability and promoting sustainable urban development [
3,
4]. Globally, cities will add an additional 2.5 billion residents to the already 3.5 billion urban dwellers by 2050 [
5]. These populations will put tremendous strains on the economic, environmental, and social capacities of their respective cities if development patterns do not change. Meanwhile, issues of rising sea levels and other climate impacts, combined with changing and limited financial resources are forcing many cities to consider implementing urban sustainability measures [
6,
7]. Planning for the rapidly growing urban population is of the utmost importance as land, natural resources, and funding become increasingly scarce.
The call for a more deliberate focus on urban sustainability and sustainable urban development has come from a variety of academic disciplines including geography, urban and regional planning, engineering, and environmental studies [
8,
9,
10]. Wheeler and Beatley [
11] offer one of the most comprehensive explorations of the field of sustainable urban development in their edited work on the subject. However, defining, exploring, and implementing sustainable urban development remains a challenge. Numerous scholars have offered excellent discussions on the main challenges facing urban sustainability including geographic differences in implementing sustainable urban development standards, multiple “visions” of what truly constituents sustainable urban development, and local preferences [
12,
13,
14,
15]. As a result, Godschalk [
16] believed that a major challenge facing the planning profession is developing standards and principles that will lead to sustainable development.
Urban planners and others have attempted to answer Godschalk’s charge by developing models and standards by which to rectify our failing communities and create more prosperous, healthy and equitable urban places. To that end, several models (e.g., BREEAM, CASBEE, GRIHA, Green Globes, LEED, etc.) have been proposed to help developers, communities, and residents plan more sustainable urban developments. In the United States, Leadership in Energy and Environmental Design—Neighborhood Development (LEED®-ND™) is the latest attempt to provide a means of evaluating and promoting more sustainable urban environments in the United States.
LEED
®-ND™ builds upon and combines the previous work of Smart Growth, New Urbanism, and Green Building models to create a rating system for a variety of development types and sizes. The stated objectives of the LEED
®-ND™ program are to “revitalize existing urban areas, reduce land consumption, reduce automobile dependence, promote pedestrian activity, improve air quality, decrease polluted stormwater runoff, and build more livable, sustainable communities for people of all income levels” [
17] (p. 1). Under this rating system a premium is placed on locational attributes of proposed projects under the “Smart Location and Linkages” credit category. This credit category seeks to promote development near existing community infrastructure (e.g., water, sewer, public transit,
etc.) and reward infill/redevelopment projects [
18,
19].
The purpose of this paper is to explore the micro-locational attributes of LEED
®-ND™ projects in the United States to determine if these developments are being sited in areas to achieve the program’s stated objective of building more sustainable communities. Specifically, we employ remotely-sensed anthropogenic night-time light (NTL) intensity and land cover data to assess the degree of urbanization surrounding each LEED
®-ND™ project constructed in the U.S. since the rating system’s inception in 2007. A previous spatial analysis of LEED
®-ND™ projects found a disproportionate number of projects in large metropolitan areas [
20]. However, Smith’s [
20] analysis did not “drill down” to explore the project’s immediate location within the metropolitan area. A more fine-grained intra-urban analysis is therefore needed to determine where precisely LEED
®-ND™ certified projects are being constructed. In doing so, we aim to evaluate LEED
®-ND™ as an effective tool for promoting sustainable communities in the United States and provide an independent method for verifying that the Smart Location and Linkage criteria ratings are in line with the density of the urban context.
2. Literature Review
A significant body of scholarly research has explored the relationships between the concepts of planning and sustainability. Jepson and Edwards [
21] state that sustainability and similar issues have been “popular” terms for planners to contend with since the release of the Bruntland Commission’s report in 1987. According to Wheeler, “sustainable urban development seeks to create cities and towns that improve the long-term health of the planet’s human and ecological systems” [
22] (p. 55). This definition provides a strong starting point from which to investigate the relationship between planning and sustainability. Likewise, Wheeler’s definition is utilized as the basis for understanding sustainability within this study.
Special issues of the
Journal of Planning Literature (JPL) and
Journal of the American Planning Association (JAPA) have been dedicated to discussing the relationship between sustainability and planning. Beatley [
23] provided an overview of sustainability and discussed the “many meanings” of sustainability. Beatley [
23] also offered a discussion of the elements of a new sustainable paradigm for planning. Berke [
24] recognized the potential of sustainability planning to aid in natural hazard reduction in developing countries. Retzlaff [
25] suggested a framework and comparison of green building assessment systems for planners in an effort to clarify differing approaches to sustainability. Other topics featured in these special issues included sustainability through civic engagement and the development of green infrastructure [
26,
27]. In the end, the complexity of the term “sustainable” and “sustainability” provides one of the biggest impediments to its implementation.
Disagreements over defining sustainability, however, have not stopped scholars and policymakers from developing rating systems to achieve the goal of sustainable urban development. To date a wide variety of green rating systems have been deployed in an attempt to bridge the gap between planning and sustainability. Green rating systems offer uniform standards by which to measure and try to achieve sustainable urban development (e.g., BREEAM, CASBEE, LEED,
etc.). The initial attempts by green rating systems were focused on individual projects, which resulted in more sustainable buildings, but not necessarily sustainable communities (e.g., LEED version 1.0 in 1998). More recently, larger planning areas have been considered for inclusion in the green rating systems with the development of neighborhood-wide green rating systems. BREAAM Communities, for example, was created in the UK, while CASBEE for Urban Development was established as a mechanism to certify larger projects in Japan. Similar neighborhood sustainability assessment tools have been developed by entities in Australia, the European Union, Qatar and Malaysia to name a few [
18]. In the end, green rating systems could help to enforce a uniform standard for achieving sustainable urban development globally.
In the United States, the LEED-Neighborhood Development rating system was created as a mechanism to encourage the inclusion of sustainable principles of urban development within larger projects. Green Building, Smart Growth, and New Urbanism provide the foundation for the LEED
®-ND™ rating system. Green Building has sought to develop more sustainable buildings. The United States Environmental Protection Agency (USEPA) defines Green Building as “the practice of creating structures and using processes that are environmentally responsible and resource-efficient throughout a building’s life-cycle from siting to design, construction, operation, maintenance, renovation and deconstruction” [
28]. Green Building attempts to reduce the overall impact of the built environment on both humankind and the natural environment. Green Building has been operationalized through rating systems such as Leadership in Energy and Environmental Design (LEED), administered by the United States Green Building Council (USGBC).
According to Smart Growth America, “Smart Growth is a better way to build and maintain our towns and cities. Smart Growth means building urban, suburban and rural communities with housing and transportation choices near jobs, shops and schools. This approach supports local economies and protects the environment” [
29]. Smart Growth principles were incorporated into a variety of planning programs around the country and the State of Maryland provides one of the best examples of incorporating the principles of Smart Growth into a statewide initiative [
30].
Advocates of New Urbanism including the Congress for the New Urbanism state that New Urbanism “promotes the creation and restoration of diverse, walkable, compact, vibrant, mixed-use communities composed of the same components as conventional development, but assembled in a more integrated fashion, in the form of complete communities” [
31]. Garde stated that, “New Urbanism is being promoted as a set of ideas to mitigate sprawl, to encourage sustainable growth, and to facilitate infill development” [
32] (p. 154). The importance of infill development is made explicit in the Congress for New Urbanism’s charter: “Infill development within existing urban areas conserves environmental resources, economic investment, and social fabric, while reclaiming marginal and abandoned areas. Metropolitan regions should develop strategies to encourage such infill development over peripheral expansion” [
33].
Each of these three strategies for sustainable urban development have been widely critiqued. Green Building has been criticized for its focus on “bells and whistles”, costs, and lack of locational sensitivity [
34,
35,
36,
37,
38]. Similarly, detractors of Smart Growth have argued that policies and regulations that enforce higher densities may result in greater congestion and reduced affordability in housing [
39,
40,
41]. Lastly, New Urbanism is often criticized for its contrived feel and design [
42,
43], and for the fact that new urbanist developments are often constructed on “greenfield” sites in the suburbs [
44]. However, by combining the best attributes of each program, LEED
®-ND™ seeks to raise the standard of “sustainable” urban developments.
Recently, a number of studies have explored LEED
®-ND™ and have highlighted the importance of the Smart Location and Linkage criteria found within the rating system for locating projects within preferred locations. In one of the earliest examinations into LEED
®-ND™, Garde [
45] conducted a survey of U.S. LEED
®-ND™ Pilot projects in an attempt to gain insight into the strengths and limitations of LEED
®-ND™. He found that “the pilot version of the rating system makes it relatively easy to get well-located projects certified” [
45] (p. 435), highlighting the importance and influence the location criteria had on early projects. Talen
et al. [
19] explored the potential of identifying LEED
®-ND™ sites within the City of Phoenix as a method of promoting the use of the green rating system. Their research identified 9000 acres of eligible property in Phoenix using a methodology that focused on “the most important criterion in the LEED-ND rating system: the ‘Smart Location and Linkage’ or SLL prerequisite” [
19] (p. 20).
Additional scholars have sought to evaluate neighborhood sustainability assessment systems through detailed comparisons. Haapio [
46] provides an overview of BREEAM Communities, CASBEE for Urban Development, and LEED for Neighborhood Development. Haapio found that both BREEAM Communities and LEED
®-ND™ place emphasis on the location of projects in determining the sustainability of the new development. Sharifi and Murayama examined seven different neighborhood sustainability assessment (NSA) tools and found that “most tools are not doing well regarding the coverage of social, economic and institutional aspects of sustainability” [
18] (p. 73). However, their study also determined that location was a high priority for the LEED
®-ND™ standard. They theorized that this was probably the result of the severe issue of sprawl in the United States compared to other locations. Sharifi and Murayama [
47] followed up their examination of seven NSA tools with a cross evaluation of the NSA tools from the US, the UK, and Japan. The results of this research echoed their earlier work and determined that one potential shortcoming of LEED
®-ND™ was the way in which the rating system distributes points, putting greater emphasis on a few select criteria like Smart Location and Linkages.
3. Research Methods and Hypotheses
To explore the impact of the Smart Location and Linkage criteria on LEED
®-ND™ projects, data was first collected from the United States’ Green Building Council [
48]. After collecting data on all LEED
®-ND™ projects that were either under review or had been certified, each project was assigned an absolute location based on its project address. In sum, 246 LEED
®-ND™ projects were retrieved from the USGBC’s database and included in the analysis.
Once all LEED
®-ND™ projects were allocated to a specific absolute location, the projects were mapped using ArcGIS 10.0. ArcGIS was also employed in the spatial analyses to determine the intra-urban locational patterns of LEED
®-ND™ projects. Supporting documentation and background information on the LEED
®-ND™ rating systems was collected from the USGBC and partner agencies that helped develop the rating system. Of particular help was the new Green Building Information Gateway (GBIG) [
49], which is a product of the USGBC and provides information about specific green projects in a user-friendly format.
Based on prior investigations, we expected distinct geographic patterns to emerge from the examination of the micro-geography of LEED
®-ND™ projects in the United States. First, we hypothesize that a majority of LEED
®-ND™ projects will be situated in an urban setting characterized by higher night-time light (NTL) intensity values and a greater degree of developed land cover as measured using impervious (
i.e., built or paved) surface area based upon the emphasis placed upon the Smart Location and Linkage Score for LEED
®-ND™ projects [
19]. Secondly, a statistically significant positive relationship is expected between the project’s Smart Location and Linkage Score and the NTL and impervious surface estimates.
3.1. Night-Time Lights Analysis
The degree of urbanization at each LEED
®-ND™ site was assessed using two separate datasets and methodologies. First, we utilized the Visible Infrared Imaging Radiometer Suite (VIIRS) NTL dataset released by the National Oceanic and Atmospheric Administration (NOAA) and the National Geographic Data Center (NGDC) to determine broadly the location of each development along an urban-rural spectrum. NTL datasets capture the intensity of anthropogenic lighting at night, providing a quantitative and systematic method of comparing the degree of human occupation and activity across multiple locations. The VIIRS images, first released in 2012, are a relatively new alternative to the longer-running and more frequently utilized U.S. Department of Defense Meteorological Satellite Program’s Operational Linescan System (DMSP-OLS) NTL dataset. The VIIRS, with a much finer spatial resolution (750 m
vs. 2.7 km), lower detection limit, and substantially less saturation in dense urban areas provides better detail and avoids DMSP-OLS’s “over-glow” effect [
50,
51,
52]. The superiority of the VIIRS dataset is most pronounced in dense urban areas where it is markedly better and discriminating high light intensity levels relative to DMSP-OLS. Using the cloud-free composites available for January 2015, VIIRS light intensity values within the area of study ranged from 0.21 to 224 nanoW/cm
2/sr, with 0 indicating no lighting, typical of highly rural or uninhabited areas, and higher values representing more intense, brighter lighting. The VIIRS NTL data were obtained from the NGDC website [
53].
It was decided
a priori that a 1.5 km buffer around the center of each LEED-ND site would provide a reasonable estimate of the neighborhood in which the project is embedded. This determination was based primarily on the LEED
®-ND™ rating system guidelines that suggest a maximum development size of 500 meters in width to support a high level of walkability from all locations within the site [
54]. A 1.5 km wide radius should therefore include the entirely of the LEED
®-ND™ development as well as the surrounding neighborhood within reasonable walking distance (
i.e., approximately 1–1.5 km; [
55]). Average NTL intensity values at each LEED
®-ND™ site were therefore calculated using a 9 × 9 moving window, with each site located in the central pixel of an 81-pixel area. This window corresponded well with the 1.5 km radius target, with an area approximately 3 km in width. A sensitivity analysis using a 3 × 3, 5 × 5, and 11 × 11 moving window was also carried out; however the NTL averages based on the 9 × 9 moving window exhibited the highest correlation with the impervious surface data discussed below. In general, averaged NTL intensity values declined as larger moving windows were used, reflecting the inclusion of additional low-light peripheral and rural pixels surrounding sites in outer suburban and small city environments.
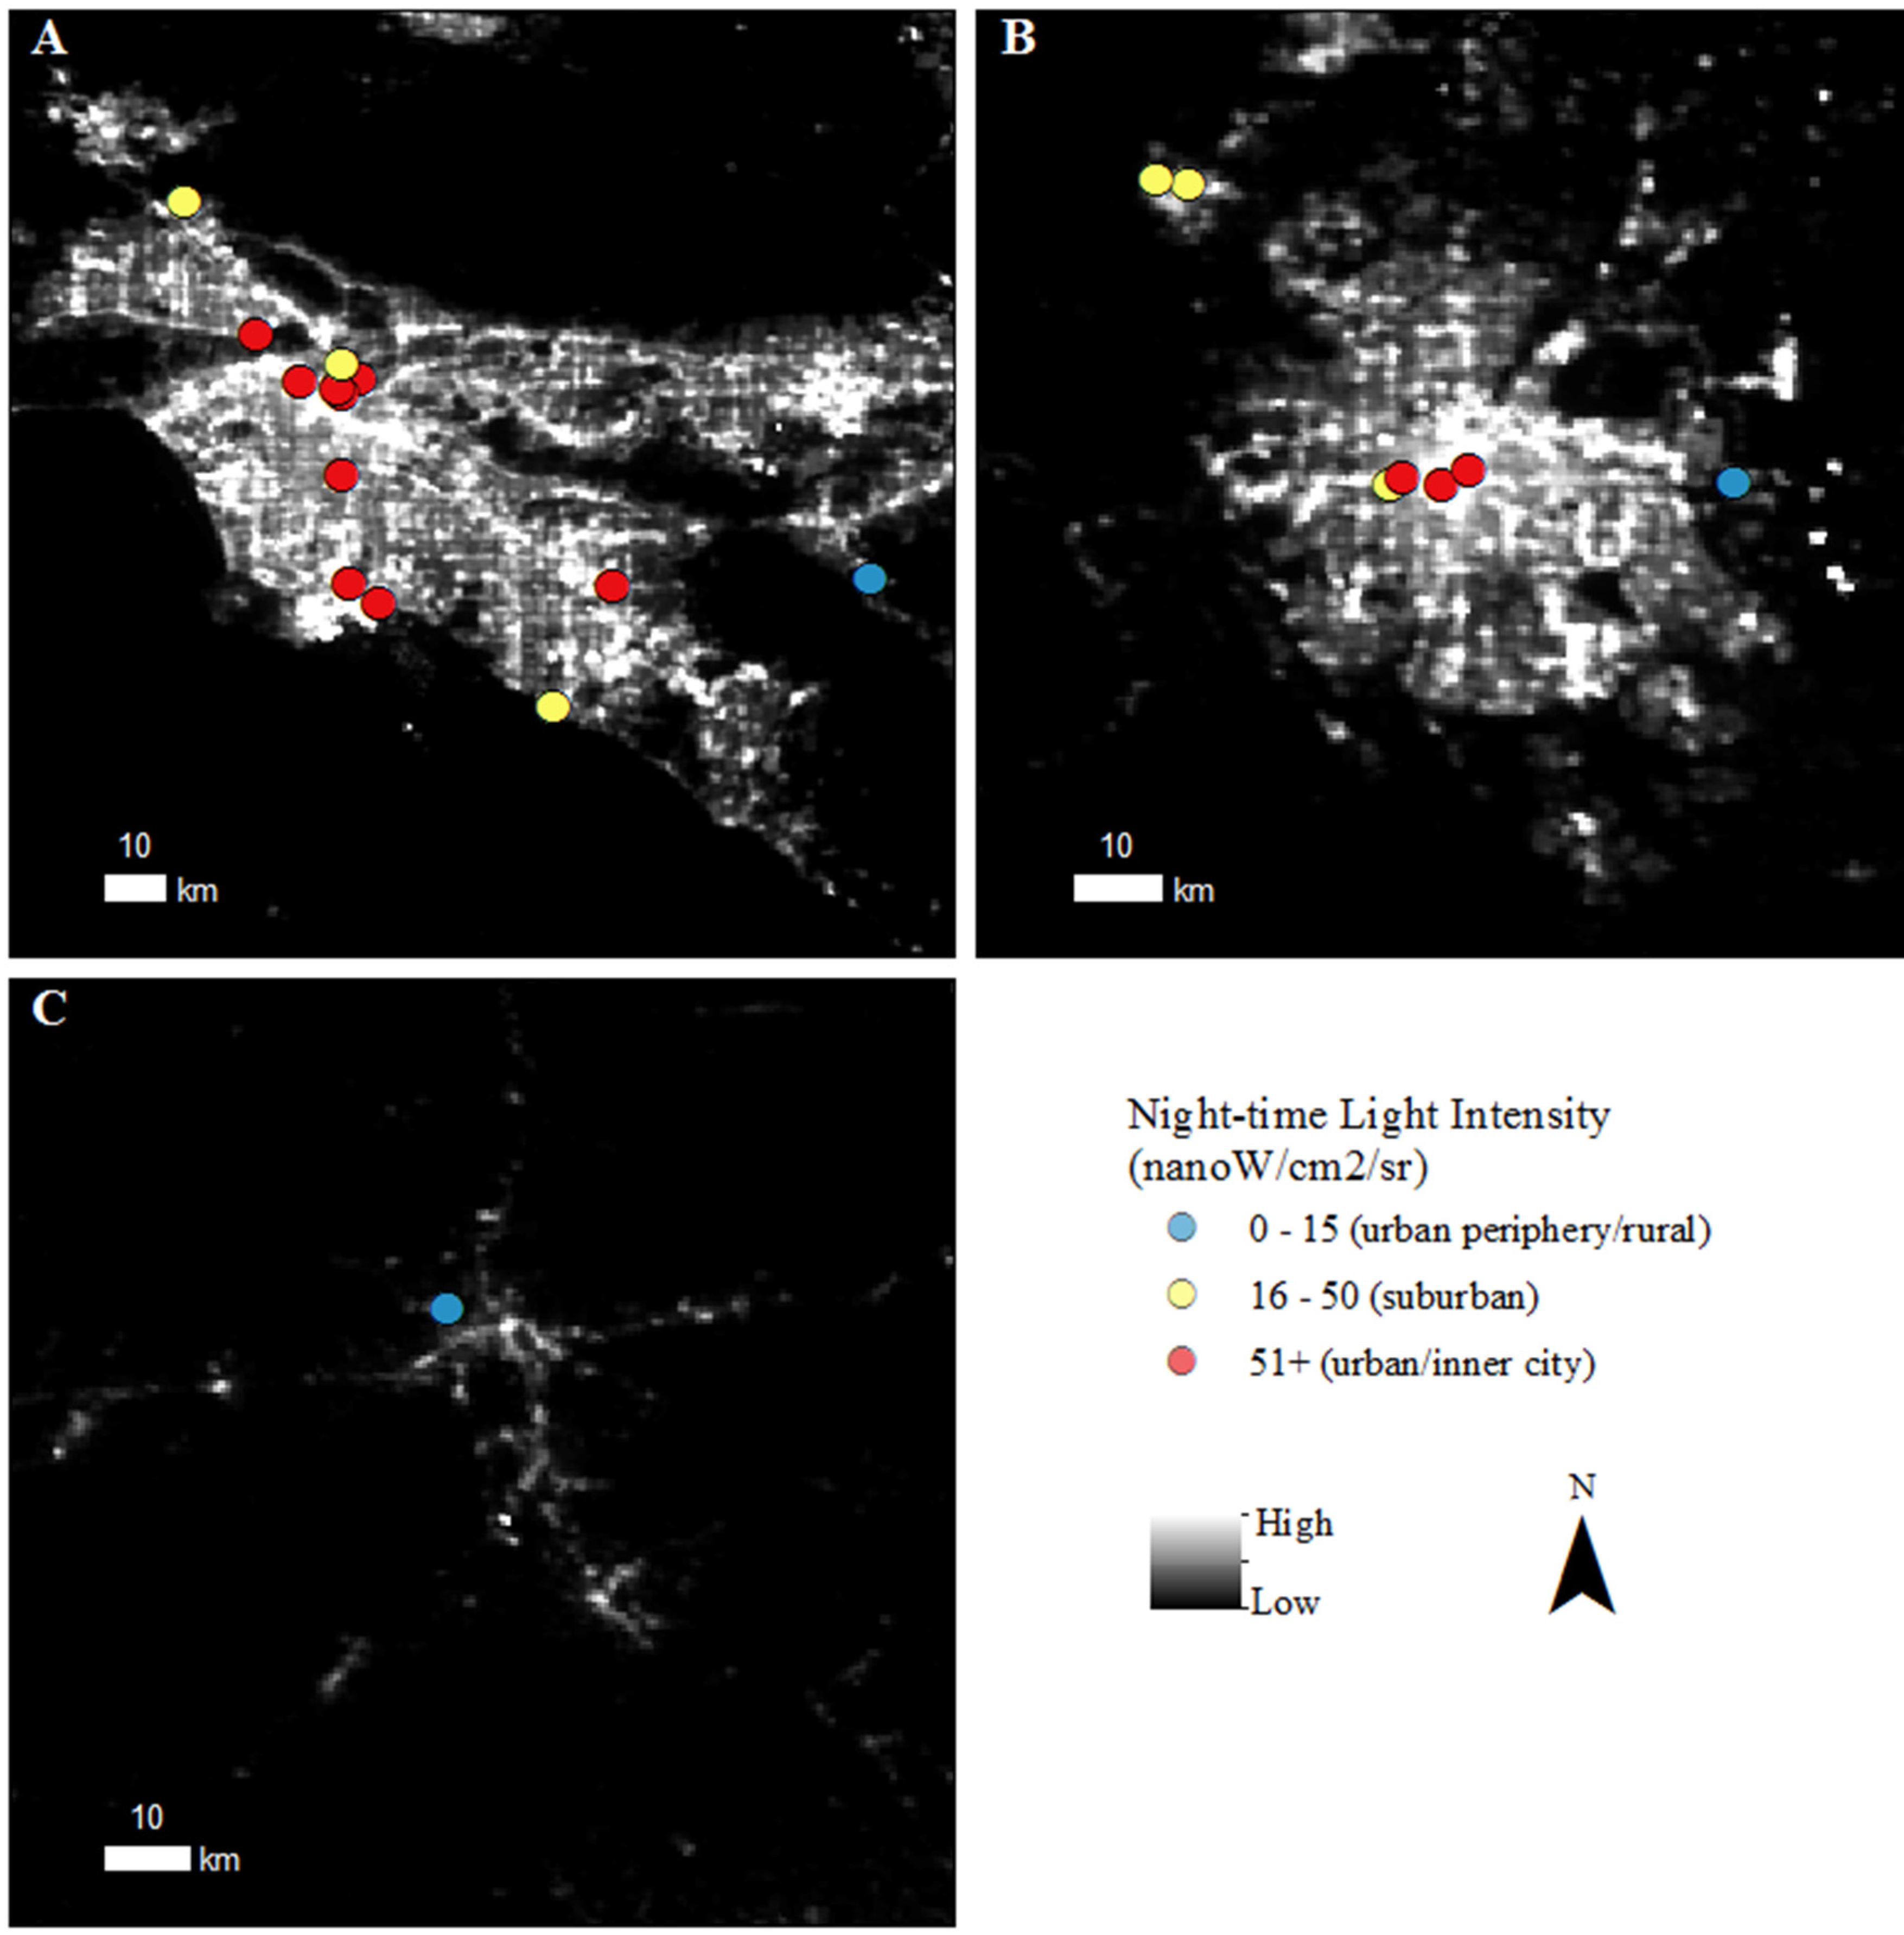
For context it was useful to consider a potential “cut-off” point to determine whether a LEED
®-ND™ project was situated in an urban, rural, or urban/rural peripheral location. These latter two possibilities would be indicative of a greenfield rather than infill or brownfield type development. Unfortunately, while there exists precedence for an urban/rural threshold for DMSP-OLS data, the authors are not aware of any such classification available for the newer-generation VIIRS. To approximate an urban-rural threshold, therefore, we used a case-study approach, visually inspecting the location of LEED
®-ND™ sites in urban areas of varying sizes (
Figure 1). By noting their proximity to the urban center or outer urban periphery, approximate average NTL intensity values of LEED
®-ND™ sites in inner-city and outer peripheral neighborhoods could be established. Within our study area, LEED
®-ND™ sites with VIIRS NTL intensity values less than 15 were consistently located in either peripheral suburban/exurban locations or in primarily rural locations, at times adjacent to smaller cities. Conversely, LEED
®-ND™ sites with VIIRS NTL intensity values of 50 or greater were embedded squarely within urbanized areas including established suburban locations.
3.2. Land Cover Analysis
An additional assessment of urbanization at each LEED
®-ND™ site was conducted using land cover data obtained from the Multi-Resolution Land Characteristics Consortium’s (MRLC) National Land Cover Database 2011 (NLCD, 2011) [
56]. The objective was to estimate the proportion of urbanized land (or, more precisely, the proportion of impervious surface area) within a 1.5 km radius of each LEED
®-ND™ site. The NLCD is composed of 16 land cover classes based on a modified Anderson Land Cover Classification System [
57] with a spatial resolution of 30 meters. Four classes indicate developed land cover, the intensity of which is based on the proportion of impervious surface area per pixel: developed open space (<20% impervious), developed low intensity (20%–49% impervious), developed medium intensity (50%–79% impervious), and developed high intensity (80%–100% impervious). Impervious surfaces refer to artificial structures such as roadways, buildings, parking lots, and driveways. Developed open space primarily represents vegetation found in lawns and urban parks; both developed low intensity and developed medium intensity represent a mix of constructed and natural materials typical of single-family housing units and other low-density development; and developed high intensity is indicative of relatively dense urban environments composed of multi-unit residential, commercial, and industrial land uses.
The proportion of impervious land cover within a 1.5 km radius of each LEED®-ND™ site was estimated by first assigning each of the four land cover classes an average impervious value based on the mid-point of each classes’ range. Developed open space, for example, was assigned a value of 10% impervious, while developed low intensity was reclassified as 35% impervious. All other non-urban terrestrial land cover classes, such as barren land, forest, grassland, and cultivated crops were assigned a value of 0 to indicate a lack of impervious surface area. Two additional land cover classes, water and wetlands, were removed from the dataset; these surfaces were assumed to be undevelopable. The impervious value of all remaining land cover pixels within 1.5 km of each LEED®-ND™ site were then summed and divided by the total area of dry land within the same radius.
3.3. Smart Location
Correlation analyses were also performed to assess the degree of association between the USGBC’s Smart Location and Linkage (or simply “smart location”) score and the two measures of urbanization employed in this study. The purpose of this analysis was to determine the efficacy of these measures as a potential proxy for site suitability in light of sustainable planning and development goals. The smart location score consists of 14 site attributes that address land and ecological conservation, brownfield redevelopment, transportation networks, and proximity to housing and jobs. Smart location represented 27 of the 110 possible points available in the overall LEED®-ND™ score according to the 2009 standards. Unfortunately, few smart location scores are readily available through the USGBC, and despite a lengthy effort to obtain these data from individual LEED®-ND™ site managers, smart location scores were retrieved for only 49 of the 246 sites. Because some smart location scores were derived from the more recent 2009 standards with a maximum point value of 27 while others were based on the pilot project standards with a maximum point value of 30, it was necessary to first standardize all scores prior to the correlation procedure. Standardization was accomplished by dividing each score by the maximum possible point value, then multiplying the quotient by 100. The average smart location score for the 49 sites was 64 out of 100, with a maximum of 90 and a minimum of 29. Using the Shapiro-Wilk test for normality, the smart location scores exhibited a normal distribution; however the NTL data was highly right-skewed with few sites at or near the maximum light intensity value, and impervious surface area was left-skewed, with most values indicating relatively high levels of developed surface area. Normality was achieved for the averaged NTL values by using a log transformation prior to the Pearson correlation analysis. A number of transformations were attempted for the impervious surface data, however normality could not be achieved. Spearman’s rank correlation, which does not assume normality, was therefore used in place of the Pearson correlation analysis for impervious surface data.
4. Results
4.1. Night-Time Lights Analysis
Overall, the night-time lights analysis indicates that most LEED
®-ND™ sites occupied infill locations within urbanized areas. A full 83 percent (204 of 246) of the sites exhibited a NTL intensity value of 15 or higher (a conservative urban/rural threshold). LEED
®-ND™ sites associated with the highest average NTL values were generally located within dense urban or inner suburban locations in large, central metropolitan areas, such as Washington D.C., Chicago, and Las Vegas (
Table 1). This pattern generally held for sites with a NTL value of 50 or higher; most sites with lower values were found outside the urban center of large metropolitan areas.
Those with the lowest NTL values were located within a variety of large, medium, small, and non-metropolitan areas; however, all were situated in either rural locations or along the urban periphery (
Table 2). This includes LEED
®-ND™ developments such as the “Homewood Mountain Resort Redevelopment”, situated on Lake Tahoe in California, and “Trenza at the Galisteo Basin Preserve”, located about 16 miles south of Santa Fe, that are within the rural, out-lying areas of their encompassing metropolitan regions. Far removed from either small towns or large urbanized areas, these and similar LEED
®-ND™ sites are primarily resort villages. Most other LEED
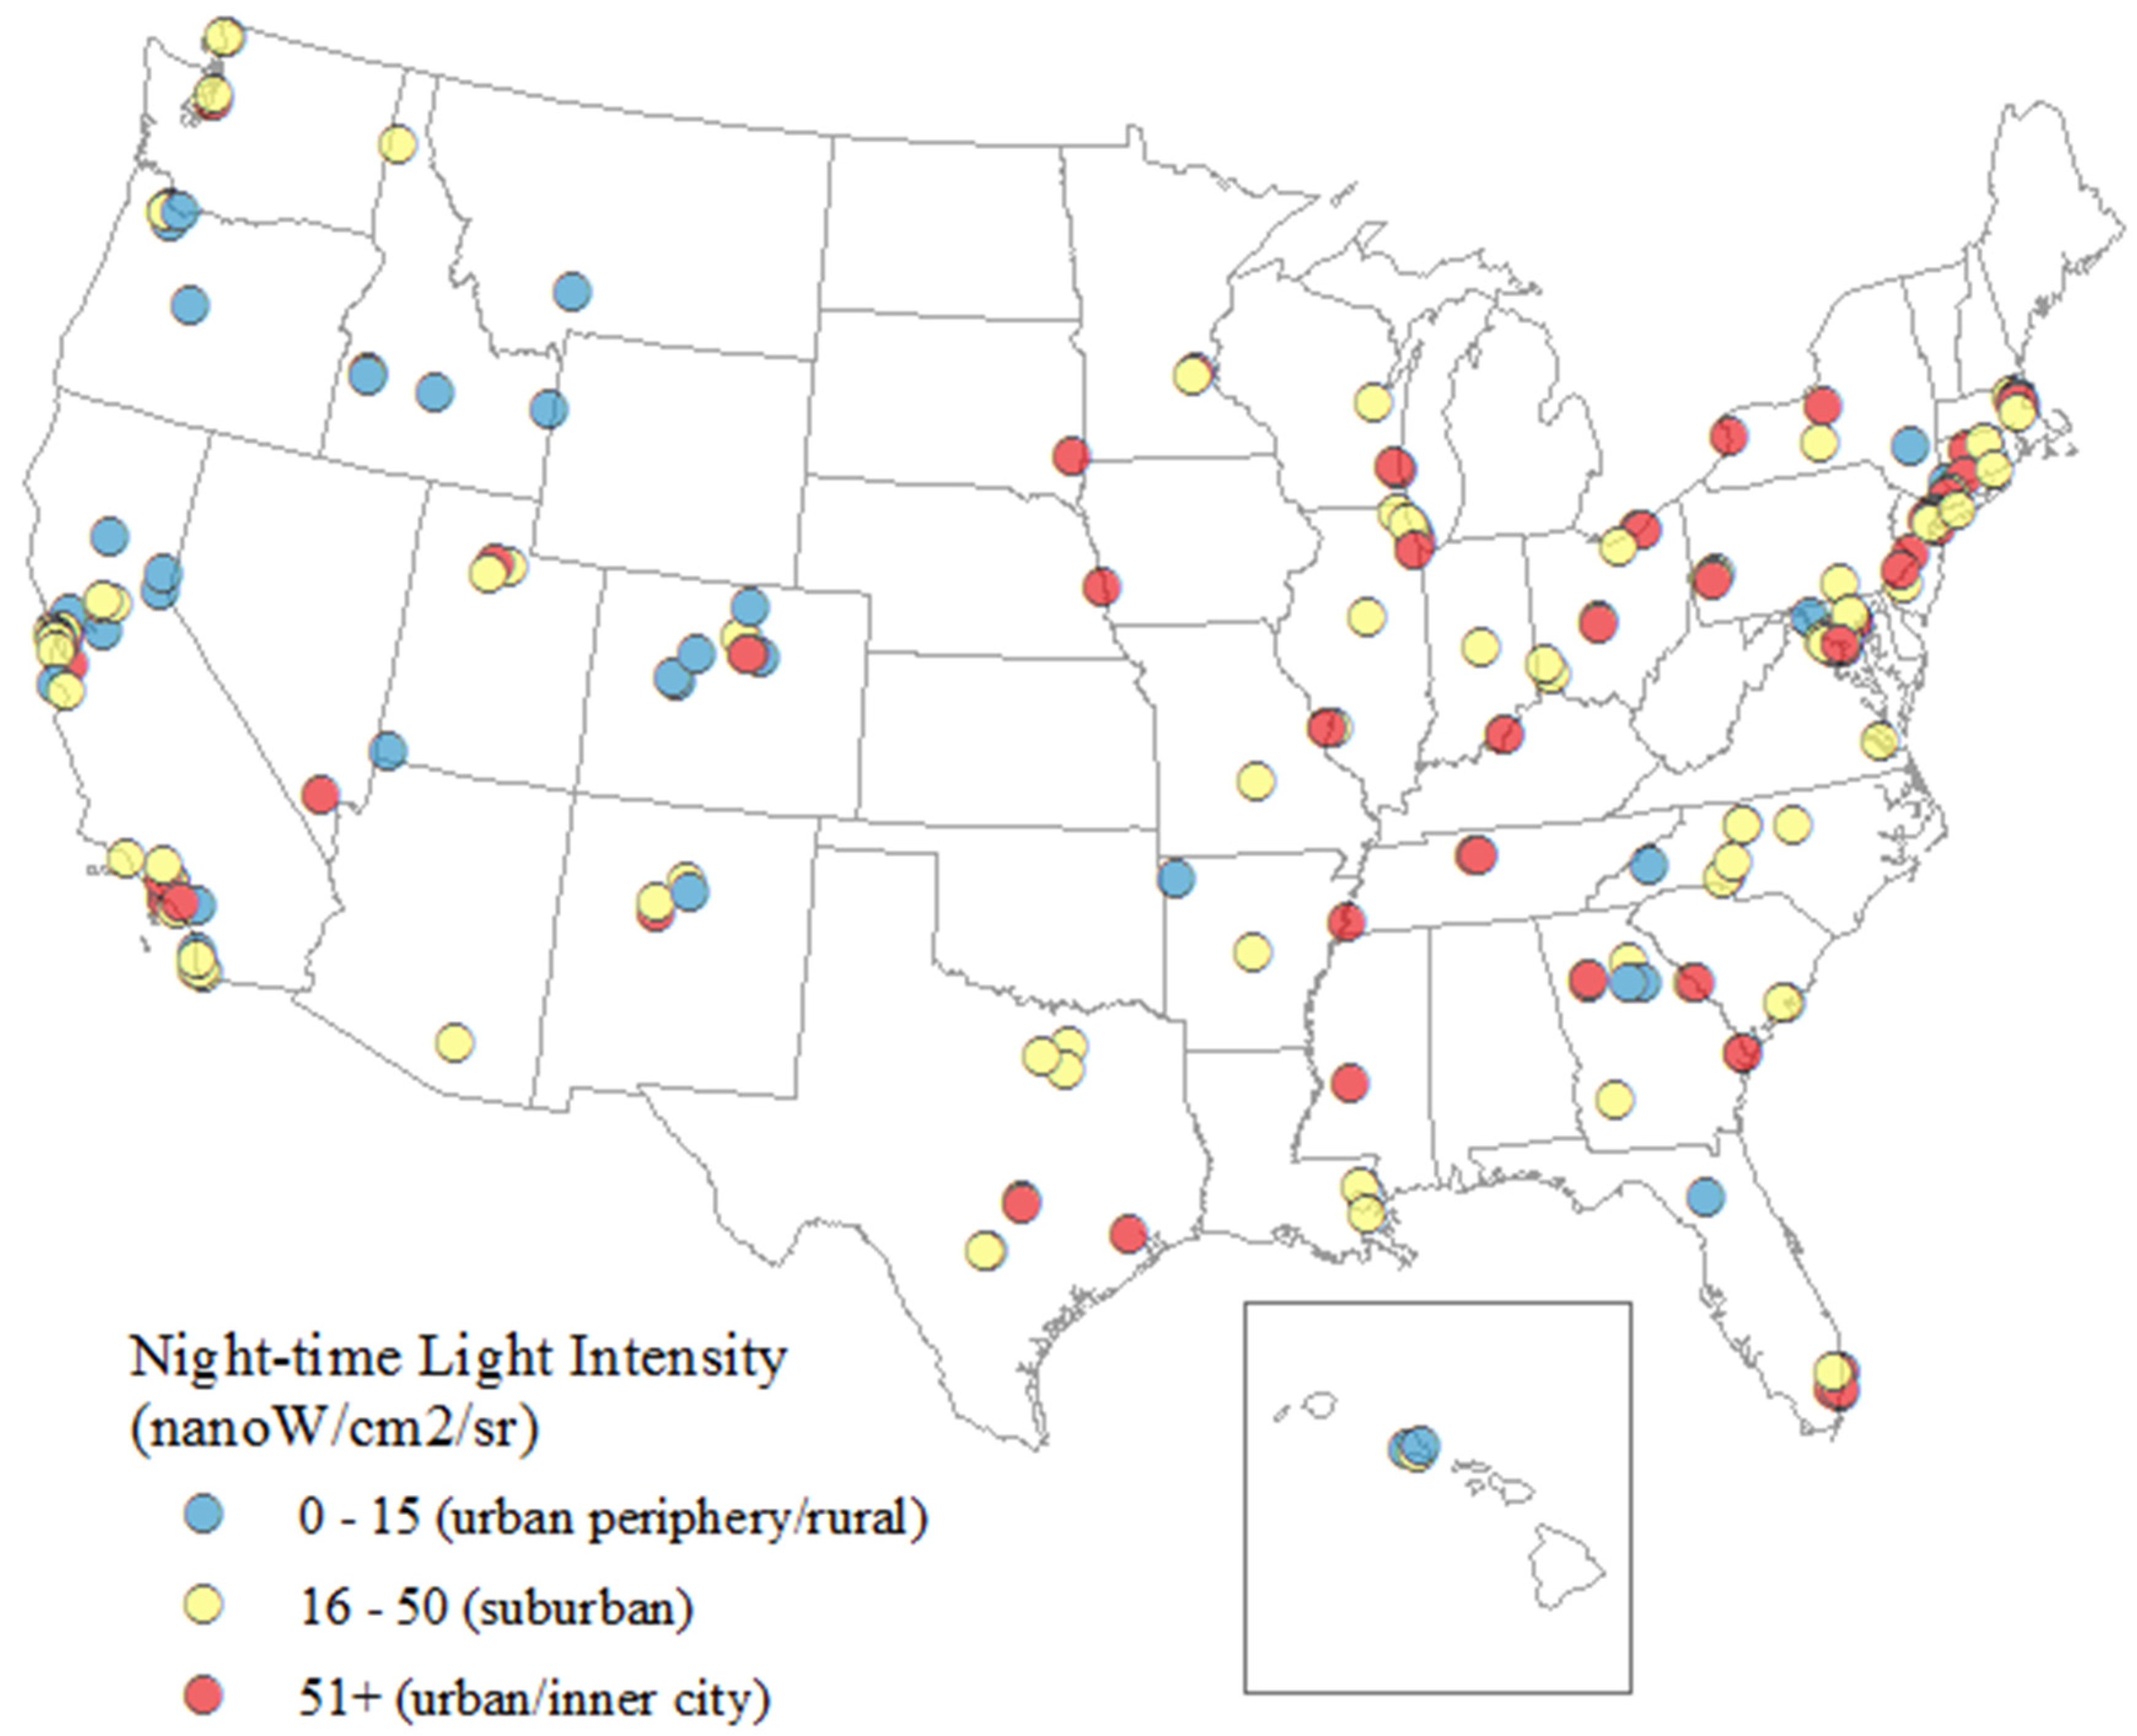
®-ND™ sites with low light intensity values included master-planned (and primarily residential) communities located on the urban periphery or in exurban areas surrounding larger cities (e.g., “Woodstock Commons Intergenerational” near Kingston, New York; “Sycamore Run” in Boonsboro, Maryland; and Southern Pines Development on the outskirts of Bend, Oregon). In terms of broad regional patterns, the majority of LEED
®-ND™ sites with relatively low light intensity values were located in the western region of the country, particularly throughout the more sparsely populated mountainous areas (
Figure 2). In fact, 26 of the 33 sites with NTL intensity values less than 15 (indicating peripheral urban or rural development) were located west of the Mississippi despite the fact that fewer than half of the sites were located in the West. LEED
®-ND™ sites with the highest NTL intensity values were concentrated primarily in the East, particularly in the highly urbanized Northeast corridor. Of the 114 LEED
®-ND™ sites with NTL intensity values greater than 50, indicating inner-suburban and central urban infill locations, only 33 (29 percent) were situated west of the Mississippi.
4.2. Land Cover Analysis
The land cover analysis indicated significant variability among the 242 LEED
®-ND™ sites (land cover data was not available for the four Hawaiian sites). Average percent impervious surface area within a 1.5 km radius varied from a high of 83 percent at “Seaport Square” in Boston to a low of one percent at “Trenza at the Galisteo Basin Preserve”. The mean percent imperviousness across all 242 sites was 50 percent, with a standard deviation of 20 percent. According to the NLCD, 50 percent impervious is the threshold used to demarcate developed open space and low intensity development from medium and high intensity urban development at the pixel level. Only 20 sites (8 percent) exhibited an average impervious surface value of less than 20, the cut-off between developed open space and low intensity development on a per pixel basis.
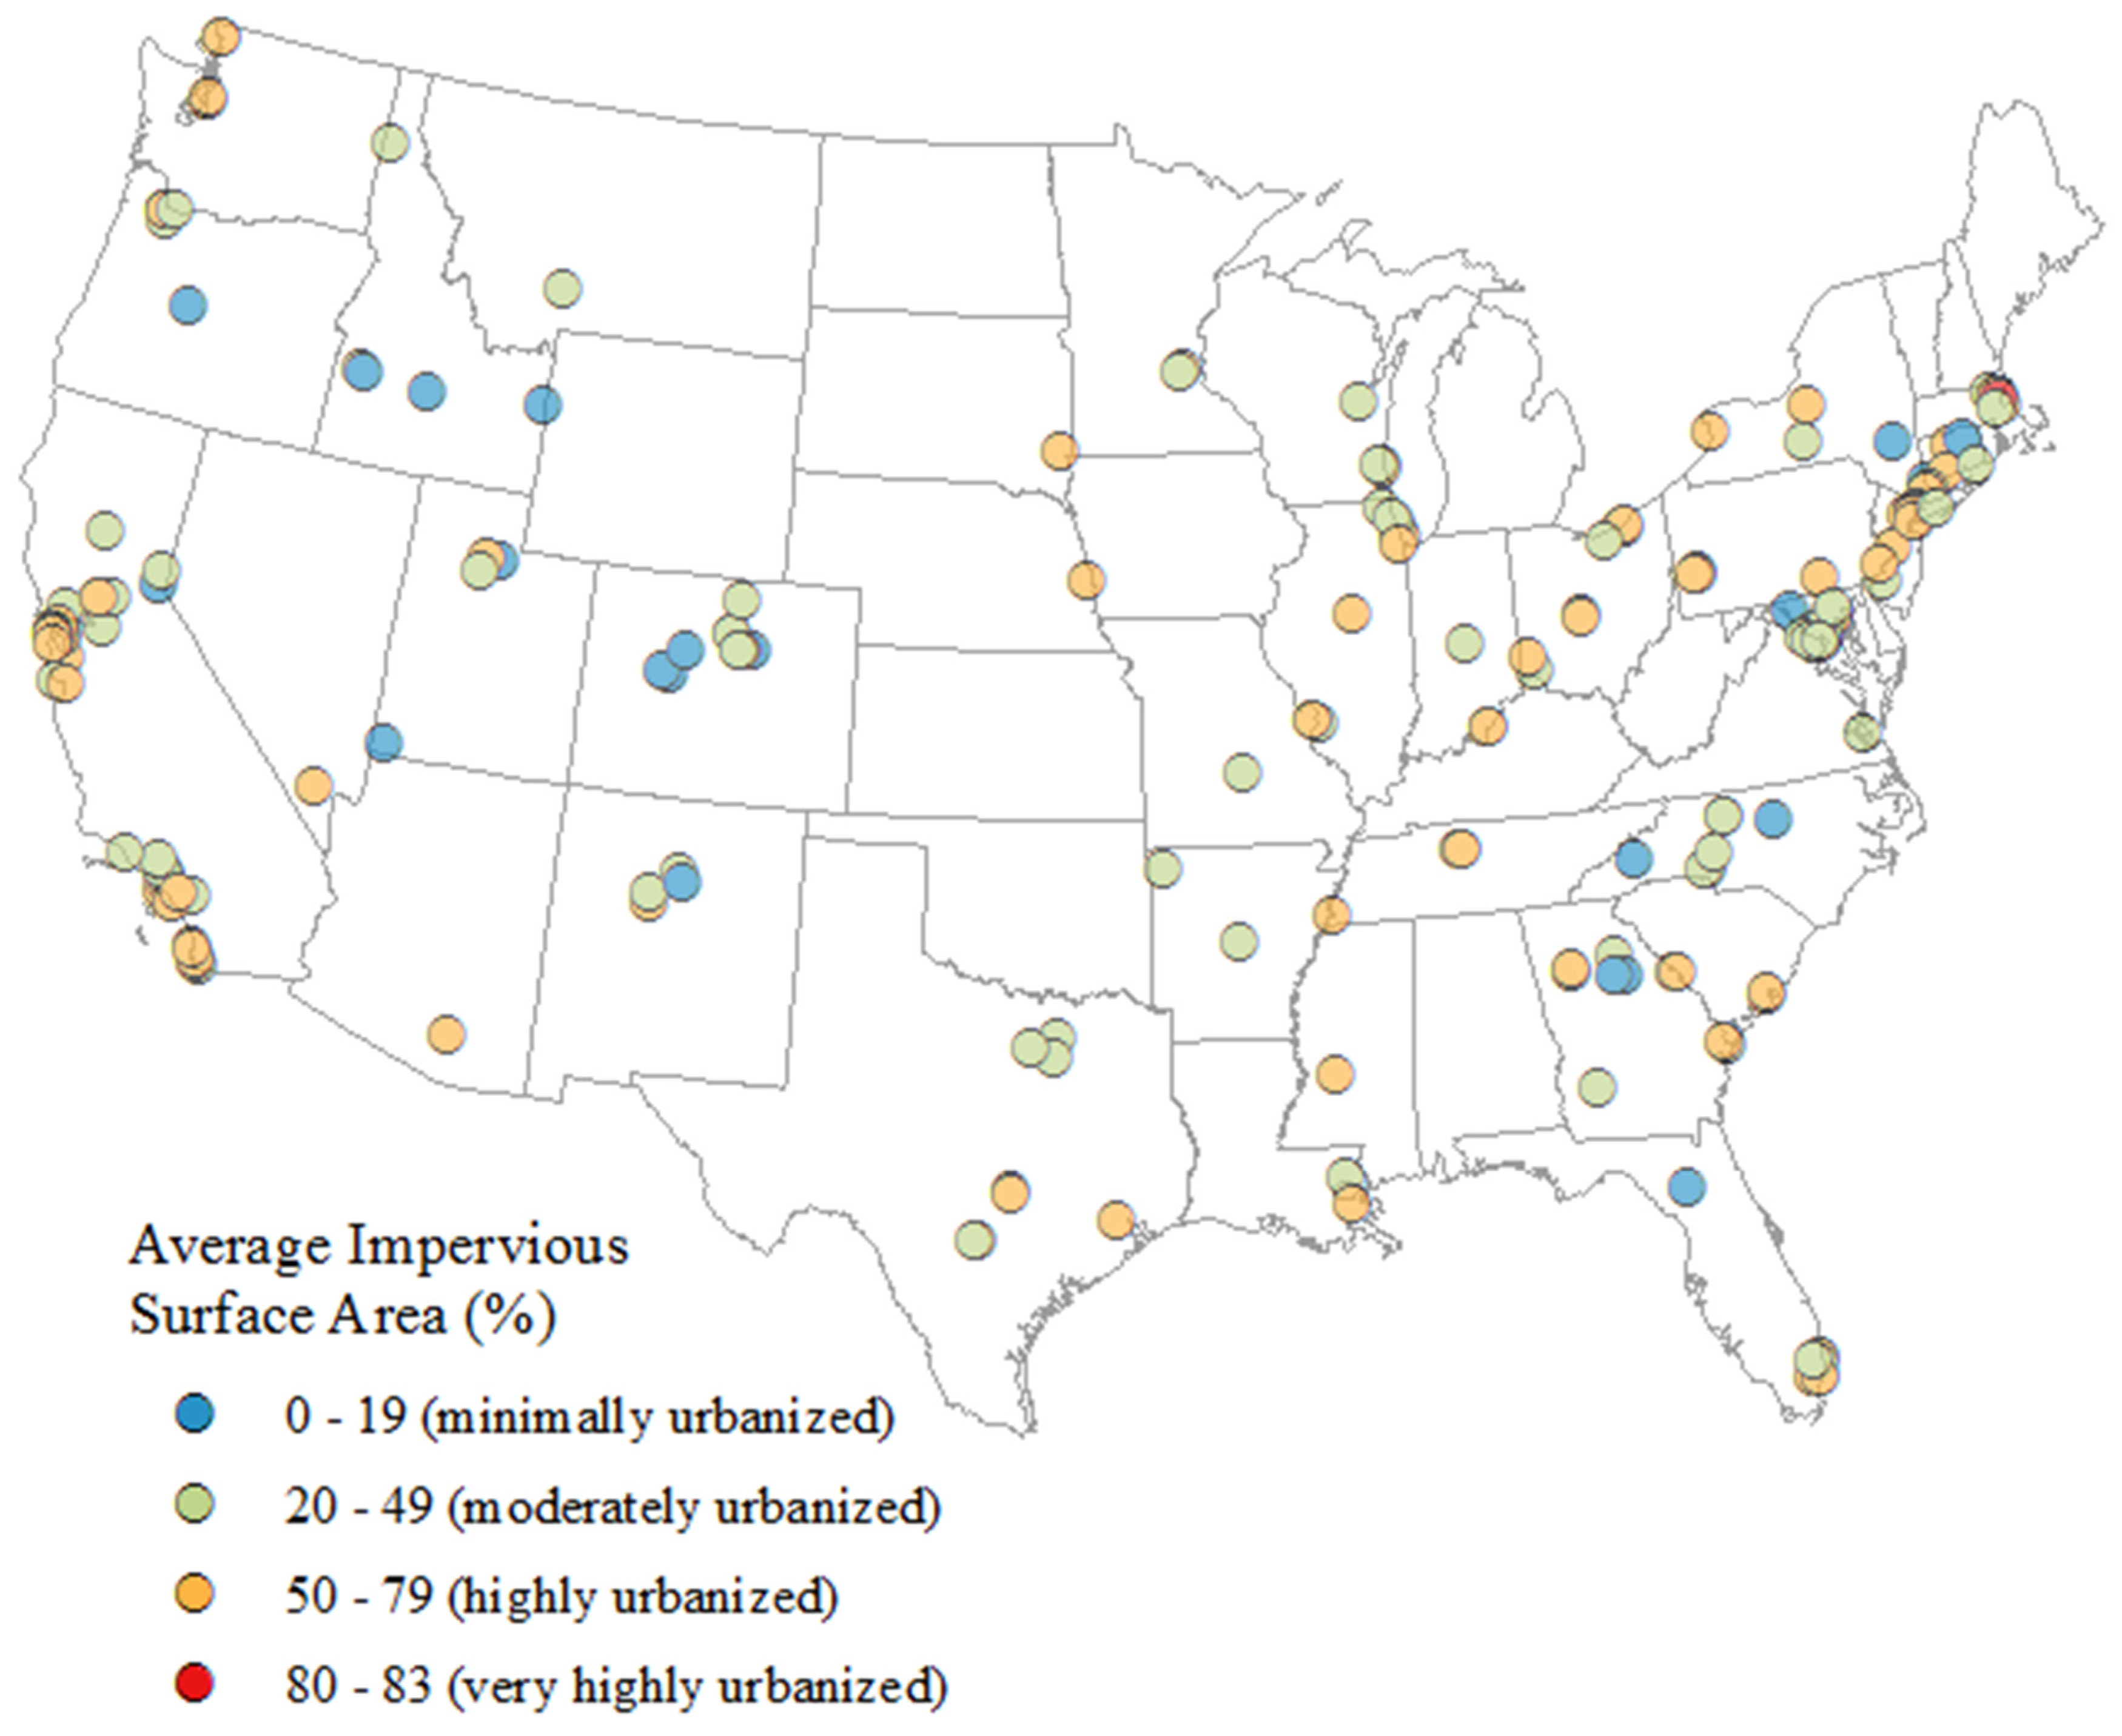
Figure 3 indicates the distribution of LEED
®-ND™ sites by average impervious surface area. Note that there is an overall trend toward greater imperviousness and therefore more urbanized locations.
While relatively few sites exhibited low levels of imperviousness, as expected given the results of the NTL analysis, there were only two sites with proportions higher than 80 percent, the lower cut-off for “high intensity development”. This was not unexpected for two reasons. First, as an averaged measure of impervious surface coverage at each site, 90 percent was used in this analysis to represent all pixels with values in the 80–100 percent range, and thus the maximum value for each LEED®-ND™ location was 90 rather than 100 percent. Indeed, to receive a value of 90 percent, all pixels within the 1.5 km buffer would need to have been classified within the NLCD as “high intensity development” with values of 80 percent or higher. Second, there are very few locations—even within dense urban cores such as downtown Chicago or Manhattan—that do not exhibit some amount of pervious surface area within a 1.5 km radius. This is not the case, however, at a much finer spatial resolution, such as the 30 × 30 meter pixels upon which the NLCD is based. At this scale, many pixels in dense urban environments are at or near 100 percent impervious.
The top 40 LEED
®-ND™ sites by percent impervious surface area were all located within large metropolitan areas. Dominating the top of this list were sites in central Boston, New York City, and Chicago (
Table 3). Each of these are infill/redevelopment projects, as are the vast majority of LEED
®-ND™ sites included in this analysis. Most sites with relatively low percent impervious surface area were found mainly among small and medium-sized metropolitan areas (
Table 4). The “Trenza at the Galisteo Basin Preserve” development outside Santa Fe once again exhibited the lowest value with just one percent impervious surface area. Such a low percentage indicates that at the time the remotely-sensed land cover data was collected in 2011 and the NTL data in 2015, “Trenza at the Galisteo Basin Preserve” had not yet undergone construction. An examination of satellite imagery available through Google Maps revealed an undeveloped site as of July 2015. If eventually constructed, however, the site would be considered a greenfield development.
Similarly, “Mountainside Village” outside Jackson, Wyoming registered only two percent impervious surface area and a NTL intensity value of 3. Although still in the early stages of construction, the site is in proximity of several low-density residential and commercial structures on the periphery of Victor, Idaho, about 20 miles northwest of Jackson. The site is also a greenfield development, though in close proximity to an existing town. Other similar LEED®-ND™ greenfield developments identified in this manner included “Mill District Square” on the outskirts of Boise, Idaho, “Horizon District” near Denver, Colorado, and “Sycamore Run” in Boonsboro, Maryland.
A number of infill and brownfield sites also exhibited relatively low percent impervious surface areas; however these sites were generally located within small towns in which the 1.5 km radius often extended beyond the urban periphery. Infill development in small towns and cities dominated the list up until about 25 percent imperviousness. Above this threshold, most LEED®-ND™ sites in our sample were infill developments firmly embedded within the urban or suburban neighborhoods of medium and large cities.
Geographically, the only clear regional pattern in the percent imperviousness around LEED
®-ND™ sites were clusters of low values in the west/mountain region and along the east coast from northern Florida to Massachusetts (
Figure 3). The western and northeastern low-value clusters were also identified by the NTL analysis (
Figure 2). Regardless of region, most of the “less urbanized” developments were within, or adjacent to, small cities and metropolitan areas. Though there were exceptions, the majority were also infill developments as discussed previously. Sites associated with the highest percent impervious surface area were found in large cities along the east and west coasts where land value is high and infill development may be particularly profitable.
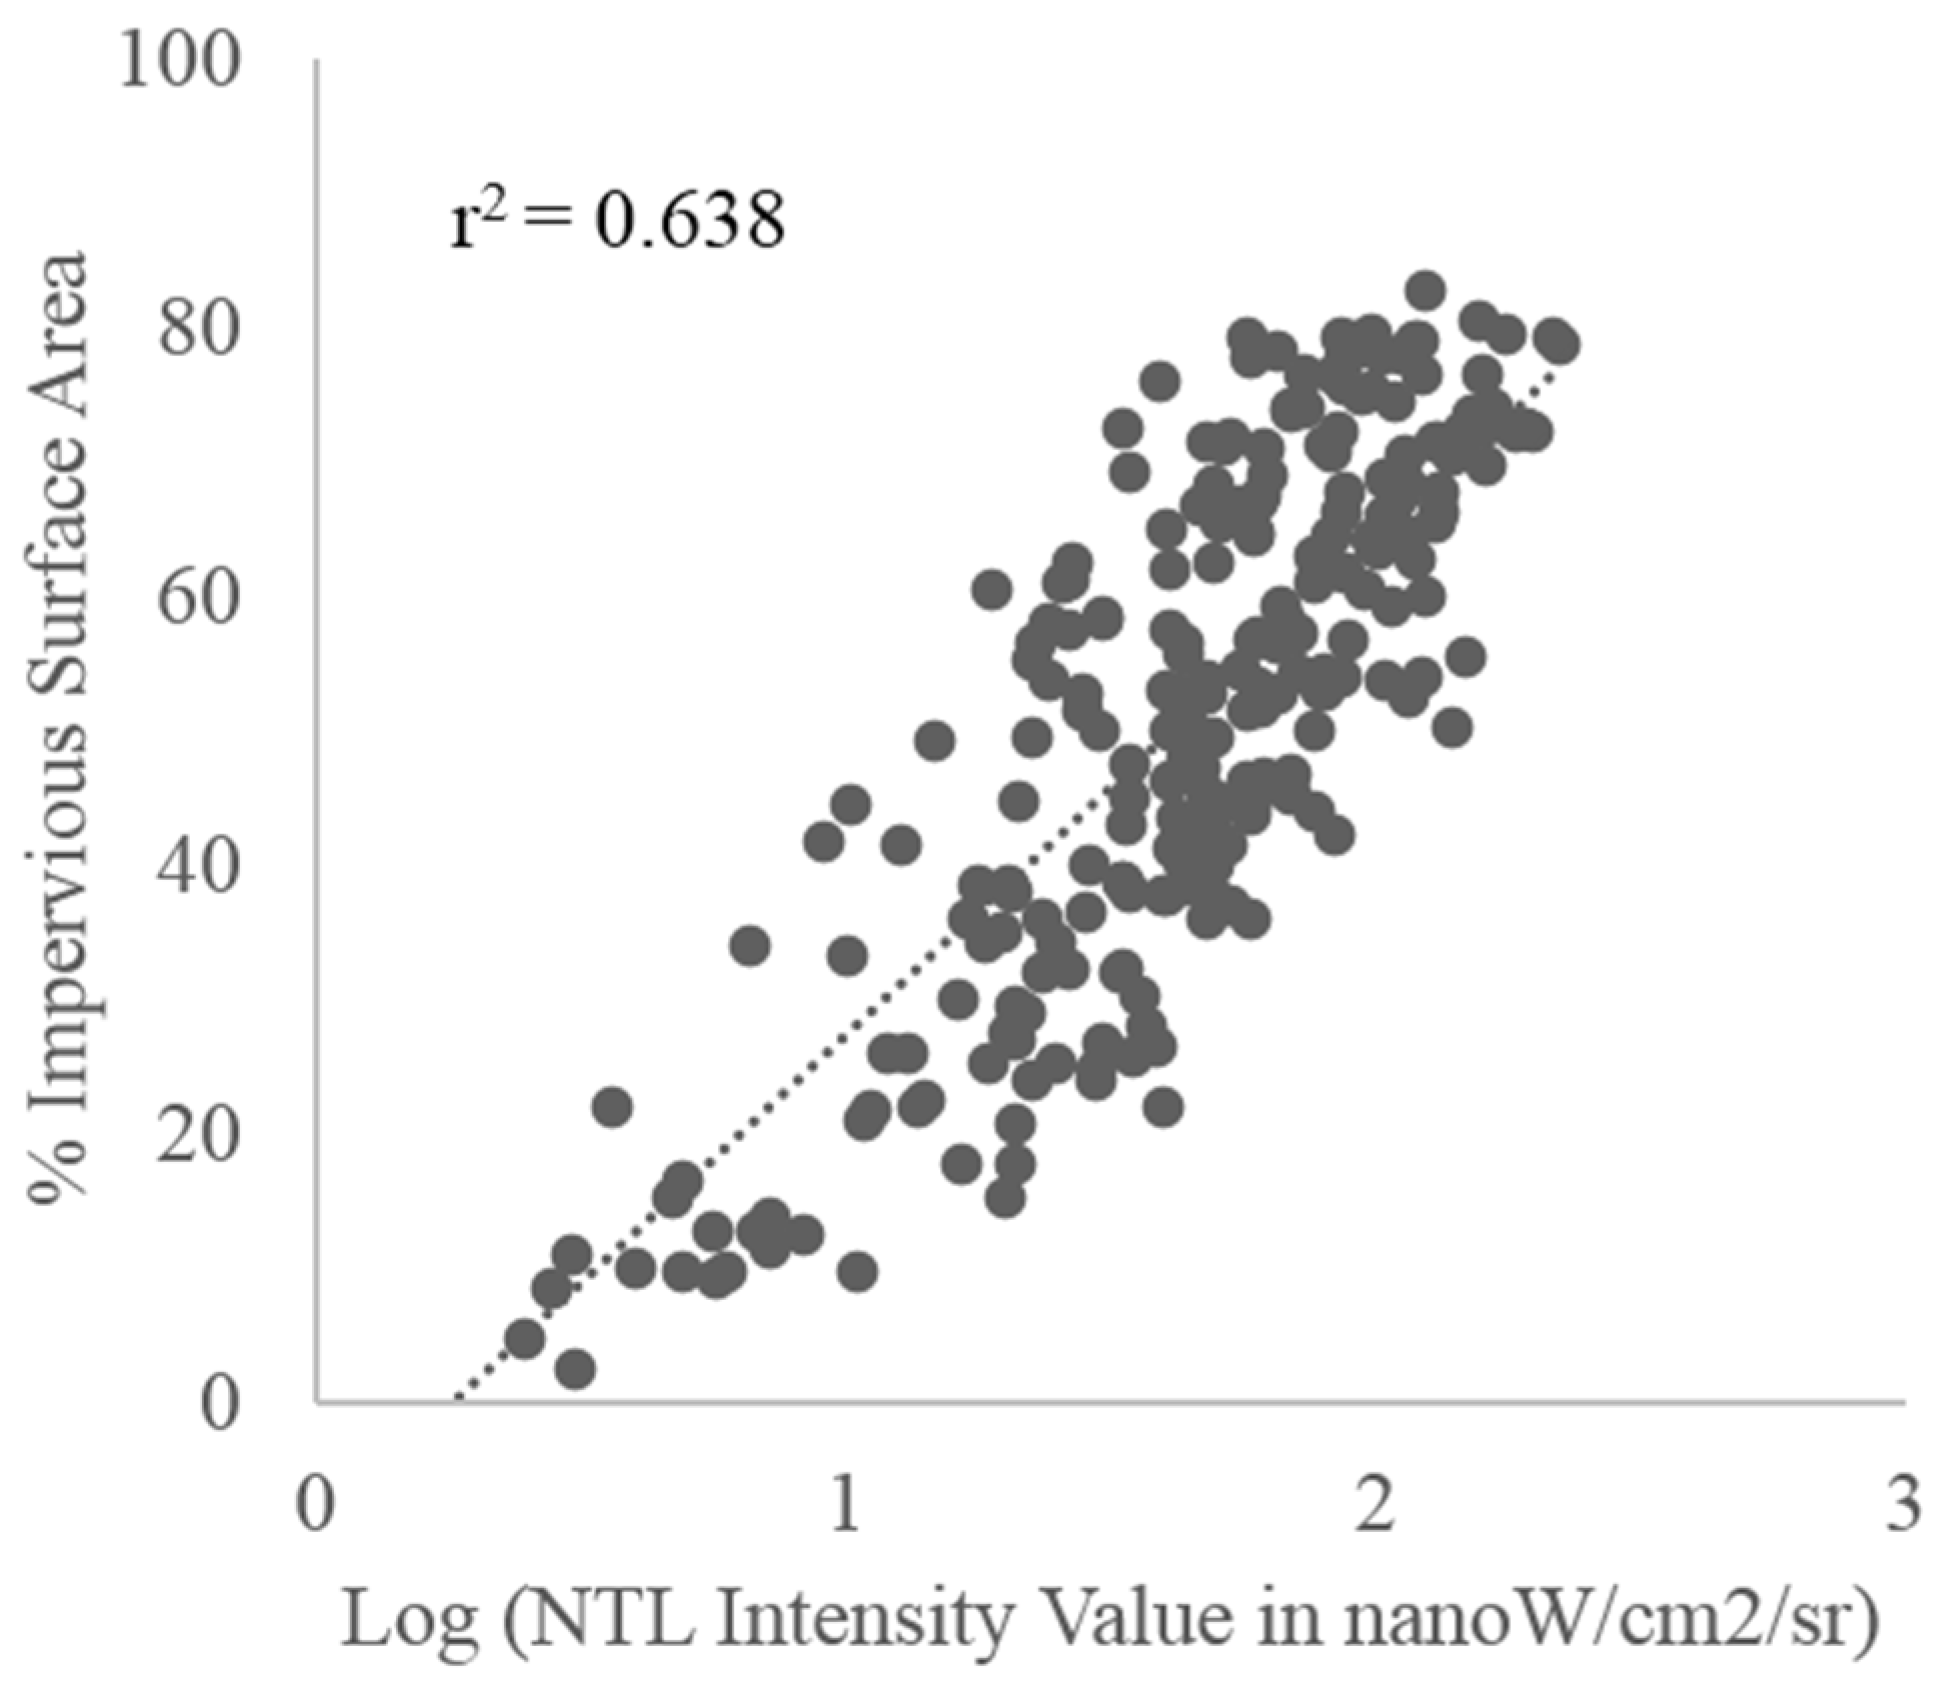
Overall there was good agreement (
r2 = 0.638,
p < 0.001) between the logarithm of the NTL intensity and percent impervious land cover (using Spearman’s rank correlation) (
Figure 4). There were, however, some differences as a result of the way the two measures approximate the degree of urbanization. Consider, for example, “The Shipyard & Candlestick Point” development under construction in San Francisco, California. The development juts out into San Francisco Bay on two peninsulas characterized primarily by warehouses, parking lots, and shipyard-related land uses. Though the degree of imperviousness is relatively high (60 percent) at these locations, indicating an urbanized environment, the amount of actual activity, and thus NTL intensity, is currently quite low (19 nanoW/cm
2/sr). While the two measures are expected to better align as development progresses and lighting increases, the NTL intensity may remain lower than expected given that the development is adjacent to a large body of water and thus occupies a brownfield infill location that is both centralized and physically peripheral.
Other LEED®-ND™ sites exhibited the opposite pattern with relatively low imperviousness but high NTL values. For example, the “East College Street Project” in Oberlin, Ohio (outside of Cleveland), was characterized by a relatively high NTL value (40 nanoW/cm2/sr), but a comparatively low impervious surface area (22 percent). The small, one-block mixed-use development is located near the center of town, however Oberlin is itself quite small (pop. 8286) and although situated within the Cleveland metropolitan area, is surrounded by farmland and other low-intensity development. The light intensity values thus reflect the central, urban nature of the development, while the low degree of impervious surface area is characteristic of the limited size of the town and the mostly low-intensity development found within the town and surrounding countryside.
In general, the light intensity values served as a reliable indicator of each site’s “embeddedness” within an encompassing urban area, while the land cover analysis more accurately described the degree or intensity of urbanization immediately adjoining each site. While both greenfield and infill developments exhibited a wide range of values employing either analysis, greenfield developments became increasingly rare among sites with both high light intensity and impervious surface area values.
4.3. Smart Location
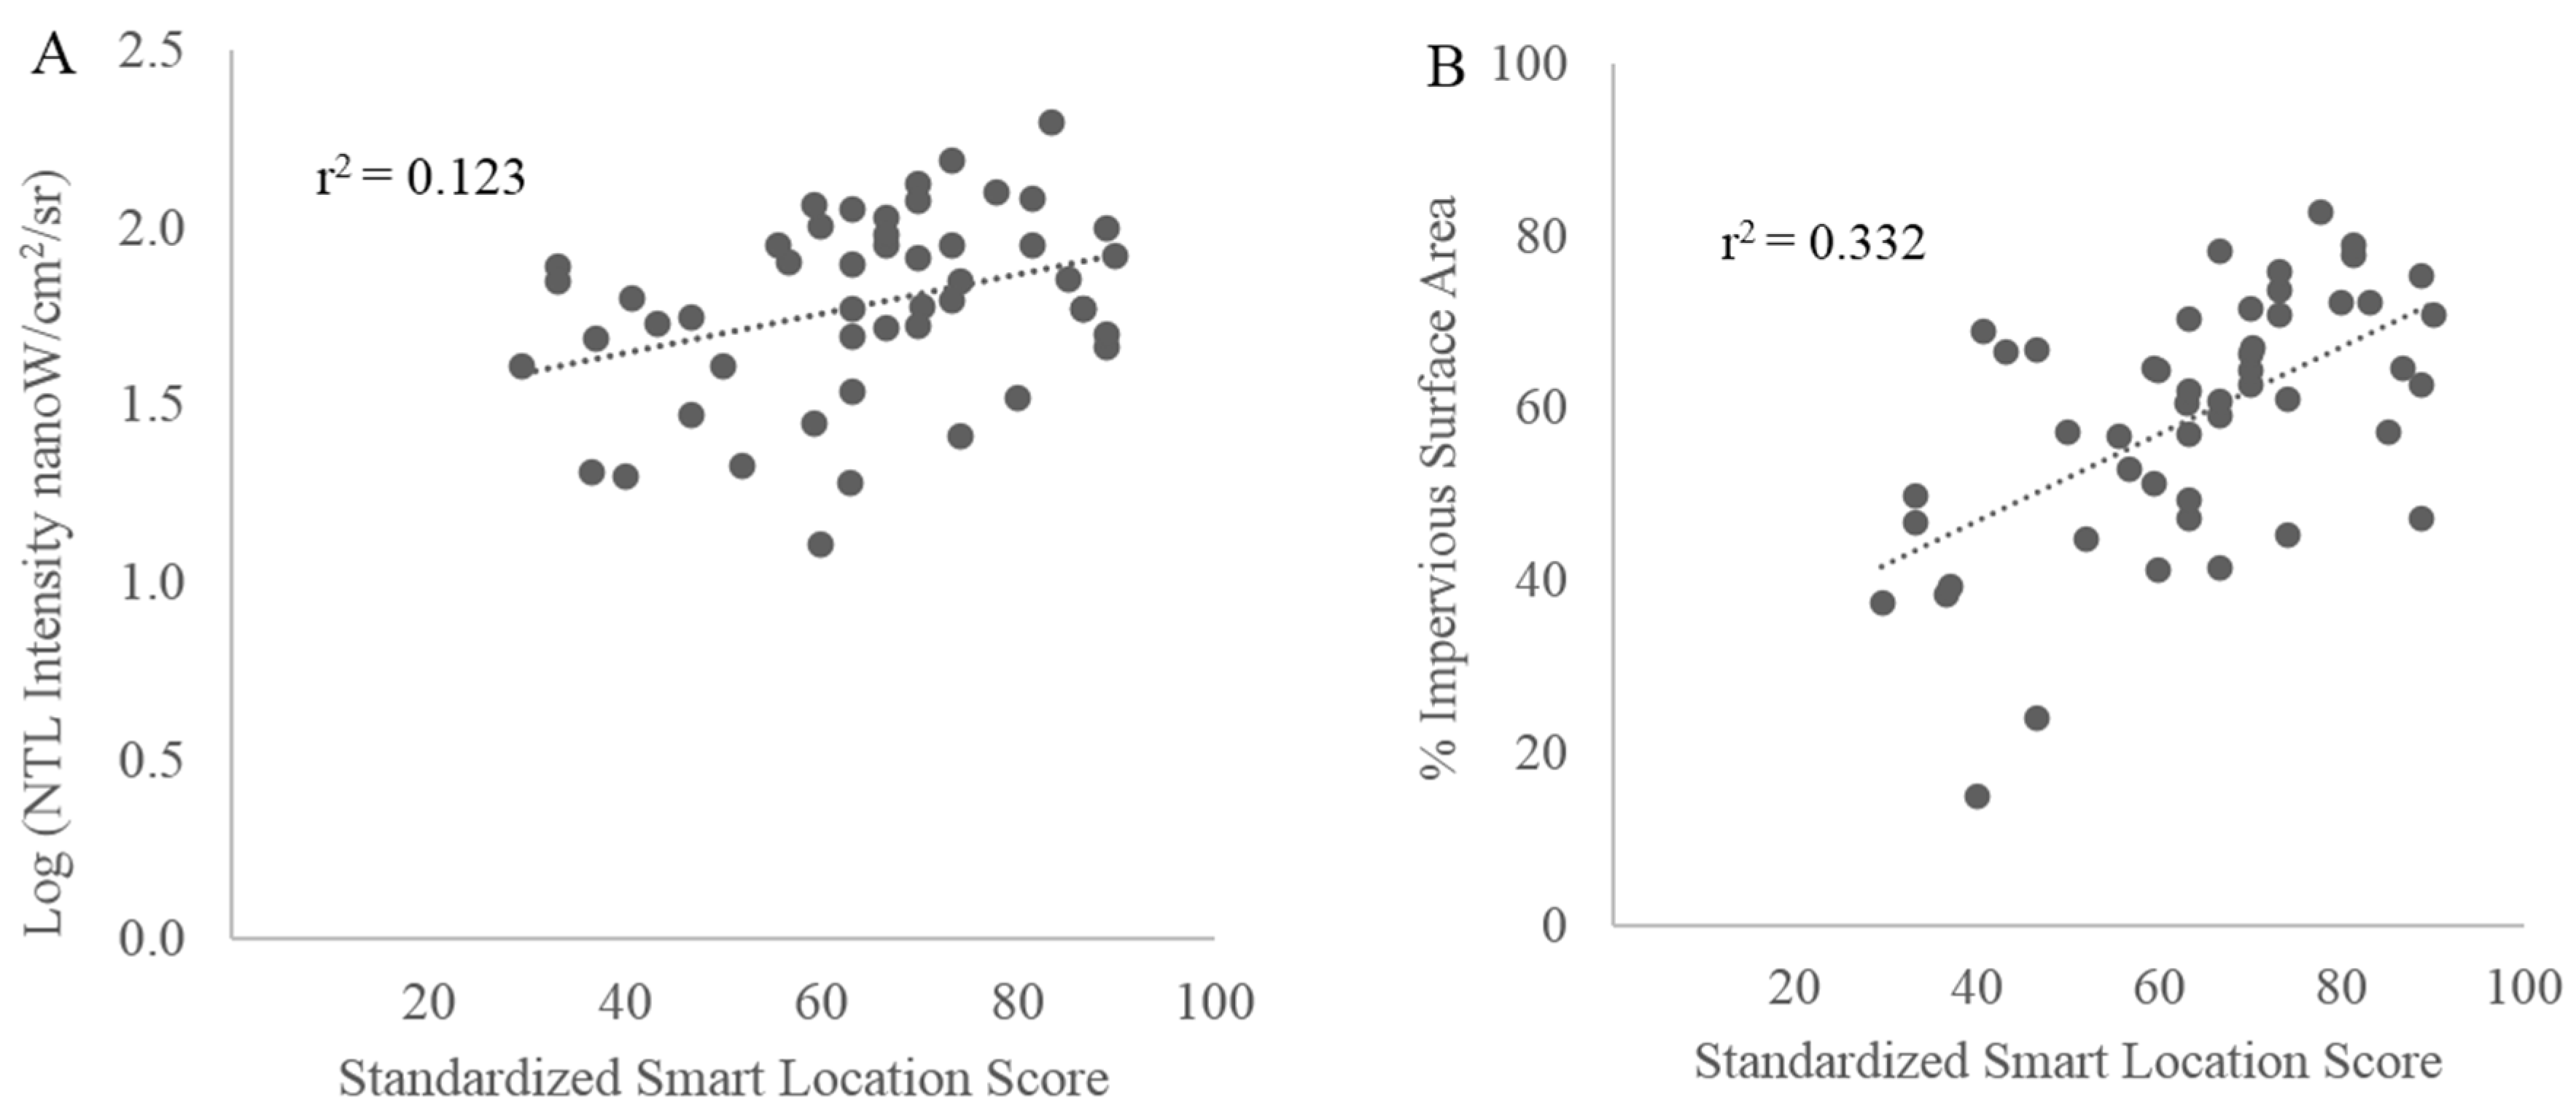
Among the 49 LEED
®-ND™ sites for which smart location scores could be obtained, the correlation between standardized smart location score and NTL intensity was significant and positive (
r2 = 0.123,
p = 0.01) (
Figure 5A), as was the relationship with percent impervious surface area within 1.5 km (
r2 = 0.332,
p < 0.01) (
Figure 5B). Interestingly, during the NTL sensitivity analysis the 3 × 3 pixel grid exhibited the highest correlation (
r2 = 0.186,
p < 0.01) with smart location score. This is perhaps not surprising given that the smart location score is based primarily on proximal neighborhood attributes within a closer ¼ to ½ mile radius of LEED
®-ND™ developments. Importantly, the primary goal of this analysis was not to derive a surrogate measure for smart location, but rather to gauge the degree of urbanization around LEED-ND sites. The results suggest that impervious surface area alone may be capturing much of the variation in the more complex and finer-grained smart location score. The VIIRS NTL dataset may be hampered in this particular application due to the limitations of the instrument itself (e.g., inability to detect all visible light wavelengths equally), as well as potential variations in urban lighting as a result of differences in technology (e.g., LED
vs. sodium bulbs) and policy (e.g., regulations designed to reduce light pollution). Additionally, some brightly-lit areas of cities such as airports and seaports may have very little or no population, yet are classified as highly urbanized within both the NTL and NLCD products. Despite these limitations, when considered together, the impervious surface and NTL data appear to provide a detailed and powerful means of assessing the degree of urbanization and intensity of urban activity at the neighborhood level in a standardized way across the continental U.S. While the individual elements of the smart location score (e.g., public transportation, conservation of natural areas, proximity to housing and jobs) are worth examining independently, the intensity of urban development proximate to each LEED
®-ND™ project appears to serve as useful initial indicator of a site’s potential to meet sustainability goals.
5. Conclusions
It was hypothesized that a majority of LEED
®-ND™ projects will be situated in an urban setting characterized by higher NTL intensity values and a greater degree of developed land cover as measured by an examination of impervious surface area. The results of this study confirmed this hypothesis and revealed that the vast majority of projects are associated with highly urbanized locations that tend to be located in large and medium-sized metropolitan areas, which echoes the results of Smith’s [
20] work. This is an encouraging finding given the emphasis placed on location by the sustainability literature [
58,
59,
60]. Geographic location within the urban fabric is a major component of creating more sustainable urban development patterns and LEED
®-ND™ standards appear to be providing a mechanism to promote this locational objective.
Those LEED-ND projects located outside central, metropolitan locations were most often either resorts or master-planned residential communities. At many of these locations, infill or brownfield development was simply not an option due to the small size of the town or the rural character of the area. Thus, in such cases, low night-time lighting and low impervious surface area may not equate to poor siting or low sustainability; even on greenfield sites, LEED
®-ND™ developments often have advantages over more standard development typologies. It is also worth considering that the ill-effects of urban light pollution on human health and the environment (e.g., [
61,
62,
63,
64]) make it quite clear that brighter lights are not always better. It is therefore important to consider other metrics when evaluating the quality and suitability of site location.
This study also hypothesized that a statistically significant positive relationship was expected between the project’s Smart Location and Linkage Score and the light intensity and impervious surface estimates. The results show that impervious surface area and NTL intensity were both significantly and positively associated with smart location score, highlighting the importance of urbanization and land use cover in optimally siting LEED®-ND™ projects.
The results of this analysis suggest that higher Smart Location and Linkage Scores are associated with more urban locations. This is key, because urban locations often result in the use of existing infrastructure (e.g., roads, water, sewer, schools, parks) and more efficient use of public services (e.g., police and fire), which helps to conserve limited resources (e.g., water, energy,
etc.) [
4,
5]. By examining light intensity and impervious surface data for the LEED
®-ND™ projects, this study was able to determine that more often than not these projects are being developed in urban areas—a LEED
®-ND™ development standard goal. These results also highlight the potential use of LEED
®-ND™ as a tool for urban planning for communities that are attempting to revitalize their urban core and promote infill and redevelopment [
19,
65]. By incorporating LEED
®-ND™ standards into their land use planning efforts, urban planners may be able to substantially increase the overall sustainability of their urban development projects.
The implementation of development standards to promote more sustainable urban environments is a relatively new endeavor. As a result, examinations into the application of these standards is necessary in an effort to understand the implications that these standards have for the built environment and their long term potential for leading towards a path of urban sustainability [
9,
10,
11,
17]. As such, this study provides a method for identifying well placed future sites that could be developed according to sustainable development standards. With more than half the world’s population living in cities and the projected trend for increased levels of urbanization, these standards might provide a needed path to a more sustainable way of planning urban areas.
Multiple standards to help address sustainable urban development are being implemented around the world (e.g., LEED, BREEAM, GRIHA, CASBEE, Green Star,
etc.). More research is needed that explores the use of these standards as they become more widely adopted [
16]. It is envisioned that future research efforts will be focused on exploring the development of new LEED
®-ND™ projects as they are built. Specifically, an examination into the locational attributes of LEED
®-ND™ projects in the future will be necessary to determine whether the trend observed in this study toward more urban and infill locations is maintained over time, or whether LEED
®-ND™ projects become increasingly common among suburban, greenfield locations. A longitudinal study of the LEED
®-ND™ projects discussed in this study is also warranted in order to explore the long-term impacts of these projects on surrounding neighborhoods.
As more people migrate to urban areas, the emphasis should be on creating more sustainable places for people to live, work, and play. Part of that shift towards urban sustainability should include an emphasis on the geographic location of planned development projects. Infill, brownfield, and urbanized locations must be given precedence over greenfield, suburban locations. As this study has demonstrated through an examination into the micro-geography of LEED®-ND™ projects, the LEED®-ND™ standard for promoting urban sustainability is a step in the right direction.


