Article

An Assessment of the Knowledge and Demand of Young Residents regarding the Ecological Services of Urban Green Spaces in Phnom Penh, Cambodia

1
School of Public Administration, China University of Geosciences (Wuhan), Wuhan 430073, China
2
School of Public Affairs, University of Science and Technology of China, Hefei 230026, China
3
Faculty of Social Sciences, Svay Rieng University, Svay Rieng 20251, Cambodia
*
Author to whom correspondence should be addressed.
Sustainability 2016, 8(6), 523; https://doi.org/10.3390/su8060523
Submission received: 12 April 2016 / Revised: 25 May 2016 / Accepted: 26 May 2016 / Published: 31 May 2016

Abstract

:
The fast and steady economic growth and social changes in recent years in Cambodia have brought rapid expansion and restructuring to its cities. These phenomena have brought numerous challenges including threats to urban green spaces (UGS’s). This study addresses problems of UGS’s by investigating the knowledge and perceptions of young residents of Phnom Penh (YRPPs) toward UGS’s in relation to the following: (1) basic knowledge of YRPPs on ecological services (KES) of UGS’s; (2) perceptions of YRPPs on the current state of UGS’s (PUGS’s) in Phnom Penh; (3) demand of YRPPs for UGS’s in the city (DUGS); and (4) associations between KES, PUGS’s, social profiles (SoPs), and DUGS. A questionnaire was designed to solicit knowledge from 554 respondents randomly selected from the study area. The findings revealed that 83.1% of total respondents strongly recognized ecological services of UGS’s. Four subgroups of ecological services, namely microclimate (89.7%), environmental quality and functions (83.8%), recreational and public health services (88.5%), and economic benefits (70.4%) were all rated highly. Because the current state of UGS’s was very poor (68.4%), demand for UGS’s was high (94.43%). Public toilets (84.7%) and rubbish bins (75.6%) were both rated the poorest. The PUGS’s were significantly associated with KES (r = 0.307, F (3, 543) = 18.83, p < 0.001). This study offers a deep understanding about knowledge and demand of YRPPs for UGS’s.

1. Introduction

The fast and steady economic growth and social changes in recent years in Cambodia have brought rapid expansion and restructuring of its cities. The phenomena have raised numerous challenges including the loss of urban green spaces (UGS’s). Urban green spaces (UGS’s) are key components of the ecosystem services that clearly contribute to the improvement of quality of life, public health, landscape design, and environmental quality [1,2,3,4,5]. There are many studies that affirm the benefits of ecological services of UGS’s to residents [6,7,8,9,10,11]. Some important ecological services of UGS’s are the promotion of the well-being of people [12,13,14,15,16,17,18,19], recreational activities [20,21], the mitigation of high temperatures [6,22,23,24], the abatement of air pollution [25], the sequestration of CO2 and release of more O2 [5,26], noise reduction [22], the provision of wildlife habitats [27,28,29,30], the prevention of flood and soil erosion [31], the improvement of city amenities [32,33], and an increase in property (land and house) values [34,35,36,37]. However, many of these benefits are determined by the different levels of species group, canopy cover, size, and shape of UGS’s [38].
Notably, the above studies only focused on roles and benefits of UGS’s to people, and there is scant research regarding perceptions and knowledge of people toward UGS’s, particularly from a perspective of people living in developing countries [7,39,40,41]. A study of perceptions and attitudes of residents toward UGS’s in Guangzhou by A.Y.H. Lo and C.Y. Jim suggested that research to deepen the understanding of public perceptions toward UGS’s is needed in order to design and plan suitable and amenable urban areas for people to live in [42]. Additionally, understanding people’s needs and expectations of UGS’s have important policy and cost-effectiveness implications. Assessing user feedback, attitudes and behavior could help in designing UGS’s that are socially relevant and inclusive [42,43]. Furthermore, many of the above studies mainly investigate perceptions and attitudes of people in general and do not reflect a specific group of the population. The lack of relevant knowledge and different social and cultural context of users could affect their attitudes and behavior toward UGS’s. The level of people’s knowledge and perceptions of the use of UGS’s may also influence demand and decision-making behavior. It is of great interest in Cambodia due to scarce information about this issue. Therefore, this study aimed to contribute more insight into basic knowledge and the use of UGS’s in a fast growing city in Cambodia. The study sought to fill in this gap from perspectives of young residents of Phnom Penh (YRPPs) by addressing the following research purposes: (1) to examine the knowledge of YRPPs toward ecological services of UGS’s (KES); (2) to investigate perceptions of YRPPs toward the state of current green spaces (PUGS’s) in Phnom Penh; (3) to identify the demands of YRPPs for the design of UGS’s (DUGS) in the city; and (4) to find the associations between KES, PUGS’s, social profiles (SoPs), and demand for green space (DUGS).

2. Research Design and Method
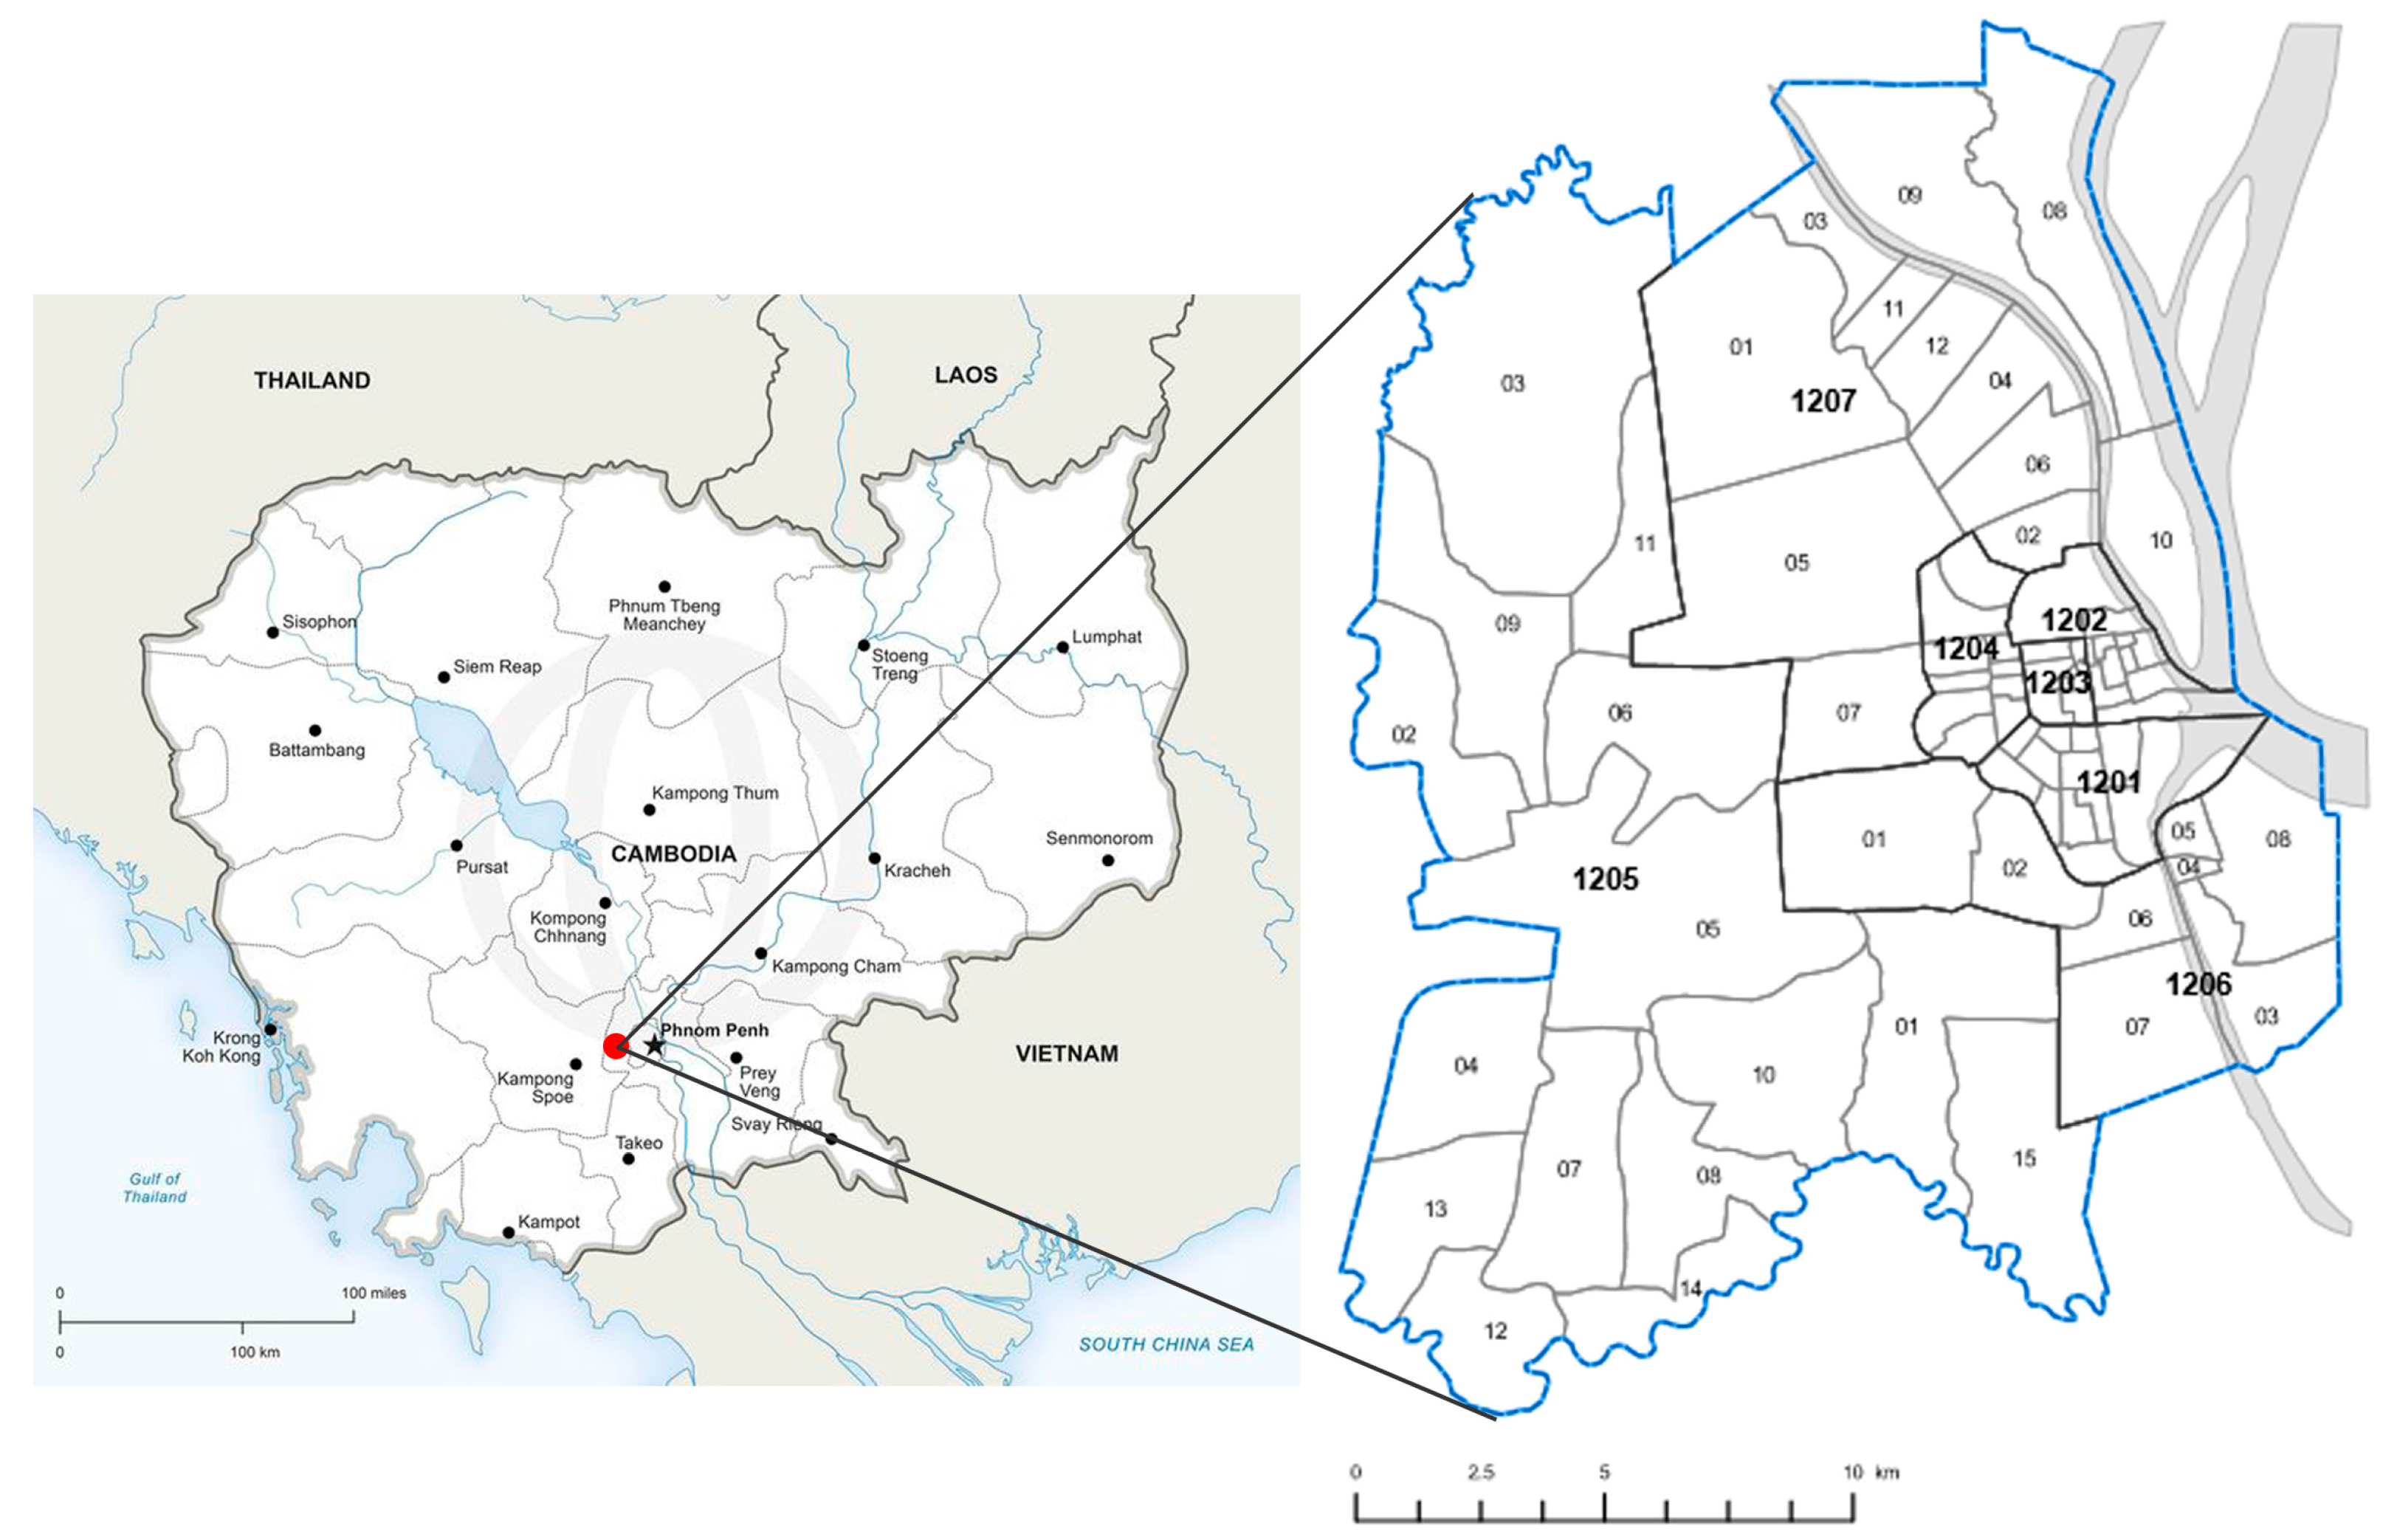
2.1. Study Area

Phnom Penh is the capital city of Cambodia with an area of 678.47 km2, equal to 0.37% of the country’s total landmass of 181,035 km2. It sits on a flat alluvial flood plain on the western bank of the great Mekong River, where it is easily flooded during the rainy season. To the north, west, and south of the city are ring roads that are built as dikes that protect the city from seasonal floods [44]. The average temperature is 29 °C with precipitation of 1493.70 mm/year (2011). Phnom Penh is the fastest growing urban area in East Asia and has been growing at a rate of 4.4% per year from 920,000 to more than 1.4 million people between 2000 and 2010, reaching more than 1.8 million in 2012. The population aged 15 to 35 represents 46.41% of the urban population [45]. Due to the rapid pace of development and the number of people flocking to the city for work, study, and living in recent years, Phnom Penh has expanded its administrative areas from 7 districts (Khans) and 66 communes (Sangkat) in 2008 to 12 districts, 96 communes, and 909 villages in 2013 (See Figure 1) [46].
In Cambodia, self-employment in small business and agriculture is common, and it is hard to gather accurate income data for these types of employment. About 45.3% of Cambodian people, of whom people whose ages are 15–64 years were mainly employed in the agricultural sector as skilled agricultural, forestry, and fishery workers, represented the largest percentage of the total employed population in 2014. The average wages and salaries per month varied considerably between the different geographical domains in Cambodia. Specifically, the average wages and salaries of Phnom Penh residents per month was 1,385,000 riels in 2014 (about US$ 340; US$ 1 = 4065.04 riels) [47].

2.2. Questionnaire Design and Measurement

This was a questionnaire-based, quantitative study. It employed a self-selected sample, which is a non-probability sampling technique. A web-based questionnaire, a new kind of research method via the Internet [48], was designed. Additionally, the questionnaire consisted of four parts: Social profiles (SoPs) of YRPPs including information such as gender, age, level of education, employment, and income (in USD) were addressed in Part 1. The basic knowledge of YRPPs toward ecological services (KES) of UGS’s was elicited in Part 2. In this part, 19 items of ecological services were adopted from the studies by Miller [49] and C.Y. Jim and Wendy Y. Chen [1]. The degree of KES was measured by using ordinal numerical 4-Likert scales ranging from “not important (1)” to “very important (4)”, whereas Part 3 sought the perceptions of YRPPs on the current state of UGS’s (PUGS’s) in Phnom Penh by allowing 5 options on the Likert scale, ranging from “strongly disagree (1)” to “strongly agree (5)”. The last part of the questionnaire was to identify YRPPs’ demand for UGS’s (DUGS) in the capital. Respondents were given 5-Likert scales, ranging from “no need at all (1)” to “strongly needed (5)” for this part.

2.3. Samples and Procedures

The questionnaires were first sent via Facebook, Wechat, and e-mail to 150 randomly selected respondents. These first respondents were requested to re-share the questionnaire to at least two of their friends to fill in the questionnaire. At the same time, three undergraduate students were clearly instructed by a researcher about the study purpose and questionnaire. They carried out face-to-face interviews with about 350 respondents. All respondents who live in Phnom Penh were eligible to participate in this study. The questionnaire was designed in both English and Khmer (Cambodian language) languages, with clear guidelines and easy-to-understand statements from which respondents could choose to express their perceptions and attitudes toward UGS’s.

2.4. Data Analysis

The data collected was analyzed using IBM SPSS v.20 (IBM, Armonk, NY, USA).Descriptive statistics were used to examine the respondents’ characteristics, perceptions, and attitudes. Relationships among constructs were analyzed by using one-way analysis of variance (ANOVA), bivariate correlation, and multiple regression models.

3. Results

3.1. Social Profiles of YRPPs

A total of 321 online samples were received from respondents among which 229 were fully completed with a response rate of 71.33%, whereas 343 face-to-face interviews were carried out, of which 325 were fully completed with a response rate of 94.75%. The online response rate was lower than face-to-face interviews due to Internet accessibility problems. Completed samples totaled 554 (female = 54.2% vs. 45.8%, Median = 2, SD = 0.499) with a response rate of 83.04%, and the reliability of Cronbach’s alpha was 0.749.
Table 1 shows that the majority of respondents were students whose educational attainment was at a higher education level (N = 541, 70.7%), aged 19–24 (N = 391, 70.7%), and with incomes ranging from ≤100$ per month (N = 214, 38.7%) to $101–350 per month (N = 199, 36.0%), which was consistent with the 2014 Socio-Economic Survey, which found that the average wages and salaries of Phnom Penh residents was around 1,385,000 riels (it was about $340) [47].

3.2. Knowledge Base of YRPPs on Ecological Services Generated by UGS’s

The division of 19 ecological services into four groups and the calculation of each group average score revealed the relative importance attached to different attributes and groups. Most of the respondents rated ecological services “very important”, of which some services were rated remarkably high. The rates of “very important” and “important” to every individual service varied from 56.2% (noise abatement) to 94.2% (lower temperature and aesthetic enhancement). The highest average group score was 53.3% for recreation and public health and 45.4% for the microclimate that respondents rated “important” and “very important”, respectively (Table 2). The less tangible and indirect services, namely, O2 release (60.5%, Mean = 4.52, Median = 5.0, SD = 0.673) and CO2 sequestration (57.2%, Mean = 4.49, Median = 5.0, SD = 0.665) were rated highest as “very important” services. Gathering and networking services (59.0%, Mean = 3.89, Median = 4.0, SD = 0.801) received high scores followed by increased humidity and opportunities to contact with nature (57.8%, Mean = 4.17, Median = 4.0, SD = 0.765). Species conservation was also scored very high (55.6%, Mean = 4.41, Median = 4.0, SD = 0.768), which was similar to the air pollution absorption (52.3%, Mean = 3.78, Median = 4.0, SD = 0.844).
Notably, respondents strongly recognized the recreation and public health services provided by UGS’s. They rated recreational places (54.7%, Mean = 4.22, Median = 4.0, SD = 0.686) and public health improvement (49.6%, Mean = 4.38, Median = 4.0, SD = 0.640) very high. However, it was noticed that respondents seemed not to recognize the economic benefits such as an increase in asset value (15.9%, Mean = 3.76, Median = 4.0, SD = 0.811) and boosting small establishments (21.7%, Mean = 3.90, Median = 4.0, SD = 0.788), which were not rated as highly. Noise abatement received a lower score, rated by respondents after economic benefits of UGS’s.
Overall, on average, only 3.7% of respondents chose “not important”, ranging from 0.9% for air pollution absorption to 8.1% for gathering and networking. Meanwhile, on average, 13.3% of respondents chose “not sure” with the highest proportion on noise abatement (26.0%). Controversially, the majority of the respondents chose “important” (47.9%) and “very important” (35.2%), showing that 83.1% of respondents strongly recognized the important roles of UGS’s in generating ecological services.

3.3. Perception toward the Current State of UGS’s

The average of 58.7% of respondents rated the current state of UGS’s in Phnom Penh as “poor” (Table 3). The largest share of the poor rating was linked to the insufficiency of public toilets (75.3%, Mean = 2.16, Median = 2.0, SD = 0.731) and rubbish bins (70.4%, Mean = 2.39, Median = 2.0, SD = 0.867). Additionally, the highest proportions that respondents rated “very poor” were spaces and facilities for kids (18.2%, Mean = 2.46, Median = 2.0, SD = 1.082) and diversity of UGS’s (15.2%, Mean = 2.1, Median = 2.0, SD = 0.744). Similarly, even though visitors had to pay for parking fees, the parking lot was not rated well (60.0%, Mean = 2.26, Median = 2.0, SD = 0.804), and the accessibility for recreational activities was also evaluated poorly (50.0%, Mean = 2.69, Median = 2.0, SD = 1.087). Only 22.1% of respondents rated it as “good”, and 1% rated it as “excellent”. The highest share that respondents awarded as “good” was linked to benches for sitting (37.4%, Mean = 2.80, Median = 2.0, SD = 1.06) followed by spaces for exercise and sports (30.6%, Mean = 2.73, Median = 2.0, SD = 1.01).

3.4. Demand for Urban Green Spaces (DUGS)

Table 4 shows the demand for UGS’s by YRPPs. The respondents’ highest rating for all statements was “strongly needed” (total average of 59.51%). The highest demand for UGS’s was for diversity of vegetation, habitats, and playgrounds (67.3%, Mean = 4.63, Median = 5.0, SD = 0.59) followed by quality and safety of UGS’s (61.0%, Mean = 4.53, Median = 5.0, SD = 0.67). Respondents wanted to have each UGS within 5 km of the city (58.8%, Mean = 4.49, Median = 5.0, SD = 0.73) and thought that UGS’s should be freely accessible for recreational activities (50.9%, Mean = 4.43, Median = 5.0, SD = 0.66).

3.5. Associations between KES, PUGS’s, SoPs, and DUGS

The relationships between KES, PUGS’s, SoPs, and DUGS are shown in Table 5. The bivariate correlation analysis showed that DUGS was positively correlated with KES (r = 0.295, p < 0.001), and SoPs were also significantly positively correlated with KES (r = 0.130, p < 0.001), but DUGS was not significantly correlated with PUGS’s (r = −0.087, p < 0.05). Furthermore, the multiple regression analysis showed that only KES was positively correlated with DUGS (r = 0.307, F (3, 543) = 18.83, p < 0.001), while other PUGS’s and SoPs were not (p > 0.05). Therefore, the strongest predictor for DUGS is KES (b = 0.301, p < 0.001), but only a 9.4% variance of DUGS (r2 = 0.094) can be explained by KES; therefore, DUGS can be explained by other variables. The DUGS would increase 0.301 (b = 0.301) if there were an increase in KES. The PUGS’s and SoPs were not good predictors of DUGS, so they could be deleted.

4. Discussion

The results revealed that 83.1% of respondents (YRPPs) strongly recognized the important roles UGS’s play in generating ecological services for environmental, social, and economic benefits. The ratings were different from one service to another (the highest was 60.5% on O2 release, while the lowest was 15.9% on increasing property value). Although the population of this study consisted only of young residents, which thus does not represent the points of view of the entire population of the city, this result is consistent with many other studies on the perceptions and attitudes toward UGS’s indicating that perceptions and attitudes toward UGS’s are complex and have different psychological points of view related to age, race, religion, gender, education, income, and experience [5,39,40,41,50]. Realistically, the different social contexts and backgrounds of respondents would also influence the perceptions and attitudes toward UGS’s. For example, a study by C.Y. Chen and W. Y. Chen in Guangzhou, China, indicated that, although the importance of ecosystem services to wildlife habitat and species conservation were rated very low, and the use of green spaces to demarcate the different types of landscape and land use was hardly noticed or appreciated by the residents, UGS’s were strongly recognized by Guangzhou residents [1]. Another study of urban park use in England and Wales pointed out that the overwhelming popularity of natural features were reminiscent of an ideal rural arcadia [5,51]. A study of the urban forest in Finland revealed that the benefits related to nature were valued most, outdoor activities were rated important, and climate and environmental quality such as pollution mitigation and noise abatement were the least important [52]. Consistently, a study in Mandeville city in New Orleans, USA, about residents’ attitudes toward urban forestry showed that aesthetic value and shading were rated the most important, whereas wildlife habitat, the amelioration of urban climate, and the increase in property values were rated important. The benefits related to environmental quality, such as the control of dust, wind, and storm water, were ranked low, while economic values of UGS’s were rated the least important in both Finland and Mandeville [5,52,53].
If basic knowledge about UGS’s increase, the demand for UGS’s may also increase. The results of this study revealed that 94.43% of YRPPs demanded UGS’s in the city (34.9% rated them as “needed”, and 59.51% rated them as “strongly needed”). It was statistically consistent with the result that 83.1% of YRPPs recognized the importance of the ecological services of UGS’s. By contrast, the current state of UGS’s in Phnom Penh was not satisfactory for residents of this city. For instance, 58.7% of YRPPs rated them as “poor”, and 9.7% rated them as “very poor”, due to the basic characteristics and services of UGS’s. The highest percentage of poor quality ratings of the components of UGS’s were given to public toilets (75.3%) and rubbish bins (70.4%). This suggests that the government should offer sufficient public toilets and care more about waste management in UGS’s of the city so that its residents can access comfortable recreational places freely. A percentage of 61.1% of respondents felt strongly that the government must not only guarantee the quality but also the safety of UGS’s for visitors.
Differences in perceptions of the current state of UGS’s and social profiles of respondents such as gender, income, education, and age were not statistically significant with the demand for urban green spaces; however, demand will likely increase when YRPPs increasingly recognize (KES) the important roles of UGS’s (r = 0.307, F (3, 543) = 18.83, p < 0.001). In addition, this demand would also increase if the perception of YRPPs toward the current state of UGS’s were to positively increase.

5. Conclusions and Implications

The findings of this study revealed that the majority of YRPPs strongly recognized the ecological services of urban green spaces (UGS’s). The study also pointed out the perceptions of YRPPs toward the current state of UGS’s in Phnom Penh, where YRPPs rated its quality as “very poor”. Relationships between social profiles, the basic knowledge of respondents of ecological services, perceptions toward UGS’s, and the demand for UGS’s were examined. Statistically, respondents’ social profile factor was significantly associated with the basic knowledge of ecological services such that the stronger the knowledge the respondents had on ecological services, the higher the demand for urban green spaces they had. These findings are consistent with similar studies conducted elsewhere, where UGS’s were usually perceived to bring multiple benefits other than negative impacts [1,19].
Ecosystem services of UGS’s in Phnom Penh are not equally appreciated by the people and government. Inevitably, accessibility to the current UGS’s for recreational activities in Phnom Penh still lags behind. Thus, the findings suggest that public preference and attitude concerning UGS’s are circumscribed by two factors. First, there is a universal human desire to redesign the tenuous link between humans and nature; second, there is acquired cultural influence on the functions of UGS’s in cities. The amount of information, knowledge, and experience that residents have affects responses and behaviors [1]. Therefore, this study suggests government and policy makers in Cambodia, and real estate developers, should pay more attention to the attachment of more green spaces to their projects in the city. Not only do more UGS’s improve city amenities, environmental friendliness, and the public health of residents, but they also attract users and investors and improve property values [53].

Acknowledgments

The research was fully supported by the CAS-TWAS (Chinese Academy of Science and the Third World Academy of Science) President’s Fellowship program and Chinese Government Scholarship programs (CSC). The author also sincerely thanks the valuable advice and support from Prof. Zhanqi Wang and Prof. Yumin Shi. Without their support and help, this research would not have been produced academically. The authors unforgettably express sincere gratitude to the reviewers who spent their valued time to give constructive comments and advice on the manuscript.

Author Contributions

Yat Yen collected and analyzed data and wrote the manuscript. Zhanqi Wang designed the research work. Yumin Shi reviewed the literature, and Bunly Soeung edited the English and style of the manuscript.

Conflicts of Interest

The authors declare no conflict of interest.

Abbreviations

The following abbreviations are used in this manuscript:
YRPPsyoung residents of Phnom Penh
UGS’surban green spaces
SoPssocial profiles of respondents
PUGS’sperceptions of YRPPs of urban green spaces
KESknowledge of YRPPs of the ecological services of urban green spaces
DUGSdemand of YRPPs for urban green spaces

References

  1. Jim, C.Y.; Chen, W.Y. Perception and attitude of residents toward urban green spaces in guangzhou (China). Environ. Manag. 2006, 38, 338–349. [Google Scholar] [CrossRef] [PubMed]
  2. Schetke, S.; Qureshi, S.; Lautenbach, S.; Kabisch, N. What determines the use of urban green spaces in highly urbanized areas?—Examples from two fast growing asian cities. Urban For. Urban Green. 2016, 16, 150–159. [Google Scholar] [CrossRef]
  3. He, J.; Yi, H.; Liu, J. Urban green space recreational service assessment and management: A conceptual model based on the service generation process. Ecol. Econ. 2016, 124, 59–68. [Google Scholar] [CrossRef]
  4. Hofmann, M.; Westermann, J.R.; Kowarik, I.; van der Meer, E. Perceptions of parks and urban derelict land by landscape planners and residents. Urban For. Urban Green. 2012, 11, 303–312. [Google Scholar] [CrossRef]
  5. Norton, B.A.; Coutts, A.M.; Livesley, S.J.; Harris, R.J.; Hunter, A.M.; Williams, N.S.G. Planning for cooler cities: A framework to prioritise green infrastructure to mitigate high temperatures in urban landscapes. Landsc. Urban Plan. 2015, 134, 127–138. [Google Scholar] [CrossRef]
  6. Verlic, A.; Arnberger, A.; Japelj, A.; Simoncic, P.; Pirnat, J. Perceptions of recreational trail impacts on an urban forest walk: A controlled field experiment. Urban For. Urban Green. 2015, 14, 89–98. [Google Scholar] [CrossRef]
  7. Maimaitiyiming, M.; Ghulam, A.; Tiyip, T.; Pla, F.; Latorre-Carmona, P.; Halik, U.; Sawut, M.; Caetano, M. Effects of green space spatial pattern on land surface temperature: Implications for sustainable urban planning and climate change adaptation. ISPRS J. Photogramm. Remote Sens. 2014, 89, 59–66. [Google Scholar] [CrossRef]
  8. Shackleton, S.; Chinyimba, A.; Hebinck, P.; Shackleton, C.; Kaoma, H. Multiple benefits and values of trees in urban landscapes in two towns in northern south africa. Landsc. Urban Plan. 2015, 136, 76–86. [Google Scholar] [CrossRef]
  9. Charron, D.F. Ecosystem approaches to health for a global sustainability agenda. Ecohealth 2012, 9, 256–266. [Google Scholar] [CrossRef] [PubMed]
  10. Shanahan, D.F.; Lin, B.B.; Gaston, K.J.; Bush, R.; Fuller, R.A. What is the role of trees and remnant vegetation in attracting people to urban parks? Landsc. Ecol. 2015, 30, 153–165. [Google Scholar] [CrossRef]
  11. Andrews, B. Quantifying the well-being benefits of urban green spaces. 2014. Available online: https://ueaeprints.uea.ac.uk/51282/1/2014AndrewsBPhD.pdf (accessed on 30 May 2016).
  12. Qiu, L. Linking Biodiversity and Recreational Merits of Urban Green Spaces: Methodological Development. Ph.D. Thesis, Faculty of Landscape Architecture, Planning and Management, Swidish University of Agricultural Sciences, Uppsala, Swedish, February 2014; pp. 1–74. [Google Scholar]
  13. Dobbs, C.; Escobedo, F.J.; Zipperer, W.C. A framework for developing urban forest ecosystem services and goods indicators. Landsc. Urban Plan. 2011, 99, 196–206. [Google Scholar] [CrossRef]
  14. Bertram, C.; Rehdanz, K. The role of urban green space for human well-being. Ecol. Econ. 2015, 120, 139–152. [Google Scholar] [CrossRef]
  15. De la Barrera, F.; Reyes-Paecke, S.; Banzhaf, E. Indicators for green spaces in contrasting urban settings. Ecol. Indic. 2016, 62, 212–219. [Google Scholar] [CrossRef]
  16. Taylor, L.; Hochuli, D.F. Creating better cities: How biodiversity and ecosystem functioning enhance urban residents’ wellbeing. Urban Ecosyst. 2015, 18, 747–762. [Google Scholar] [CrossRef]
  17. Krekel, C.; Kolbe, J.; Wüstemann, H. The greener, the happier? The effect of urban land use on residential well-being. Ecol. Econ. 2016, 121, 117–127. [Google Scholar] [CrossRef]
  18. Van den Berg, M.; Wendel-Vos, W.; van Poppel, M.; Kemper, H.; van Mechelen, W.; Maas, J. Health benefits of green spaces in the living environment: A systematic review of epidemiological studies. Urban For. Urban Green. 2015, 14, 806–816. [Google Scholar] [CrossRef]
  19. Tu, G.; Abildtrup, J.; Garcia, S. Preferences for urban green spaces and peri-urban forests: An analysis of stated residential choices. Landsc. Urban Plan. 2016, 148, 120–131. [Google Scholar] [CrossRef]
  20. Koohsari, M.J.; Mavoa, S.; Villanueva, K.; Sugiyama, T.; Badland, H.; Kaczynski, A.T.; Owen, N.; Giles-Corti, B. Public open space, physical activity, urban design and public health: Concepts, methods and research agenda. Health Place 2015, 33, 75–82. [Google Scholar] [CrossRef] [PubMed]
  21. Madureira, H.; Nunes, F.; Oliveira, J.V.; Cormier, L.; Madureira, T. Urban residents’ beliefs concerning green space benefits in four cities in france and portugal. Urban For. Urban Green. 2015, 14, 56–64. [Google Scholar] [CrossRef]
  22. Tan, Z.; Lau, K.K.-L.; Ng, E. Urban tree design approaches for mitigating daytime urban heat island effects in a high-density urban environment. Energy Build. 2016, 114, 265–274. [Google Scholar] [CrossRef]
  23. Bowler, D.E.; Buyung-Ali, L.; Knight, T.M.; Pullin, A.S. Urban greening to cool towns and cities: A systematic review of the empirical evidence. Landsc. Urban Plan. 2010, 97, 147–155. [Google Scholar] [CrossRef]
  24. Jim, C.Y.; Chen, W.Y. Assessing the ecosystem service of air pollutant removal by urban trees in Guangzhou (China). J. Environ. Manag. 2008, 88, 665–676. [Google Scholar] [CrossRef] [PubMed]
  25. Cohen, P.; Potchter, O.; Schnell, I. The impact of an urban park on air pollution and noise levels in the mediterranean city of Tel-Aviv, Israel. Environ.Pollut. 2014, 195, 73–83. [Google Scholar] [CrossRef] [PubMed]
  26. Patón, D.; Romero, F.; Cuenca, J.; Escudero, J.C. Tolerance to noise in 91 bird species from 27 urban gardens of Iberian Peninsula. Landsc. Urban Plan. 2012, 104, 1–8. [Google Scholar] [CrossRef]
  27. Chiquet, C.; Dover, J.W.; Mitchell, P. Birds and the urban environment: The value of green walls. Urban Ecosyst. 2013, 16, 453–462. [Google Scholar] [CrossRef]
  28. Barrico, L.; Azul, A.M.; Morais, M.C.; Coutinho, A.P.; Freitas, H.; Castro, P. Biodiversity in urban ecosystems: Plants and macromycetes as indicators for conservation planning in the city of Coimbra (Portugal). Landsc. Urban Plan. 2012, 106, 88–102. [Google Scholar] [CrossRef]
  29. Hussain, A.M.T.; Tschirhart, J. Economic/ecological tradeoffs among ecosystem services and biodiversity conservation. Ecol. Econ. 2013, 93, 116–127. [Google Scholar] [CrossRef]
  30. Greco, S.E.; Larsen, E.W. Ecological design of multifunctional open channels for flood control and conservation planning. Landsc. Urban Plan. 2014, 131, 14–26. [Google Scholar] [CrossRef]
  31. Hladnik, D.; Pirnat, J. Urban forestry-linking naturalness and amenity: The case of Ljubljana, Slovenia. Urban For. Urban Green. 2011, 10, 105–112. [Google Scholar] [CrossRef]
  32. Seburanga, J.L.; Kaplin, B.A.; Zhang, Q.X.; Gatesire, T. Amenity trees and green space structure in urban settlements of Kigali, Rwanda. Urban For. Urban Green. 2014, 13, 84–93. [Google Scholar] [CrossRef]
  33. Li, W.; Saphores, J.-D.M.; Gillespie, T.W. A comparison of the economic benefits of urban green spaces estimated with ndvi and with high-resolution land cover data. Landsc. Urban Plan. 2015, 133, 105–117. [Google Scholar] [CrossRef]
  34. Lin, I.H.; Wu, C.; de Sousa, C. Examining the economic impact of park facilities on neighboring residential property values. Appl. Geogr. 2013, 45, 322–331. [Google Scholar] [CrossRef]
  35. Shukur, F.; Othman, N.; Nawawi, A.H. The values of parks to the house residents. Procedia Soc. Behav. Sci. 2012, 49, 350–359. [Google Scholar] [CrossRef]
  36. Jim, C.Y.; Chen, W.Y. Impacts of urban environmental elements on residential housing prices in Guangzhou (China). Landsc. Urban Plan. 2006, 78, 422–434. [Google Scholar] [CrossRef]
  37. Feyisa, G.L.; Dons, K.; Meilby, H. Efficiency of parks in mitigating urban heat island effect: An example from addis ababa. Landsc. Urban Plan. 2014, 123, 87–95. [Google Scholar] [CrossRef]
  38. Muratet, A.; Pellegrini, P.; Dufour, A.-B.; Arrif, T.; Chiron, F. Perception and knowledge of plant diversity among urban park users. Landsc. Urban Plan. 2015, 137, 95–106. [Google Scholar] [CrossRef]
  39. Sakip, S.S.M.; Akhir, N.M.; Omar, S.S. Determinant factors of successful public parks in Malaysia. Procedia Soc. Behav. Sci. 2015, 170, 422–432. [Google Scholar] [CrossRef]
  40. Wendel, E.W.; Zarger, R.K.; Mihelcic, J.R. Accessibility and usability: Green space preferences, perceptions, and barriers in a rapidly urbanizing city in Latin America. Landsc. Urban Plan. 2012, 107, 272–282. [Google Scholar] [CrossRef]
  41. Lo, A.Y.H.; Jim, C.Y. Differential community effects on perception and use of urban greenspaces. Cities 2010, 27, 430–442. [Google Scholar] [CrossRef]
  42. Qureshi, S.; Breuste, J.H.; Jim, C.Y. Differential community and the perception of urban green spaces and their contents in the megacity of Karachi, Pakistan. Urban Ecosyst. 2013, 16, 853–870. [Google Scholar] [CrossRef]
  43. Englung, G.; Ryttar, S. The blue pearl of asia: Flooding as an urban asset-a beautiful and resilient future Phnom Penh. 2008. Available online: http://ex-epsilon.slu.se/3162/1/englund_ryttar_090305.pdf (accessed on 30 May 2016).
  44. NIS. General Population Census of Cambodia 2008; Ministry of Planning: Phnom Penh, Cambodia, 2008; Volume 2, pp. 1–192.
  45. Thaisieng, T. Smart City Master Plan of Phnom Penh. 2015. Available online: http://citynet-ap.org/wp-content/uploads/2015/07/Phnom-Penh.pdf (accessed on 30 May 2016).
  46. NIS. Cambodia Socio-Economic Survey 2014; National Institute of Statistics, Ministry of Planning: Phnom Penh, Cambodia, 2015; pp. 1–127.
  47. Buchanan, T.; Smith, J.L. Using the internet for psychological research: Personality testing on the world wide web. Br. J. Psychol. 1999, 90, 125–144. [Google Scholar] [CrossRef] [PubMed]
  48. Miller, R.W.; Hauer, R.J.; Werner, L.P. Urban Forestry: Planning and Managing Urban Greenspaces, 3rd ed.; Waveland Press Inc.: Long Grove, IL, USA, 2015. [Google Scholar]
  49. Japelj, A.; Mavsar, R.; Hodges, D.; Kovač, M.; Juvančič, L. Latent preferences of residents regarding an urban forest recreation setting in Ljubljana, Slovenia. For. Policy Econ. 2015. [Google Scholar] [CrossRef]
  50. Walker, S.E.; Duffield, B.S. Urban parks and open spaces: An overview. Landsc. Res. 1983, 8, 2–12. [Google Scholar] [CrossRef]
  51. Tyrvainen, L. Economic valuation of urban forest benefits in finland. J. Environ. Manag. 2001, 62, 75–92. [Google Scholar] [CrossRef] [PubMed]
  52. Lorenzo, A.B.; Blanche, C.A.; Qi, Y.; Quidry, M.M. Assessing residents willingness to pay to preserve the community urban forest: A small-city case study. J. Arboric. 2000, 26, 319–325. [Google Scholar]
  53. Glaesener, M.-L.; Caruso, G. Neighborhood green and services diversity effects on land prices: Evidence from a multilevel hedonic analysis in Luxembourg. Landsc. Urban Plan. 2015, 143, 100–111. [Google Scholar] [CrossRef]
Figure 1. Location of study area, Phnom Penh. There are 12 districts (khans), 96 communes (sangkats), and 909 villages in 2013 with total area of 678.47 km2.
Sustainability 08 00523 g001
Table 1. Social profile of respondents of Phnom Penh.
NMedianMeanSD
MFTotal (%)
genderM (male)254 254 (45.8)2.01.540.499
F (female) 300300 (54.2)
age≤18202 (0.4)2.02.300.501
19–24143248391 (70.7)
25–3410150151 (27.3)
≥35729 (1.6)
education attainmentOthers6713 (2.3)2.03.970.256
Higher education248293541 (97.7)
employmentSelf-employment6410 (1.8)4.03.600.705
Employed in public sector231841 (7.4)
Employed in private sector5651107 (19.4)
Student168226394 (71.4)
Unemployment000
income level≤100$/m77137214 (38.7)2.01.870.790
101–350$/m90109199 (36.0)
≥351$/m8753140 (5.3)
Table 2. Basic knowledge of residents of Phnom Penh toward ecological services of urban green spaces (UGS’s).
Ecological Services VariablesRespondent’s Rating
Not Important N (%)Not Sure N (%) Important N (%)Very Important N (%)ValidN (%)Rank aMeanMedianSD
Microclimate services
O2 release9 (1.9)29 (5.2)181 (32.7)335 (60.5)554 (100)14.525.00.673
CO2 sequestration6 (1.1)35 (6.3)196 (35.4)317 (57.2)554 (100)24.495.00.665
lower temperature7 (1.3)25 (4.5)226 (40.8)296 (53.4)554 (100)44.465.00.645
shading14 (2.5)35 (6.5)287 (51.8)218 (39.4)554 (100)104.284.00.693
increase humidity16 (2.9)75 (13.5)320 (57.8)143 (25.8)554 (100)154.174.00.765
wind protection16 (2.9)74 (13.4)262 (47.4)201 (36.3)553 (99.8)114.454.00.636
Group average (%)2.18.244.345.4
Environmental quality and functions services
air pollution absorption5 (0.9)28 (5.1)231(41.7)290 (52.3)554 (100)53.785.00.844
noise abatement43 (7.8)144 (26.0)261(47.1)106 (19.1)554 (100)174.124.00.756
ground water recharge9 (1.6)102 (18.4)257 (46.4)186 (33.6)554 (100)134.284.00.755
flood abatement15 (2.7)57 (10.3)240 (43.3)242 (43.7)554 (100)84.294.00.742
soil erosion prevention15 (2.7)50 (9.0)247 (44.6)242 (43.7)554 (100)84.414.00.768
species conservation14 (2.5)54 (9.7)178 (32.1)308 (55.6)554 (100)34.415.00.768
Group average (%)3.113.142.541.3
Recreations and Public health services
recreational places12 (2.2)47 (8.5)303 (54.7)192 (34.7)554 (100)124.224.00.686
opportunities to contact with nature15 (2.7)61 (11.0)320 (57.8)158 (28.5)554 (100)144.124.00.700
aesthetic enhancement6 (1.1)26 (4.7)252 (45.6)269 (48.6)553 (99.8)64.424.00.635
gathering and networking45 (8.1)77 (13.9)327 (59.0)105 (19.0)554 (100)183.894.00.801
public health improvement9 (1.6)21 (3.8)275 (49.6)249 (44.9)554 (100)74.384.00.640
Group average (%)3.18.453.335.2
Economic services
increase asset value43 (7.8)137 (24.7)286 (51.6)88 (15.9)554 (100)193.764.00.811
boost small establishments27 (4.9)121 (21.8)286 (51.6)120 (21.7)554 (100)163.904.00.788
Group average (%)6.423.351.618.8
Overall average (%)3.713.347.935.2
a Rank of each service was basically on the percentage of each service in the column of “very important”.
Table 3. Perception of young residents of Phnom Penh (YRPPs) toward current state of UGS’s.
PUGS’s in Phnom Penh aRespondent’s Perception
Ver. PoorPoorNo IdeaGoodEx.MeanMedianSD
N (%)N (%)N (%)N (%)N (%)
Diversity of UGS’s84 (15.2)371 (67.0)56 (10.1)41 (7.4)2 (0.4)2.102.00.744
Percentage of UGS’s44 (7.9) 315 (56.9)37 (6.7)152 (27.5)3 (0.5)2.562.00.999
Rubbish bins29 (5.2)390 (70.4)28 (5.1)99 (17.9)5 (0.9)2.392.00.867
Public toilets52 (9.4)417 (75.3)29 (5.2)55 (9.9)1 (0.2)2.162.00.731
Benches for sitting40 (7.2)253 (45.7)47 (8.5)207 (37.4)7 (1.3)2.802.01.063
Spaces and facilities for kids101 (18.2)245 (44.2)64 (11.6)139 (25.1)5 (0.9)2.462.01.082
Accessible areas for recreations50 (9.0)277 (50.0)36 (6.5)178 (32.1)13 (2.3)2.692.01.087
Spaces for exercises and sports28 (5.1)284 (51.4)62 (11.2)169 (30.6)10 (1.8)2.732.01.011
Parking lot(with parking fees)55 (9.9)371 (67.0)63 (11.4)62 (11.2)3 (0.5)2.262.00.804
Average (%)9.758.78.522.11.0 2.0
a The higher percentage that RPP rated for the “poor” and “very poor”, the worse quality of UGS’s was.
Table 4. The demands of YRPPs for UGS’s.
DUGS in Phnom Penh aRespondent’s Perception
No Need at allSomewhat NeededNo IdeaNeededStr. NeededMeanMedianSD
N (%)N (%)N (%)N (%)N (%)
Each UGS’s shall exist within 5 km in the city4 (0.7)10 (1.8)23 (4.2)191 (34.5)326 (58.8)4.495.00.73
Diversity of vegetation, habitats and playgrounds1 (0.2)5 (0.9)11 (2.0)164 (29.6)373 (67.3)4.635.00.59
Accessible freely for recreational activities1 (0.2)6 (1.1)30 (5.4)235 (42.4)282 (50.9)4.435.00.66
Quality and safety of UGS’s2 (0.4)6 (1.1)25 (4.5)182 (32.9)338 (61.0)4.535.00.67
Average (%)0.381.234.0334.8559.51
Table 5. Correlation between KES, PUGS’s, SoPs, and DUGS.
Variables aCorrelation bCoefficientsANOVA
1234bSE.βtPrr2dfF
DUGS- 2.8540.231 12.3450.0000.3070.094318.83
KES0.295 **- 0.3010.0420.2957.2380.000
PUGS’s−0.087 *−0.064- −0.0990.062−0.066−1.6050.109543
SoPs0.0780.130 **−0.020-0.1280.1130.0471.1340.257
a KES = Basic knowledge of YRPPs on ecological service, PUGS’s = perception of YRPPs on the current state of urban green spaces, SoPs = social profile of respondents, DUGS = demand of YRPPs for urban green spaces. b * p-value < 0.05 was significant, ** p < 0.001 was significant.

