Article

A Balanced Scorecard of Sustainable Management in the Taiwanese Bicycle Industry: Development of Performance Indicators and Importance Analysis

1
Institute of Engineering Science and Technology, National Kaohsiung First University of Science and Technology, Kaohsiung City 824, Taiwan
2
Department of Modern Languages, National Pingtung University of Science and Technology, Pingtung 912, Taiwan
3
Graduate Institute of Technological and Vocational Education, National Pingtung University of Science and Technology, Pingtung 912, Taiwan
*
Author to whom correspondence should be addressed.
Sustainability 2016, 8(6), 518; https://doi.org/10.3390/su8060518
Submission received: 5 February 2016 / Revised: 21 May 2016 / Accepted: 25 May 2016 / Published: 28 May 2016
(This article belongs to the Special Issue Sustainable Business Models)

Abstract

:
The main purpose of this study is to investigate the development of the performance indicators of sustainable management in the Taiwanese bicycle industry and to perform an importance analysis. Based on the Balanced Scorecard concept, the framework of sustainable management is added. Ten experts evaluated the performance indicators of a sustainable Balanced Scorecard in the Taiwanese bicycle industry using five major categories: (1) Financial, (2) Customer, (3) Internal Business Processes, (4) Learning and Growth, and (5) Sustainable Development, and a total of 21 performance indicators were used. The analytic network process (ANP) was used to perform an importance analysis of the various performance indicators. Most of the experts suggested that for the introduction of a sustainable management strategy into the bicycle industry in Taiwan, it is necessary to include the definition of sustainable management and to improve five performance indicators: innovation process, customer satisfaction, operations process, after-sales service, and market share. According to the analysis results, this study proposed relevant management definitions and suggestions to be used as important references for decision-makers to understand the introduction of sustainable management strategies to the current bicycle industry in Taiwan.

1. Introduction

In today’s complex and changing business environment, enterprises must carefully develop their business strategies to gain a competitive advantage over the long term. Therefore, how to plan and formulate strategies for enterprises plays a decisive role. With the development of environmental awareness and sustainability, market value is no longer dominated by a single performance indicator; instead, the triple bottom line (TBL) framework integrates economic, environmental, and social performance [1,2]. It has become an international focus to actively implement environmental protection and social responsibility. Therefore, the implementation of a new strategy in response to this trend is necessary for enterprises to remain competitive. Additionally, the issue of how to effectively integrate existing and future strategies to enhance competitiveness is an important issue that enterprises must consider.
Taiwan is known as the “Bicycle Kingdom” due to excellent manufacturing technology, successful market segmentation, and high profitability [3]. The current trends of global warming, environmental consciousness, sports and leisure activities, and high international oil prices are beneficial to the development of the bicycle industry. In view of these considerations, if the Taiwanese bicycle industry can conform to current environmental concerns, actively apply a sustainable business strategy, and maintain business leaders who assume industry responsibility, then the international image of Taiwan-made bicycles and industrial competitiveness would be enhanced.
Based on the Balanced Scorecard concept, this study includes the definition of sustainable management to develop performance indicators of a sustainable Balanced Scorecard for the bicycle industry. This study uses the characteristics of the ANP to perform an importance analysis of the priority of the various performance indicators in the bicycle industry. In addition, the study is intended to help decision-makers understand the focus of the introduction of a sustainable management strategy. Specifically, the research objectives concerning a sustainable Balanced Scorecard for the bicycle industry of Taiwan are as follows:
(1)
to develop performance indicators;
(2)
to investigate the importance analysis of the performance indicators;
(3)
to summarize the management definition of the importance of the performance indicators.

2. Literature Review

The trends in sustainable management strategy will be reviewed and the application of a Balanced Scorecard will be discussed. The bicycle industry’s current status and sustainability issues will be examined, and the application of the ANP will be illustrated.

2.1. Sustainable Management Strategy

The Report of the World Commission on Environment and Development states that humankind now faces economic, social, and environmental threats. Human beings must have the ability to continue to develop and to meet their actual needs, but humanity should not jeopardize the wellbeing of the next generation. This can be accomplished by applying the concepts of fairness, sustainability, and commonality [4]. However, the general measure of business performance can be broadly divided into three dimensions: financial performance, business performance, and organizational performance [5]. As the environment changes, companies should not pursue profit maximization as their primary goal; efforts should be made to meet the public’s expectations of businesses, to enhance the corporate image, and to practice sustainable management [6]. To the stakeholders (consumers, shareholders, employees, communities, suppliers, and governments), organizations have a duty to maximize their positive impacts while minimizing the negative ones. Studies have suggested that in the future a multinational corporation will need to comply with more than 60 different environmental and societal norms [7]. Issues related to social aspects are gradually taken seriously. Many companies have been engaged in social responsibility and social welfare to strengthen their performance in terms of these social aspects. Moreover, the evaluation of business performance has gradually transformed into the triple bottom line framework, which consists of economic, environmental, and social performance [1,2]. The triple bottom line includes a financial baseline, an environmental baseline, and a social baseline. The financial baseline refers to a company’s financial benefits, as shown by its financial report. The environmental baseline focuses on a company’s performance in terms of sustainable management, which requires that the company not damage the sustainability of natural capital. Related environmental indicators include compliance with environmental laws and standards, environmental management systems, energy use, waste disposal, recycling, and the use of eco-technology. The social baseline focuses on social capital and the maintenance and development of human capital. Social capital includes the mutual trust between members of society and the co-operative relationship. Human capital includes staff education, investment in health and nutrition, and an emphasis on labor rights. Businesses can participate in meaningful work, such as the protection of human rights, the abolition of child labor, the protection of labor and women’s rights, social care, education, and health care [8,9].

2.2. The Application of the Balanced Scorecard

The Balanced Scorecard (BSC) was developed by a one-year research project funded by the U.S. management consultancy firm Nolan, Norton & Co. (acquired by KPMG) in 1990 [10]. The program was created by David Norton, of Nolan–Norton, and Robert Kaplan, a Harvard University professor. The program aimed to explore “the future overall performance evaluation system of the organization”. The strategy performance measurement system covered four dimensions: Financial, Customer, Internal Processes, and Learning and Growth; it is now known as the Balanced Scorecard [11,12,13]. The application of the Balanced Scorecard is widely employed. In response to different organizational patterns, characteristics, and life cycles, there are different focal points, including balanced financial and non-financial indexes, balanced internal and external composing factors, balanced lead–lag relationships of information, and balanced short-term performance and long-term value [14,15]. For example, there are benefits to linking activity-based costing regarding gross profit with the Balanced Scorecard after the Balanced Scorecard has been implemented [12]. Fletcher and Smith [16] discuss how, by integrating the analytic hierarchy process technique with the Balanced Scorecard, performance indicators can be established to objectively assess the performance of enterprises. In addition, the Balanced Scorecard can also be utilized in evaluating the performance of suppliers, particularly when choosing them [17,18]. The four dimensions are explained as follows.

(1) Financial perspective

The financial perspective is the ultimate goal of the four dimensions of the Balanced Scorecard; it represents the financial performance of its operations [11]. It is primarily the intersection between the interests of the shareholders and the financial impact of strategic objectives [19]. For most businesses, it is nothing more than the pursuit of revenue growth, increasing productivity, cost reduction, financial risk management, and other issues [10].

(2) Customer perspective

The customer perspective primarily concerns how the company can create major core values to the customer through policy and action [19]. The customer and market segments in which a business unit competes and the measures of the business unit’s performance in these targeted segments are sources of revenue for the company to achieve its financial goals. [12]. The customer perspective can be categorized into market share, customer acquisition, customer retention, customer satisfaction, and customer profitability. Companies must amend the target based on the customers who will generate the most expected profit and the greatest potential for revenue growth.

(3) Internal business process perspective

The main difference between the Balanced Scorecard setting goals and traditional performance measurement systems is the inclusion of the internal business process. Kaplan and Norton state that before designing the internal processes of the measurable performance indicators, the business value chain should be analyzed. Based on the innovation process, the operation process, and post-sales service, the internal processes can be implemented such that customer needs are met in an optimal manner [20]. The beginning of the value chain of the internal business process perspective is the innovation process, which clarifies the current and future customer needs. New products are developed to meet and create customer needs. Next, the operation process focuses on providing products and services to existing customers. Finally, the post-sales service process, which includes defective products and returns, is accounted for.

(4) Learning and growth perspective

The Learning and Growth perspective is about how to improve the competitiveness of the organization and its human resources to accept the challenges to be faced in the future [19]. This perspective has three major core objectives—employee capabilities; information system capabilities; and motivation, empowerment, and alignment. The financial, customer, and internal business process perspectives of the Balanced Scorecard reveal gaps between the desired and actual ability of employees, systems, and procedures. To narrow these gaps, companies must invest to advance staff skills, strengthen information technology systems, and adjust organizational procedures and daily operations so that employee satisfaction is enhanced, and staff retention rates and employee productivity are maximized [11].
In summary, based on the structure of the Balanced Scorecard, there are implications for balancing the external metrics, such as stakeholders and customers, with the key internal metrics, such as internal processes, innovation and learning, and growth [21,22]. Because the Balanced Scorecard is an open system, when the interests of all stakeholders and institutions succeed as part of an integral strategy, these interests can be integrated into it [20]. Therefore, this study is based on the original structure of the Balanced Scorecard and therefore integrates the environmental and social perspectives to form new perspectives in order to achieve economic, social, and environmental objectives that also provide the possibility of sustainable development [21,23,24].

2.3. Current Status of the Bicycle Industry

The bicycle industry in Taiwan has been developing for the last 50 years. The foundation of the its industrial development was previous domestic transportation and loading operations. From 1971 to 1974, the bicycle industry in Taiwan has helped foreign manufacturers earn gross profits in the form of large ODM orders. Hence, a superb manufacturing technology and a supply chain network consisting of many small and medium enterprises has been developed [25]. With the collaboration of industry, government, academia, and research, the bicycle industry in Taiwan has moved toward the development of entrepreneurial firms. The title “Superior Bicycle Kingdom” was won by focusing on advancing quality and establishing domestic brands [26].
Since 2005, the government has proposed a transportation-industry promotion plan that targets the shaping of an international image of superior bicycles and the production of parts and components in Taiwan. Combined with industry, government, academia, and other research resources, the bicycle industry in Taiwan has been continuously developing new materials and innovative features that incorporate lightweight components, electronics, and ergonomics, as well as meet the demand for good-value and high-grade products [27].
By developing bicycle product design and research and development capabilities, new features of domestic products and the high-tech image have been enhanced. Therefore, the value added and product competitiveness has been increased. New features and new materials have been developed and integrated to create a technological environment able to promote product differentiation with the mainland products. With a leading position in bicycle stores, the bicycle industry in Taiwan has delivered more differentiated and innovative products in the international market [27,28]. The bicycle industry in Taiwan has successfully established a well-known international brand and marketing channels with the collaborative work of the government and private industry, and now strives to transform into an international high-quality research and development center and sales center [3].
In summary, the bicycle industry in Taiwan has gradually transformed from a manufacturing industry into one combined with a service industry. The market segments are targeted with the development of innovative, high-quality bicycle products and services compared with the bicycle industries of other countries. However, the bicycle industry’s business strategy is less refined. Therefore, this study emphasizes that the bicycle industry must respond to the current trend, pay attention to the environment and sustainability issues, and create an excellent image with the superiority of a leading brand. To maintain the competitive advantage of the bicycle industry, a sustainable business strategy involving the image and products of the company must be actively initiated.

2.4. Analytic Network Process (ANP)

The analytic network process is a generalized model of the analytic hierarchy process; both were proposed by Thomas L. Saaty [29]. In recent years, the analytic hierarchy process (AHP) has been widely used in many problems involving system decision-making. This method concerns the division of system levels, considering one-way influence between the hierarchy, and assumes that elements of the same level are individually independent. However, there are many cases involving elements of interdependent and feedback relationships in decision-making problems; AHP cannot incorporate these connections [30]. Bentes, Carneiro, Silva, and Kimura [31] discuss the restrictions of an integration of BSC and AHP in the multidimensional assessment of organizational performance in a Brazilian telecom company. For example, there must be a hierarchical approach among the elements, assuming that there is no interaction between independent elements, or a sensitivity analysis cannot be performed to verify whether results are reasonably stable. Therefore, ANP, proposed by Saaty in 1996, included the characteristics of interdependence and feedback, enabling scholars and experts to apply it to a wide range of issues [32,33]. AHP is actually a special case of ANP; AHP assumes that there is independent influence between the relevant factors of an issue, while ANP assumes that there are mutually influential relations among factors [34]. ANP, like AHP, can reach a consensus of all decision-making through a specific method, but it has a relatively deeper level of consideration compared with AHP. The application of ANP consists of assessing the priority value of each object and establishing an interdependence relationship as well as a network between various objectives and guidelines. Accordingly, ANP not only considers the practical problems with dependent characteristics in programs and guidelines but also possesses a feedback mechanism to handle human society’s real and complex problems [35].
The construction and the steps of implementing the ANP are as follows.

(1) The construction of decision problems system

By investigating the interaction between various criteria, the overall structure of the decision problem network map is constructed. If there is an influence of the criteria on the overall structure, it is an outer dependence; if there is an influence between the sub-criteria involved in each criterion group, it is an inner dependence.

(2) Pairwise comparisons between various groups and guidelines

After the relationship mentioned above is established, groups with dependencies or feedback relationships are pair-wise compared in the AHP methods with a comparison scale from 1 to 9 [36]. Questionnaires to all the experts are arranged as follows: by taking the geometric mean as the input value, the comparison matrices are compiled. Each comparison matrix is required for consistency analysis, and when the consistency ratio (C.R.) ≤0.1, it can be accepted; the paired comparison questionnaires can be considered to be valid questionnaires [37,38]. Then,
C . R . = C . I . / R . I .
where C.I. is the consistency index and R.I. is random inconsistency.

(3) Building a super-matrix

After pairwise comparisons, the vector of each matrix can be calculated. All the vectors included within the matrix form the unweighted super-matrix. The weight of the same element within the unweighted matrix is multiplied by the relating number of community so that all straight fields add up to 1, resulting in the weighted super-matrix.

(4) The super-matrix of limiting calculation of decision problems

To obtain a state of long-term stability, the weighted super-matrix is multiplied by itself repeatedly until convergence, where in each column and field the numbers are equal; this can be expressed as the following limit of the weighted super-matrix:
W lim = lim k ( W w e i g h t e d ) k .

(5) The advantageous arrangement of feasibility plans

According to the various possible solutions and standards between each feature vector in the matrix to obtain the whole feature vector, one can find the best solution.

(6) Sensitivity analysis of the decision problem

The decision problem can be performed through sensitivity analysis to analyze the strength of the overall arrangement. This allows policy makers to see how the results change when a certain input value changes and to observe whether the result is stable after the order is changed. Therefore, policymakers can choose the proposed plan with more confidence.
ANP has a wide range of applications in addition to the use of multi-target and multi-criteria decision-making. It can access and evaluate the relative importance of a number of indicators to determine the most suitable solution and be an important reference for the organization’s resource allocation and policy construction [39,40]. The main purpose of this study is to select the performance indicators of a sustainable strategy for the bicycle industry and to assess the relative importance of performance indicators. The bicycle industry can therefore adopt this model as an important reference for further sustainable decision-making.

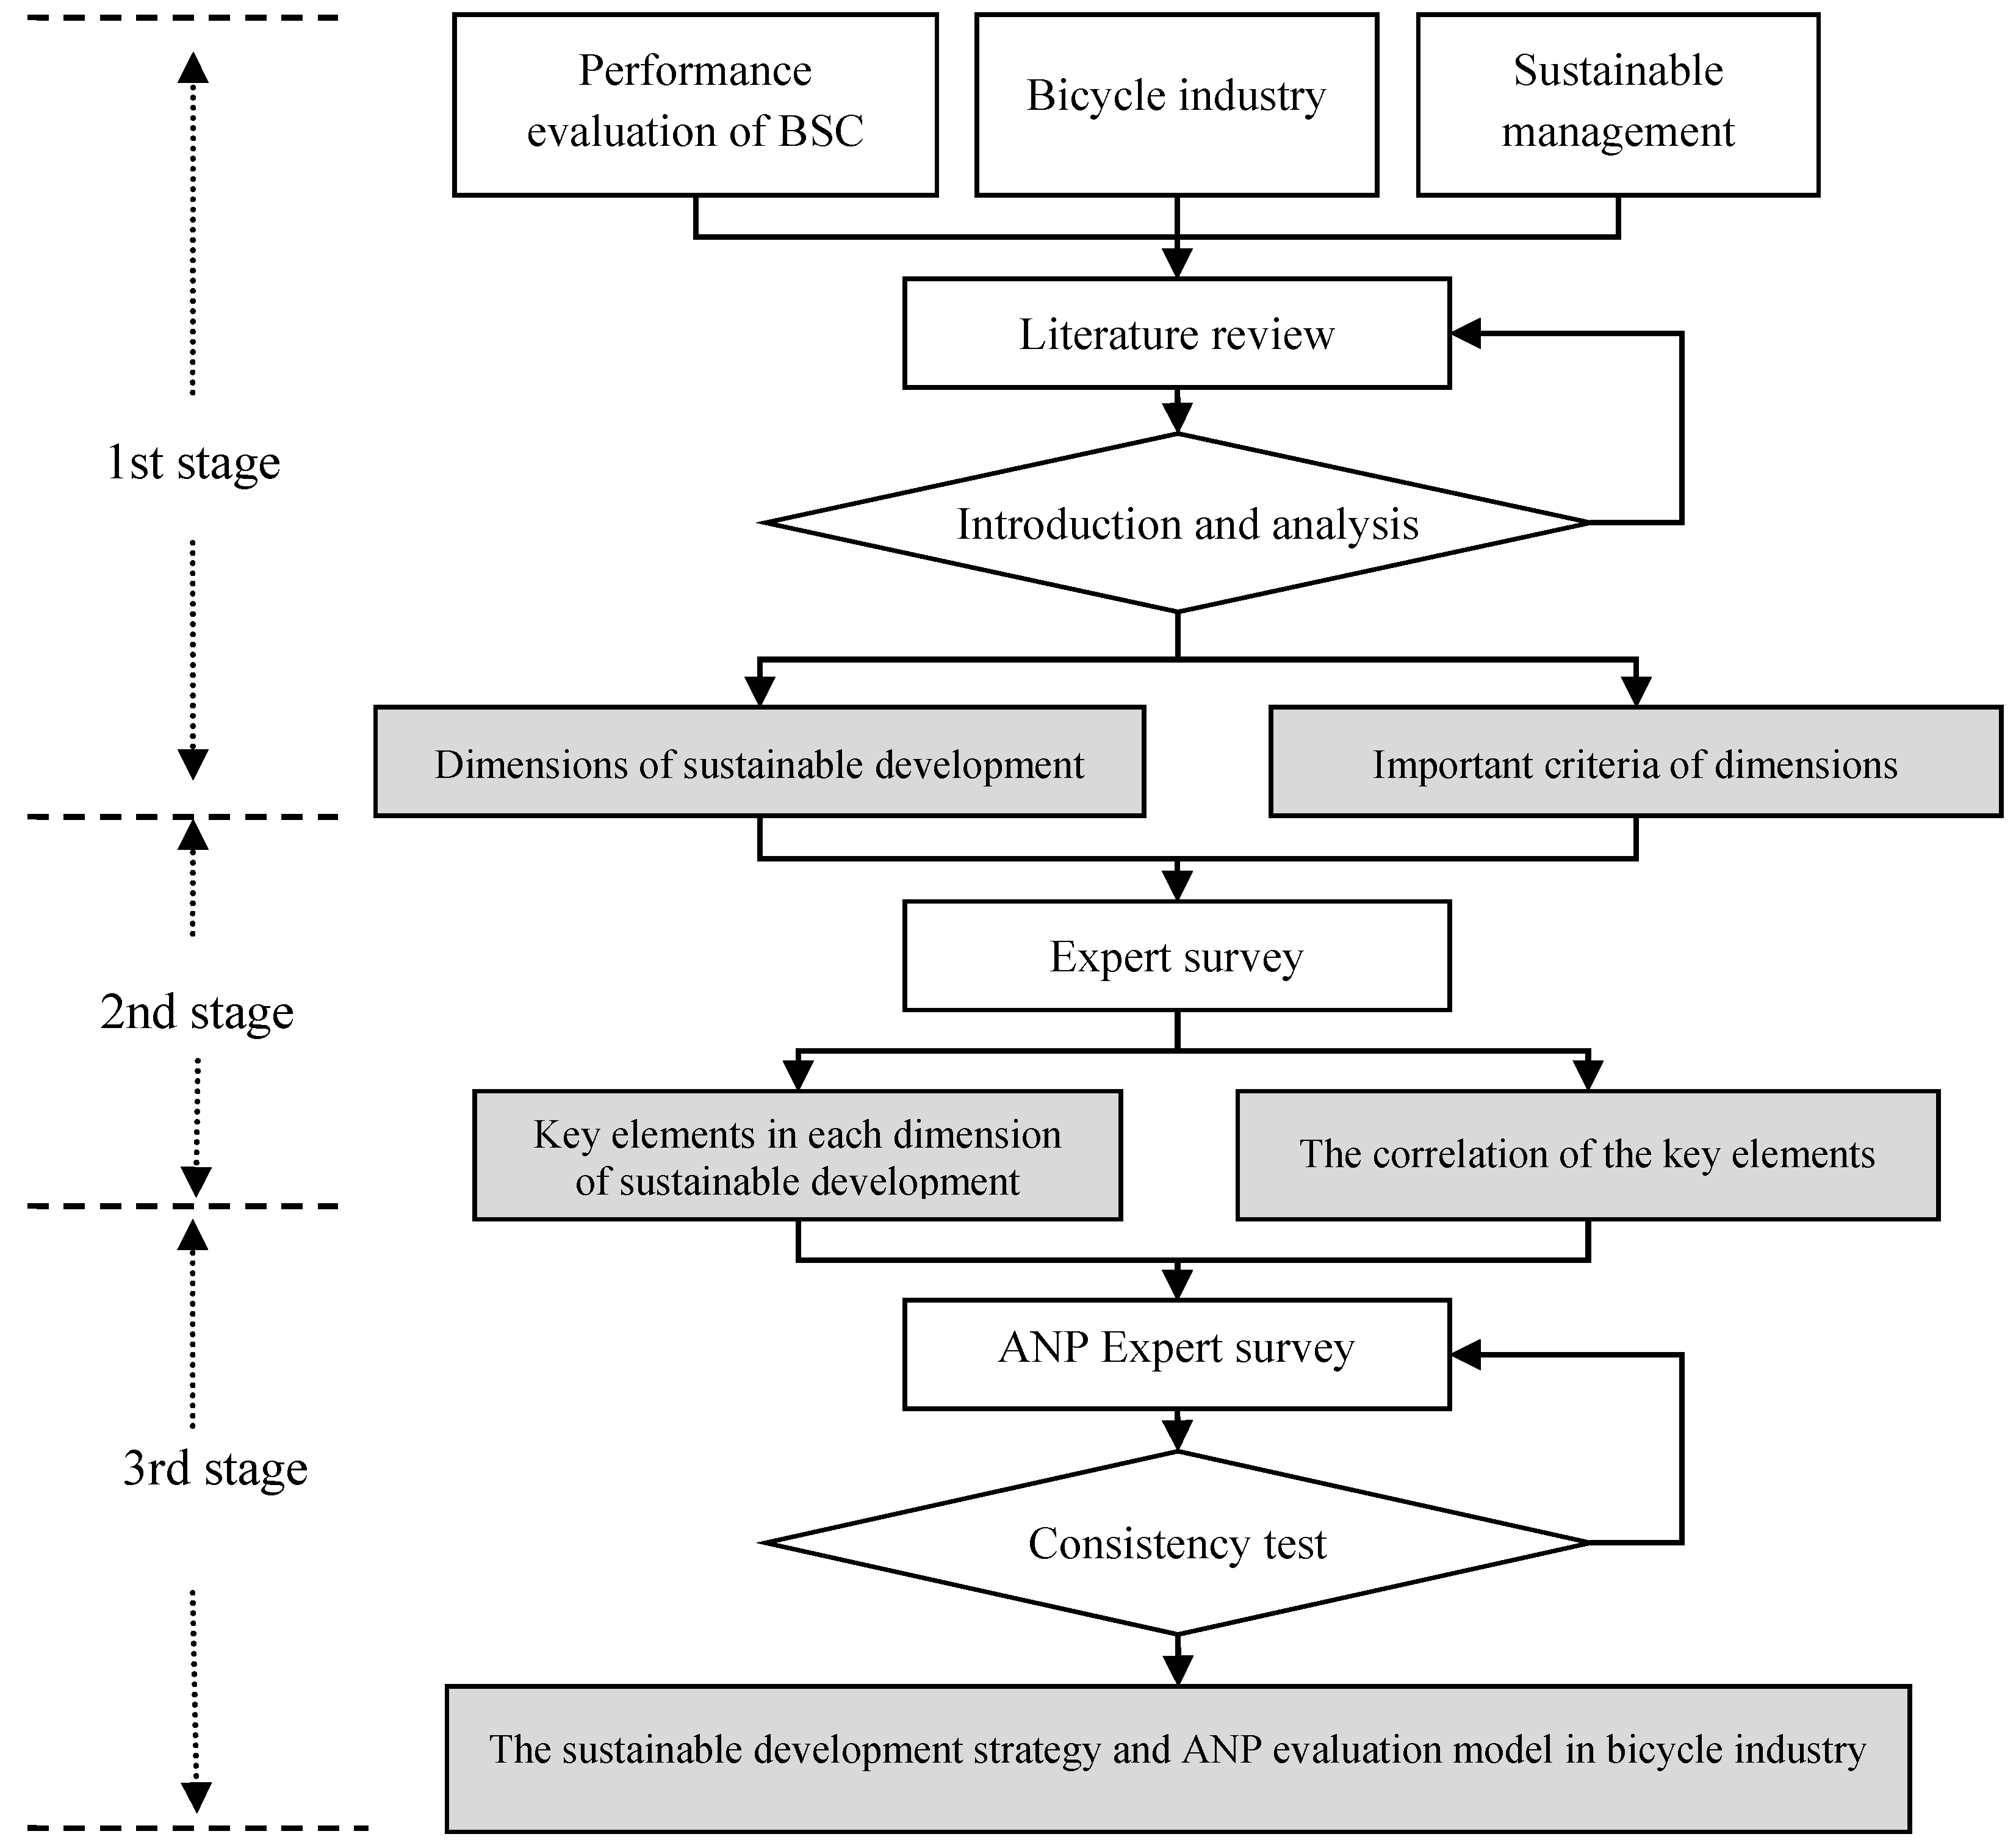
3. Research Design and Methods

This study refers to Incorporating Design Thinking into Sustainable Business Modeling by Lehmann, Bocken, Steingrimsson, and Evans [41] to construct the bicycle sustainable management Balanced Scorecard performance indicators ANP assessment model. By integrating the value mapping tool [42] and different notions and concrete cogitations that focus the design process around the concerns, interests, and values of humans in an iterative and interactive way [43], the interaction design is assembled. This study design is divided into three stages. The detailed process of the study is shown in Figure 1, and the project team work is listed in Table 1.
The first stage is based on the four aspects of the Balanced Scorecard: the analysis of sustainable management and the literature review of the bicycle industry to summarize how the assessment dimensions and criteria can be incorporated into the bicycle industry’s sustainable development strategy. The second stage is to draw on the experience and opinions of experts by using a questionnaire survey of the key elements of sustainable management strategies selected from all facets and important projects and to determine the correlation between the key elements as the basis for constructing the ANP evaluation model. The third stage is to construct the ANP evaluation model and to include analysis of the dependency of the relevance among the criteria. With the analysis of the ANP expert survey results, the relative importance of the key elements emerges to help policy-makers realize the relevance of sustainable management to Taiwan’s bicycle industry.

3.1. Experts Survey

The opinions of experts on research and experience related to the bicycle industry and on sustainable management are assessed by the important criteria as summarized from the literature given importance ratings based on subjective value judgments. To obtain an expert rating for each project, an index of the questionnaire selection model is constructed on a scale of 0 to 1. The closer to 1, the higher importance the item holds. The opinions of industry, government, and academic experts are integrated to yield the analysis topics and construct the key factors in sustainable development in the bicycle industry.

3.2. The Analytic Network Process

This study adds a fifth dimension, the sustainable development aspect, into the traditional Balanced Scorecard. With the application of dependent characteristics of main criteria and sub-criteria among the decision problems of ANP elements, the relative importance criteria of sustainable management strategies and the bicycle industry are assessed by using Super Decisions software to analyze the results of the research. To increase the reliability of the results of the questionnaire analysis, the expert survey needs to be checked with consistency analysis. Those questionnaires that meet the standards are valid, and for those that do not meet the standards, the experts shall make further revisions. Finally, all valid expert questionnaire data are calculated by the geometric average number as a whole ANP expert questionnaire data.

3.3. Target Respondents

The perspective of sustainable management strategy in the bicycle industry is extensive, and there are different views from different angles. Therefore, in selecting target respondents, professional competence of the experts, the familiarity and authority of the study of topics are the considerations of the expert selection. The number of experts should preferably be five to 15 people because error can be reduced to a minimum with a group of at least 10 people, and the reliability is the highest [44]. This study requests 12 experts to participate in the expert survey and ANP questionnaire, with 10 questionnaires of effective recovery; the overall response rate was 83%. The background information of the interviewees is shown in Table 2. Professional fields are bicycle industry management, bicycle R&D, sustainable development, and corporate social responsibility. The target respondents adequately covered the scope of this study and hold at least eight years of experience in teaching or in industry to provide the most comprehensive and professional advice.

4. Research Results and Analysis

According to the research aim and literature review, the results of analysis are to be made using the expert survey and the analytic network process. The analysis results are as follows.

4.1. The Analysis of the Expert Survey

This research is accomplished through a literature review examining how the bicycle industry is introduced to sustainable operation; also considered is the draft of the expert questionnaire design. According to the views and opinions of the industry experts, they amend and delete ambiguous pieces and other unsuitable measure of the effectiveness of sustainable projects in the questionnaire. Finally, four dimensions of the Balanced Scorecard, Financial, Customer, Internal Business Processes, and Learning and Growth, are collated and analyzed. Additionally, the Sustainable Development dimension is integrated as the fifth dimension. Along with 27 important projects, the five dimensions are incorporated into the expert questionnaire design and survey, and the score is calculated by the geometric mean (M value).

4.1.1. Selection of Key Elements of Sustainable Development

In this study, the result scores of 27 important projects under five dimensions are analyzed, as shown in Table 3. CS and LR have the highest score (0.864), followed by innovation processes, restructuring on employees’ expertise, and industrial safety and health (0.826); productivity, cost management, customers’ continuation rate, and employees’ ability are in third place (0.792). The quartile scores of the 27 major projects are regarded as the basis of retention or deletion for sustainable management strategies. Six projects having a lower score than Q1 (Q1 = 0.706) were deleted after a careful assessment. Therefore, by the collection of the expert questionnaire, 21 key projects are selected in the study.

4.1.2. The Correlation Analysis of Key Elements of Sustainable Development

Experts were invited to evaluate the relationship of mutual influence among various performance indicators, which were scored according to the level of correlation, as shown in Table 4. Statistical analyses was performed on the evaluation results of correlation of performance indicators. If the mean was ≥3 and reached significant difference, there was a significant correlation between two performance indicators. The key project-related outcomes are as shown in Appendix A. Each facet of the key items is deemed as a relevant necessity in this study; for example, the key dimensions of Financial perspective, 1-1, 1-2, and 1-4, serve as a key project as the pairwise comparison of essential items in the ANP internal dependencies, which produce 21 comparison matrices. The external dependency of key projects between dimensions is regarded as the expert selection results. For instance, in the Financial performance, key item 1-1 is connected with 2-3, is associated with 3-1 and 3-2, is related to 4-1, 4-3, and 4-5, and is associated with 5-3. Therefore, in the ANP analysis stage, the project must be considered based on key 1-1 and should carry out pairwise comparison of key 3-1 and 3-2; 4-1, 4-3, and 4-5. As for 2-3 and 5-3, due to the dimension with only one key project associated with 1-1, there is no need for comparison. According to the external dependency of performance indicators of dimensions, 63 pairs of comparison matrices were generated.
Based on the above considerations, the experts evaluated the correlation of internal and external dependency of a total of 21 performance indicators in five major categories, and 84 pairs of comparison matrices were generated. These were used as the basis to develop the ANP evaluation model of introduction of Balanced Scorecard of sustainable management into the bicycle industry.

4.2. The Analysis of Analytic Network Process (ANP) Expert Questionnaires

Expert questionnaires are utilized to assess the key projects of the bicycle industry adaptation to the sustainable management strategies, including 27 important projects under five dimensions, and their relevance, to construct the ANP evaluation model. Statistics and analyses are performed by the use of expert questionnaires and Super Decisions software. The results are as follows.

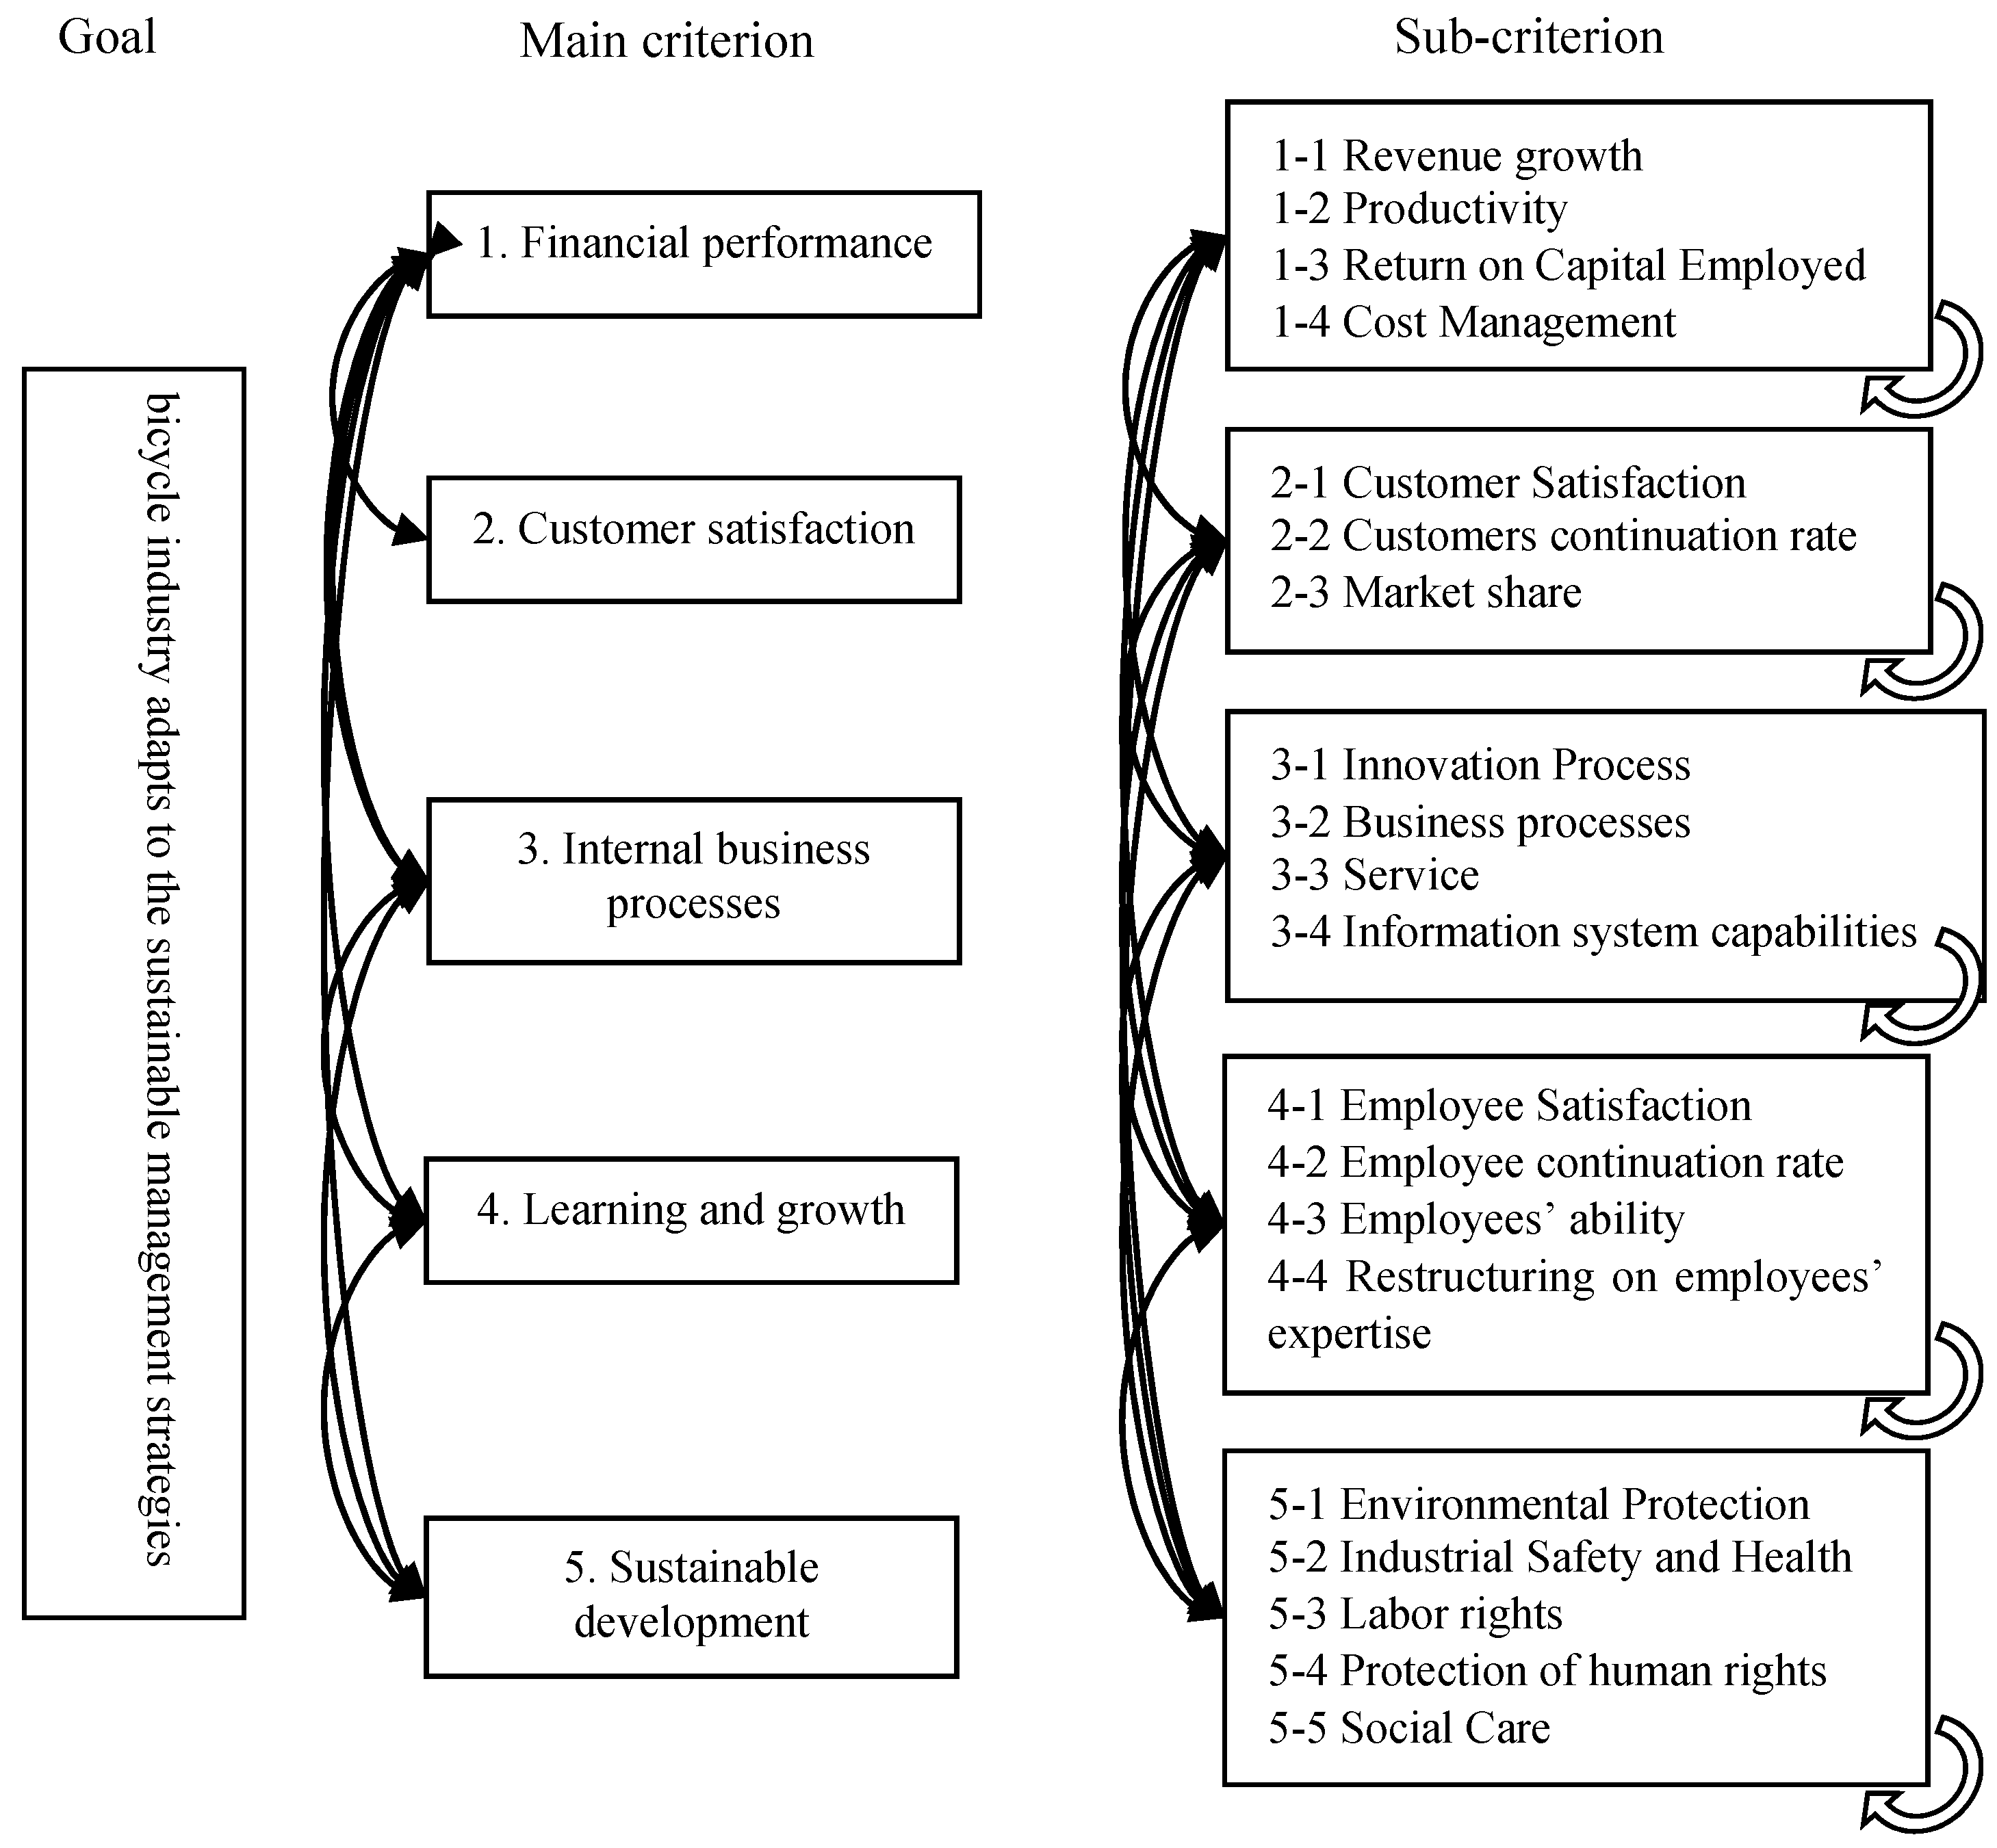
4.2.1. The Construction of the ANP Evaluation Model

The ANP evaluation model was established; the goal of decision-making is the bicycle industry’s adaptation to sustainable management strategies. The five dimensions of the impact to achieve the target are regarded as the main criteria in the ANP: Financial, Customer, Internal Business Processes, Learning and Growth, and Sustainable Development. These five main criteria have a relationship of interdependence and influence. Under each main criterion, 21 sub-criteria are included; these are key projects that are selected through expert questionnaires, as shown in Figure 2. Between each sub-criterion, the relationship of interdependence and influence are defined according to expert opinions.

4.2.2. Paired Comparison and Consistency Test

Based on the results of the ANP expert questionnaires, this study is examined for consistency with the advice of every expert included. Valid questionnaires are calculated with the use of the geometric mean to find the average. After the integration with the comparison matrix is obtained, the expert overall consistency test then followed. This study used Super Decisions software to obtain the weight and CI value of various matrices. The analysis results showed that the C.I. value of all the matrices was ≤0.1, suggesting that there was a certain amount of consistency in paired comparisons obtained after experts’ preference integration. The weights of various matrices were also highly reliable [36].
The eigenvectors obtained from various matrices were integrated to obtain the initial super-matrix assessed from the introduction of the sustainable management model into the bicycle industry; the unweighted super-matrix is shown in Appendix B. Because the unweighted super-matrix is composed of many paired comparison matrices, it is random. In other words, the total eigenvector of each row is not equal to 1. Therefore, it is necessary to adjust the unweighted super-matrix to conform to the basic principle of randomization of ANP theory.
In terms of the adjustment method, this study aligned the matrix of relative weights of various dimensions under the influence of various evaluation dimensions to obtain the complete cluster matrix, as shown in Table 5. Then, the cluster matrix was multiplied by the unweighted super-matrix to make the total of each row become 1 and form the weighted super-matrix, as shown in Appendix C. According to ANP theory, the continuous squaring of the weighted super-matrix can obtain a convergent extreme super-matrix, as shown in Table 6. At the same time, the weight of each indicator will be close to a fixed value. The final results of priority of importance of performance indicators obtained using the ANP and the analyses are summarized in the table.

4.3. Analysis of the Relative Importance of Each Criterion Adapting to Sustainable Business Strategy

In addition, the key projects that further affect the bicycle industry adaptation to the sustainable management strategies are prioritized; both the analysis of the various dimensions of the main criteria and the overall analysis are clarified in detail.

4.3.1. Individual Analysis of Dimensions of the Main Criteria

As shown in Table 6, under the dimensions of the main criteria, the relative importance of sub-criteria is described below.
(1)
Under the “Financial” main criterion, 1-3 “Return on Capital Employed” features the highest eigenvectors (0.062); 1-2 “productivity” followed (0.039). This shows that to improve financial performance of sustainable development, promoting the use of return on capital employed and productivity must be addressed.
(2)
Under the “Customer” main criterion, 2-1 “Customer Satisfaction” features the highest eigenvectors (0.095), 2-3 "market share" followed (0.075). This shows that to improve customer satisfaction in sustainable management, sustainable concepts must meet customer requirements to advance customer satisfaction and market share.
(3)
Under the “Internal Business Processes” main criterion, 3-1 “innovation process” features the highest eigenvectors (0.106), 3-2 “business processes” followed (0.080). This shows that internal processes under sustainable management must focus on changing the process of innovation and the nature of the enterprise, and then be implemented in the company's internal operational processes.
(4)
Under the “Learning and Growth” main criterion, 4-1 “employee satisfaction” features the highest eigenvectors (0.055), 4-5 “incentives and authorization” followed (0.046). This shows that Learning and Growth of enterprises under sustainable management must address employee satisfaction and emphasize employee incentives and sufficient authorization to improve the efficiency of learning and growth of the organization.
(5)
Under the “sustainable development” main criterion, 5-2 “industrial safety and health” features the highest eigenvectors (0.042), followed by 5-1 “environmental protection” (0.039). The results show that under a sustainable management strategy, it is necessary to attach importance to the internal industrial safety and health of the company and to significantly reduce the use of various hazardous substances and energies, as well as to make products that are approved by various international green standard certifications, such as the IECQ QC 080000 hazardous substance management system standard, or the EU CE Marking to achieve the objectives of environmental protection and social care.
In summary, the application of ANP carries out an overall assessment to be more rational and more suitable for the company to determine the results [32]. When faced with the pressure of the international trend of sustainability, the Taiwanese bicycle industry has to adopt aggressive sustainable strategies, set up objectives as countermeasures, and use ANP to understand the importance of various indictors in various dimensions. In this way, the said information can be used as the basis for determining the priorities under limited resources in the organization. In addition, it can also be used to measure relative weights of company performance. Therefore, the bicycle industry can focus on the direction of execution of sustainable management strategies and assess the performance of execution of strategies to further improve strategy effectiveness.

4.3.2. Overall Analysis

From the overall analysis, most of the experts believe that the top five sub-criteria adapting to sustainable business strategy are innovation process (0.106), Customer Satisfaction (0.095), business processes (0.080), service (0.074), and market share (0.063), as shown in Table 6. The results show that to effectively achieve the overall effectiveness of the adaptation to sustainable management strategies, it is necessary to strengthen the application of the innovation process and the supply chain relationships, and mutual trust must be established with long-term interaction and cooperation [28]. Additionally, providing products to meet customer satisfaction is critical. For example, with the same products, there is now environmental consciousness in customers’ choices, and they tend to buy products with eco-labels. Meanwhile, business processes within the enterprise must be implemented; otherwise, the effectiveness of the adaptation of sustainable management strategies will be greatly reduced [45]. Additionally, companies must plan sustainable services to meet customers’ requirements for sustainable development, to increase market share, and to accomplish the goal of sustainable business strategies and benefits.
What is more, there is the added new dimension of the sustainability Balanced Scorecard—sustainable development, the five sub-criteria of which do not receive a higher rating from experts. They are: industrial safety and health (0.042), environmental protection (0.039), labor rights (0.032), social care (0.031), and protection of human rights (0.021). Nevertheless, they should be taken into account. According to Thomas Saaty, even the smallest factors, as long as they will have an effect, need to be included in the structure [38]. The results of this study show that most experts believe sustainable development strategy must be adapted from the comprehensive nature of system processes of the enterprise, rather than unilateral emphasis and promotion on individual indicators to achieve the overall effect.
Based on the above, this study used the characteristics of ANP to determine the priority of weights of each sub-criterion and reflect the current trend of sustainable issues of the bicycle industry in Taiwan. This study clarifies that with the adaptation of sustainable business strategies, it is also important to focus on the transformation of the company's internal systems. Under the premise of sustainable business strategies, innovative approaches are taken to improve enterprise business processes and to improve customer satisfaction and thus to achieve the goal of sustainable development [3,27].

5. Conclusions and Recommendations

In accordance with the purposes of this study, research and analysis are conducted; the conclusions, managerial implications, and suggestions are as follows.

5.1. Conclusions and Managerial Implications

(1)
This study attempted to adjust and modify the traditional Balanced Scorecard framework and used an expert questionnaire to confirm that the introduction of sustainable management strategy into the bicycle industry should be from five major categories: Financial, Customer, Internal Business Processes, Learning and Growth, and Sustainable Development. With selection via a filtering mechanism, the five dimensions contain a total of 21 key projects. The results of the questionnaire show that the evaluations of the experts are highly consistent. On the managerial implications, these five dimensions can be regarded as the core of the bicycle industry’s adaptation to sustainable management strategies, and according to the 21 key projects, the performance indicators are set correspondingly to measure the effectiveness of the adaptation of sustainable management strategies.
(2)
From prioritizing key projects of various dimensions in the bicycle industry adaptation to sustainable management strategies, it is known that companies must focus on promoting the return on capital employed and productivity to improve financial performance. By achieving customer requirements for sustainable development, customer satisfaction and market share can be enhanced. The company must also focus on changing the process of innovation and the nature of enterprise, implemented in the company’s internal operational processes. Furthermore, companies must pay attention to employee satisfaction and give emphasis to employee incentives and sufficient authorization to improve the efficiency of learning and growth of the organization. The company must start with industrial health and safety within and then broaden outward to the relevant interested parties to achieve the purposes of environmental protection and social care. In terms of managerial implications, the company can apply ANP to conduct the assessment on various dimensions, to obtain results that are more rational and more in line with the company’s features. By confirming the relative importance of the various indicators as the performance measure in strategy implementation, the strategic direction of the company can be focused to enhance the effectiveness of the company’s strategy execution.
(3)
From the overall analysis of the bicycle industry adaptation to sustainable management strategies, the three key factors are innovation process, customer satisfaction, and business processes. The Taiwanese bicycle industry has responded to global sustainable environmental consciousness, as well as the highly competitive international business. To achieve the goal of sustainable development, the enterprise itself must have the forces of innovation and of research and development and be able to grow with trends and to create advantages. The company must also effectively take hold of the changing needs of customers and improve customer satisfaction. Moreover, when the industry adapts to the sustainable management strategies, the main point of implementation is to change the nature of the corporate business processes. As to managerial implications, if Taiwan’s bicycle industry wants to possess a competitive advantage on the global stage, the results of this study should be heeded. Innovation process, customer satisfaction, and business processes must be emphasized to conform to the trend of the times and the environment. Innovative force must be restored in preparation for sustainable management strategies and to enable the brand leading the industry to grow.

5.2. Limitations of the Study and Recommendations

This study analyzes the assessment model of the bicycle industry’s adaptation to sustainable management strategies, giving the practical applications to industry as well as directions for future research. The recommendations are as follows.

(1) Practical application to industry

This study analyzes and assesses only those strategies for the sustainable management of the bicycle industry; hence, the conclusions are not suitable to explain other industries. It is suggested that decision-makers from the bicycle industry can benefit from the results of this research, which are the Balanced Scorecard of sustainable management, the five facets, and a total of 21 performance indicators. They must merge and implement these tools with the company's sustainable management strategy. Additionally, performance evaluation is suggested to realize the current situation of the company as a basis for subsequent improvement.
Furthermore, the sustainable management BSC ANP assessment process in this study can also be referred to, to cope with external environmental factors and the company’s attributes, as well as to reexamine and assess from a holistic perspective. By using ANP assessment to inspect the importance of each performance indicator and analyze its connotations for management wishing to create a concrete and feasible action plan, the implementation of performance indicators and the goal of sustainable development can be achieved.

(2) Future research

This study is primarily related to the bicycle industry; therefore, the conclusions give priority to the bicycle industry’s sustainable development. Future research could incorporate the customer views into the bicycle industry to form the basis of strategic planning. In addition, the Balanced Scorecard of sustainable management mainly takes the entire bicycle industry as the research object to provide strategies of sustainable development. Follow-up studies could address individual bicycle businesses as a case study. Based on the attributes of the company, sustainable business performance assessment tools can be facilitated to design a more complete and detailed measure, and the performance of sustainable development strategy can be introduced to businesses so that they can perform quantitative analysis. In addition, in the current generation of shorter product life cycles, it is recommended to conduct a one-year period of dynamic monitoring.
The Balanced Scorecard assessment process proposed in this study can be taken into account for the assessment of future development in the bicycle industry, to manage the dynamics of the bicycle industry and therefore determine a company’s business direction. Additionally, the bicycle industry trends and the status performance of the company can be compared to understand a company's advantages, disadvantages, and opportunities to better facilitate and make the most effective use of limited resources.

Acknowledgments

The authors would like to thank the reviewers for their thoughtful review and valuable comments.

Author Contributions

Shi-Jer Lou and Li-Chung Chao conceived and designed the experiments; Chih-Chao Chung and Shi-Jer Lou performed the experiments; Chih-Chao Chung and Chih-hong Chen analyzed the data; Chih-Chao Chung and Li-Chung Chao contributed reagents/ materials/ analysis tools; Chih-Chao Chung and Chih-hong Chen wrote the paper.

Conflicts of Interest

The authors declare no conflict of interest.

Appendix A

Table A1. Key interrelated projects for the bicycle industry’s adaptation to sustainable management strategies.
No.Key Projects1-11-21-31-42-12-22-33-13-23-33-44-14-24-34-44-55-15-25-35-45-5Comparison Matrix between Dimensions
1-1RG VVV VVV V V V V 3
1-2PDV VV VV V V V VV 4
1-3RCEVV VV V VV VV VVVVVV5
1-4CMVVV V VVV V V 4
2-1CS VV VVV VVV V VVV VV5
2-2CCR V VV V V V VV VV4
2-3MS VV V V V V3
3-1IP V VV V VVVV VVVV V5
3-2BP VVVV VV VVV V VVV V5
3-3SV VVVV VV VV V VV V 5
3-4ISC VVV VVV V VV 3
4-1ESV V V VVV VVVVVVVVV5
4-2ECR VV V VVV VV 3
4-3EA VV VV VV VV 3
4-4REE V VV VVV V VV 3
4-5IA VV VV VVVVV VV V4
5-1EPV V V VV V VVVV4
5-2ISH VV VV VV V VVV4
5-3LR V V VVV VV V VV VV4
5-4PHR V VVVV V VV V VVV V4
5-5SC VVV VV V VVVV 4
Total 84
Note: ”V” means most experts identified a mutual influence between sub-criteria relationships.

Appendix B

Table A2. Unweighted super-matrix.
Criteria1. Financial2. Customer3. Internal Business Processes4. Learning and Growth5. Sustainable Development
Sub-Criteria1-11-21-31-42-12-22-33-13-23-33-44-14-24-34-44-55-15-25-35-45-5
1.1-1 RG0 0.3360.3340.3120 0 00 0 0 0 0.5210 0 0 0 0.496 0 0 0 0
1-2 PD0.3480 0.3180.3650.5040 0 0.5080.3430 0 0 0 0 0 0.5090 0.5050 0 0
1-3 RCE0.3120.3060 0.3230.4960 0 0 0.3150.4820.4780.4790 0 1.0000.4910.5040.4951.0001.0000.502
1-4 CM0.3400.3580.3480 0 0 0 0.4920.3410.5180.5220 0 0 0 0 0 0 0 0 0.498
2.2-1 CS0 0 0.5080.5120 0.5400.5070.5310.5150.5121.0000.5150 0 0 0 0.5240 0.5280.3870.513
2-2 CCR0 0 0 0 0.5100 0.4930 0 0.4880 0 0 0 0 0 0 0 0 0.3310
2-3 MS1.0000 0.4920.4880.4900.4600 0.4690.4850 0 0.4850 0 0 0 0.4760 0.4720.2820.487
3.3-1 IP0.5230.4900 0.5200.3350.4850.4780 0.3500.3150.3270.4790.4860.4900.5100.3070.5300.4930.5030.4760.511
3-2 BP0.4770.5100.4790.4800 0 0 0.3650 0.3470.3490.5210.5140.5100.4900.3570 0.5070.4970 0
3-3 SV000.52100.3660.5150.5220.3280.3310 0.3240 0 0 0 0 0 0 0 0.5240.489
3-4 ISC000 00.3000 0 0.3070.3190.3380 0 0 0 0 0.3370.4700 0 0 0
4.4-1 ES0.3400.3090.33200.3400.4870 0.3240.3270.3400 0 0.2730.2460.2570.2510 0.5240.3520.3670
4-2 ECR00 0.33700 0 0 0 0 0 0 0.2600 0.2460.2510.2470 0.4760.3340.3470
4-3 EA0.3390.3660 0.5230.3520 0 0 0.3480.3350.5000.2780.2660 0.2830.2800 0 0 0 0
4-4 REE000 0 0 0.5130 0.3560 0 0 0.2590.2520.2820 0.2220 0 0.3130.2850
4-5 IA0.3210.3250.3310.4770.3080 0 0.3200.3250.3250.5000.2040.2080.2260.2090 0 0 0 0 0
5.5-1 EP000.2000 0.2600.2630.5090.3320.3300.5121.0000.1890 0 0 0 0 0.2490.2210.2290.258
5-2 ISH00.5100.2290 0.2590.2640 0.3630.3690 0 0.2280.4920.4990.4900.3750.2710 0.2940.2850.251
5-3 LR1.0000.4900.2100 0 0 0 0 0 0 0 0.2210.5080.5010.5100.3230.2640.2760 0.2690.249
5-4 PHR000.1960 0.2440.2390 0 0 0.4880 0.1900 0 0 0 0.2410.2520.2680 0.242
5-5 SC000.1660 0.2370.2340.4910.3050.3010 0 0.1720 0 0 0.3020.2240.2230.2170.2170

Appendix C

Table A3. Weighted super-matrix.
Criteria1. Financial2. Customer3. Internal Business Processes4. Learning and Growth5. Sustainable Development
Sub-Criteria1-11-21-31-42-12-22-33-13-23-33-44-14-24-34-44-55-15-25-35-45-5
1.1-1 RG0 0.069 0.050 0.053 0 0 0 0 0 0 0 0.070 0 0 0 0 0.118 0 0 0 0
1-2 PD0.053 0 0.048 0.062 0.081 0 0 0.098 0.066 0 0 0 0 0 0 0.092 0 0.114 0 0 0
1-3 RCE0.047 0.063 0 0.055 0.080 0 0 0 0.061 0.093 0.092 0.065 0 0 0.180 0.089 0.120 0.112 0.187 0.187 0.120
1-4 CM0.051 0.074 0.053 0 0 0 0 0.095 0.066 0.100 0.101 0 0 0 0 0 0 0 0 0 0.119
2.2-1 CS0 0 0.135 0.153 0 0.159 0.195 0.133 0.129 0.128 0.251 0.129 0 0 0 0 0.118 0 0.093 0.068 0.115
2-2 CCR0 0 0 0 0.126 0 0.189 0 0 0.122 0 0 0 0 0 0 0 0 0 0.058 0
2-3 MS0.265 0 0.131 0.145 0.121 0.136 0 0.118 0.121 0 0 0.122 0 0 0 0 0.107 0 0.083 0.050 0.109
3.3-1 IP0.139 0.178 0 0.156 0.092 0.160 0.205 0 0.084 0.075 0.078 0.129 0.214 0.216 0.184 0.111 0.112 0.099 0.083 0.079 0.108
3-2 BP0.127 0.185 0.128 0.144 0 0 0 0.088 0 0.083 0.084 0.141 0.226 0.224 0.177 0.129 0 0.102 0.082 0 0
3-3 SV0 0 0.139 0 0.101 0.169 0.223 0.079 0.079 0 0.078 0 0 0 0 0 0 0 0 0.087 0.103
3-4 ISC0 0 0 0 0.083 0 0 0.074 0.076 0.081 0 0 0 0 0 0.121 0.099 0 0 0 0
4.4-1 ES0.070 0.087 0.069 0 0.066 0.113 0 0.065 0.065 0.068 0 0 0.087 0.079 0.067 0.066 0 0.138 0.076 0.080 0
4-2 ECR0 0 0.070 0 0 0 0 0 0 0 0 0.051 0 0.079 0.066 0.065 0 0.125 0.072 0.075 0
4-3 EA0.070 0.103 0 0.122 0.068 0 0 0 0.069 0.067 0.100 0.055 0.085 0 0.074 0.074 0 0 0 0 0
4-4 REE0 0 0 0 0 0.119 0 0.071 0 0 0 0.051 0.081 0.090 0 0.058 0 0 0.068 0.062 0
4-5 IA0.066 0.092 0.068 0.111 0.060 0 0 0.064 0.065 0.065 0.100 0.040 0.067 0.072 0.055 0 0 0 0 0 0
5.5-1 EP0 0 0.022 0 0.031 0.038 0.096 0.039 0.039 0.060 0.117 0.028 0 0 0 0 0 0.077 0.056 0.058 0.084
5-2 ISH0 0.077 0.025 0 0.031 0.038 0 0.043 0.043 0 0 0.034 0.118 0.120 0.096 0.074 0.088 0 0.075 0.073 0.082
5-3 LR0.110 0.074 0.023 0 0 0 0 0 0 0 0 0.033 0.122 0.120 0.100 0.064 0.086 0.085 0 0.069 0.081
5-4 PHR0 0 0.022 0 0.030 0.034 0 0 0 0.057 0 0.028 0 0 0 0 0.078 0.078 0.068 0 0.079
5-5 SC0 0 0.018 0 0.029 0.034 0.092 0.036 0.035 0 0 0.025 0 0 0 0.059 0.073 0.069 0.055 0.055 0

References

  1. Elkington, J. Partnerships from cannibals with forks: The triple bottom line of 21st-century business. Environ. Qual. Manag. 1998, 8, 37–51. [Google Scholar] [CrossRef]
  2. Hubbard, G. Measuring organizational performance: Beyond the triple bottom line. Bus. Strateg. Environ. 2009, 18, 177–191. [Google Scholar] [CrossRef]
  3. Hu, M.-C.; Wu, C.-Y. Exploring technological innovation trajectories through latecomers: Evidence from Taiwan's bicycle industry. Technol. Anal. Strateg. Manag. 2011, 23, 433–452. [Google Scholar] [CrossRef]
  4. Costanza, R.; Patten, B.C. Defining and predicting sustainability. Ecol. Econ. 1995, 15, 193–196. [Google Scholar] [CrossRef]
  5. Venkatraman, N.; Ramanujam, V. Measurement of business performance in strategy research: A comparison of approaches. Acad. Manag. Rev. 1986, 11, 801–814. [Google Scholar]
  6. Robbins, S.P. Essentials of Organizational Behavior; Pearson Higher Ed: Boston, MA, USA, 2013. [Google Scholar]
  7. Robins, F. The future of corporate social responsibility. Asian Bus. Manag. 2005, 4, 95–115. [Google Scholar] [CrossRef]
  8. Aaronson, S.A. Corporate responsibility in the global village: The British role model and the American laggard. Bus. Soc. Rev. 2003, 108, 309–338. [Google Scholar] [CrossRef]
  9. Crook, C. The good company. Economist 2005, 22, 3–18. [Google Scholar]
  10. Kaplan, R.S.; Norton, D.P.; Dorf, R.; Raitanen, M. The Balanced Scorecard: Translating Strategy into Action; Harvard Business School Press: Boston, MA, USA, 1996; Volume 4. [Google Scholar]
  11. Kaplan, R.S.; Norton, D.P. Transforming the balanced scorecard from performance measurement to strategic management: Part I. Account. Horiz. 2001, 15, 87–104. [Google Scholar] [CrossRef]
  12. Maiga, A.S.; Jacobs, F.A. Balanced scorecard, activity-based costing and company performance: An empirical analysis. J. Manag. Issues 2003, 15, 283–301. [Google Scholar]
  13. Álvarez, C.; Rodríguez, V.; Ortega, F.; Villanueva, J. A Scorecard Framework Proposal for Improving Software Factories’ Sustainability: A Case Study of a Spanish Firm in the Financial Sector. Sustainability 2015, 7, 15999–16021. [Google Scholar] [CrossRef]
  14. Niven, P.R. Balanced Scorecard Step-by-Step: Maximizing Performance and Maintaining Results; John Wiley & Sons: New York, NY, USA, 2002. [Google Scholar]
  15. Gibbons, R.; Kaplan, R.S. Formal Measures in Informal Management: Can a Balanced Scorecard Change a Culture? Am. Econ. Rev. Pap. Proc. 2015, 105, 447–451. [Google Scholar] [CrossRef]
  16. Fletcher, H.D.; Smith, D.B. Managing for value: Developing a performance measurement system integrating EVA and the BSC in strategic planning. J. Bus. Strateg. 2004, 21, 1–17. [Google Scholar]
  17. Bhattacharya, A.; Mohapatra, P.; Kumar, V.; Dey, P.K.; Brady, M.; Tiwari, M.K.; Nudurupati, S.S. Green supply chain performance measurement using fuzzy ANP-based balanced scorecard: A collaborative decision-making approach. Prod. Plan. Control 2014, 25, 698–714. [Google Scholar] [CrossRef]
  18. Tjader, Y.; May, J.H.; Shang, J.; Vargas, L.G.; Gao, N. Firm-level outsourcing decision making: A balanced scorecard-based analytic network process model. Int. J. Prod. Econ. 2014, 147, 614–623. [Google Scholar] [CrossRef]
  19. Epstein, M.J.; Wisner, P.S. Using a balanced scorecard to implement sustainability. Environ. Qual. Manag. 2001, 11, 1–10. [Google Scholar] [CrossRef]
  20. Kaplan, R.S.; Norton, D.P. The Balanced Scorecard: Translating Strategy into Action; Harvard Business Press: Boston, MA, USA, 1997. [Google Scholar]
  21. Möller, A.; Schaltegger, S. The Sustainability Balanced Scorecard as a Framework for Eco-efficiency Analysis. J. Ind. Ecol. 2005, 9, 73–83. [Google Scholar] [CrossRef]
  22. De Felice, F.; Petrillo, A.; Autorino, C. Development of a Framework for Sustainable Outsourcing: Analytic Balanced Scorecard Method (A-BSC). Sustainability 2015, 7, 8399–8419. [Google Scholar] [CrossRef]
  23. Epstein, M.J.; Research, I. Measuring Corporate Environmental Performance: Best Practices for Costing and Managing an Effective Environmental Strategy; McGraw-Hill: New York, NY, USA, 1996. [Google Scholar]
  24. Schaltegger, S.; Burritt, R. Contemporary Environmental Accounting: Issues, Concepts, and Practice; Greenleaf Publishing: Sheffield, UK, 2000. [Google Scholar]
  25. Chu, W.-W. Causes of growth: A study of Taiwan’s bicycle industry. Camb. J. Econ. 1997, 21, 55–72. [Google Scholar] [CrossRef]
  26. Yan, H.-D.; Hu, M.-C. Strategic entrepreneurship and the growth of the firm: The case of Taiwan’s bicycle industry. Glob. Bus. Econ. Rev. 2008, 10, 11–34. [Google Scholar] [CrossRef]
  27. Chen, Y.-S.; Lin, M.-J.; Chang, C.-H.; Liu, F.-M. Technological innovations and industry clustering in the bicycle industry in Taiwan. Technol. Soc. 2009, 31, 207–217. [Google Scholar] [CrossRef]
  28. Brookfield, J.; Liu, R.-J.; MacDuffie, J.P. Taiwan’s bicycle industry A-Team battles Chinese competition with innovation and cooperation. Strateg. Leadersh. 2008, 36, 14–19. [Google Scholar] [CrossRef]
  29. Saaty, T.L. Fundamentals of the analytic network process-dependence and feedback in decision-making with a single network. J. Syst. Sci. Syst. Eng. 2004, 13, 129–157. [Google Scholar] [CrossRef]
  30. Rossi, C.; Cricelli, L.; Grimaldi, M.; Greco, M. The strategic assessment of intellectual capital assets: An application within Terradue Srl. J. Bus. Res. 2016, 69, 1598–1603. [Google Scholar] [CrossRef]
  31. Bentes, A.V.; Carneiro, J.; da Silva, J.F.; Kimura, H. Multidimensional assessment of organizational performance: Integrating BSC and AHP. J. Bus. Res. 2012, 65, 1790–1799. [Google Scholar] [CrossRef]
  32. Saaty, T.L. Theory and Applications of the Analytic Network Process: Decision Making with Benefits, Opportunities, Costs, and Risks; RWS Publications: Pittsburgh, PA, USA, 2005; Volume 4992. [Google Scholar]
  33. Staš, D.; Lenort, R.; Wicher, P.; Holman, D. Green Transport Balanced Scorecard Model with Analytic Network Process Support. Sustainability 2015, 7, 15243–15261. [Google Scholar] [CrossRef]
  34. Biondi, S.; Calabrese, A.; Capece, G.; Costa, R.; Di Pillo, F. A New Approach for Assessing Dealership Performance: An Application for the Automotive Industry. Int. J. Eng. Bus. Manag. 2013, 5, 1–8. [Google Scholar] [CrossRef]
  35. Chung, C.C.; Chao, L.C.; Lou, S.J. The Establishment of a Green Supplier Selection and Guidance Mechanism with the ANP and IPA. Sustainability 2016, 8, 259–282. [Google Scholar] [CrossRef]
  36. Saaty, T.L. What is the Analytic Hierarchy Process? Springer: Berlin, Germany, 1988. [Google Scholar]
  37. Saaty, T.L. How to make a decision: The analytic hierarchy process. Eur. J. Oper. Res. 1990, 48, 9–26. [Google Scholar] [CrossRef]
  38. Saaty, T.L. Multicriteria Decision Making; RWS Publications: Pittsburgh, PA, USA, 1996. [Google Scholar]
  39. Karpak, B.; Topcu, I. Small medium manufacturing enterprises in Turkey: An analytic network process framework for prioritizing factors affecting success. Int. J. Prod. Econ. 2010, 125, 60–70. [Google Scholar] [CrossRef]
  40. Abdi, M.R.; Labib, A.W. Performance evaluation of reconfigurable manufacturing systems via holonic architecture and the analytic network process. Int. J. Prod. Res. 2011, 49, 1319–1335. [Google Scholar] [CrossRef]
  41. Lehmann, M.; Bocken, N.M.P.; Steingrímsson, J.G.; Evans, S. Incorporating Design Thinking into Sustainabl. Business Modelling. In Proceedings of the 2nd International Conference on Sustainable, Seville, Spain, 12–14 April 2015.
  42. Bocken, N.; Short, S.; Rana, P.; Evans, S. A value mapping tool for sustainable business modelling. Int. J. Effect. Board Perform. 2013, 13, 482–497. [Google Scholar]
  43. Meinel, C.; Leifer, L.; Plattner, H. (Eds.) Design Thinking; Springer: Berlin, Germany, 2011.
  44. Dalkey, N.; Helmer, O. An experimental application of the Delphi method to the use of experts. Manag. Sci. 1963, 9, 458–467. [Google Scholar] [CrossRef]
  45. Bossidy, L.; Charan, R.; Burck, C. Execution: The discipline of getting things done. Afp. Exchang. 2004, 24, 26–29. [Google Scholar]
Figure 1. Research design flow.
Sustainability 08 00518 g001
Figure 2. Mutual correlations of performance indicators of sustainable Balanced Scorecard.
Sustainability 08 00518 g002
Table 1. Timetable of project team and job description.
StageDateNumber of Participants and CategoryResearch Methods and Job Description
1st StageThe initial stage22 May 20153 senior managers in the bicycle industry, 4 research team membersDiscussion on sustainable development, BSC and ANP, and other related documents; draw sustainable development goals for bicycle industry; making list of experts from industry, academia, research, etc.
Setup of ad hoc group19 June 20155 bicycle industry experts, 4 academic experts, 3 experts from research and development center,4 research team membersConvening specialists of sustainable management from industry, academia, research, and the bicycle industry to from the ad hoc group
The first meeting of the ad hoc group26 June 20155 bicycle industry experts, 4 academic experts, 2 experts from research and development center, 4 research team membersImplementation of focus groups interviews to understand sustainable performance indicators in bicycle industry; making lists of indicators of sustainable development; draft expert questionnaire to be drawn; description and practice of BSC and ANP Research Tools
2nd StageThe 2nd meeting of the ad hoc group10 July 20154 bicycle industry experts, 4 academic experts, 3 experts from research and development center, 4 research team membersImplementation of expert questionnaire to determine the BSC sustainable development indicators in bicycle industry
The 3rd meeting of the ad hoc group31 July 20154 bicycle industry experts, 4 academic experts, 3 experts from research and development center, 4 research team membersImplementation of focus groups to understand the importance of performance indicators of sustainable management in bicycle industry and to determine the relevance; the construction of ANP model; and the development and drafting of an AHP experts questionnaire
3rd StageThe 4th meeting of the ad hoc group14 August 20155 bicycle industry experts, 4 academic experts, 2 experts from research and development center, 4 research team membersImplementation of experts questionnaire; consistency check of ANP experts questionnaire; verification of the relative importance of BSC sustainable development indicators of bicycle industry
The 5th meeting of the ad hoc group11 September 20154 bicycle industry experts, 4 academic experts, 2 experts of research and development center, 4 research team membersThe proposal of importing sustainable development strategy in bicycle industry in accordance with the importance weight of sustainable development indicators
Final report composing30 October 20154 research team membersFinal report composing in reference to the findings and recommendations of the experts
Table 2. Experts’ background information.
CatalogueDetailed CatalogueABCDEFGHIJNum.
CategoryIndustryvvvv 4
Academia vvvv 4
R&D Center vv2
Educational backgroundPh.D. vvvv 4
Master’sv vv vv5
Bachelor’s v 1
YearsMore than 15 yearsvv vv 4
10 to 15 years vv v vv5
5 to 10 years v 1
positionGeneral Manager/Professorvv vv 4
Manager/Associate Professor v v 2
Assistant Manager/Assistant Professor v vvv4
ProfessionBicycle Industry Managementvv vvvv 6
Bicycle R&Dvvv vvvvv8
Sustainable development vvv v v5
Corporate Social Responsibilityv vv vv v6
Table 3. Analysis results of expert questionnaire.
Five DimensionsKey ProjectsM ValueSequenceRemark
1. Financial1-1 revenue growth (RG)0.7613retain
1-2 productivity (PD)0.7921retain
1-3 return on capital employed (RCE)0.7324retain
1-4 cost management (CM)0.7921retain
1-5 risk management (RM)0.6865delete
1-6 investment strategy (IS)0.6636delete
2. Customer2-1 customer satisfaction (CS)0.8641retain
2-2 customers continuation rate (CCR)0.7922retain
2-3 market share (MS)0.7063retain
2-4 customer profitability (CP)0.6455delete
2-5 customer retention rate (CRR)0.6864delete
3. Internal Business Processes3-1 innovation process (IP)0.8261retain
3-2 business processes (BP)0.7612retain
3-3 service (SV)0.7612retain
3-4 information system capabilities (ISC)0.7064retain
3-5 products database management (PDM)0.6635delete
4. Learning and Growth4-1 employee satisfaction (ES)0.7613retain
4-2 employee continuation rate (ECR)0.7324retain
4-3 employees ability (EA)0.7922retain
4-4 restructuring on employees’ expertise (REE)0.8261retain
4-5 incentives and authorization (IA)0.7324retain
4-6 supplier management capabilities (SMC)0.6866delete
5. Sustainable Development5-1 environmental protection (EP)0.7104retain
5-2 industrial safety and health (ISH)0.8262retain
5-3 labor rights (LR)0.8641retain
5-4 protection of human rights (PHR)0.7613retain
5-5 social care (SC)0.7104retain
Q1 = 0.706
Table 4. Questionnaire of mutual influence and relationship on key projects.
Very IrrelevantIrrelevantFairRelevantVery Relevant
1-1 revenue growth□ (1 point)□ (2 points)□ (3 points)□ (4 points)□ (5 points)2-1 customer satisfaction
Table 5. Cluster matrix.
Main CriteriaFinancialCustomerInternal Business ProcessesLearning and GrowthSustainable Development
Financial0.151 0.161 0.193 0.135 0.187
Customer0.265 0.248 0.251 0.251 0.176
Internal Business Processes0.266 0.276 0.240 0.270 0.166
Learning and Growth0.207 0.194 0.199 0.197 0.217
Sustainable Development0.110 0.121 0.117 0.147 0.255
Table 6. Weights analysis table of sub-criteria to sustainable business strategy.
Main CriteriaSub-CriteriaWeightsSequence under Each Main CriterionOverall Ranking
Financial1-1 revenue growth0.016 421
1-2 productivity0.039 211
1-3 return on capital employed0.062 16
1-4 cost management0.036 314
Customer2-1 customer satisfaction0.095 12
2-2 customers continuation rate0.035 315
2-3 market share0.074 24
Internal Business Processes3-1 innovation process0.106 11
3-2 business processes0.080 23
3-3 service0.063 35
3-4 information system capabilities0.036 413
Learning and Growth4-1 employee satisfaction0.055 17
4-2 employee continuation rate0.024 519
4-3 employees’ ability0.040 310
4-4 restructuring on employees’ expertise0.026 418
4-5 incentives and authorization0.046 28
Sustainable Development5-1 environmental protection0.039 212
5-2 industrial safety and health0.042 19
5-3 labor rights0.032 316
5-4 protection of human rights0.021 520
5-5 social care0.031 417

