Article

Evaluating the Impact of China’s Rail Network Expansions on Local Accessibility: A Market Potential Approach

1
Heriot-Watt University, Edinburgh EH14 4AS, UK
2
Center of Integrated Geographic Information Analysis, School of Geography and Planning, Sun Yat-sen University, Guangzhou 510275, China
*
Author to whom correspondence should be addressed.
Sustainability 2016, 8(6), 512; https://doi.org/10.3390/su8060512
Submission received: 16 March 2016 / Revised: 22 May 2016 / Accepted: 23 May 2016 / Published: 26 May 2016

Abstract

:
This paper uses a market potential approach to examine the evolution of the rail transport network of China and its spatial distributional impacts on local accessibility, with a particular focus on high-speed rail improvements. Accessibility is measured by using a “market potential” function that was derived from the general equilibrium model of the economic geography literature, and is empirically calculated based on Geographical Information System (GIS) techniques. A key finding, albeit from a highly stylized model, is that rail improvements may help raise territorial polarizing patterns across counties. The results point to the profound implications of railroad network expansion on the accessibility dynamics in periphery regions relative to core regions.

1. Introduction

High-Speed Rail (HSR) investments have undoubtedly affected the transformation of cities, both locally and globally [1]. State and federal HSR investment programs are important policy tools for promoting the economic growth in specific regions, typically economically-prosperous metropolitan areas. But there is considerably debate about the effectiveness of transport improvements in spurring regional cohesion and growth in developed countries such as South Korea, France, Germany, and Spain [2,3,4,5].
In “Transit-Induced Accessibility and Agglomeration Benefits”, Cervero highlighted the importance of quantitative methodologies in measuring the aggregated benefits of railroads and roads. Cervero argued that small differences in the distance to transit lines would cause adjacent areas to thrive relative to others. Despite the central role of the market potential function in theoretical models, empirical studies have mostly ignored its application in large developing countries. It has instead emphasized effects on labor markets and urban growth, or on the macro descriptive analysis of the rail network evolution process in the 20th century (see Wang [6] for reviews).
While existing studies have examined the economic benefits of accessibility improvements, this paper examines the evolution of Chinese counties’ market potentials induced by rail transit improvements, maintaining the focus on the diffusion of transit-induced accessibility dynamics between core regions and periphery regions. The fundamental challenge of empirical evaluations of accessibility dynamics is that, counties’ access to rail networks are influenced not only from particular counties gaining new HSR designation and/or county-to-rail distance reductions, but also by changes elsewhere in the network. This implies that it is difficult to find “control” counties that are not affected by rail network expansions. For example, county M receiving new HSR connections would affect other neighboring counties that can now access to HSR services through county M, and so on. Thus, static accessibility measures based on distance to train stations may lead to biased evaluations of HSR’s aggregated impacts. To explicitly address this concern, we define a local area’s accessibility by using the accessibility-based market potential methodology as developed in the economic geography and planning literature [7,8,9,10]. As far as we know, the existing application of this methodology at the county-level is limited in large developing countries.
The rest of this paper is structured as follows. Section 2 reviews previous evidence on the transit-induced accessibility. Section 3 describes the construction of the dataset and the methodology. Section 4 presents the accessibility analysis and spatial development models for illustrating the transit-induced accessibility evolution in China. Section 5 concludes.

2. Related Literature

Understanding transit-induced accessibility is of great importance for two main reasons. Firstly, better market access benefits the transformation of industries shifting to peripheral regions, and the subsequent spatial diffusion of development between metropolitan areas and peripheral regions, particularly in fast urbanizing countries [10]. To some extent this is true, accessibility dynamics induced by transport improvements within domestic national borders could play a critical role in influencing regional disparities and core-periphery urban systems [11]. Secondly, the transit-induced accessibility consequences may differ significantly when taking account of total population that is reachable using the transportation network from a given city or neighborhood. Since the existing measurement of the accessibility usually calculated by the density of rail stations, weighted average travel time [12,13] or by contour measures only facilitates the gathering of accessibility information on the local environment [13,14,15,16]. accessibility benefits gained by areas from elsewhere in the network may also be very important for evaluating the market potentials from a general equilibrium perspective [7,8,9,10]. In this section, we highlight the relevance of our paper to several strands of literature on which we try to improve in our work within a large developing country context.
First, our work adds to the literature dealing with the effects of HSR on spatial (and social) polarizing effects. Core-periphery patterns may be intensified when a new HSR link opens, linking core to periphery regions [17,18,19,20]. For example, Gutierrez [12] argued that the proposed HSR network in the EU region may increase territorial polarization between mega-cities and periphery regions. For example, new HSR networks in London have been aimed at attracting business service jobs to central London areas, such as King’s Cross–St Pancras, with the hopes of creating multiplier effects to regenerate neighboring depressed urban districts [21]. In France and Spain, the building of HSR networks has also been viewed as a policy lever to improve market integration and agglomeration [22]. Hall [23] argues that connecting to the HSR network is functioned as a boon to the development of edge cities surrounding mega-cities. Sánchez-Mateos and Givoni (2009) evaluated the accessibility effects of the HSR line in England, with a specific focus on analyzing whether cities that were directly linked to that line could gain more benefits than comparable areas without HSR-linkages.
In addition, our existing knowledge about accessibility evaluations of rail network systems using a market potential function is relatively limited in China. Most of the existing studies have focused on the economic implications of railroad networks. For example, Banerjee [24] suggest that proximity to a railroad network has a modest positive impact on county GDP per capita levels across broad industry sectors. Baum-Snow [25] document the significant impacts of railways on the decentralization of urban population and industrial GDP. Zheng and Kahn [26] estimate the impact of proximity to high-speed rails on real estate prices of neighboring cities in particular regions of China.
While most of the existing studies have focused on economic impacts of railway infrastructure by addressing the endogenous concern about route placements, we focus on exploring the spatial diffusion patterns of rail network expansions and accessibility improvements. In what is probably one of the two most closely related papers to our work, Cao [27] was concerned with the aggregated impacts of China’s HSR development on the spatial distribution of accessibility for 49 major prefecture cities. In a similar vein, Wang [6] used the distance-based proximity index to measure the evolution of rail networks across 330 prefecture cities in China between 1906–2000. These studies demonstrate that accessibility measures are useful tools in assessing the impact of rail network expansions.
Our work fits with existing literature in similar empirical settings in two ways. First, our units of observations are counties in mainland China. Counties are defined as the fundamental administrative census unit that allows us to look at the effects at the micro level. Second, we avoid the broad inquiry for comparing traditional accessibility measures. Instead, we narrow down our focus on assessing the evolution of local accessibility based on Harris’s [8] market potential function that more completely reflects the general equilibrium impacts of rail network expansions.

3. Data, Methods, and Implementation

3.1. China’s HSR Development

China has been known over the past six decades for its rapid rail transportation infrastructure improvements. By the foundation of the People’s Republic of China in 1949, China had only around 23,000 km of railroads over space, and these railroads were constructed for the purposes of national defense and shipping raw industrial materials during the World War II. By the 1990s and 2000s, however, China’s railroad constructions were widely considered well-funded, with operating rail transit lines increased to around 66,000 km and connecting all major cities and counties along the railway networks.
The development of high-speed railways (HSR) at the national scale began with the announcement of the Mid-long Term Railway Network Plan by the State Council in 2005, with the goal of expanding high-speed railroad length to 100,000 km by the end of 2020. This plan was further revised by the State Council in 2008 to construct 120,000 km of HSR lines by the end of 2020, with a budget of around 4000 billion yuan [28]. China’s HSR network is structured on three components: upgrading existing rail lines that can run high-speed trains, intercity HSR lines (including the Maglev High-Speed Line) linking large metropolitan areas, and some special passenger dedicated HSR lines (PDLs). The average speeds for these HSR trains vary from 200 km/h to 350 km/h, but all of these lines can be treated as the HSR system. As stated in the plan, the typical route arrangement for constructing HSR lines is based on the distribution of population, natural resources, national defense, environmental protection, as well as the economic geography of each province and region. In terms of financing arrangements, the State government pays over half of the HSR construction costs and the destination city governments are expected to pay the remainder together with some state-owned organizations. Today, China is the world’s largest HSR market. As of the end of 2012, there were about 17,000 km of HSR lines in operation, carrying trains of an average speed of above 200 km/h. Recent studies suggest that rail transit network expansions have allowed for falling trade costs and the diffusion of economic activities through commuting time savings [24,27,29]. This rapid expansion of the HSR networks means that there are many new HSR stations and lines, and substantial changes in the geographical patterns of railroad accessibility in China, on which we can base our evaluations.

3.2. Transportation Network Database

China’s railway network is a scale-free network [30], and thus it is useful for using the shortest route path strategy for organizing the transportation network database. This section describes a newly-constructed geographic information system (GIS) network dataset that can be used to exploit the county-level variation in the railroads and road networks over time. Geo-referenced county boundaries, HSR locations, and transport network data were obtained from the Institute of Geographic Science and Natural Resource Research, Chinese Academy of Science. These data were digitized on the basis of a collection of high resolution road and railroad atlas sources and geo-referenced by using the same projection system in order to have consistent distance-measure calculations over time.
Our empirical analysis relies on the computation of the least cost routes in terms of travel times between county pairs as a useful proxy for changes in accessibility due to expansion of the rail transport networks. To calculate travel times, we need information on traffic speeds and least-length routes between county pairs. The first requirement is easily met by our data since we obtained averaged railway traffic speeds from the Technical Standards of Railway Engineering of China. In particular, our GIS railway network includes two different railway levels (ordinary railway tracks and high-speed railway tracks). Different railway levels are designed to have different averaged traffic speeds: 120 km per hour for ordinary railways, and 250 km per hour for high-speed railways. The HSR in China has two levels of speed, 200 km/h for D trains and 300 km/h for G trains. However, we used the speed of 250 km/h for all HSR in this study for simplicity. In the robustness tests that are not reported here, we applied different speed scenarios to test the sensitivity of the HSR effects, and the results were similar. The second requirement is hard to meet since county-to-county routes for each transportation mode should be calculated by using a large origin-destination matrix.
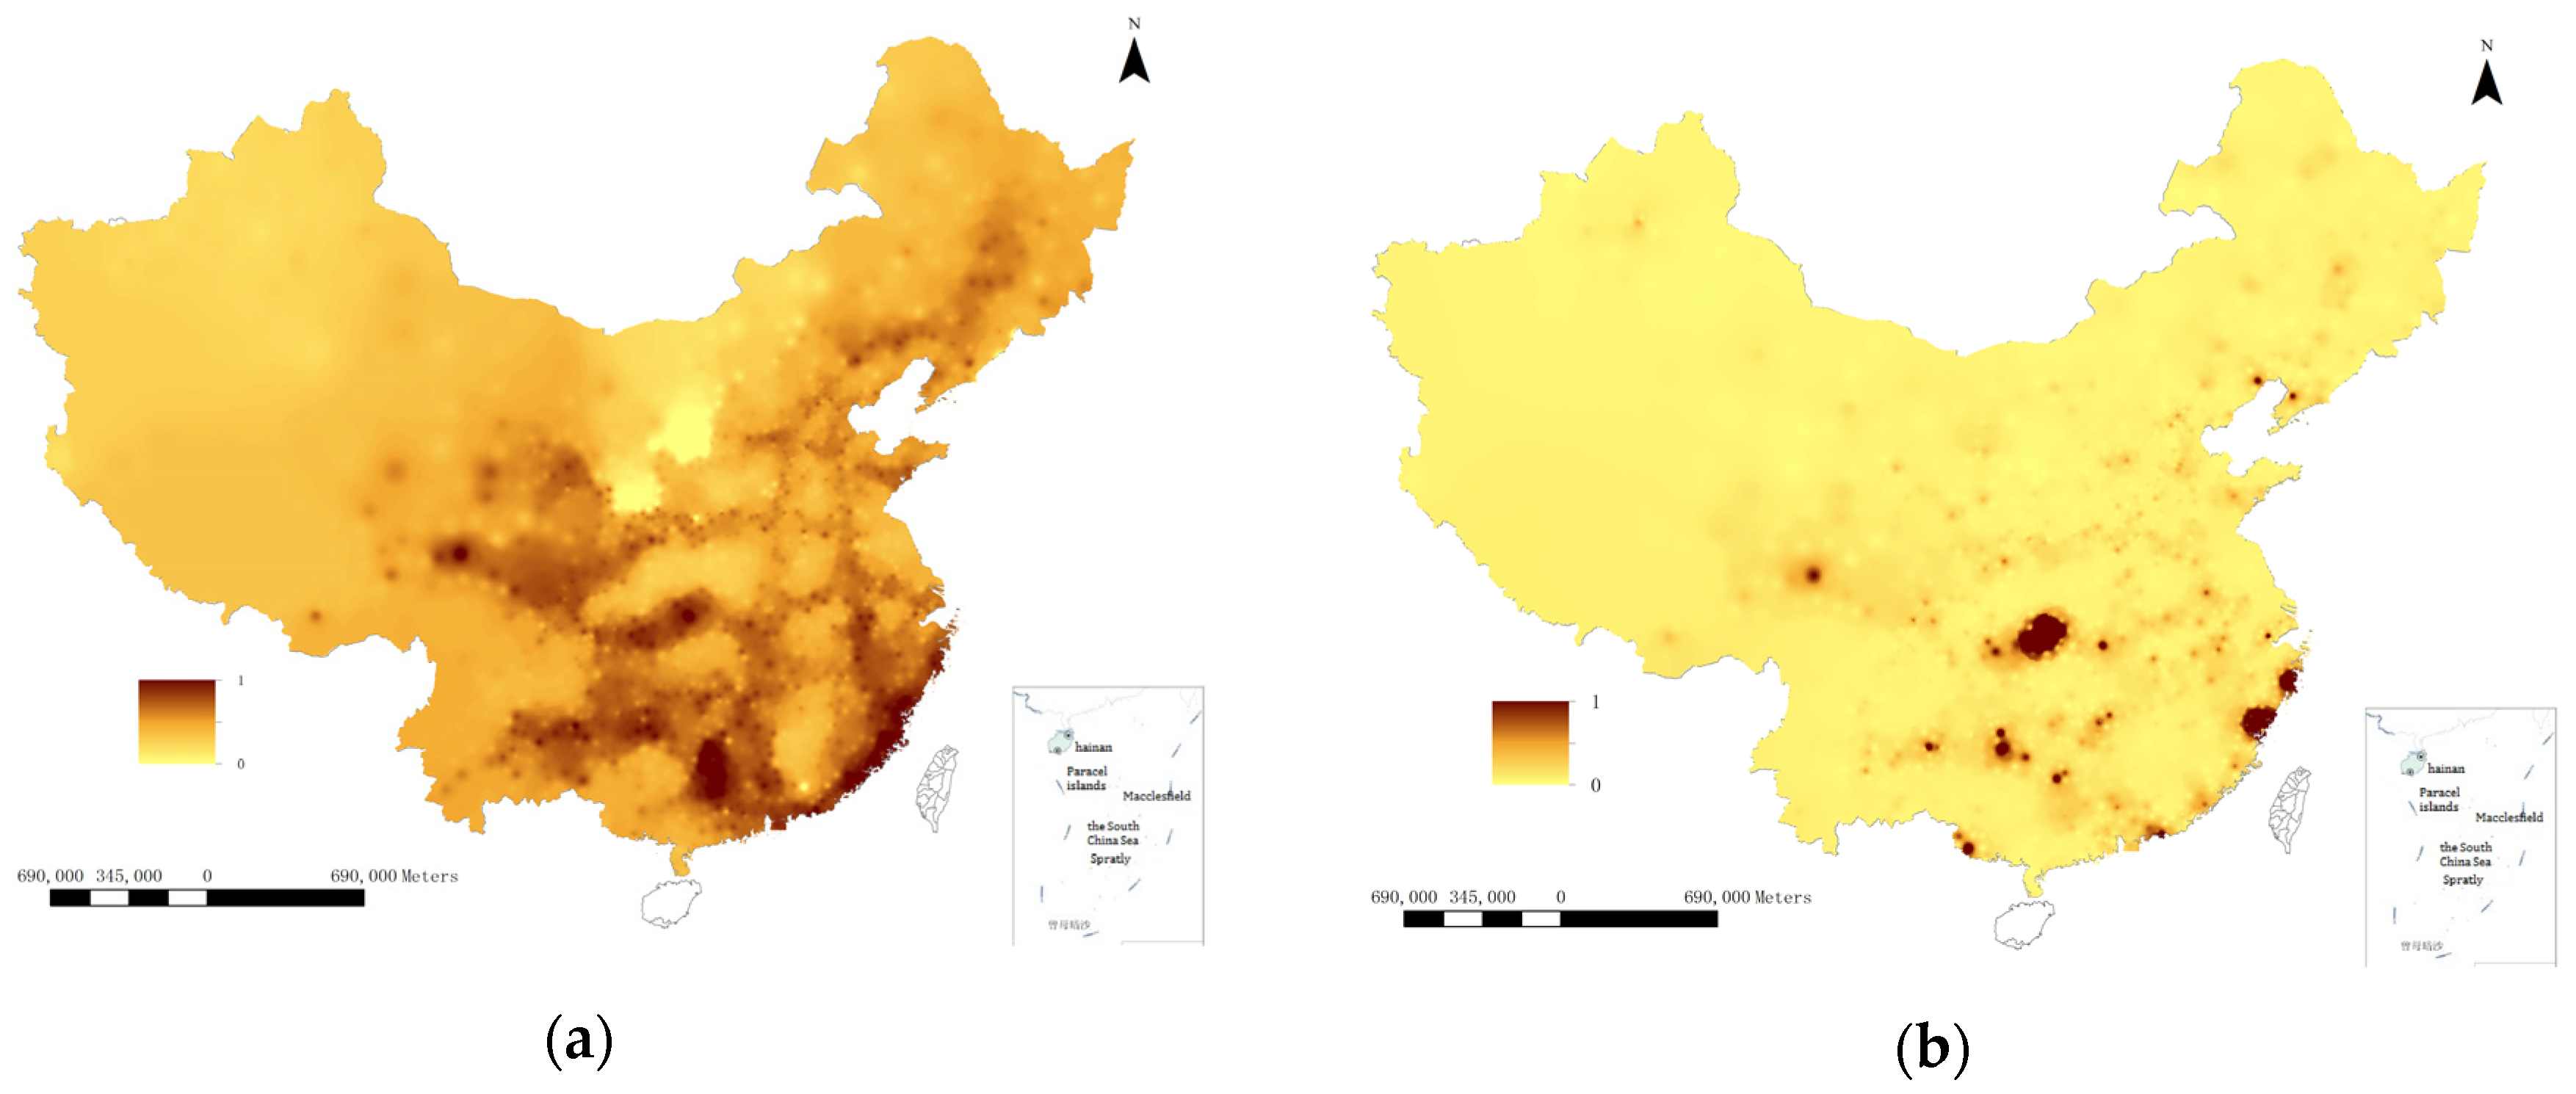
Our aim is to obtain the best possible optimal routes in terms of travel times between county pairs, so that we can estimate the impact of changing railway accessibility on changes in land development, conditional upon changes in roadway accessibility (mainly driven by highway improvements). In doing so, we apply GIS techniques to measure the shortest routes in terms of travel times under two scenarios: (1) railway networks in 2006; and (2) railway networks in 2014.
For our purposes, we use GIS topology tools to ensure exact network connections between all railroad line segments in order to facilitate the iterative computation of the optimal routing algorithm. In light of precision issues, we can create random points within each county, calculate the distance from each point to the closest rail station for departures, and take the nearest distance from the departure station to the destination station. The rail station location is measured by using the centroid point of each county. We can then adjust the origin-destination travel times along each centroid connection to within-county railways to reflect a county’s average travel times.
There are several limitations of the constructed transport network database. First, our network data does not allow us to observe travel time changes induced by changes in congestion resulting from expansions of transport networks. This is the second-order effect that may be partly endogenous to economic outcomes. In the empirical analyses, we focus on the first order effect that considers a transport improvement as a travel time reduction along the least-cost routes between county pairs. Second, traffic speeds are held constant throughout the lowest-route calculations. Traffic speeds may vary with local market potentials. However, one advantage of using the constant national traffic speed standards is that any measured changes in travel times and accessibility are determined by the variation in the location of transportation routes rather than traffic speeds. Finally, we are aware that the shortest route path strategy along the railway lines may only provide an approximation for accessibility since it is hard to take into account the waiting times for trains and other transfer times into consideration.

3.3. A Market Potential Function

This paper takes on the methodological challenge of constructing accessibility measures to the effects of HSR network expansions. Measures applied in similar empirical settings include distance to the nearest highway or railroad, local railroad density, number of rail stations at the local area level, public capital spending on rail infrastructure, and the existence of railways by location by year.
Our guiding principle in defining the railway accessibility index has been to follow Harris’s market potential function [8] that has been recently used in the literature [11,12,26]. In essence, it captures the amount of population that is reachable using the transportation network from a given county unit, inversely weighed by the travel times to reach other counties. We can solve this implicit function numerically and write the counties’ calculated accessibility as follows:
A i t = j P j i j t θ
where Ait is an index of accessibility in place i, at year t by railroads, and Ωijt is the transportation cost along the minimum travel time route along a transport network from place i to place j at year t. Pj is the 2000 population in place j. The parameter of θ is the cost-distance spatial decay parameter from the origin i to destination j.
There are several concerns underlying the above equation. The first potential source of bias might come from the measure of the transportation cost. A full measure of transportation costs would require information on characteristics of infrastructure, labor and energy use, tax, toll charges, and other financing packages. However, in light of recent economic studies, all direct and indirect characteristics that affect transport costs are expected to reflect in changing travel times, and so our measurement should offer a good proxy for changes to transport costs [11]. Second, when one is reading the results, it is important to note that our database has restricted us to drop the consideration of the frequency of train services during origin-destination travel time computations, and we do not know if any ordinary rail lines closed with the opening of new HSR lines. We acknowledge this issue. In some countries when a new HSR opens, conventional HSR lines that used to cover those links are closed, and the number of train stations can be reduced, given the characteristics of HSR. This may have negative consequences for people living in places where the conventional rail station is no longer in use and the nearest HSR station is far away. In many cases this may induce long term effects of people moving to live near HSR stations (increasing agglomeration effects). Ideally, we should also consider the border effects in the data computations because continental regions at the border of China's frontiers would otherwise show reduced accessibility values. There are several ways to include interactions with neighboring countries [16,30]. This is related to the consideration of spillover effects of new transport infrastructure investments, using accessibility indicators [31,32].
Finally, the expression for the accessibility index in Equation (1) requires an estimate of θ. This elasticity parameter is to reflect a spatial decay function of the transportation cost of travelling from the origin county i to the destination county j. Potential weighting schemes are well discussed in the existing literature. As a benchmark, we use the simple inverse cost weighting scheme (θ = 1) in which the transportation cost is the “optimal” travel time between locations j and k at time t. By assuming a value of one, it reduces our measure of market access to an older notion of “market potential” [8]. In robustness checks reported below, we used an alternative distance weighting scheme (θ = 4) from Simonovska and Waugh [33] and Donaldson and Hornbeck [12] to test the sensitivity of the empirical results to different spatial decay parameters. But this is mainly a mechanical re-scaling of “market potential” measures and the impact of rail network expansions would have differential effects on accessibility. When interpreting the results, one should clarify the implied impact of the distance decay parameter value on accessibility. Low distance decay parameter values might emphasize relationships over long distances, whereas high distance decay parameter values might emphasize relationships over short distances.

4. Results

4.1. Improvements in Accessibility Indices

This section presents some early findings from the evolution of accessibility patterns in China without considering the causal effects of rail network expansions on economic growth. Our baseline accessibility measure assumes the spatial decay weighting parameter θ is 1. Column (1) of Table 1 shows the average accessibility value and changes in the accessibility index between 2006–2014 respectively with the implicit assumption that the spatial decay weighting parameter θ is 1. The corresponding distribution for accessibility changes with alternative spatial decay weighting parameters during the same period is shown as reference and comparison in columns (2) and (3) of Table 1.
Three important patterns emerged. First, the average rail accessibility improvements experienced a rise of 19.29% at the national level (Table 1). This overall accessibility improvement indicates that the RTNC has become a more compact system over time. However, spatial variations of accessibility dynamics are obvious. Following the convention, we divided the whole sample into three regions: Eastern region, Central region, and Western region. The relative average accessibility ratio between the Eastern region and the nationwide level is 1.2, much higher than the Central region (1.16) and the Eastern region (0.75). In terms of accessibility change rates, we found substantial improvements in the Eastern region (a rise of 26.65%), as compared to other regions. Looking specifically at variations at the province level, provinces generally experienced accessibility improvements (Figure 1). The y-axis of Figure 1 plots the province-level accessibility growth rate between 2006 and 2014, whereas the x-axis of Figure 1 plots the relative ratio between mean accessibility levels by provinces and the national mean level. In terms of territorial polarizing effects, provinces from the Western region such as Xinjiang, Gansu experienced much lower accessibility growth rates than those from the Central and Eastern regions.
Second, we experimented with alternative choices by assuming a larger value of θ = 4 for the purpose of comparison. Descriptive statistics from Table 1 indicate that these alternative weighting schemes (mechanically) change the accessibility impacts of HSR network expansions, and the results largely hold the same pattern in terms of the qualitative nature. Third, the rank distribution of the top 20 counties’ rail accessibility remained robust in terms of absolute values but sensitive to the inclusion of accessibility changes (Table 2). More than half of the top-ranked accessibility improvement counties are from less-developed regions and mountainous areas.
Figure 2a,b compares the spatial distributions of county-level accessibility changes by different spatial decay parameters. The darker colors in each figure are areas with higher accessibility improvements. The primary pattern emerging is that the spatial concentration of accessibility improvement areas is much more obvious when θ = 1 than θ = 4, but this is mainly a mechanical re-scaling of “market potential”. We find strong evidence that the presence of railways improves on the spatial disparities of accessibility between regions, though this would also depend on the policy preferences. Our graphical evidence indicates that each radial railway displaced significant improvements in accessibility of counties in core regions relative to periphery regions. Since most Chinese counties experienced growing access to rail systems during our study period, transport improvements can explain this territorial polarizing pattern between regions. These findings provide empirical evidence in support of the conventional wisdom that transport infrastructure improvements are important for reshaping local market potential across space.

4.2. Spatial Development Models

The recent rail transit development process and its structural transformation are related to the planning of the rail transport network in China. This process of expansion is now moving from initial point-to-point connection structures to stages of coast-to-inner-land trunk corridors and a core-periphery urban network. Building on the results above, we now exploit the spatial structures, using a set of heterogeneous conceptual models in major metropolitan regions. The models generalize and highlight the fundamental characteristics of urban connections from rail network expansion perspectives, and they can be applied to other fast-growing countries by incorporating local socioeconomic characteristics.

4.2.1. Scattered Point-to-Point Structure

The development of HSR lines in China has a short but booming history. The initial HSR constructions were designed to stimulate traffic flows between mega-cities. Besides the small spatial coverage of the HSR network, most bullet trains did not have high frequency services and large capacities at the initial operation stage. Rural counties along these upgraded HSR networks may not gain substantial accessibility benefits from being close to the HSR lines due to the lack of train stop allocations. For example, only a few counties have HSR train stops between Beijing and Tianjing (Figure 3a). The HSR ticket prices and construction costs were also unaffordable for local governments and residents. HSR routes were only anchored by mega cities with large market potentials and characterized by the “scattered point-to-point development” model at this stage.

4.2.2. Trunk Crossing-Corridor Structure

Shortly after the 2008 global financial crisis, the state government accelerated the planning and opening speeds of new HSR lines, particularly by linking coastal regions with inner-land regions. This provides the insights on historical findings by Taaffe et al. [34] in colonial countries where the evolution of railway networks followed the coastal-to-inland trunk corridor development model.
Typical examples include the opening of the Beijing-Wuhan-Guangzhou HSR line, the Shanghai-Xi’an-Lanzhou HSR line, and Shanghai-Changsha-Kunming HSR line, etc. Such a crossing-corridor evolution pattern followed the central-planned railway development strategies for linking portal cities in the coastal region with geo-political centers in the inner-lands. With more and more HSR lines and stations opened, transit-induced accessibility benefits have expanded from counties within a narrow corridor surrounding the transit lines to wider groups of neighboring counties that can directly and indirectly access to HSR services for achieving higher market potential. As such, we see strong evidence about high accessibility improvements that are spatially concentrated along several trunk transportation corridors (Figure 3b). However, it should also be noted that accessibility benefits are not distributed evenly along these trunk corridors, with higher improvements occurring in core cities relative to secondary and third-tier cities.

4.2.3. Multi-Layer Core-Periphery Structure

With the formation and maturity of the HSR and highway networks, the multi-layer core-periphery development pattern has been structured with several characteristics. First, a nationwide hub-and-spoke network emerged with Beijing, Shanghai, Guangzhou, Wuhan, Chengdu, Kunming, Urumqi as major hubs and their neighboring counties as the formation of periphery regions (Figure 3c). Second, many large metropolitan areas have been connected by multiple HSR lines (though some of these lines are still under-construction and planning stages). In a multi-HSR connection system, a spatial development model with multi-core cities would be able to have access to larger hinterlands for capital fundamentals such as goods, services, and labor markets (Figure 3d). In the light of existing studies, improved accessibility between ex ante-asymmetric markets could be a force for the diffusion of economic activities to peripheral cities especially in the decentralized network evolution process. Third, accessibility improvements are concentrated not just between megacities, but also across peripheral cities. In the presence of comparative market access advantages, intense traffic flows may also increase the productivity of secondary and third-tier cities.
It is important to note that, what we may learn about accessibility patterns is well beyond the realm of conventional theory-based assessments. Many explanations of market potential rely on the microfoundation of spillover effects that lead to theories of trade and market competition, industrial clustering, and economic integration. In this paper however, we have stepped back from casual concerns and focused on new stylized facts to be explained. A direction for future research is to look into how the opening of a high-speed rail (HSR) line can exactly shape changes in market potential and how changes in market potential affect changes in travel flows and economic output at affected areas versus unaffected areas. Another line of future research is to simultaneously consider main highway, air traffic network expansions when evaluating the accessibility impacts of railroad infrastructure improvements.

5. Conclusions

This paper focuses on the impact of intercity rail network improvements on accessibility dynamics using micro-geographic data from the China’s recent HSR development experience from 2006 to 2014. On the one hand, new intercity rail transit investments have provided strong influences on accessibility levels in both of core regions and periphery regions. On the other hand, we find empirical support for the theoretical hypothesis that rail network expansions have a differential impact on accessibility dynamics between core and periphery regions that may help explain the formation of territorial polarizing patterns.
Given the importance of railway investments on enhancing and shaping location accessibility, our findings are therefore important for policymakers in making sound allocation decisions of public expenditure in the light of the recently estimated 2300 billion-yuan (1USD = 6.5 yuan) HSR Development Plan over the 12th–13th five-year national plan period (2012–2020). The evolution of inter-county accessibility patterns is related to the ongoing expansion of the Chinese HSR network. Future work in this line of research is encouraged to collaborate our results and quantify the effects of rail network expansions on urban and regional economic agglomerations. This would provide insights on the logic of seeing HSR constructions as the panacea for the so-called “new urbanization growth agenda” in China.

Acknowledgments

The authors acknowledge the support of the National Natural Science Foundation of China (Project No. 41301112, No. 41230632, No. 71473105),and Science and technology project of Department of Education of Guangdong Provincial (Project No. 2013KJCX0006).

Author Contributions

Wenjie Wu and Yutian Liang designed the research; Di Wu analyzed the data; Wenjie Wu and Yutian Liang wrote the paper. All authors read and approved the final manuscript.

Conflicts of Interest

The authors declare no conflict of interest.

References

  1. Cervero, R. Transit-Induced Accessibility and Agglomeration Benefits: A Land Market Evaluation; IURD Working Paper 691; Institute of Urban and Regional Development, University of California: Berkeley, CA, USA, 1997. [Google Scholar]
  2. Mendoza, G.R. Economic analysis of high speed rail in Europe. 2012. Available online: http://www.fbbva.es/TLFU/dat/inf_web_economic_analysis.pdf (accessed on 24 May 2016).
  3. Button, K. Is there any economic justification for high-speed railways in the United States? J. Transp. Geogr. 2012, 22, 300–302. [Google Scholar] [CrossRef]
  4. Lane, B.W. On the utility and challenges of high-speed rail in the United States. J. Transp. Geogr. 2012, 22, 282–284. [Google Scholar] [CrossRef]
  5. Proost, S.; Dunkerley, F.; Van der Loo, S.; Adler, N.; Bröcker, J.; Korzhenevych, A. Do the selected Trans European transport investments pass the cost benefit test? Transportation 2014, 41, 107–132. [Google Scholar] [CrossRef]
  6. Wang, J.; Jin, F.; Mo, H.; Wang, F. Spatiotemporal evolution of China’s railway network in the 20th century: An accessibility approach. Transp. Res. Part A Policy Pract. 2009, 43, 765–778. [Google Scholar] [CrossRef]
  7. Reilly, W.J. The Law of Retail Gravitation; Knickerbocker Press: New York, NY, USA, 1931. [Google Scholar]
  8. Harris, C.D. The Market as a Factor in the Localization of Industry in the United States. Ann. Assoc. Am. Geogr. 1954, 44, 315–348. [Google Scholar]
  9. Hansen, W.G. How Accessibility Shapes Land Use. J. Am. Inst. Plan. 1959, 25, 73–76. [Google Scholar] [CrossRef]
  10. Vickerman, R.W. Accessibility, attraction, and potential: A review of some concepts and their use in determining mobility. Environ. Plan. A 1974, 6, 675–691. [Google Scholar] [CrossRef]
  11. Vandenbulcke, G.; Steenberghen, T.; Thomas, I. Mapping accessibility in Belgium: A tool for land-use and transport planning? J. Transp. Geogr. 2009, 17, 39–53. [Google Scholar] [CrossRef]
  12. Gutiérrez, J.; González, R.; Gómez, G. The European high-speed train network: Predicted effects on accessibility patterns. J. Transp. Geogr. 1996, 4, 227–238. [Google Scholar] [CrossRef]
  13. López, E.; Gutiérrez, J.; Gómez, G. Measuring Regional Cohesion Effects of Large-Scale Transport Infrastructure Investments: An Accessibility Approach. Available online: http://www.tandfonline.com/doi/abs/10.1080/09654310701814629 (accessed on 14 March 2016).
  14. Handy, S.L.; Niemeier, D.A. Measuring accessibility: An exploration of issues and alternatives. Environ. Plan. A 1997, 29, 1175–1194. [Google Scholar] [CrossRef]
  15. Gutiérrez, J. Location, economic potential and daily accessibility: An analysis of the accessibility impact of the high-speed line Madrid-Barcelona-French border. J. Transp. Geogr. 2001, 9, 229–242. [Google Scholar] [CrossRef]
  16. López, E.; Monzón, A.; Ortega, E.; Mancebo Quintana, S. Assessment of Cross Border Spillover Effects of National Transport Infrastructure Plans: An Accessibility Approach. Transp. Rev. 2009, 29, 515–536. [Google Scholar] [CrossRef]
  17. Chang, J.S.; Lee, J.H.; Lee, J. Accessibility Analysis of Korean High-speed Rail: A Case Study of the Seoul Metropolitan Area. Transp. Rev. 2008, 28, 37–41. [Google Scholar] [CrossRef]
  18. Levinson, D.M. Accessibility impacts of high-speed rail. J. Transp. Geogr. 2012, 22, 288–291. [Google Scholar] [CrossRef]
  19. Garmendia, M.; Ribalaygua, C.; Ureña, J.M. High speed rail implications for cities. Cities 2012, 29, S26–S31. [Google Scholar] [CrossRef]
  20. Monzón, A.; Ortega, E.; López, E. Efficiency and spatial equity impacts of high-speed rail extensions in urban areas. Cities 2013, 30, 18–30. [Google Scholar] [CrossRef] [Green Version]
  21. Greater London Authority (GLA). London’s Central Business District: Its Global Importance, London, England: GLA Economics; Greater London Authority: London, UK, 2008. [Google Scholar]
  22. Garmendia, M.; de Urena, J.M.; Ribalaygua, C.; Leal, J.; Coronado, J.M. Urban Residential Development in Isolated Small Cities That Are Partially Integrated in Metropolitan Areas By High Speed Train. Eur. Urban Reg. Stud. 2008, 15, 249–264. [Google Scholar] [CrossRef]
  23. Hall, P. Magic carpets and seamless webs: Opportunities and constraints for high-speed trains in Europe. Built Environ. 2009, 35, 59–69. [Google Scholar] [CrossRef]
  24. Banerjee, A.; Duflo, E.; Qian, N. On the Road: Access to Transportation Infrastructure and Economic Growth in China. Natl. Bureau Econ. Res. 2012. [Google Scholar] [CrossRef]
  25. Baum-Snow, N.; Brandt, L.; Henderson, J.V.; Turner, M.A.; Zhang, Q. Roads, Railroads and Decentralization of Chinese Cities. 2015. Available online: http://www.lse.ac.uk/geographyAndEnvironment/whosWho/profiles/henderson/RoadsRailroadsDecentralization.pdf (accessed on 24 May 2016).
  26. Zheng, S.; Kahn, M.E. China’s bullet trains facilitate market integration and mitigate the cost of megacity growth. Proc. Natl. Acad. Sci. USA 2013, 110, E1248–E1253. [Google Scholar] [CrossRef] [PubMed]
  27. Cao, J.; Liu, X.; Wang, Y.; Li, Q. Accessibility impacts of China’s high-speed rail network. J. Transp. Geogr. 2013, 28, 12–21. [Google Scholar] [CrossRef]
  28. Faber, B. Trade Integration, Market Size, and Inudstrialization: Evidence from China’s National Trunk Highway System. Rev. Econ. Stud. 2014. [Google Scholar] [CrossRef]
  29. Li, W.; Cai, X. Empirical analysis of a scale-free railway network in China. Phys. A Stat. Mech. Appl. 2007, 382, 693–703. [Google Scholar] [CrossRef]
  30. Gutiérrez, J.; Condeço-Melhorado, A.; Martín, J.C. Using accessibility indicators and GIS to assess spatial spillovers of transport infrastructure investment. J. Transp. Geogr. 2010, 18, 141–152. [Google Scholar] [CrossRef]
  31. Gutiérrez, J.; Condeço-Melhorado, A.; López, E.; Monzón, A. Evaluating the European added value of TEN-T projects: A methodological proposal based on spatial spillovers, accessibility and GIS. J. Transp. Geogr. 2011, 19, 840–850. [Google Scholar] [CrossRef]
  32. Simonovska, I.; Waugh, M. The elasticity of trade: Estimates and evidence. J. Int. Econ. 2014, 92, 34–50. [Google Scholar] [CrossRef]
  33. Gallego, J.A.G.; Gómez, J.M.N.; Jaraíz-Cabanillas, F.J.; Labrador, E.E.R.; Jeong, J.S. A methodology to assess the connectivity caused by a transportation infrastructure: Application to the high-speed rail in Extremadura. Case Stud. Transp. Policy 2015, 3, 392–401. [Google Scholar] [CrossRef]
  34. Munnell, A. Policy watch: Infrastructure investment and economic growth. J. Econ. Perspect. 1992, 6, 189–198. [Google Scholar] [CrossRef]
Figure 1. Distribution of accessibility improvements by provinces relative to the nationwide mean level.
Sustainability 08 00512 g001
Figure 2. (a) Spatial distribution of county-level rail accessibility change rate (θ = 1); (b) Spatial distribution of county-level rail accessibility change rate (θ = 4).
Sustainability 08 00512 g002
Figure 3. Spatial development models; (a) scattered point-to-point development model; (b) trunk corridor development model; (c) single core-periphery development model; (d) multi core-periphery development model.
Sustainability 08 00512 g003aSustainability 08 00512 g003b
Table 1. Statistical characteristics of rail accessibility in China, by regions.
(1) Accessibility (θ = 1)(2) Accessibility (θ = 4)
MeanSt.dMeanSt.d
Eastern region2006–2014 mean/
national mean
1.20 0.63 2.34 1.78
Growth0.27 0.17 2.40 41.51
Central region2006–2014 mean/
national mean
1.16 0.89 0.73 0.43
Growth0.18 0.16 0.50 4.54
Western region2006–2014 mean/
national mean
0.75 0.85 0.31 0.34
Growth0.15 0.22 0.20 1.70
NationwideGrowth0.190.1960.9122.2
Table 2. Top 20 counties with absolute value and relative changes of accessibility index in China.
NameRanks2006 County/National Mean RatioNameRanks2014 County/National Mean RatioNameRanksChange of County/National Mean Ratio
Xuchang *11.760Xinxiang *11.835Gongcheng Yao Autonomous15.202
Xinxiang21.708Xuchang *21.829Xianyou25.150
Xinxiang *31.708Xinxiang31.817Jianshi34.992
Zhengzhou *41.701Shijiazhuang *41.811Jiangyong44.835
Luohe *51.671Yuzhou51.811Zijin Mountain54.677
Anyang *61.671Xuanwu *61.792Putian *64.624
Huojia71.657Xinzheng71.786Zherong74.572
Xingyang81.649Kaifeng *81.786Pingle84.414
Handan91.649Anyang *91.774Babu94.362
Dingtao101.649Bengbu *101.774Xiamen *104.309
Changge111.642Chongwen *111.774Guanyang114.257
Zhumadian *121.642Zhenjiang *121.761Dege124.204
Fuyang *131.642Pukou *131.755Nanan134.204
Jiaozuo *141.642Hefei *141.755Jinjiang144.151
Heze *151.635Xingtai *151.749Qinglong154.099
Kaifeng *161.635Dongcheng *161.730Zhangpu164.099
Feixiang171.635Gongyi171.730Yongtai174.099
Shijiazhuang *181.635Tengzhou181.718Ningde *184.046
Fengqiu191.635Changge191.712Kinmen193.994
Guangping201.635Xingyang201.706Luoyuan203.994
* denotes that the county unit is in the urban district area.

