1. Introduction
With the enactment of the Framework Act on Low Carbon, Green Growth in April 2010, the Republic of Korea has gradually broadened a scope of technology that can reduce environmental load in all industries [
1]. In particular, there has been a strong demand for studies on the development of environment-friendly construction materials that can lead to sustainable green growth in construction industry.
In South Korea, construction industry is a key industry, which accounts for 16% of the GDP. At the same time, it is responsible for energy consumption, greenhouse gas emissions and production of industrial wastes by 40%, 42% and 30% respectively [
2]. Therefore, it is able to reduce environmental load and generate direct economic effects through the development of eco-friendly construction materials by recycling industrial byproducts and wastes. The industrial byproduct “Blast Furnace Slag (BFS)” is produced by POSCO and Hyundai Steel (about 12 million tons/year as of 2011). Compared to the Ordinary Portland Cement (OPC), it is very low in terms of the emission of environmental load. Hence, it is been mostly used as a component of low carbon emission concrete [
3]. The BFS has positive effects in concrete from the following aspects: improvement of long-term strength, improvement of water tightness, inhibition of hydration heat, increase in chemical resistance and enhancement of economic efficiency.
However, if the concrete mixed with a lot of BFS is poured during winter season, delay of setting time and decrease in early strength can occur.
To make up for these physical properties of the BFS, recently, an additive that reveals early-stage strength has been made of industrial wastes such as titanium gypsum, sludge and limestone.
This additive mostly consists of industrial wastes. Since it is used as a substitute for natural gypsum, which is used during general BFS production, it can diminish environmental effects such as global warming and eutrophication and save resources. Furthermore, it is forecasted that the money (Korea Won 30,000/ton) that might be spent in burying water treatment sludge (2310 tons produced daily) could be saved by recycling it as a construction material [
4].
This study assessed the environmental effects of the W-BFS (“waste additive + BFS”) using the Life Cycle Assessment (LCA) and compared it to general BFS. Furthermore, its environmental effects when general BFS and W-BFS were added to concrete individually were analyzed [
5].
2. Material for Property Experiment and Environmental Analysis
2.1. Overview
BFS mixed industrial waste addictive is a construction material made of the BFS and waste additives.
It is manufactured to reduce environmental load, maintaining the performance of general BFS.
As shown in
Figure 1, a waste additive consists of titanium gypsum, sludge, limestone and others [
6].
Table 1 states the chemical composition of the components collected from the BFS (blast furnace slag) manufacturers. They are described according to the results of X-ray Diffraction Spectroscopy (XRD) on the following materials: titanium gypsum, sludge and limestone [
7].
2.2. Composition Materials of W-BFS
2.2.1. BFS (Blast Furnace Slag)
BFS refers to “ground granulated blast furnace slag”, which is obtained after spraying water onto the hot molten slag and freezing it rapidly. Comprised of four major components (SiO
2, Al
2O
3, CaO and MgO, 95–99 percent), it has almost same chemical components of cement. These components show a reaction close to the hydration of cement. While Portland cement is mostly hydraulic, BFS is reveals a latent hydraulic reaction. Generally, in other words, cement forms and hardens hydrate when its particles come into contact with water molecules. In the BFS, in contrast, contact with water molecules is not enough. Instead, a reaction finally occurs with an addition of an activator such as alkaline or sulfate salt. Hence, BFS has been widely used in the manufacture of concrete [
8].
2.2.2. Waste Additive (WA)
Titanium Gypsum
If the absorbent “powdered limestone (CaCO3)” is reacted to remove SO2 generated at the combustion of fossil fuels (coal, oil) at a thermal power plant, in the Republic of Korea, Flue Gas Desulfurization (FGD) gypsum created as a byproduct is used as an additive by a cement manufacturer and for a secondary product.
The titanium gypsum used in this study is an industrial waste produced during the chemical reaction which neutralizes the acidity of sulfur into lime at the manufacture of titanium dioxide, and its chemical formula is CaSO
4 + 2H
2O. Titanium gypsum contains a large amount of CaO (39.2%) and SO
3 (54.3%). If its particles come into contact with water molecules after drying, setting along with heating occurs. In addition, titanium gypsum works as a cement activator as well as the alkaline activator of BFS as pH increases from 6 (before calcination) to 7.5 (after calcination) when being mixed with limestone [
9].
Sludge
Sludge is a substance in which turbid matter and coagulant hydroxide are concentrated. Since an aluminum coagulant is mostly used to remove turbid matters during coagulation process, it is also called ”alum sludge”.
The purpose of analyzing the chemical components of the dehydrated sludge is to process and recycle the sludge. The chemical components include water, coagulant, silica powder and alumina powder. Because sludge is comprised of SiO
2 (46.6%), Al
2O
3 (39.7%) and Fe
2O
3 (5.4%), it is close to clay in terms of ingredients. Therefore, it is very useful as an additive. In terms of the chemical components of the sludge applied to this study, silica powder (SiO
2) was the highest with 35%–50%. In addition, small amount of oxides (K, Mg, Na, Ca, Ti, S, P,
etc.) were detected [
10].
Limestone
Limestone is the most widely used mineral among the materials with CaO. It is widely distributed across Gangwon-do with a huge amount of reserve. It is lime (CaCO
3) which accounts the greatest portion in manufacturing clinker, the essential ingredient of Portland cement. This lime consists of CaO, SiO
2, Al
2O
3 and Fe
2O
3. After a calcination reaction, it produces four clinker minerals: alite, belite, aluminate and ferrite. Each clinker mineral reveals different cement characteristics depending on its content so that it would be available as a clinker activator through the appropriate chemical mixture of materials [
11].
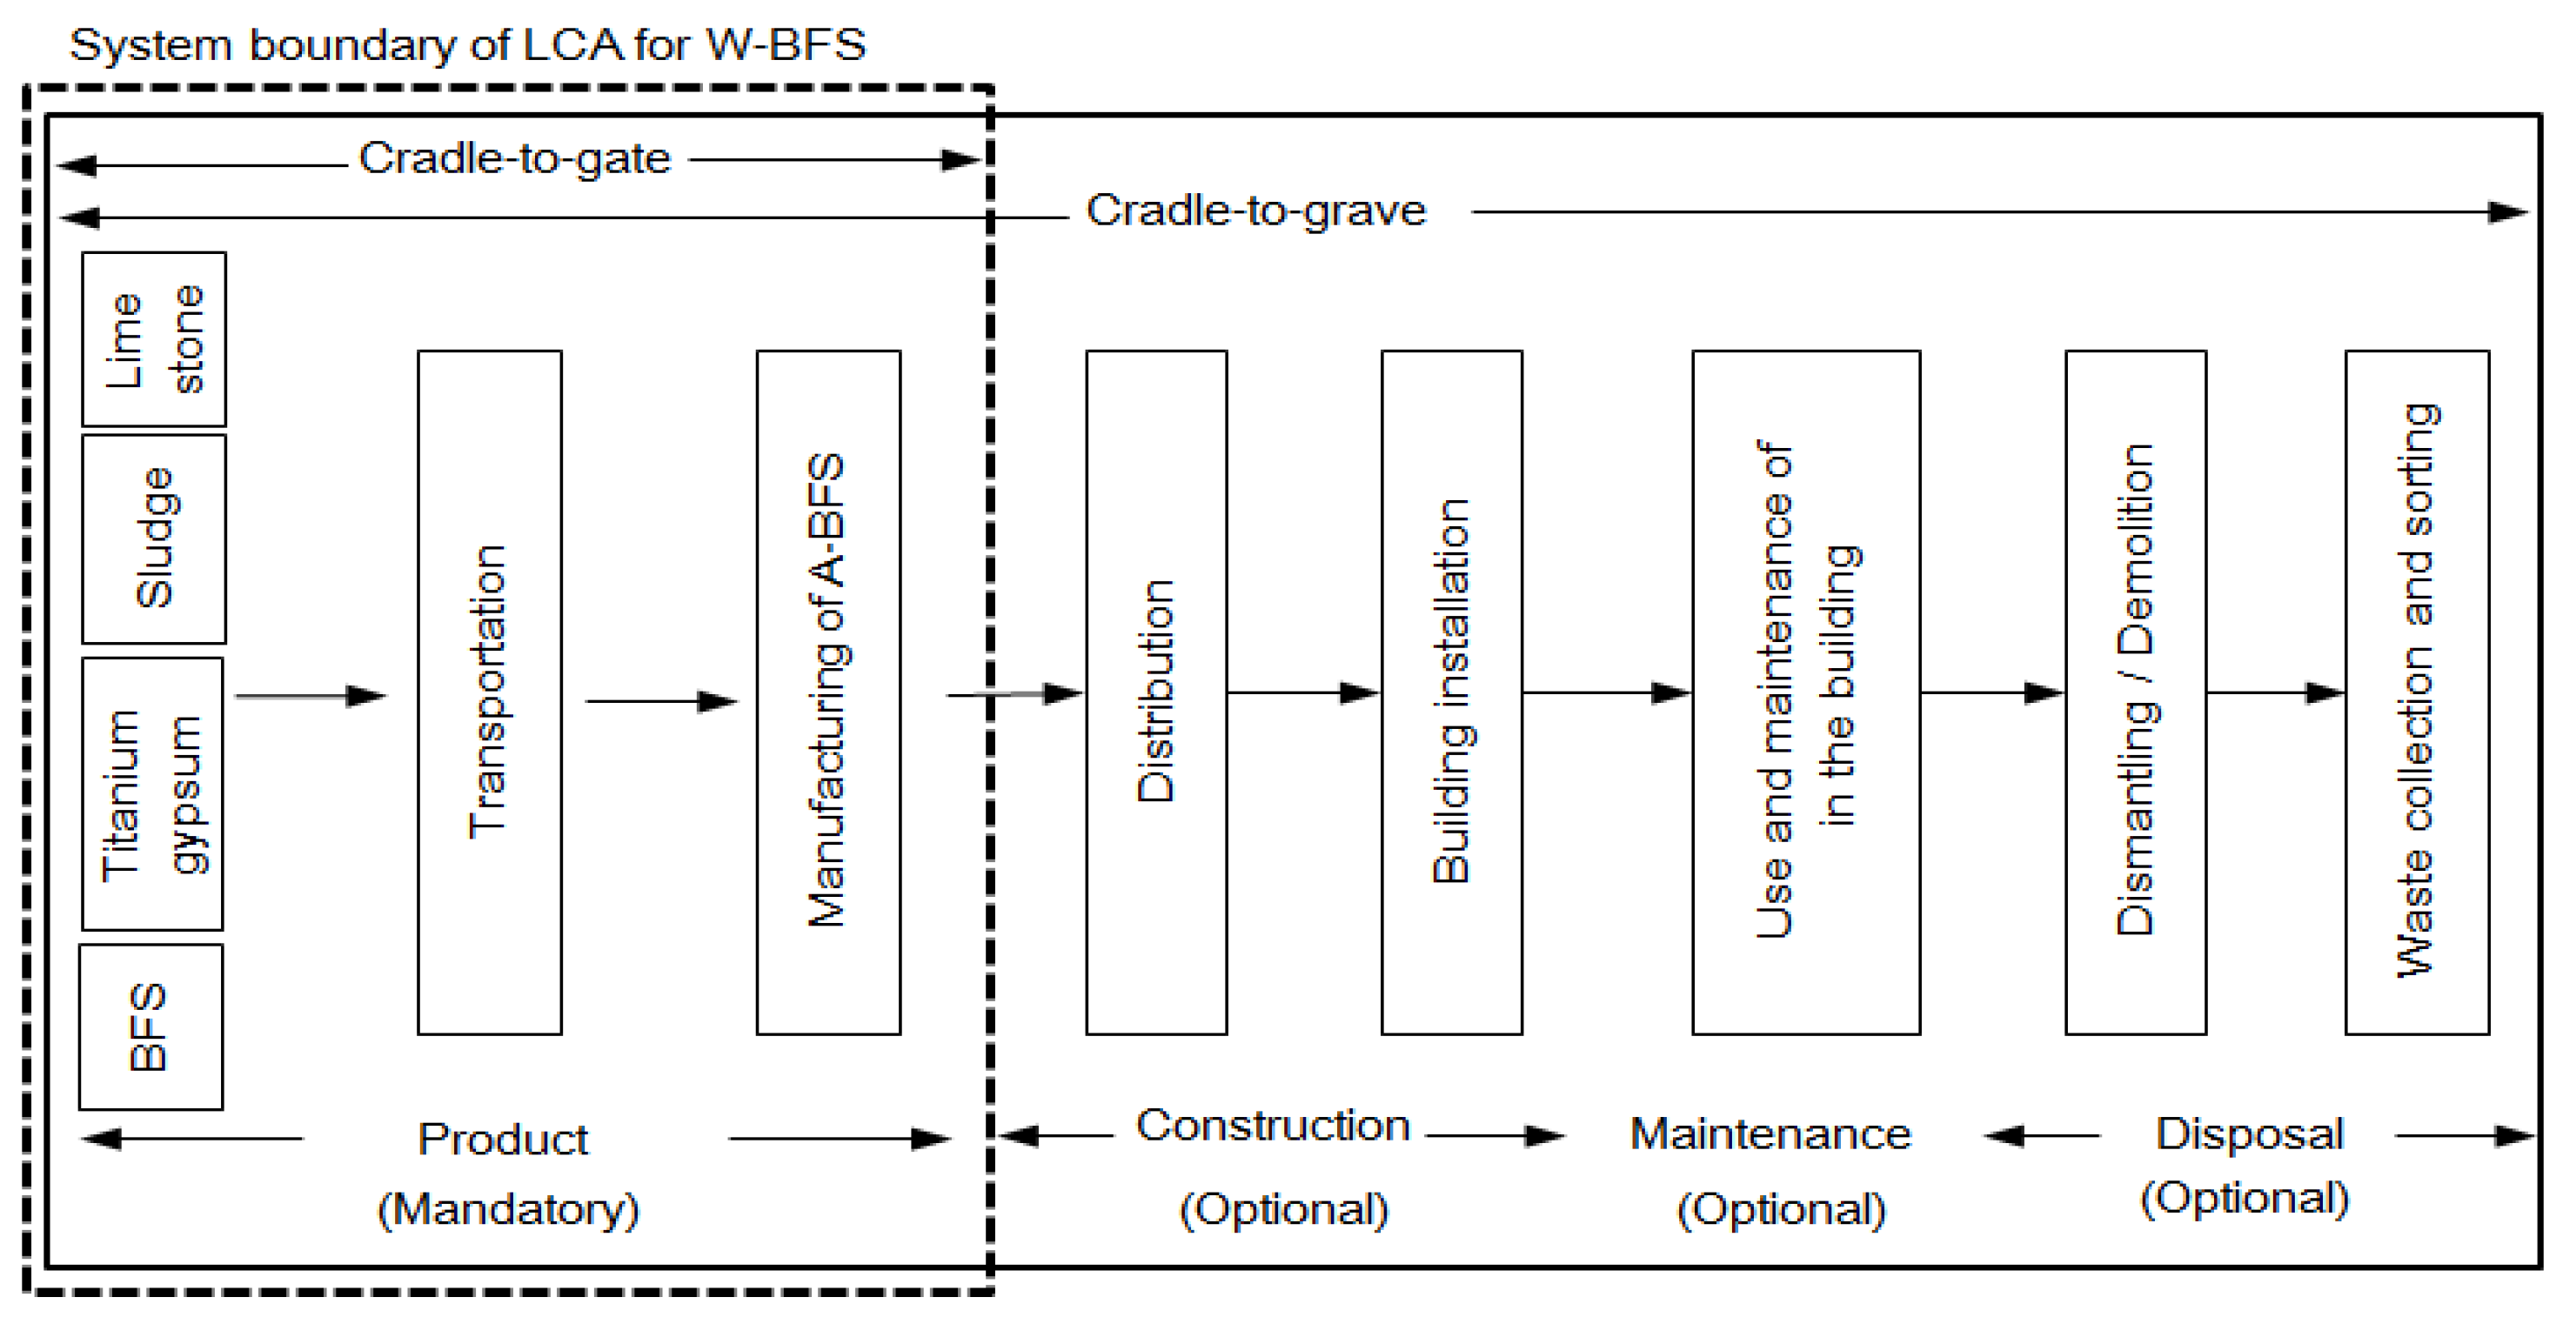
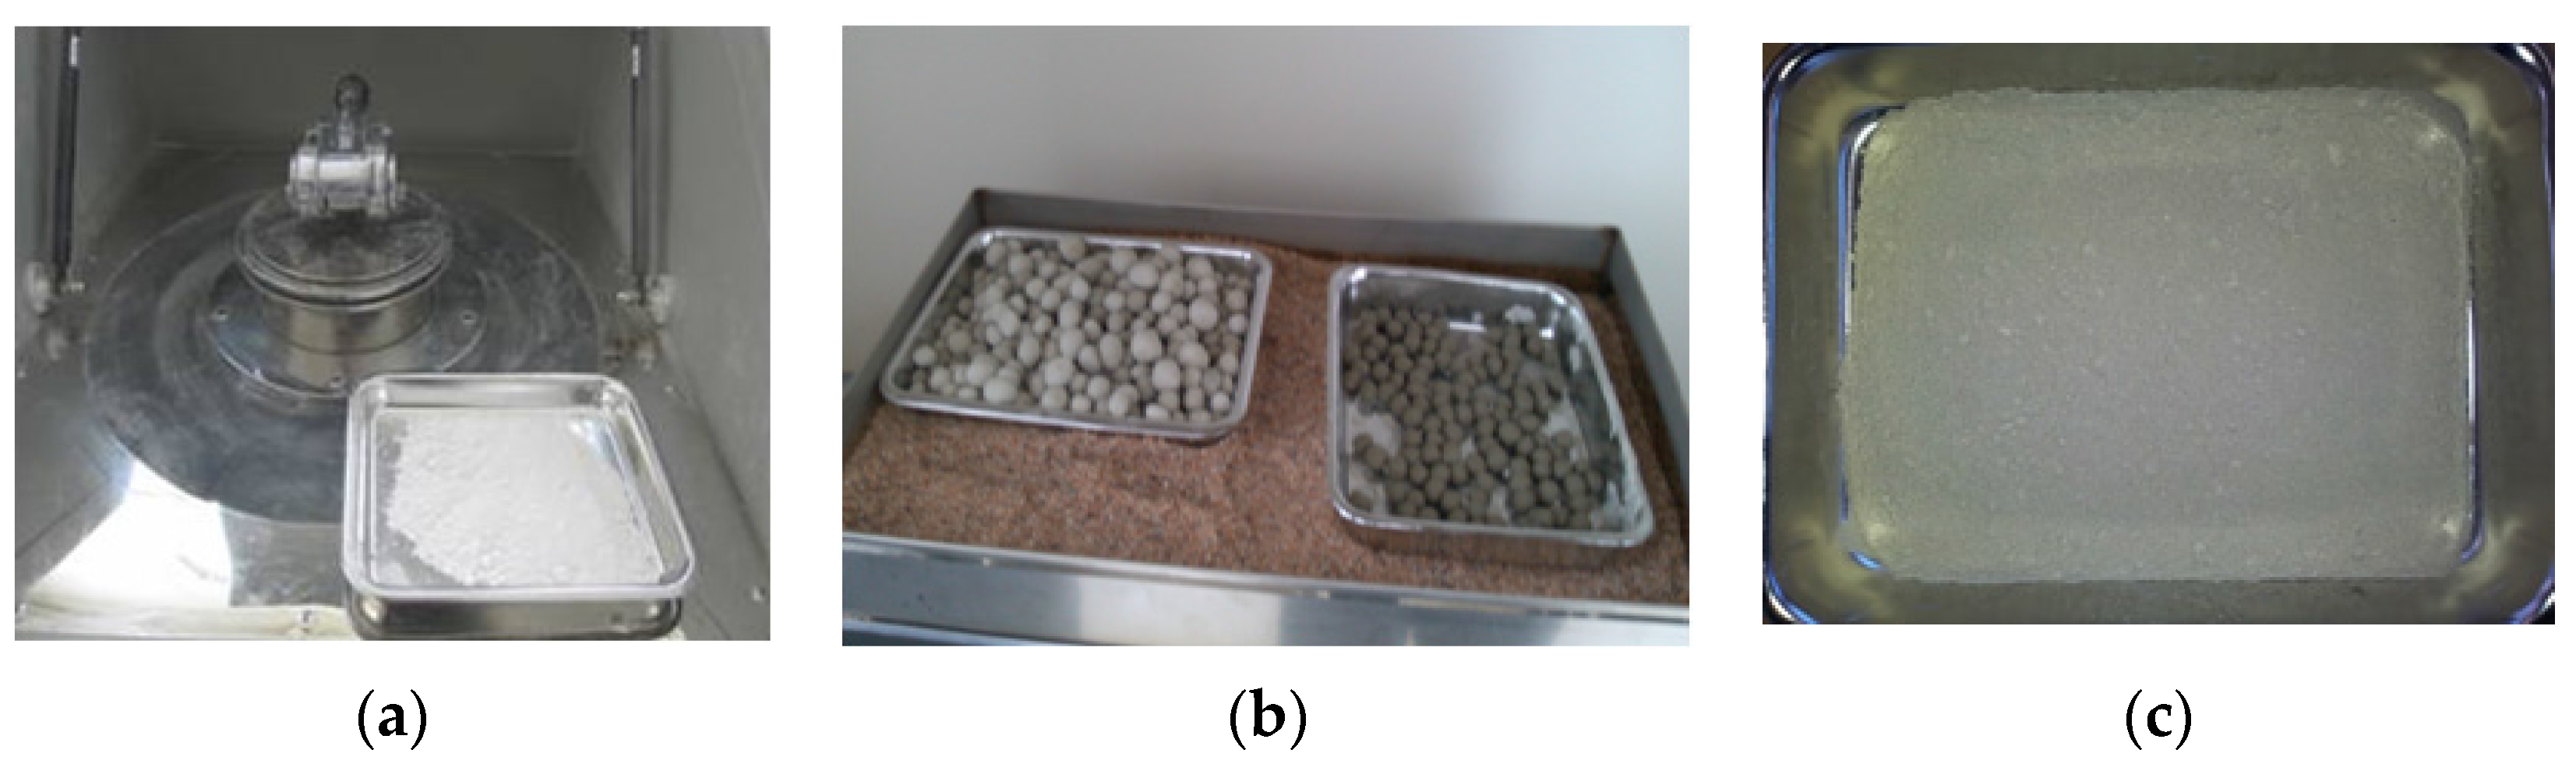
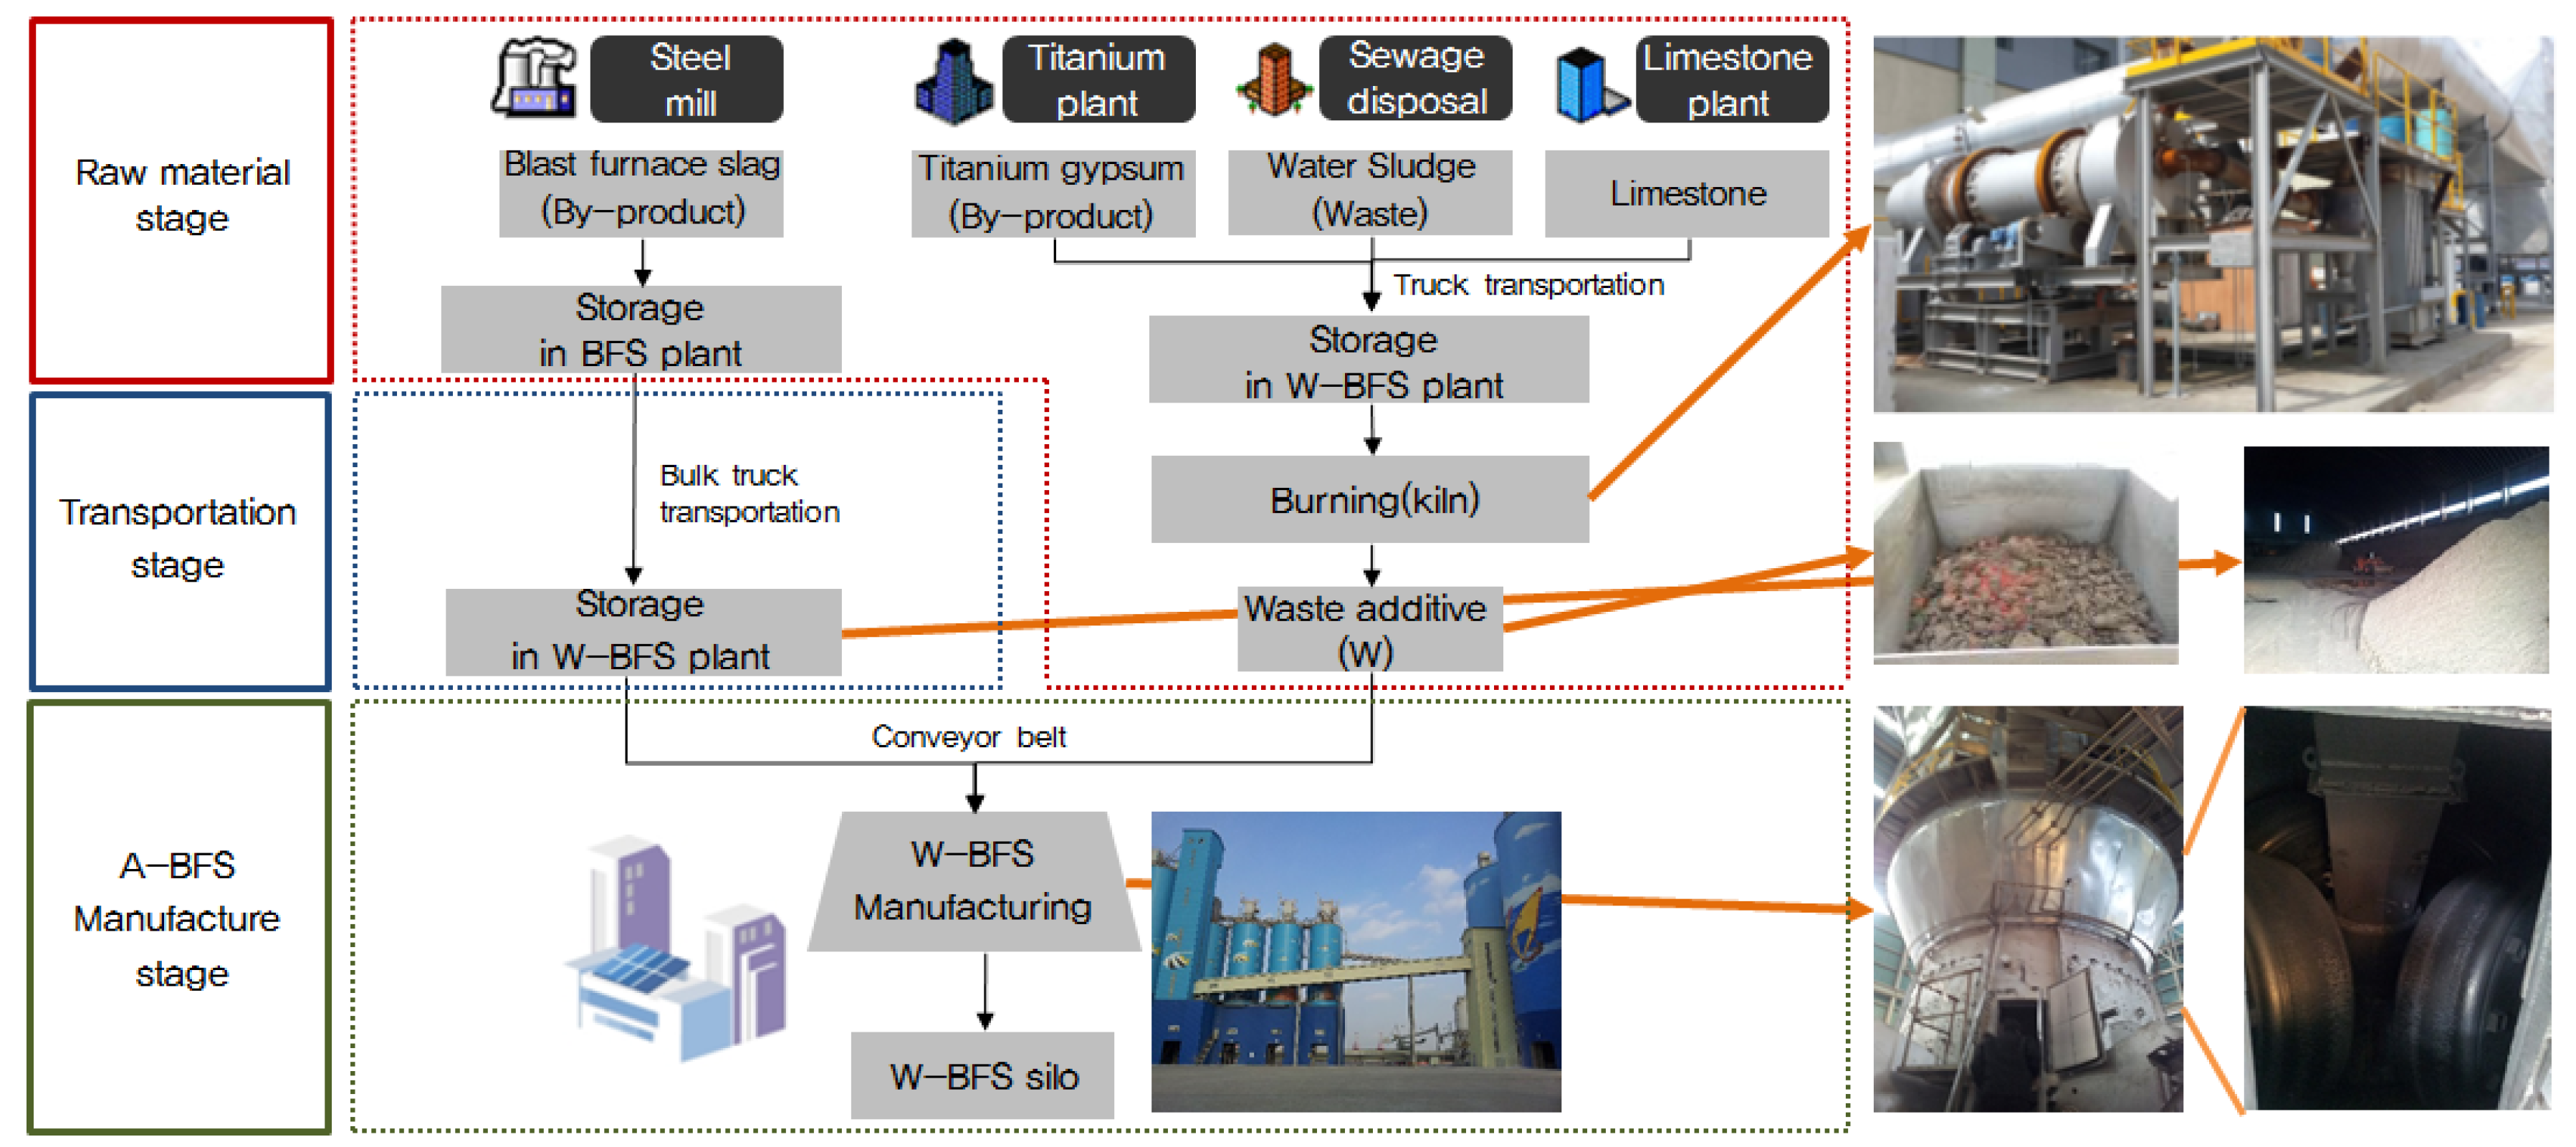
2.3. W-BFS Manufacturing Process
The manufacturing process of W-BFS is divided into raw material stage, transportation stage and manufacture stage as shown in
Figure 2. The industrial byproduct “BFS” is collected in a steel mill and conveyed to a stock pile. To transport the BFS to the W-BFS factory, it is crushed into small particles (40 mm or smaller) in a crusher. Then, the crushed slag is conveyed and stored in the W-BFS factory. The components of “W” (titanium gypsum, sludge, limestone,
etc.) are transported to manufacturers and a sewage treatment plant, and the transported materials are mixed and calcined. The waste additives produced through calcination are conveyed to the W-BFS factory using a conveyor belt. The conveyed BFS and waste additive are weighted and inserted into a large mixer. Then, they are manufactured into W-BFS products after ball-mill crushing and mixing processes.
3. Method
3.1. Physical Properties of Concrete with W-BFS
3.1.1. Experiment Method
In this test, OPC available in the Republic of Korea was used. In terms of BFS, the one produced by Steel company in the Republic Korea was applied. As an activator aimed to induce the hydration reaction of BFS, the said waste additives were partially mixed. For the coarse aggregate used for a physical test, furthermore, crushed aggregate (20 mm, specific gravity: 2.60, fineness modulus: 6.68) was used. For fine aggregate, sea sand (specific gravity: 2.58, fineness modulus: 2.34) was applied.
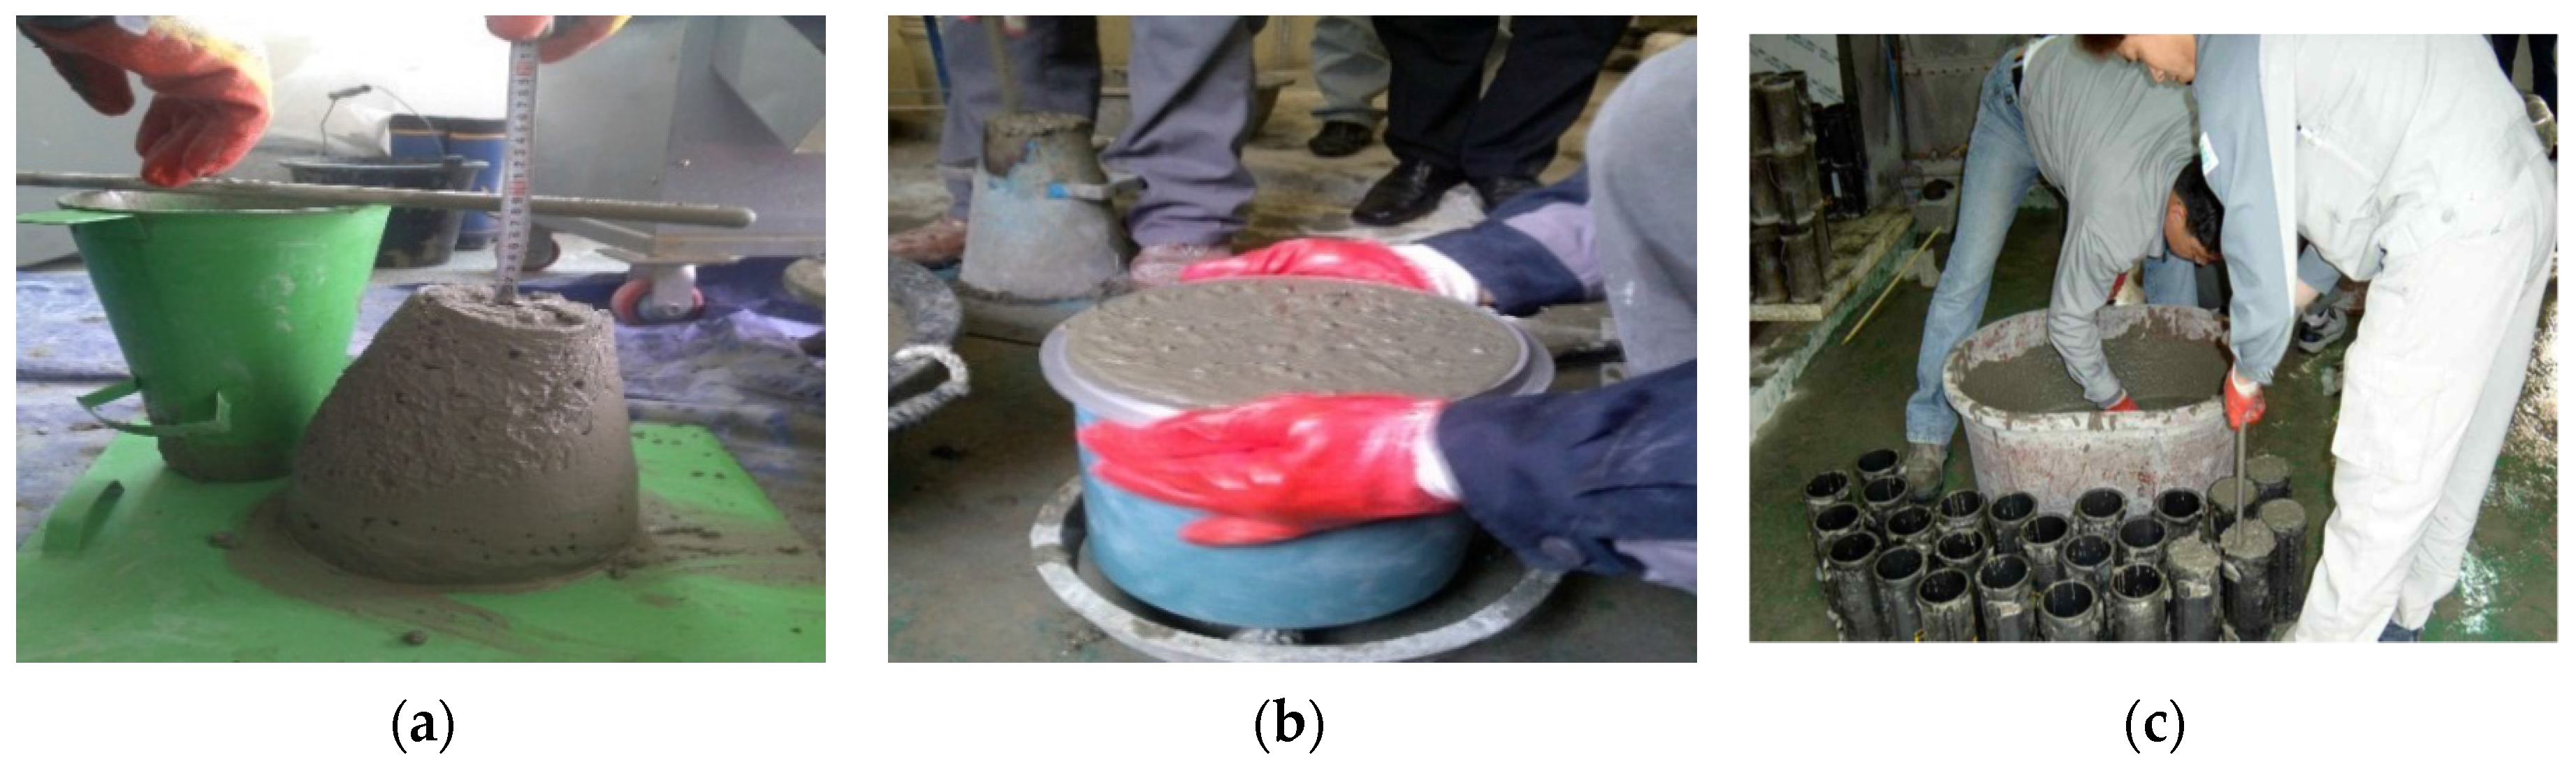
The concrete mix design aimed to assess the flow characteristics and compressive strength development characteristics of concrete is shown in
Table 2.
In terms of a binder used at the manufacture of concrete, 100% OPC was chosen for plain (Type 1). In addition, Type 2 (OPC:BFS = 70:30) and Type 3 (OPC:W-BFS = 70:30) were applied. For W-BFS, the mixed one (BFS:W = 70:30) was used. To assess fluidity, a slump test (KS F 2402 [
12]) and air content test (KS F 2421 [
13]) were conducted on fresh concrete. After fabricating concrete specimens according to KS F 2403 [
14], compressive strength by age was measured in accordance with KS F 2405 [
15].
The test plan aimed to evaluate the fluidity and compressive strength of W-BFS concrete is stated in
Table 3.
To evaluate the characteristics of compressive strength, a circular test specimen (100 mm × 200 mm) was fabricated. Then, concrete strength was measured using compression testing machine after standard curing (20 ± 2 °C). In addition, slump, air content and concrete temperature were measured.
The concrete slump test was aimed to satisfy “(150 ± 25) mm”. For this, chemical admixture was used. In addition, air content test was targeted to meet “(4.5 ± 1.5)%”.
In an adiabatic temperature rise test, the inner temperature of concrete was measured by attaching insulating Styrofoam into the member as shown in
Figure 3. Then, the highest temperature and time taken to reach the level were confirmed.
However, this study failed to examine change in the length of shrinkage, plastic shrinkage crack and carbonation resistance, and there should be further studies on these matters.
3.1.2. Experiment Result
Table 4 reveals the slump, air content and compressive strength of W-BFS-mixed concrete. Compared to Type 1 in which OPC was only used, slump slightly increased while air content declined.
Slump increased because the BFS has a smooth wave surface. As lubrication among concrete particles increases because of interface lubrication action caused by the acidic membrane on the surface, in addition, the bearing effects of aggregates increase.
The slump and air content of W-BFS-mixed concrete reveal the same measurement value with the general BFS-mixed concrete. Therefore, it appears that there is almost no change in the physical properties of concrete caused by a waste addictive.
According to the development of compressive strength, Type 2 is lower than Type 1 until the 7th day in terms of strength development rates. However, Type 3 was the same with Type 1 from the 1st day in terms of compressive strength. At the 28th day, in particular, higher compressive strength was measured. It appears that this kind of result occurred because early-stage hydration was accelerated after SO42− ion in the waste additive was absorbed into Al2O3 in the BFS and precipitated in the pore along with the creation of ettringite.
According to an adiabatic temperature rise test, the OPC + BFS combination revealed 35 °C of maximum temperature in the central part. It took 25 h to reach the highest level. It appears that the heat of hydration declined due to a decrease in cement content per unit volume of concrete because of the replacement of BFS.
In case of the W-BFS mixture, it took 22 h to reach the highest temperature in the central region regardless of a replacement ratio, and the temperature ranged from 36.1 to 37.5 °C. In addition, the temperature rise gradient was gentle. In a concrete temperature crack, it would be possible to reduce a concrete temperature crack through W-BFS mixture with the factors influenced by maximum temperature rise and temperature rise gradient.
For removal of the forms in the RC structure, in general, wall and slab forms should be at least 5 MPa and 14 MPa respectively. In this case, they are constructed every 6 days. If early strength development is enabled, however, it could be constructed every 3–4 days. In this test, it was confirmed that the concrete mixed with W-BFS (30% of the binder) is the same with OPC in terms of compressive strength. In particular, it could be possible to remove the forms early with 19.8 MPa of 3-day compressive strength. Therefore, it is expected that the construction of RC structure would be shortened, and construction costs would be reduced.
3.2. Environmental Impact Assessmetn of W-BFS
3.2.1. Assessment Mehod
This study assessed the environmental impact of W-BFS in accordance with the LCA method under the ISO Standards. The category of environmental impact for the Life Cycle Impact Assessment (LCIA) was divided as follows: global warming, acidification, eutrophication, abiotic depletion, ozone depletion and creation of photochemical oxides [
16,
17].
At the environmental impact assessment of W-BFS, the functional unit was 1 kg, and system boundary was set to the product stage of concrete (Cradle to Gate) as shown in
Figure 4 [
18,
19].
In addition, the product stage of W-BFS was classified into raw material, transportation and manufacture stages. In addition, the environmental impact of input and output materials in each stage on atmosphere and hydrosphere was assessed [
20,
21].
For this, the Life Cycle Inventory (LCI) Database of the Republic of Korea (Ministry of Land, Infrastructure and Transport/Ministry of Environment) was applied as stated in
Table 5 [
22,
23].
Because LCI DB differs by country, it is needed to apply the database provided by each country. Because there is no LCI database on BFS, titanium gypsum, sludge and limestone in the Republic of Korea, however, foreign ecoinvent database [
24] has been used. For assessment of W-BFS costs, in addition, “Korean Standard Price Database” has been applied [
25].
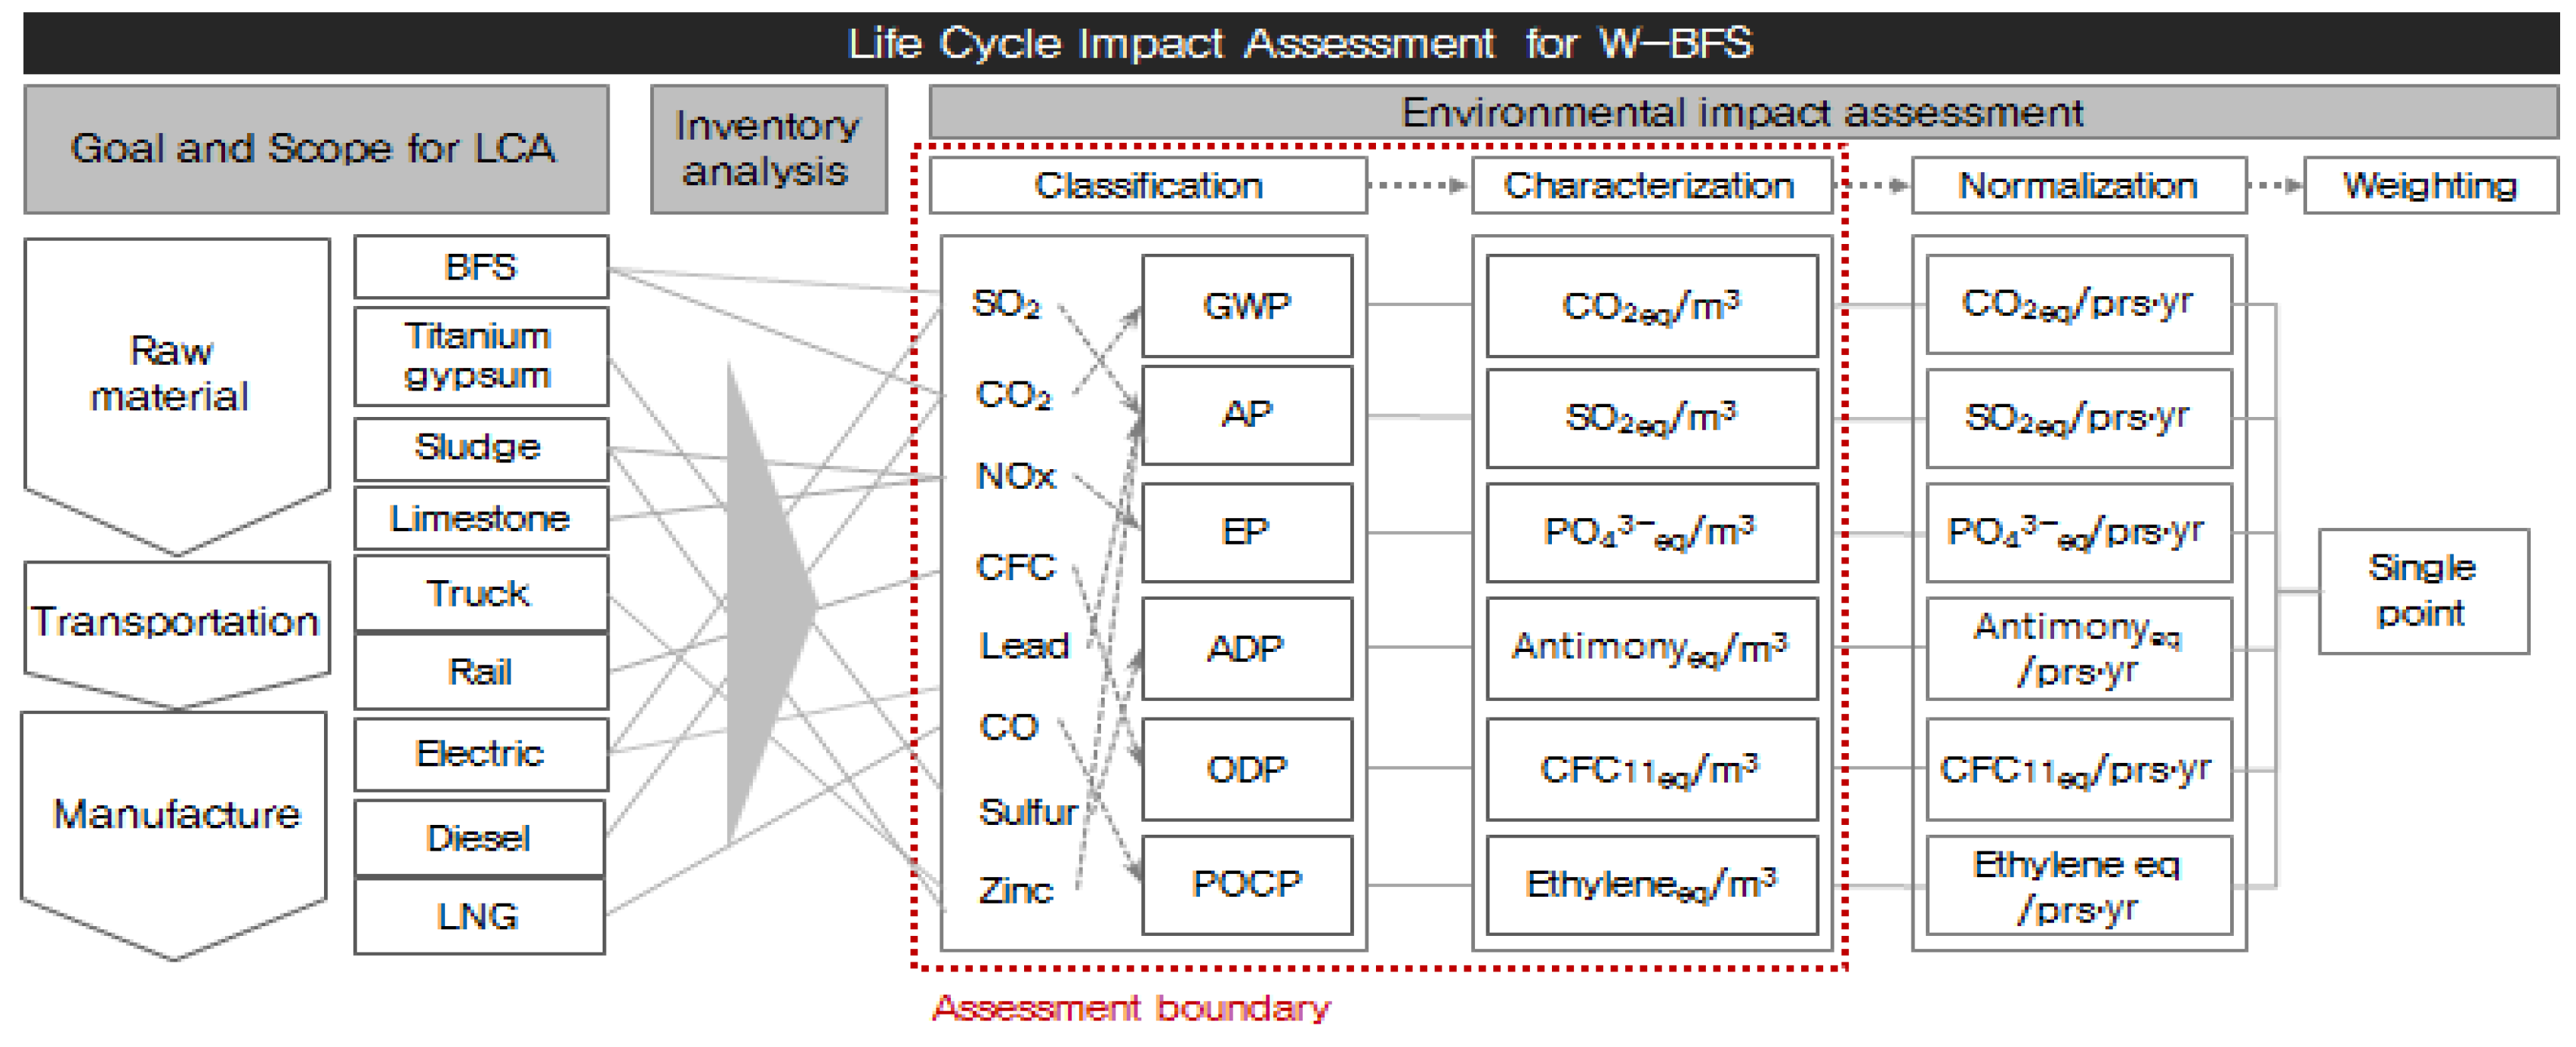
3.2.2. Environmental Impact Assessment
As shown in
Figure 5, environmental impact assessment is divided into the following stages: classification in which the materials derived from inventory analysis are categorized as “environmental impact”; characterization in which the effects of the items categorized as “environmental impact” are quantified; normalization in which the effects on the environmental impact category are divided into total environmental impact by region or period; weighting stage in which relative advantage between impact categories is determined. At present, no normalization and weighting factors are available for W-BFS. In this study, therefore, classification and characterization were only assessed [
26].
The matters produced during the production of W-BFS affect atmosphere and hydrosphere, and the related environmental problems include Global Warming Potential (GWP), Ozone Depletion Potential (ODP), Photochemical Oxidant Creation Potential (POCP), Abiotic Depletion Potential (ADP), Eutrophication Potential (EP) and Acidification Potential (AP) [
27,
28,
29].
Here, CI
i is the size of impact that all the list items (j) included in the impact category i have on the impact category in which they are included. CI
i,j is the size of impact that the list item j has on impact category i, Load
j is the environmental load of the jth list item, and eqv
i,j is the characterization coefficient value of jth list item within impact category I [
30,
31,
32].
Raw Material Stage
In this stage, environmental impact after the production of BFS and additives (titanium gypsum, sludge and limestone) was assessed as shown in
Table 6. Formula (2) shows an example of the GWP (Global Warming Potential).
GWPM is the CO2 emission at the raw material stage for the production of 1 m3 concrete (kg-CO2 eq/m3); M(i) is the amount of material used of concrete (kg/m3); CO2 emission factor M is the CO2 emission factor for each material (kg-CO2 eq/kg).
(a) BFS
BFS is an industrial byproduct that is produced in the manufacture of iron. Unless used as the other product, it is categorized as an industrial waste. Even though a large amount of energy is consumed during the production of iron, and environmental impact substances are produced accordingly, BFS is a byproduct. Therefore, previous industrial process is not included in the scope of environmental impact assessment. A process of creating BFS from iron ore was excluded from the scope of environmental impact assessment [
33,
34].
(b) Waste additive (WA)
A waste additive is comprised of titanium gypsum, sludge and limestone. The environmental impact on the amount of energy consumed during their production, transportation and manufacture has been assessed. As stated in
Table 7, titanium gypsum (0.4 kg), sludge (0.3 kg) and limestone (0.3 kg) were added to produce 1kg of waste additives [
35,
36].
Titanium gypsum, sludge and limestone were transported to the W-BFS manufacturer by truck, and the transportation distance was 89 km, 93 km and 169 km respectively. In addition, it has been confirmed that LNG and electricity were consumed by the manufacturing facilities of the waste additives (furnace, ball mill and conveyor belt).
Transportation Stage
As described in
Table 8, the BFS collected by a steel mill was transported to the W-BFS manufacturing plant by truck, and the transportation distance was 5 km. However, a waste additive (WA) was directly manufactured in the W-BFS manufacturing plant and excluded from the transportation stage assessment. Based on the amount of W-BFS components and carrying capacity of transportation means, the number of transport equipment was estimated, and environmental impact was assessed by applying transportation distance.
Formula (3) shows an example of the GWP (Global Warming Potential).
GWPT is the CO2 emission at the transportation stage for the production of 1 m3 concrete (kg-CO2 eq/m3); CO2 emission factor T is the CO2 emission factor of the energy resource (kg-CO2 eq/kg); M(i) is the amount of material used of concrete (kg/m3); Lt is the transportation load (tons), d is the transportation distance (km); and e is the fuel efficiency (km/L).
Manufacture Stage
A manufacture stage is a process of weighing BFS and W-BFS, adding them to a large slag mill, and mixing and processing them. To assess environmental impact at the manufacture stage, power consumption and the amount of LNG and water used by the manufacturing equipment were investigated as shown in
Table 9. Then, environmental impact by the use of energy sources was assessed. Formula (4) shows an example of the GWP (Global Warming Potential).
GWPF is the CO2 emission at the manufacturing stage for production of 1 kg W-BFS (kg-CO2 eq/kg); R denotes the annual W-BFS production (m3/year); and E(i) denotes the annual energy usage (unit/year); and CO2 emission factor F is the CO2 emission factor (kg-CO2 eq/kwh, L, kg) of an energy resource.
Assessment Result
As stated in
Table 10, the life cycle environmental impacts of W-BFS were 1.12 × 10
−1 kg-CO
2 eq/kg, 4.79 × 10
−4 kg-SO
2 eq/kg, 7.15 × 10
−4 kg-PO
43− eq/kg, 1.59 × 10
−8 kg-CFC
11 eq/kg, 3.18 × 10
−5 kg-Ethylene eq/kg and 3.94 × 10
−3 kg-Antimony eq/kg in GWP, AP, EP, ODP, POCP and ADP respectively.
Among the environmental impact category, GWP and AP were 9.28 × 10
−2 kg-CO
2 eq/kg and 3.33 × 10
−4 kg-SO
2 eq/kg at a raw material stage, accounting for 80% and 70% of total environmental impact respectively [
37].
They were caused by LNG which was used in calcination equipment at the production of waste admixture (W) because of the direct and indirect emission of CO2, CH4, SO2 and H2S which affect GWP and AP while using LNG. In EP, POCP and ADP, in addition, raw material stage accounted for a great portion in total environmental impact because of “W” among input materials. It was confirmed that nitrogen oxides (NOx), ammonia (NH3), crude oil, natural gas, carbon monoxide (CO) produced during the production and transportation of the components of ‘W’ (titanium gypsum, sludge and limestone) were influential.
In ODP, however, compared to the environmental impact of raw materials, oil that was used in transporting BFS to the W-BFS manufacturing factory was more influential. Trichloro-fluoro-methane (CFC-11), Hydro-chloro-fluoro-carbons (HCFC-22) and Halon-1301 produced after the use of diesel oil have been derived as major substances. The environmental impact caused by the electricity, LNG and industrial water used in the manufacturing facilities of W-BFS was very minor.
In addition, the cost of W-BFS under the Korean price database was approximately 41.7 US$/ton. Compared to general BFS, it was reduced by 17%. We were able to reduce cost with the use of waste additive instead of expensive natural gypsum, which is used in ordinary BFS. Even though cost occurred with the use of LNG and electricity during the calcination process at the production of ‘W,’ it was lower than the natural gypsum input cost [
38]. As shown in
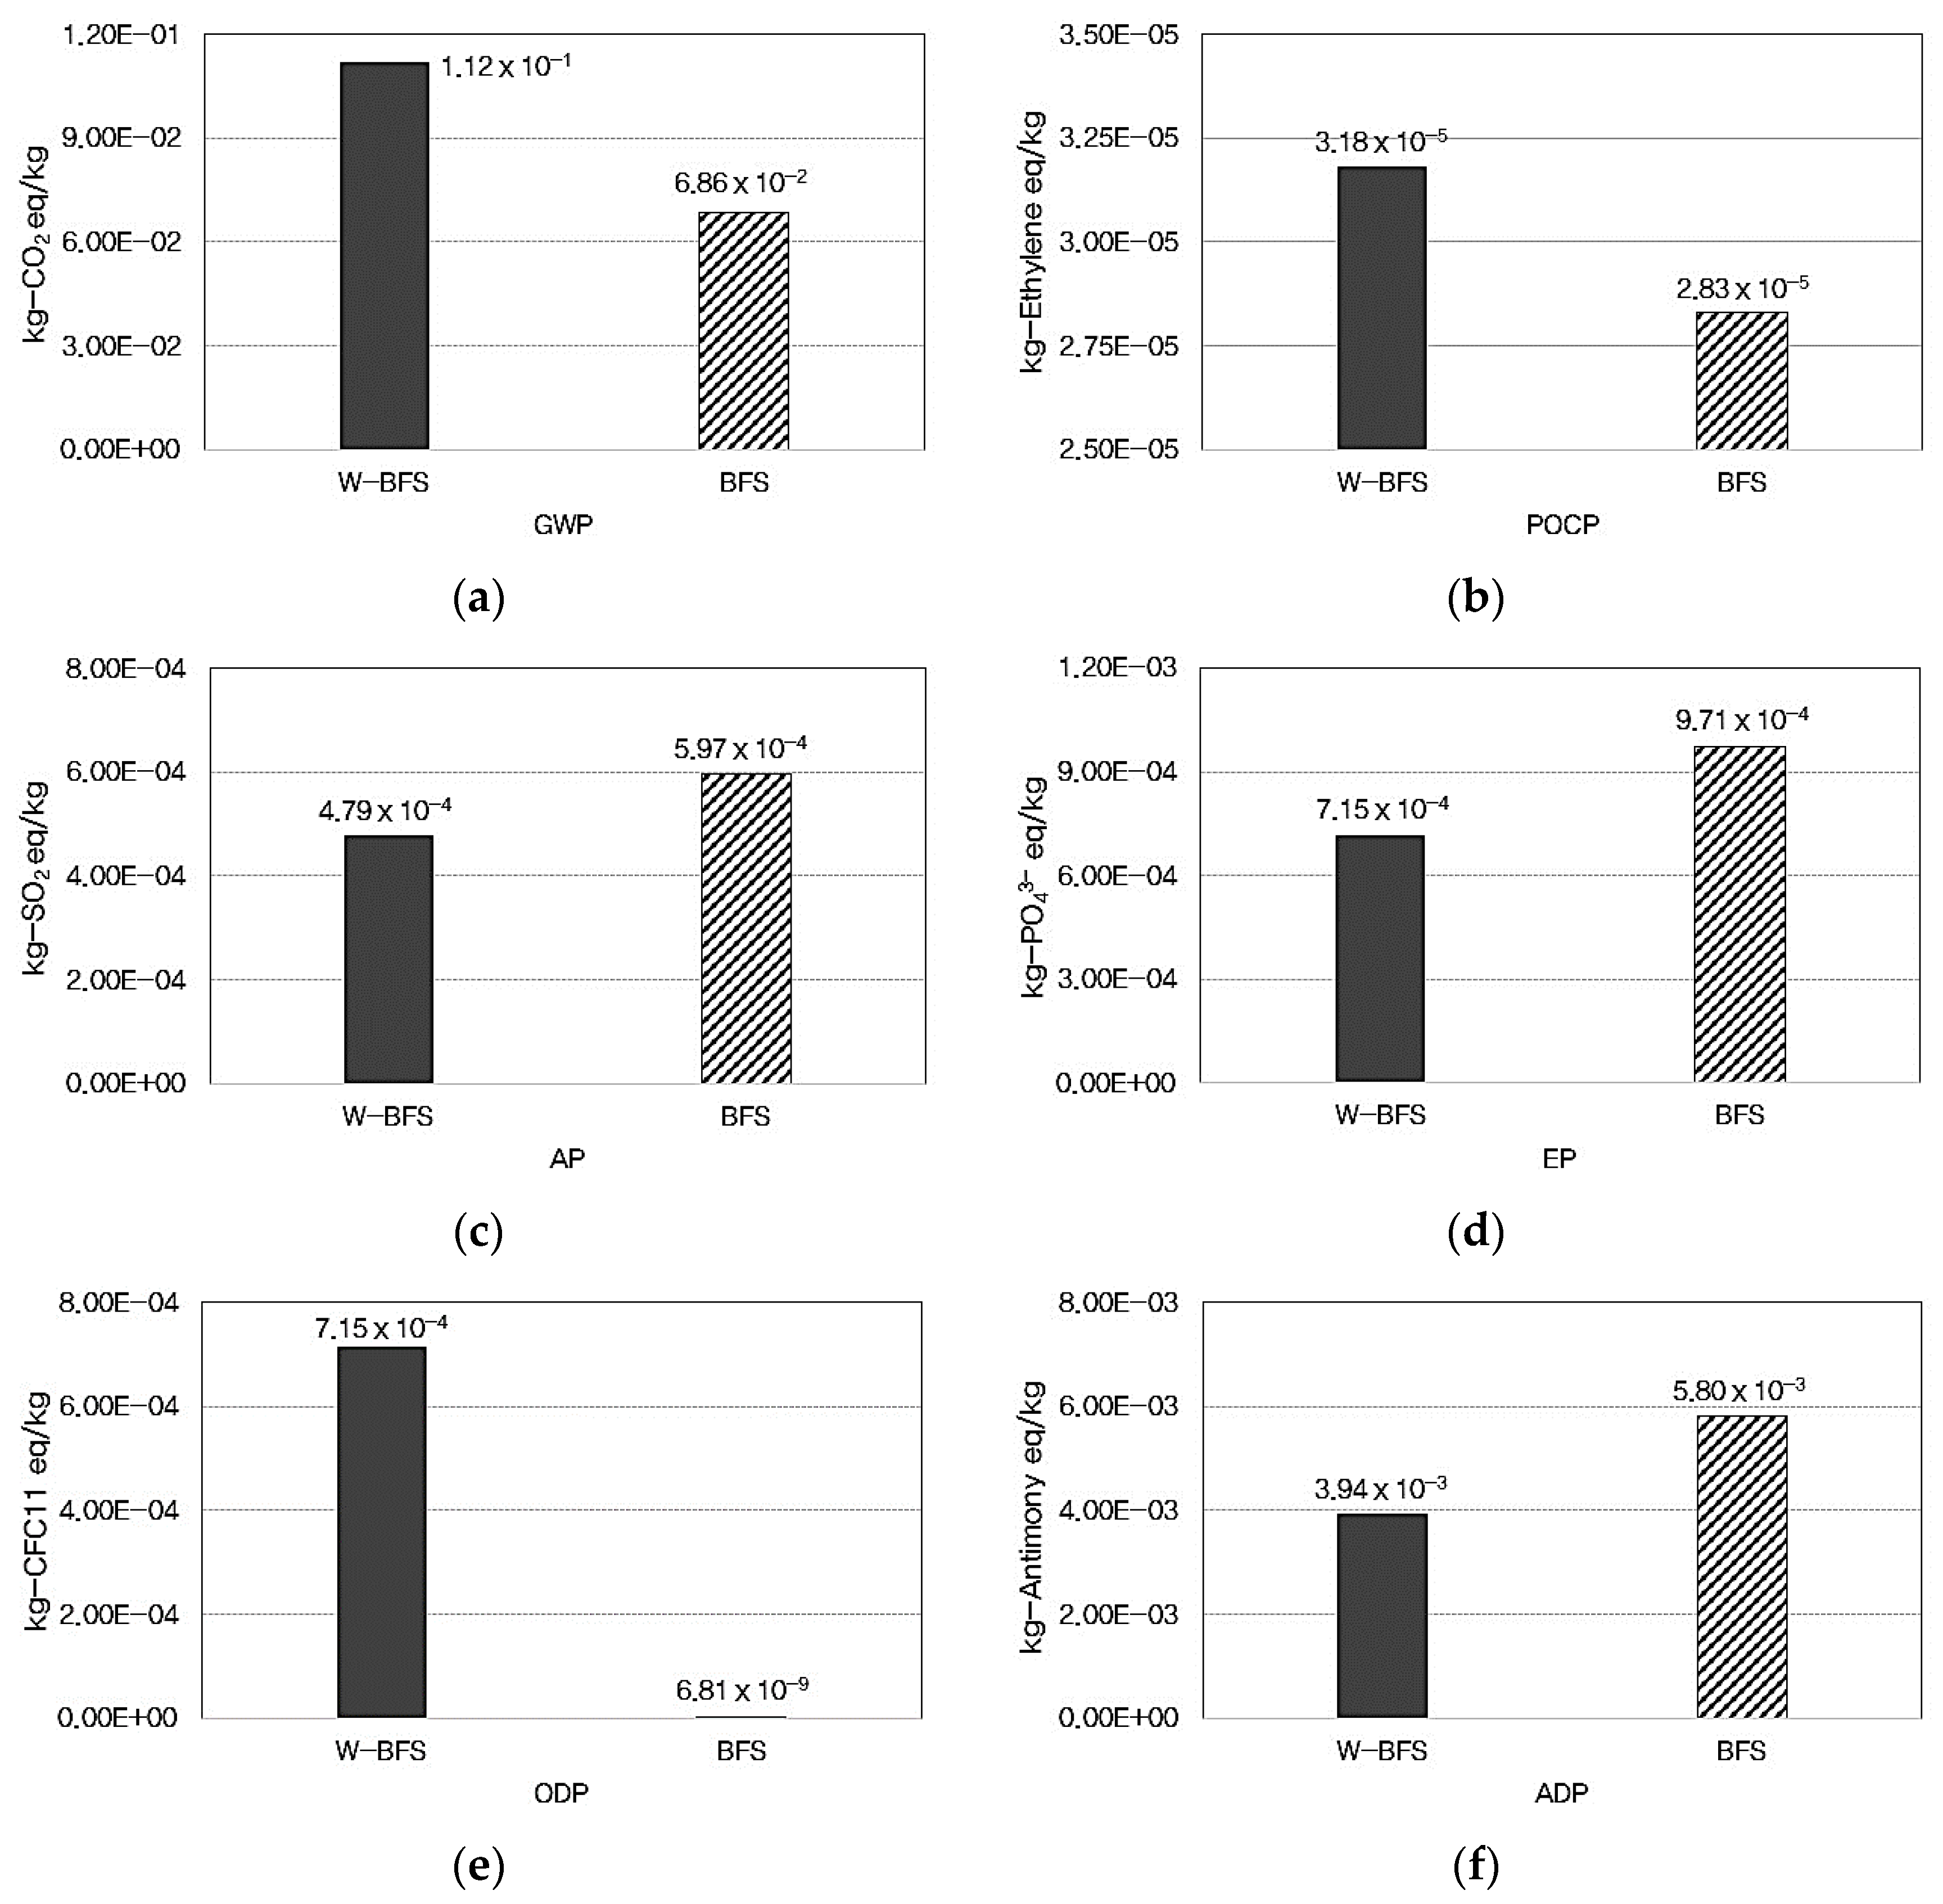
Figure 6, W-BFS and general BFS were compared in terms of environmental impact.
As shown in
Figure 6a,b, W-BFS was greater than general BFS by 50% and 10% in GWP and POCP respectively because energy consumption during calcination was higher in the production of W-BFS.
However, W-BFS was lower than general BFS by 20%, 25% and 32% in AP, EP and ADP each due to decrease in soil acidification and water eutrophication after recycling industrial wastes which would be buried and incinerated at the production of waste additives. With the recycling of industrial wastes, furthermore, the consumption of natural resources such as antimony, hard coal, lead (Pb) and uranium (U) was reduced, having an effect on ADP [
39].
In terms of ODP, W-BFS was far greater than general BFS because of high transportation distance and large consumption of transportation equipment during the production of W-BFS. As the consumption of diesel oil increased, as a result, the emission of CFC, HCFC and Halon, which have an effect on ODP, rose considerably [
40].
3.3. Environmental Impact Assessment of Concrete Mixing W-BFS
3.3.1. Assessment Method
The environmental impact of the mixed concrete (W-BFS or general BFS) was assessed. For this, subjects were classified into five cases depending on the mixing ratio (%) as stated in
Table 11 [
41]. Case 1 is a basic mixture, which refers to OPC without any BFS or A-BFS while Cases 2 and 3 refer to mixed concrete having 10% “general BFS or W-BFS”. In addition, Cases 4 and 5 represent concrete mixture with 20% “general BFS or W-BFS”. Among the concrete mixing materials, however, aggregate, water and chemical admixture were mixed in the same proportion [
42].
3.3.2. Assessment Result
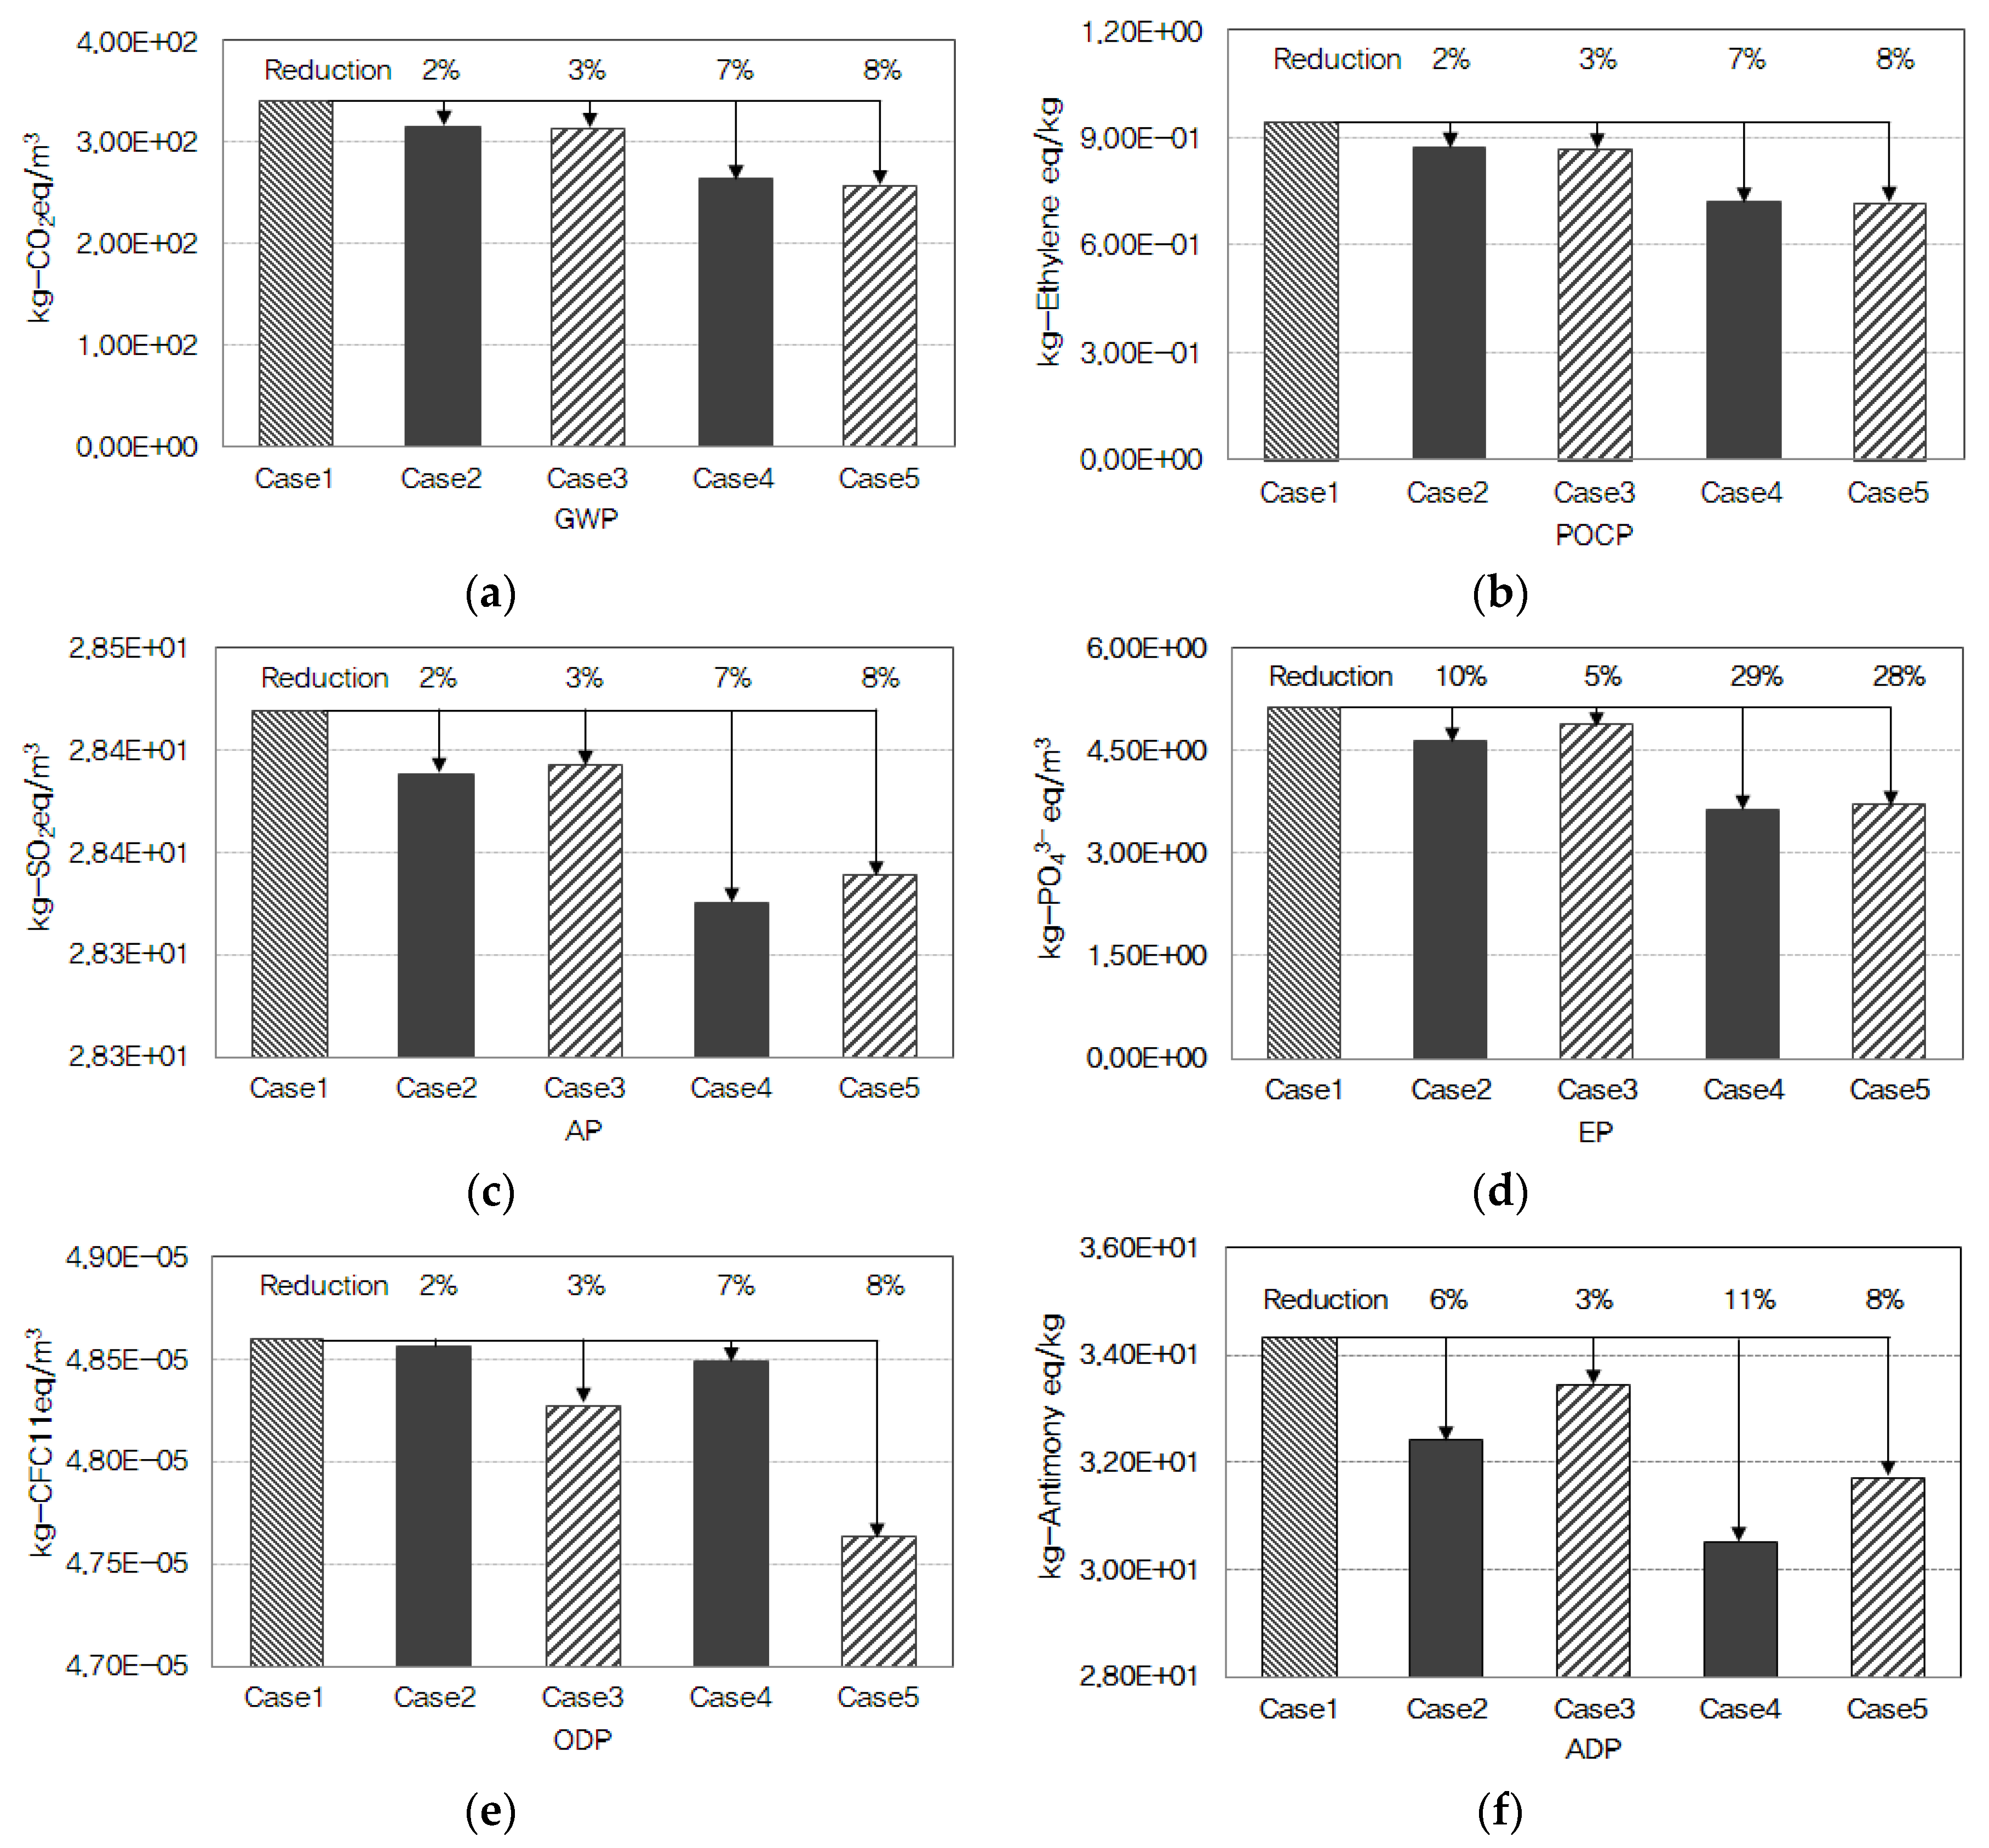
As stated in
Table 12, the mixed concrete (W-BFS or general BFS) was compared to plain concrete (Case 1) in terms of environmental impact.
In terms of GWP and POCP as shown in
Figure 7a,b, the mixed concrete was lower than Case 1 by 10%–25% as the mixing ratio (W-BFS + BFS) increased by 10% (Cases 2 and 4) and 30% (Cases 3 and 5). This result stems from the little production of the major impact substances of GWP and POCP (CO
2, CH
4, N
2O, CO, Ethane (C
2H
6), Sulfur (S)) during the production of W-BFS and BFS in the mixed concrete [
43,
44].
In terms of AP and EP as shown in
Figure 7c,d, the mixed concrete was lower than Case 1 by 5%–30% as the mixing ratio (W-BFS + BFS) increased by 10% (Cases 2 and 4) and 30% (Cases 3 and 5). This result originates from the little production of the major impact substances of AP (Sulfur dioxide (SO
2), Ammonia (NH
3), Nitrogen oxide (NO
x), Ammonium (NH
4),
etc.) during the production of W-BFS and BFS in the mixed concrete. In particular, the W-BFS-mixed concrete made of industrial wastes was lower than BFS-mixed concrete by 5%–10% [
45,
46].
In terms of ADP as shown in
Figure 7f, the mixed concrete was lower than Case 1 by 3%–11% as the mixing ratio (W-BFS + BFS) increased by 10% (Cases 2 and 4) and 30% (Cases 3 and 5). As a result, it was able to reduce the consumption of common cement comprised of natural resources such as limestone, clay, iron ore and silica with the mixture of industrial byproducts “W-BFS” and “BFS”. With decrease in the consumption of ordinary cement, the emission of the ADP-causing substances such as iron (Fe), natural gas, hard coal, lead (Pb) and uranium (U) decreased. Even though the mixing ratio (W-BFS and BFS) increased by 10% (Cases 2 and 4) and 30% (Cases 3 and 5), there was no effect on ODP [
47,
48]. As shown in
Figure 6e, there was a significant difference in ODP between W-BFS and BFS. Therefore, considerable impact was anticipated when they were added to concrete. According to analysis on concrete components, however, aggregate was greater than common cement, W-BFS and BFS in terms of ODP as shown in
Figure 7e. Therefore, the effect on concrete ODP was minor [
49,
50].
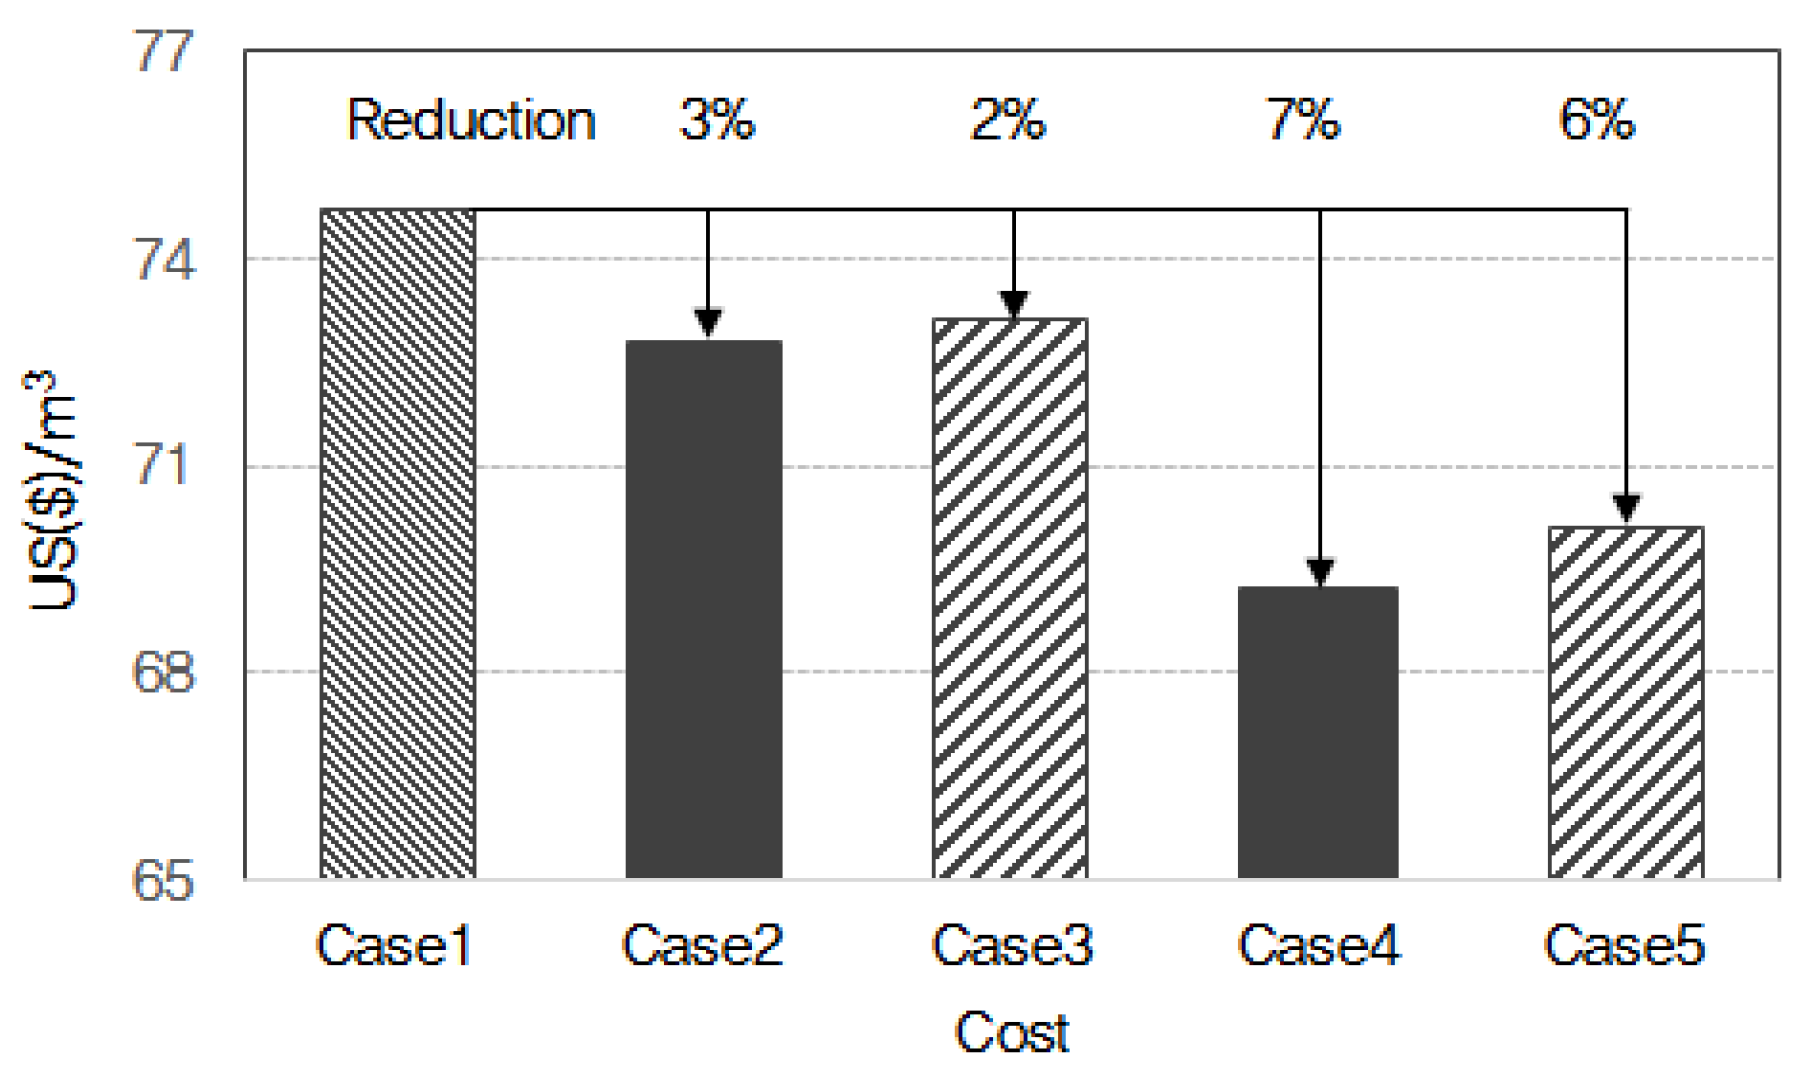
As shown in
Figure 8, the cost in each case was as follows: 75 (US$/m
3), 72 (US$/m
3), 73 (US$/m
3), 69 (US$/m
3) and 70 (US$/m
3). In terms of cost, Cases 2 and 3 with 10% ‘W-BFS + general BFS’ were lower than Case 1 by 3% and 2% respectively. In other words, among the concrete components, the mixing ratio of common cement with high production costs was a factor to reduce costs. As estimated in this study, in particular, W-BFS (US$41.7/ton) was lower than common cement (US$100.3/ton) by about 60% in terms of manufacturing costs. If W-BFS was added up to 30% (Case 4) based on the results of a physical test on the W-BFS-mixed concrete, it would’ve been able to reduce cost by 1 US$/m
3 compared to Case 5. If the amount of concrete released in the capital region (as of 2013) is applied, for example, it is expected to save 45,082,433 (US$/m
3) [
51,
52,
53].
4. Discussion and Limitations
As shown in
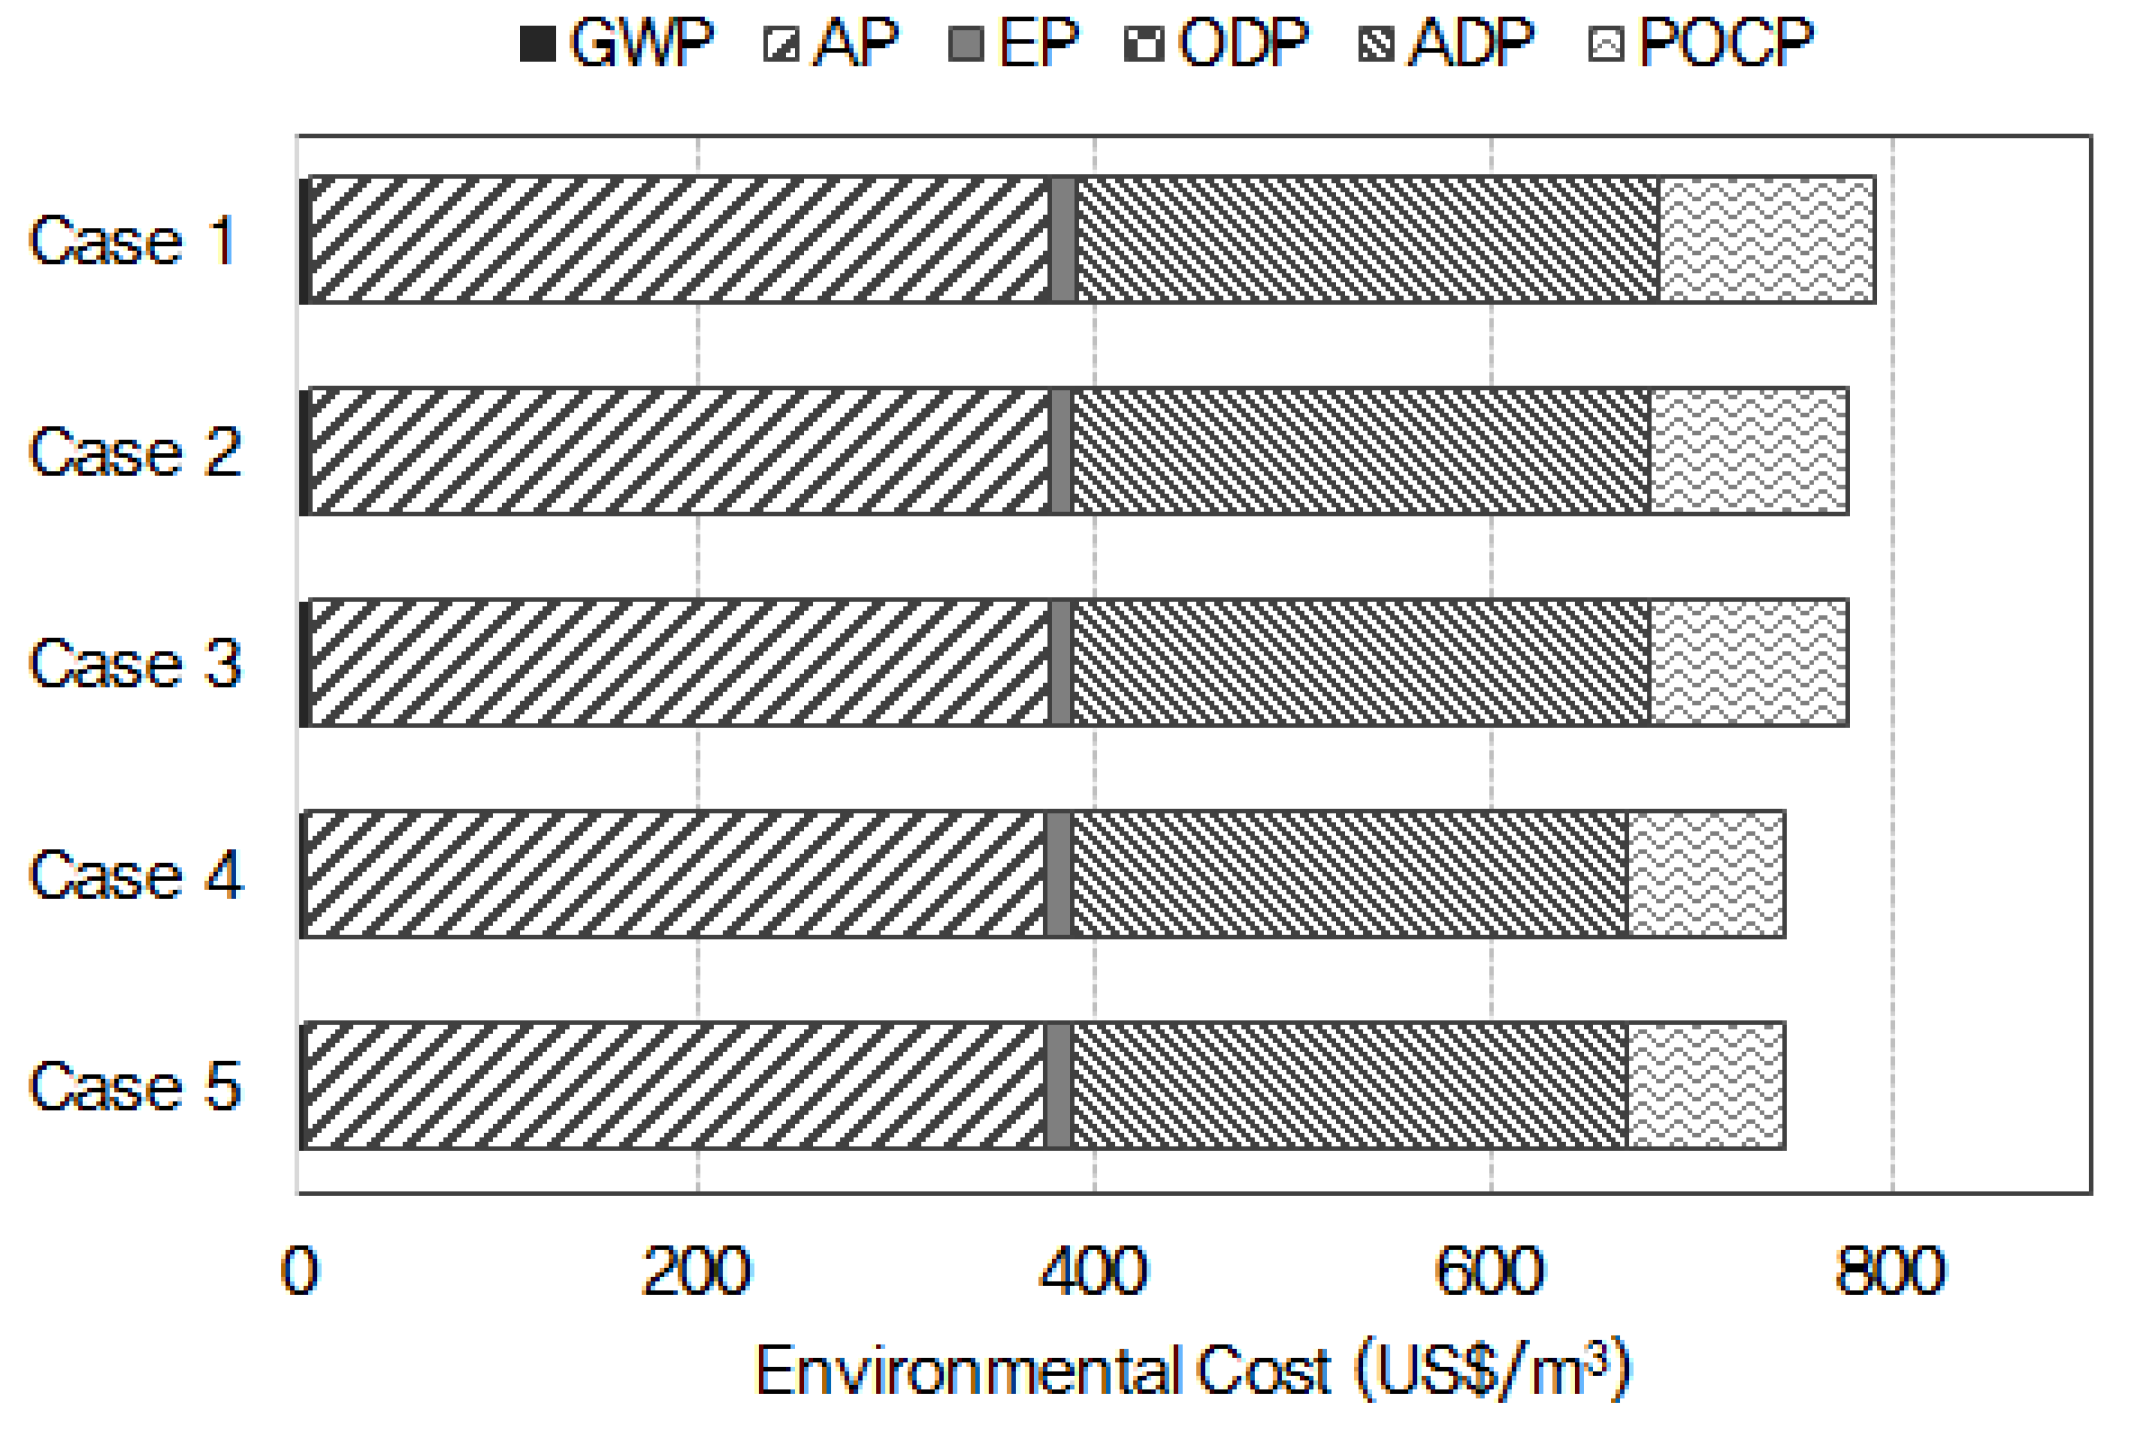
Figure 7, W-BFS-mixed concrete was slightly higher than general BFS-mixed concrete in terms of GWP and ODP. However, the former was lower than the latter in terms of AP and ADP. In terms of EP and POCP, in contrast, the two were almost same. With the results of the environmental impact assessment derived from a mid-point method, it is hard to tell which concrete has great environmental performances. Since a unit differs by the environmental impact category, it is unable to conduct integrated assessment and comparison. If an end-point method among LCIA techniques is applied, it would therefore be able to select concrete with great environmental performances and perform quantitative analysis. An end-point method is a technique which estimates the effects of environmental impact substances on human health and ecosystem using the results of diverse natural science researches such as toxicology and biomechanics and represents them in a single index (or environmental cost) after determining weighted values [
54,
55,
56,
57,
58,
59]. When an end-point method was adopted as shown in
Figure 9, Case 1 was about 792 US$/m
3 while Cases 2 and 3 were 777 US$/m
3 in terms of environmental costs. In addition, Cases 4 and 5 were 747 US$/m
3 (decrease by about 6%). Among the integrated environmental costs, AP accounted for the greatest portion, which means its significant damage on human health and ecosystem. In addition, ADP and POCP were high in terms of environmental costs. However, GWP was lower than AP, ADP and POCP in terms of environmental costs. Therefore, there should be environmental impact assessment on other aspects such as AP, EP and ADP as well as greenhouse gas-centered GWP at environmental assessment on construction materials.
In terms of limitations, this study failed to test shrinkage, plastic shrinkage, carbonation, sulfate resistance, freezing and thawing, and salt damage in assessing concrete durability. Regarding the development of W-BFS, at present, very basic study results are just derived. Therefore, compressive strength and adiabatic temperature rise were considered as the factors to assess concrete durability. Since concrete durability differs depending on deterioration, difference can occur depending on BFS and W-BFS mixing ratios. For example, an addition of the admixture (BFS) at assessment of the carbonation of reinforced concrete reduces concrete durability.
Concrete is not directly degraded by carbonation. If the carbonation of a reinforced concrete structure reaches up to the surface of a reinforcing rod beyond the cover thickness, the passivity layer around the reinforcing rod is destructed, initiating corrosion. In addition, additions of internal sulfate (in the form of gypsum, CaSO4) increased to the concrete, which may induce internal sulfate attack at later stages of the concrete's in-service lifetime.
Therefore, a durability test on diverse concrete deteriorations is very important. Hence, there will be further studies on concrete durability considering deteriorations such as carbonation, salt damage and shrinkage as well as sulfate resistance.
5. Conclusions
Waste additives have been developed by mixing and burning industrial wastes such as titanium gypsum and sludge. After mixing them with BFS, W-BFS, which reveals better performances than general BFS with reduced environmental impact was developed. The environmental impacts of W-BFS were as follows: 1.12 × 10⁻¹ kg-CO2 eq/kg, 3.18 × 10⁻⁵ kg-Ethylene eq/kg, 4.79 × 10⁻⁴ kg-SO2 eq/kg, 7.15 × 10⁻⁴ kg-PO43− eq/kg, 7.15 × 10⁻⁴ kg-CFC11 eq/kg and 3.94 × 10⁻³ kg-Antimony eq/kg. In terms of GWP, POCP and ODP, W-BFS was higher than general BFS. In terms of AP, EP and ADP, in contrast, the former was lower than the latter.
In terms of cost, W-BFS (41.7 US$/ton) was lower than general BFS by about 17% because of the use of waste additives comprised of industrial wastes instead of natural gypsum, which has been commonly used in general BFS. In terms of GWP and POCP, the W-BFS mixed (30%) concrete was lower than plain concrete by 25%. In terms of AP and EP, the former was lower than the latter by 30%. In terms of ADP, furthermore, W-BFS mixed (30%) concrete was lower than plain concrete by 11%. In aggregate-related ODP, however, almost no change was found. In terms of cost, when W-BFS was added by 10% and 30%, it was able to reduce cost by 3% and 7% respectively, compared to plain concrete. Compared to BFS-mixed concrete as well, cost could be saved by 1% additionally because W-BFS (US$41.7/ton) is lower than common cement (US$100.3/ton) by about 60% in terms of production costs. According to a physical test on the W-BFS-mixed (30%) concrete, its compressive strength was equal or greater than OPC. Since 3-day compressive strength was 19.8 MPa, in particular, it is able to remove the forms early. If it is applied to RC structure, therefore, it is expected to shorten construction period and reduce construction cost as well as to lower environmental impacts.


