Article

Feasibility Analyses of Developing Low Carbon City with Hybrid Energy Systems in China: The Case of Shenzhen

1
Key Laboratory of Road and Traffic Engineering of the Ministry of Education, Tongji University, Shanghai 201804, China
2
Scientific Research Academy, Shanghai Maritime University, Shanghai 201306, China
3
Energy Analysis and Environmental Impacts Division, Lawrence Berkeley National Laboratory, Berkeley, CA 94720, USA
4
Research Center on Modern Logistics, Graduate School at Shenzhen, Tsinghua University, Shenzhen 518055, China
5
Department of Energy Economics, School of Economics, Renmin University of China, Beijing 100872, China
6
Institutes for International Studies, CICTSMR, Wuhan University, Wuhan 430072, China
*
Author to whom correspondence should be addressed.
These authors contributed equally to this~work.
Sustainability 2016, 8(5), 452; https://doi.org/10.3390/su8050452
Submission received: 3 March 2016 / Revised: 29 April 2016 / Accepted: 2 May 2016 / Published: 6 May 2016
(This article belongs to the Section Sustainable Urban and Rural Development)

Abstract

:
As the largest carbon emission source in China, the power sector grows rapidly owing to the country’s unprecedented urbanization and industrialization processes. In order to explore a low carbon urbanization pathway by reducing carbon emissions of the power sector, the Chinese government launched an international low carbon city (ILCC) project in Shenzhen. This paper presents a feasibility analysis on the potential hybrid energy system based on local renewable energy resources and electricity demand estimation over the three planning stages of the ILCC project. Wind power, solar power, natural gas and the existing power grid are components considered in the hybrid energy system. The simulation results indicate that the costs of energy in the three planning stages are 0.122, 0.105 and 0.141 $/kWh, respectively, if external wind farms and pumped storage hydro stations (PSHSs) exist. The optimization results reveal that the carbon reduction rates are 46.81%, 62.99% and 75.76% compared with the Business as Usual scenarios. The widely distributed water reservoirs in Shenzhen provide ideal conditions to construct PSHS, which is crucial in enhancing renewable energy utilization.

1. Introduction

China has become the world’s largest carbon emitter since 2009 [1]. The share of China’s contribution to the global carbon emissions has doubled from 14% in 2000 to 29% in 2013 [2]. The rapid urbanization and industrialization processes in the past three decades have been the key driving forces for the surge in China’s carbon emissions. Electricity is the main form of energy consumption in the urban area and its share in the total energy use reached 39% in 2010 in China, while this figure was merely 21% in 1980 [3]. Due to the energy resource endowments, China’s power sector has been dominated by coal-fired power plants and thus known by its high carbon emission intensity [4]. As the urbanization rate and electricity consumption will continue to increase in China, switching to a power system with a low carbon emission intensity is of great significance for the sustainable development of the country’s power sector [3]. When the carbon reduction potential is limited by only improving the efficiency of existing power plants, the Chinese government pays special attention to diversifying the country's energy mix and exploiting different sources of cleaner energy, such as natural gas, wind power and solar energy [5]. However, the contribution of wind power to the electricity supply has not increased as expected due to various reasons such as power grid construction lag and lack of effective policy support [6]. Especially, a large amount of wind power was curtailed due to grid constraints [7]. In order to minimize wind power curtailment and reduce carbon intensity, the Chinese government has increasingly realized the importance of developing distributed power generation systems which are located near the demand sites [8]. As a result, it is of great value to make a scientific calculation on the energy combination ratio according to local energy demand and energy source conditions [9].
Urbanization is the key driver of energy usage, and China’s urbanization process is accelerating and will continue to do so for decades [10,11]. In order to explore a low carbon urbanization path, the Chinese government has selected several provinces and cities for a national low carbon development pilot project [12]. However, the city government in China has very limited ability to promote local low carbon development through traditional power supply side management because building large power plants and the expanding power grid are decided by the central government and the two state-owned grid companies [13,14,15]. Regarding the difficulty in promoting low carbon city development in China, a feasible solution is to develop a hybrid energy system based on the distributed micro-grid technology [16,17,18]. The concept of a distributed micro-grid has increasingly gained attention worldwide since it was introduced by the US Electric Power Research Institute in 2001 [17]. A series of studies have been carried out to investigate the applications of hybrid energy systems. Ho (2014) developed a decision model to assess the energy conservation and renewable energy potential of micro-grid applications in campuses [19]. Lu (2015) performed a comparison study on two design optimization methods for renewable energy systems in buildings [20]. Bin (2012) presented a study on an island in China powered by distributed renewable energy based on local resources [21]. Vettorato (2011) applied spatial and statistical analyses to estimate and compare the potential supply of renewable energy sources and the energy demand of buildings at local scale [22]. Braslavsky (2015) presented a case study on optimal options for distributed energy resources to reduce carbon emissions using the Distributed Energy Resources Customer Adoption Model tool according to on-site-specific demand, tariffs and performance data for each distributed energy resource technology option available in a large retail shopping center in Sydney [23].
Building upon previous literature, this paper presents a feasibility analysis on a hybrid energy system which is under design for the city of Shenzhen. The contributions of this study are highlighted as follows: (1) to develop a low carbon energy model that combines hybrid renewable energy generation components for a low carbon demonstration city; and (2) to discuss its economic feasibility and the critical impact factors.
The rest of this paper is organized as follows: Section 2 introduces the proposed renewable energy model and the major mathematical relationship of the optimization model. Section 3 presents the model optimization results and makes a sensitive analysis to figure out the key parameters and their influence on the system. Section 4 is the conclusion of this paper.

2. Methodology

2.1. Model Description

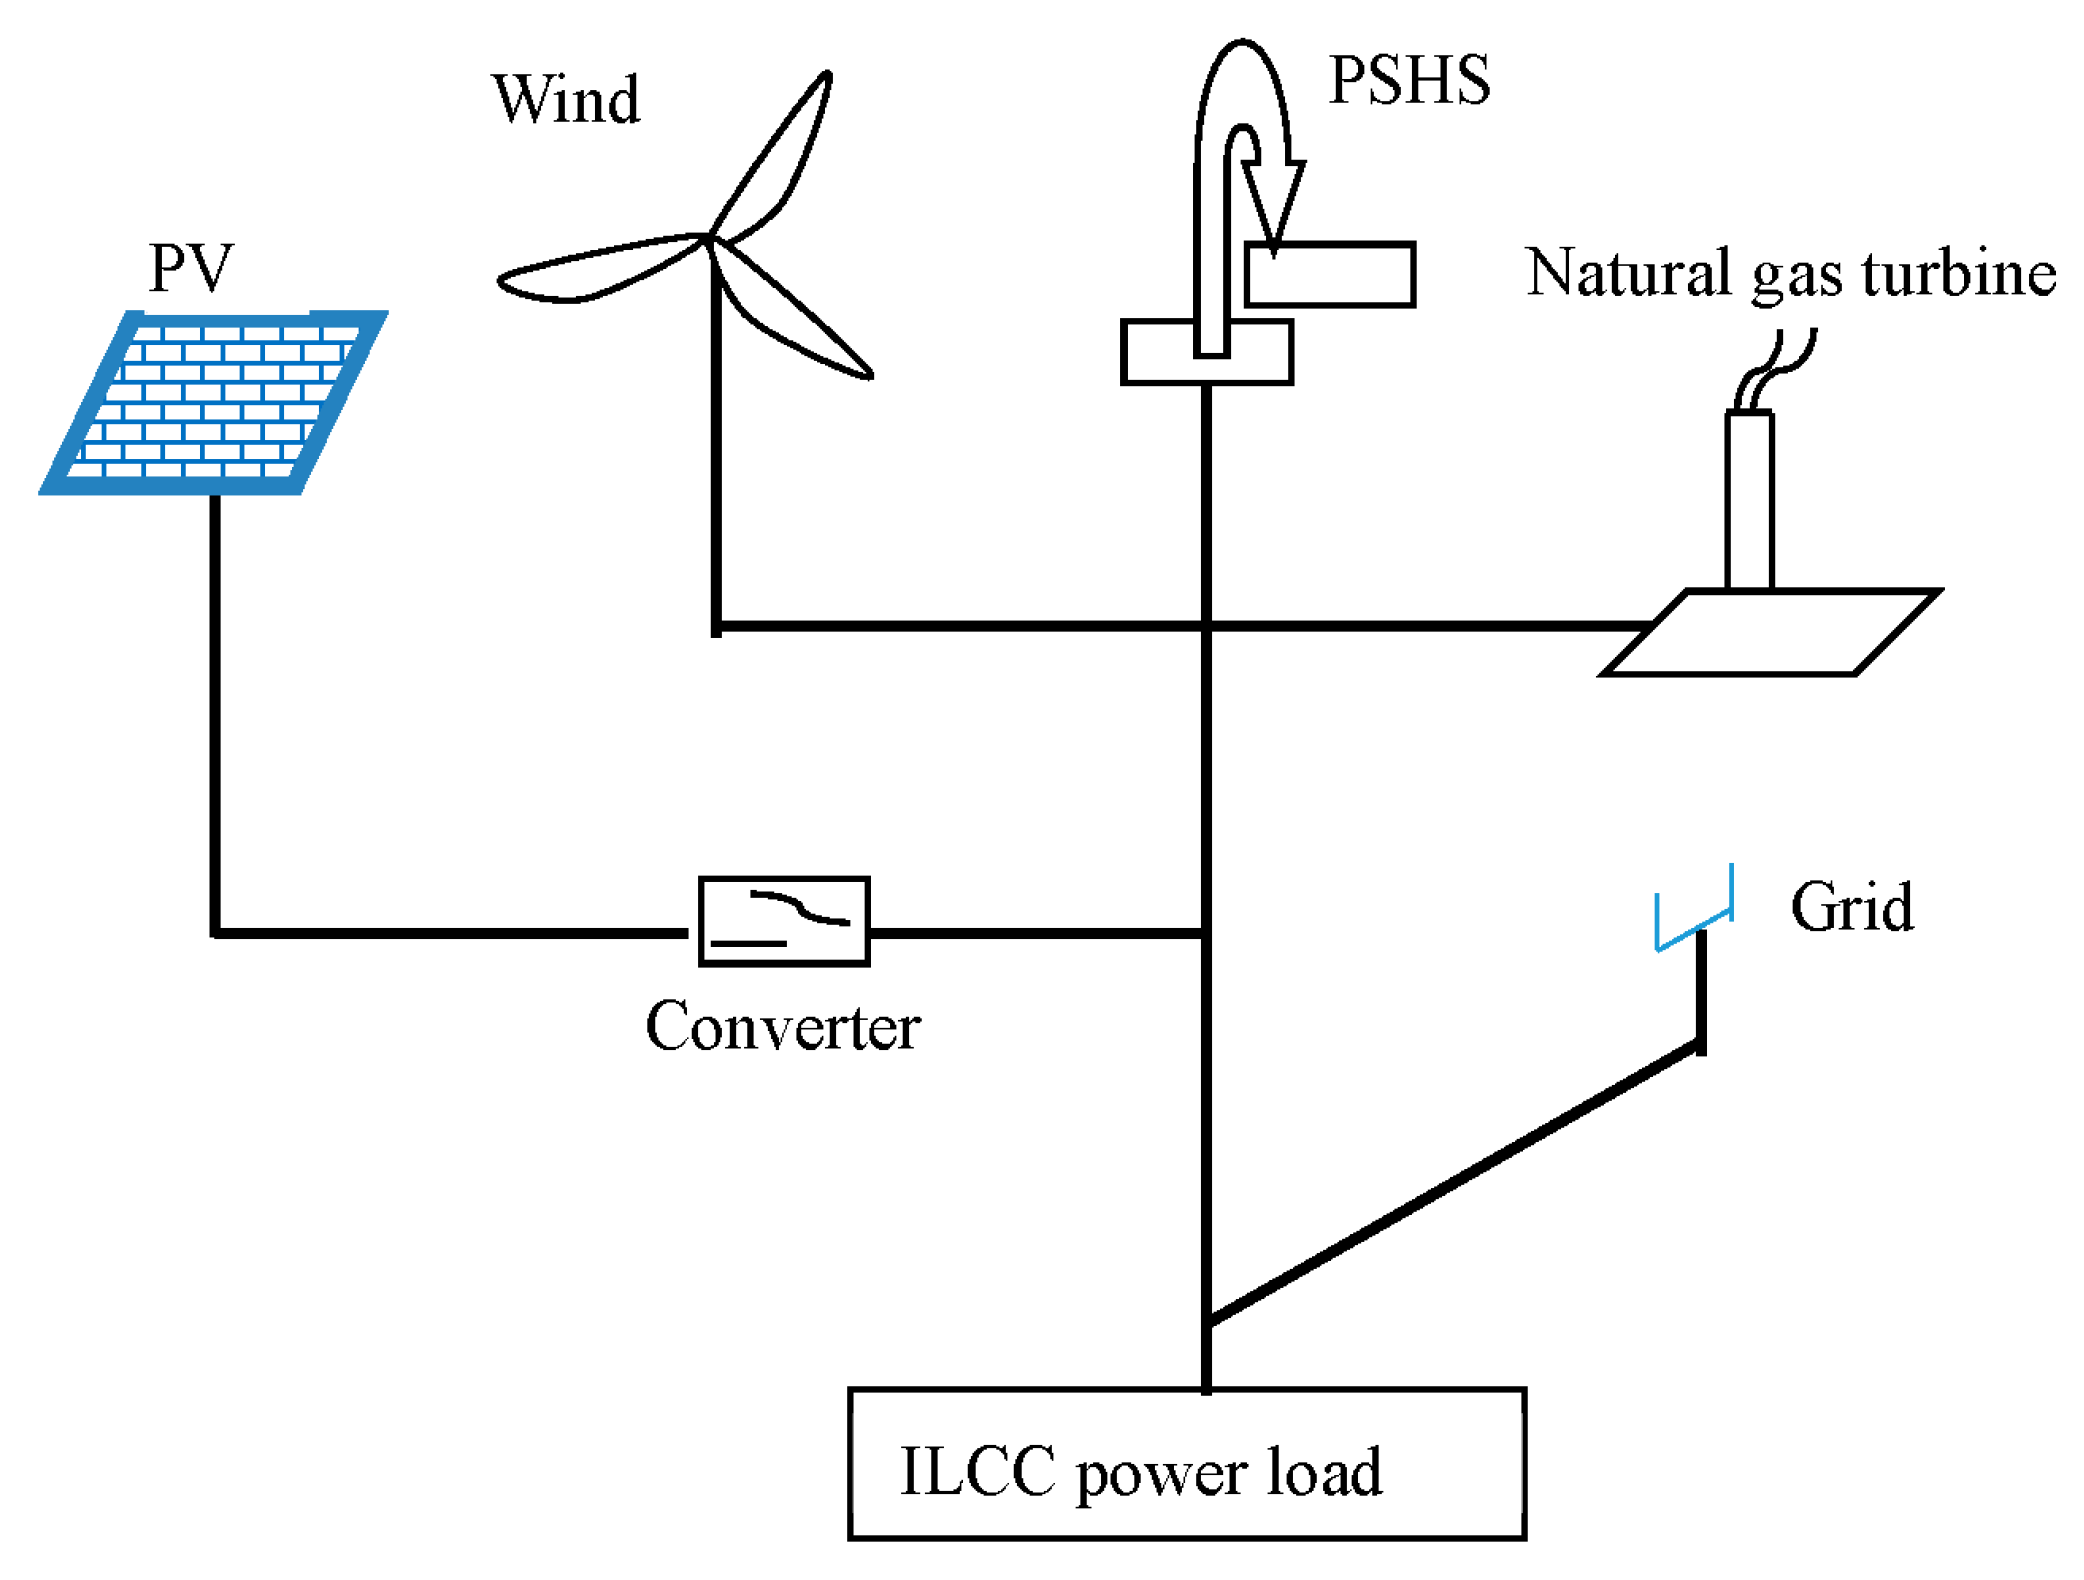
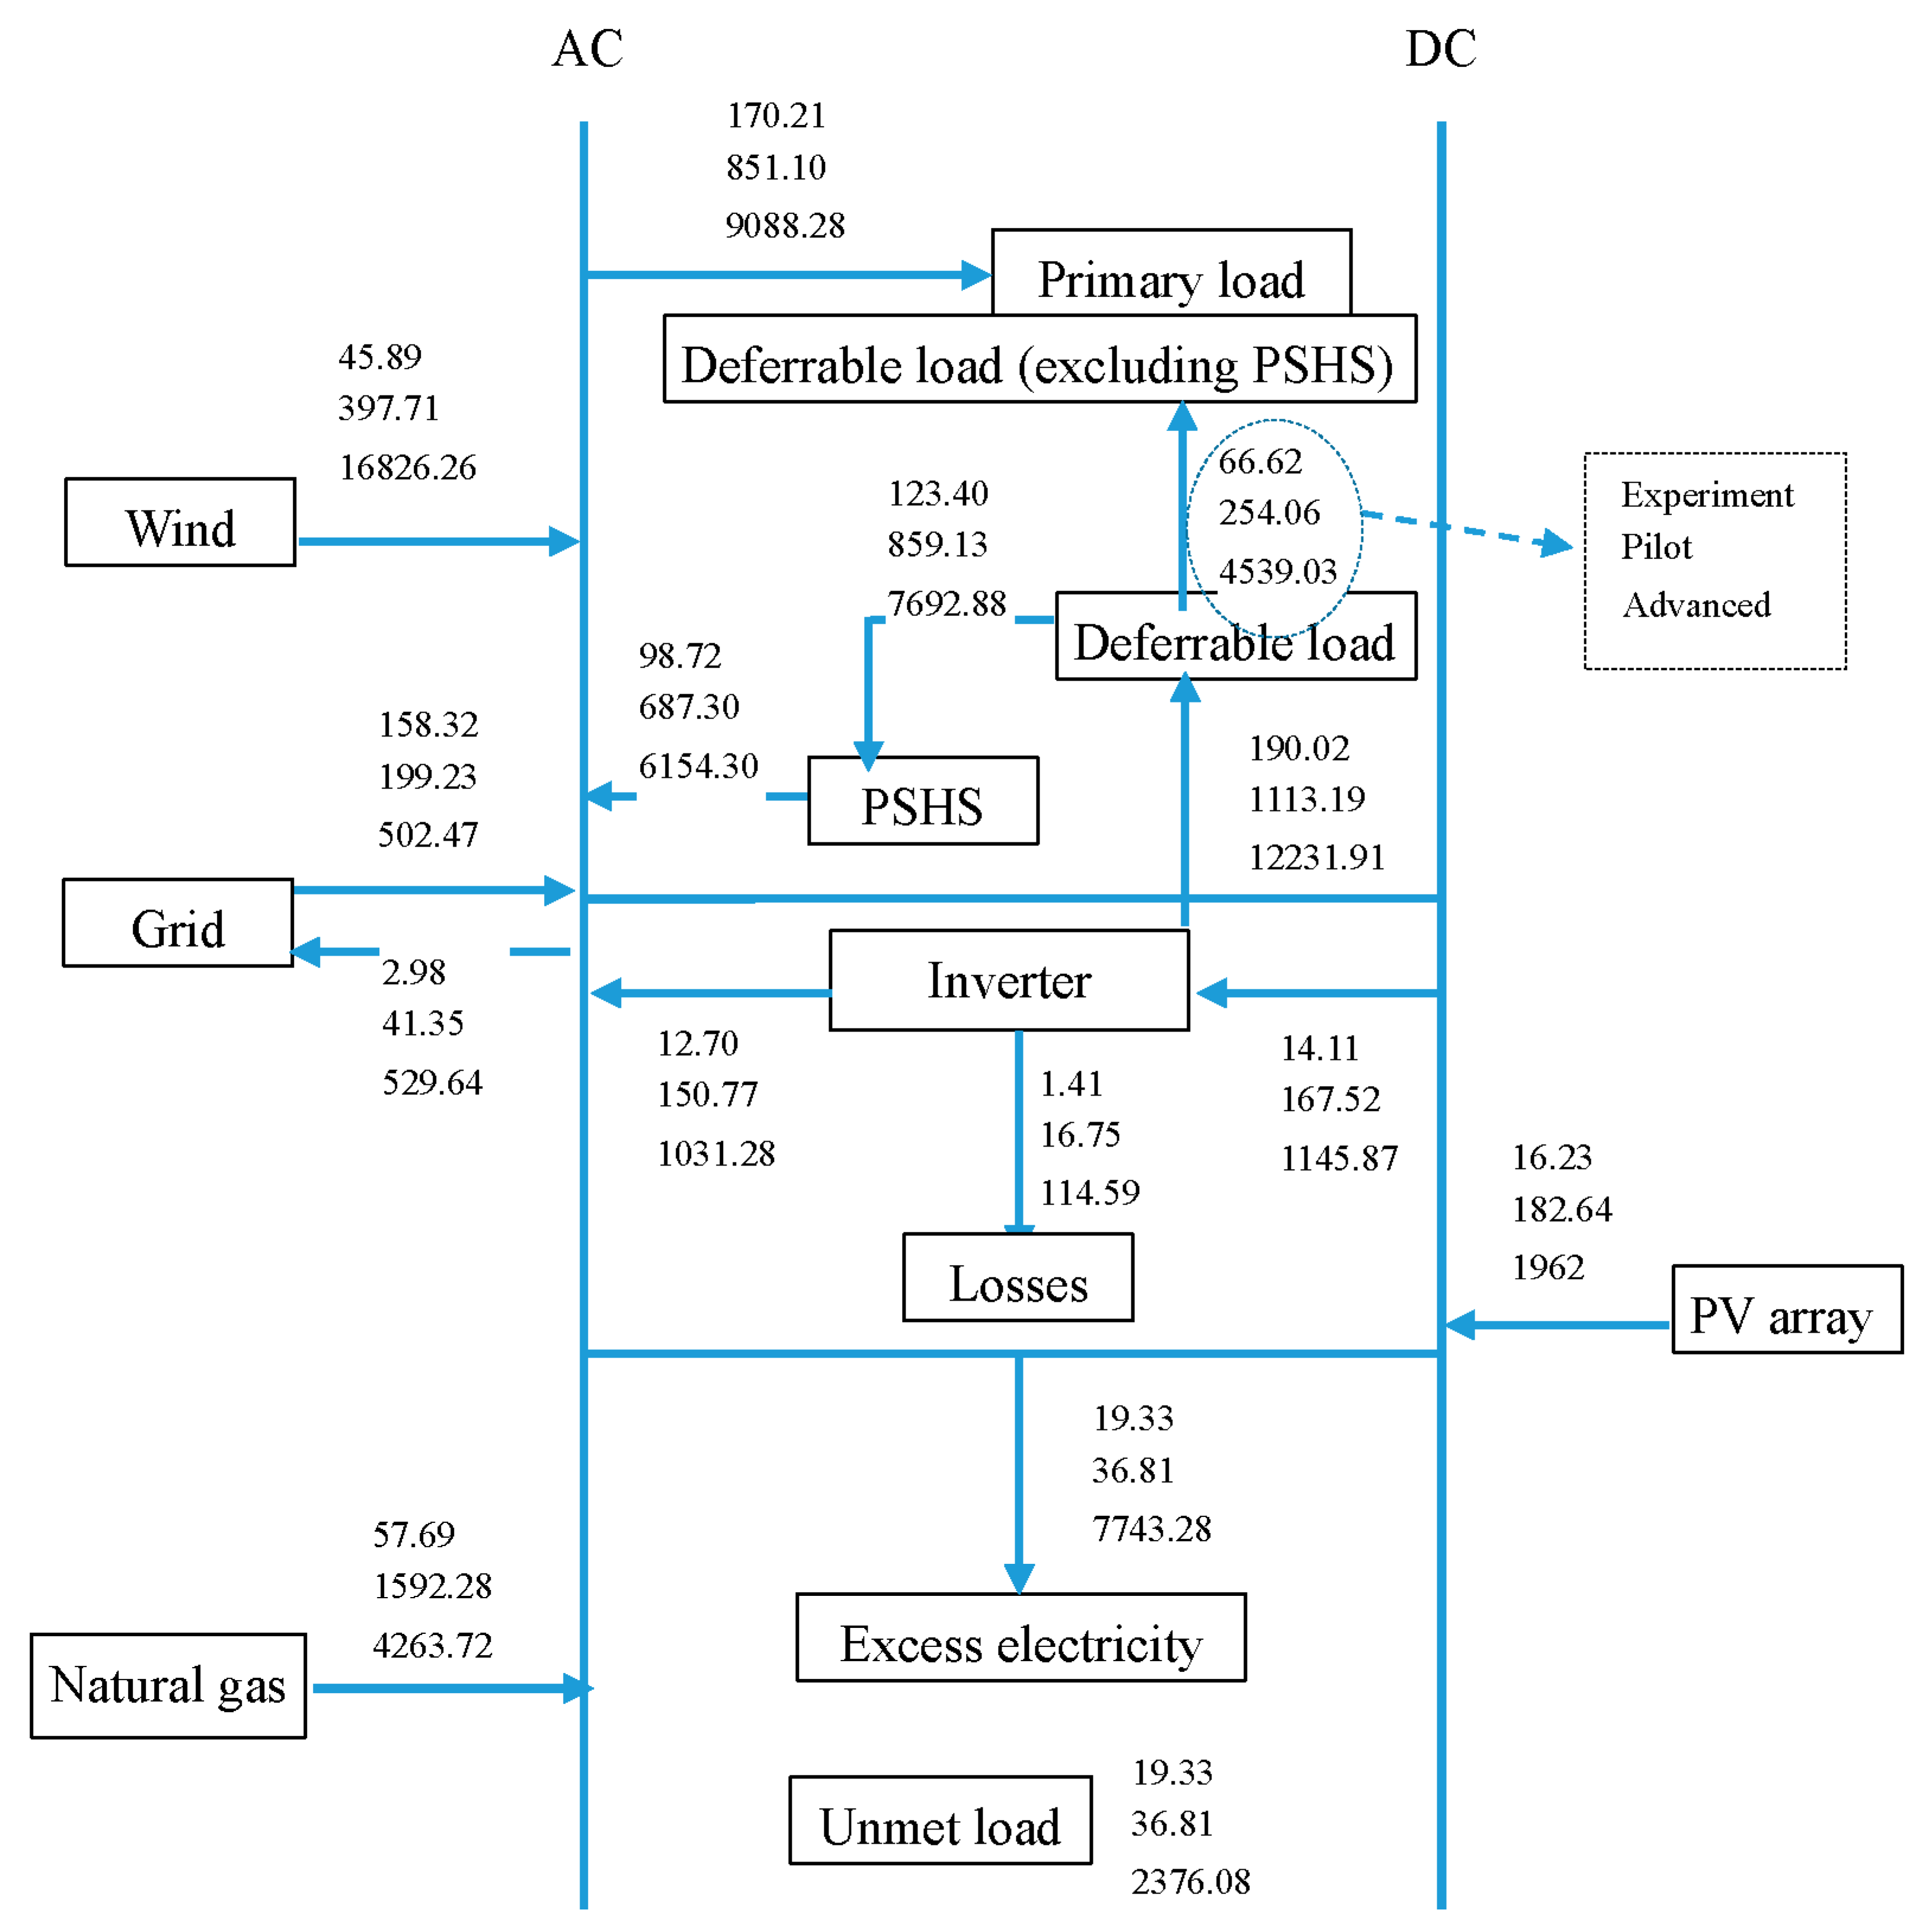
According to the analysis on the local energy resources of the case, the available energy supply options of the hybrid micro-grid model design are wind turbines, a solar photovoltaic (PV) array, gas generators, converters and a pumped-storage hydropower station (PSHS). The system structure is intuitively demonstrated in Figure 1.
It is difficult to determine how many components and what size of each component should be used. The optimization and sensitivity analysis algorithms provided by the Hybrid Optimization Model for Multiple Energy Resources (HOMER), which was developed at the National Renewable Energy Laboratory of the US, make it easier to evaluate the many possible system configurations. In order to find out the optimal combination of energy from the available resources in the case area to meet the electricity demand in a reliable and sustainable manner and to analyze whether such a hybrid option is a cost-effective solution or not, HOMER is used in this study.

2.2. Energy Demand Forecasting

Shenzhen is one of the low carbon demonstration and carbon emissions trading pilot cities identified by the Chinese central government. From this background, Shenzhen has planned to initiate an international low carbon city (ILCC) demonstration project in one of its less-developed areas (the average GDP per capita of the ILCC area is only one-fifth of the city) [24]. Realizing the importance of reducing the carbon intensity of power production for low carbon development, the municipal government of Shenzhen plans to build the ILLC based on a low carbon power structure.
The ILCC is situated in the Longgang District, a junction area of Huizhou, Shenzhen and Dongguan cities. It is approximately 40 km away from the downtown area of Shenzhen. The total planned area of the ILCC is 53.4 km2, with a population of about 226,000 in 2013. The low carbon demonstration urban construction project can be divided into three stages. The first stage is the experimental stage, with the objective of developing an area of approximately 1 km2; the second stage, the pilot phase, aims to expand the achievements of the first stage and develop an area of about 5 km2; the third stage is the comprehensive advanced stage, covering the entire 53.4 km2 of the ILCC.

2.2.1. Electricity Consumption

The planned employed population and residential population of the experimental stage of the ILCC is 50,000 and 15,000, respectively. According to urban planning principles in China, the planned Construction Floor Area (CFA) in the experimental stage is 1.8 million square meters. Based on the CFA forecast and the electricity demand benchmarks for different kinds of functional buildings, the total electricity demand for the entire ILCC area (Table 1) can be obtained as
E s =   1 n A i s   ×   d i s
where Es is the s stage total power load (kW), Ais is the area of ith kinds of buildings in the s stage, dis is the local electricity consumption standard in the s stage.
From the construction area estimation and the power consumption benchmarks, the total power consumption of the experimental stage of the ILCC is 280 M·kWh/year. In spite of the many affecting factors, it is estimated that cities of similar size (population and area) in a similar development stage (per capita GDP) usually consume 260–300 M·kWh/year of electricity according to previous studies [26,27]. Therefore, the electricity consumption estimation is reliable through the above methods.

2.2.2. Power Load Capacity

In a power system planning process, in addition to the total electricity demand forecast, the power load characteristics are also important parameters. The load density method is the commonly used method in regional power load estimation. This paper applies the following power load estimation model:
P s =   1 n ω i s   ×   A i s × R i s × K i s
where Ps is the planned total power load (kW) in stage s, ωis is the load density of the ith functional area (W/m2) in stage s, Ais is the ith land area (m2) in stage s, Ris is the ith floor area ratio in stage s, Kis is the ith power diversity factor in stage s. According to Equation (2), the different functional areas, the floor area ratios, and load densities are calculated and demonstrated in Table 2.

2.2.3. Energy System Structure of the Three Stages

It is assumed that the electricity demand of the three stages is proportional to the floor area, while the diversity factor should be considered in the estimation of planned power capacity. According to the power supply and distribution system design specifications, the diversity factors of the experimental, pilot and advanced stages are 0.8, 0.6 and 0.5, respectively [28]. Therefore, the planned power capacities of the three stages are 58,918 kW, 220,941 kW and 1,966,375 kW, respectively (Table 3).

2.2.4. Load Classification

Each type of electricity load has an obviously different load curve; there are two types of load in the HOMER model, namely primary load and deferrable load. Primary load is the electrical load that must be met immediately [29]. Residential, commercial and new industry load (most of the new industry sectors refer to research sectors or advanced services industries) are classified as primary load because they cannot easily be modified. Deferrable load is the electrical load which should be met within a given time period, but the exact timing is not important [30]. The traditional industrial use load is regarded as deferrable load as it can be scheduled in a 24 h day in order to avoid the peak power demand under the real-time power price policy which is being implemented in Shenzhen. Some public use also applies to this case [31]. PSHS load can be easily changed according to the system’s power demand. According to the energy system structure of the three stages which were displayed in Table 1, Table 2 and Table 3, the load profiles of the three stages are summarized in Table 4.

2.3. Available Energy Source Modeling

This subsection presents the major mathematical relationship of parameters in HOMER.

2.3.1. PV Array

The PV array is modeled as a device that produces direct current (DC) in proportion to the global solar radiation incident upon it in HOMER. Power output is calculated using the equation as follows of the PV array [32]:
Ps = Fs × Ys × (Is/I0)
where Fs is the PV derating factor; Ys is the rated capacity of the PV array (kW); Is is the global solar radiation incident on the surface of the PV array (kW/m2); I0 is the standard amount of radiation used to rate the capacity of the PV array (1 kW/m2) [33].

2.3.2. Wind Turbine

The hub height wind speed is figured out in HOMER from the equation below:
Vw = Va × [Ln (Hhub/H0)/Ln(Ha/H0)]
Vw is the wind speed of the wind turbine at the hub height (m/s); Va is the wind speed at the anemometer height (m/s); Hhub is the wind turbine hub height (m); Ha is the anemometer height (m); H0 is the surface roughness length (m).
Pw = (ρ/ρ0) × Pstp
where Pw is the power output of the wind turbine (kW), Pstp is the power output at standard temperature and pressure of the wind turbine; ρ is the air density (kg/m3), ρ0 is a constant (1.225 kg/m3).

2.3.3. Existing Power Transmission Line

Currently, the ILCC’s local grid is connected to the Shenzhen Grid (the commercial local grid system covering the major area of Shenzhen city) 30 km away by an 110 kV bidirectional transmission line. The maximum transmission power capacity is 150,000 kW. It is designed so that the existing transmission line remains unchanged, while the new electricity demand will be satisfied by new power sources. According to the power demand status and the covering area of the three stages, the maximum grid power available for the three stages of the ILCC project is assumed to be 20,000 kW, 40,000 kW and 150,000 kW, respectively.

2.3.4. PSHS

In this study, PSHSs are served as energy storage facilities. The electrical power output is calculated according to the following equation of the hydro turbine:
Phyd = ηhyd × ρwater × g × hnet × Qturbine/1000 W/kW
where Phyd is the power output (kW), ρwater is the efficiency of the hydro turbine (%), hnet is the water density (1000 kg/m3), g is the gravity constant (9.81 m/s2), Qturbine is the effective head (m).

2.4. List of Key Data Input

Some of the major variables and their assigned value in the model are displayed as follows.

2.4.1. Power Station Construction–Related Parameters

The power station construction–related parameters are presented in Table 5.

2.4.2. System-Related Parameters

The system operation–related parameters are presented in Table 6.

2.4.3. Natural Resource–Related Parameters

(1)
Solar Energy
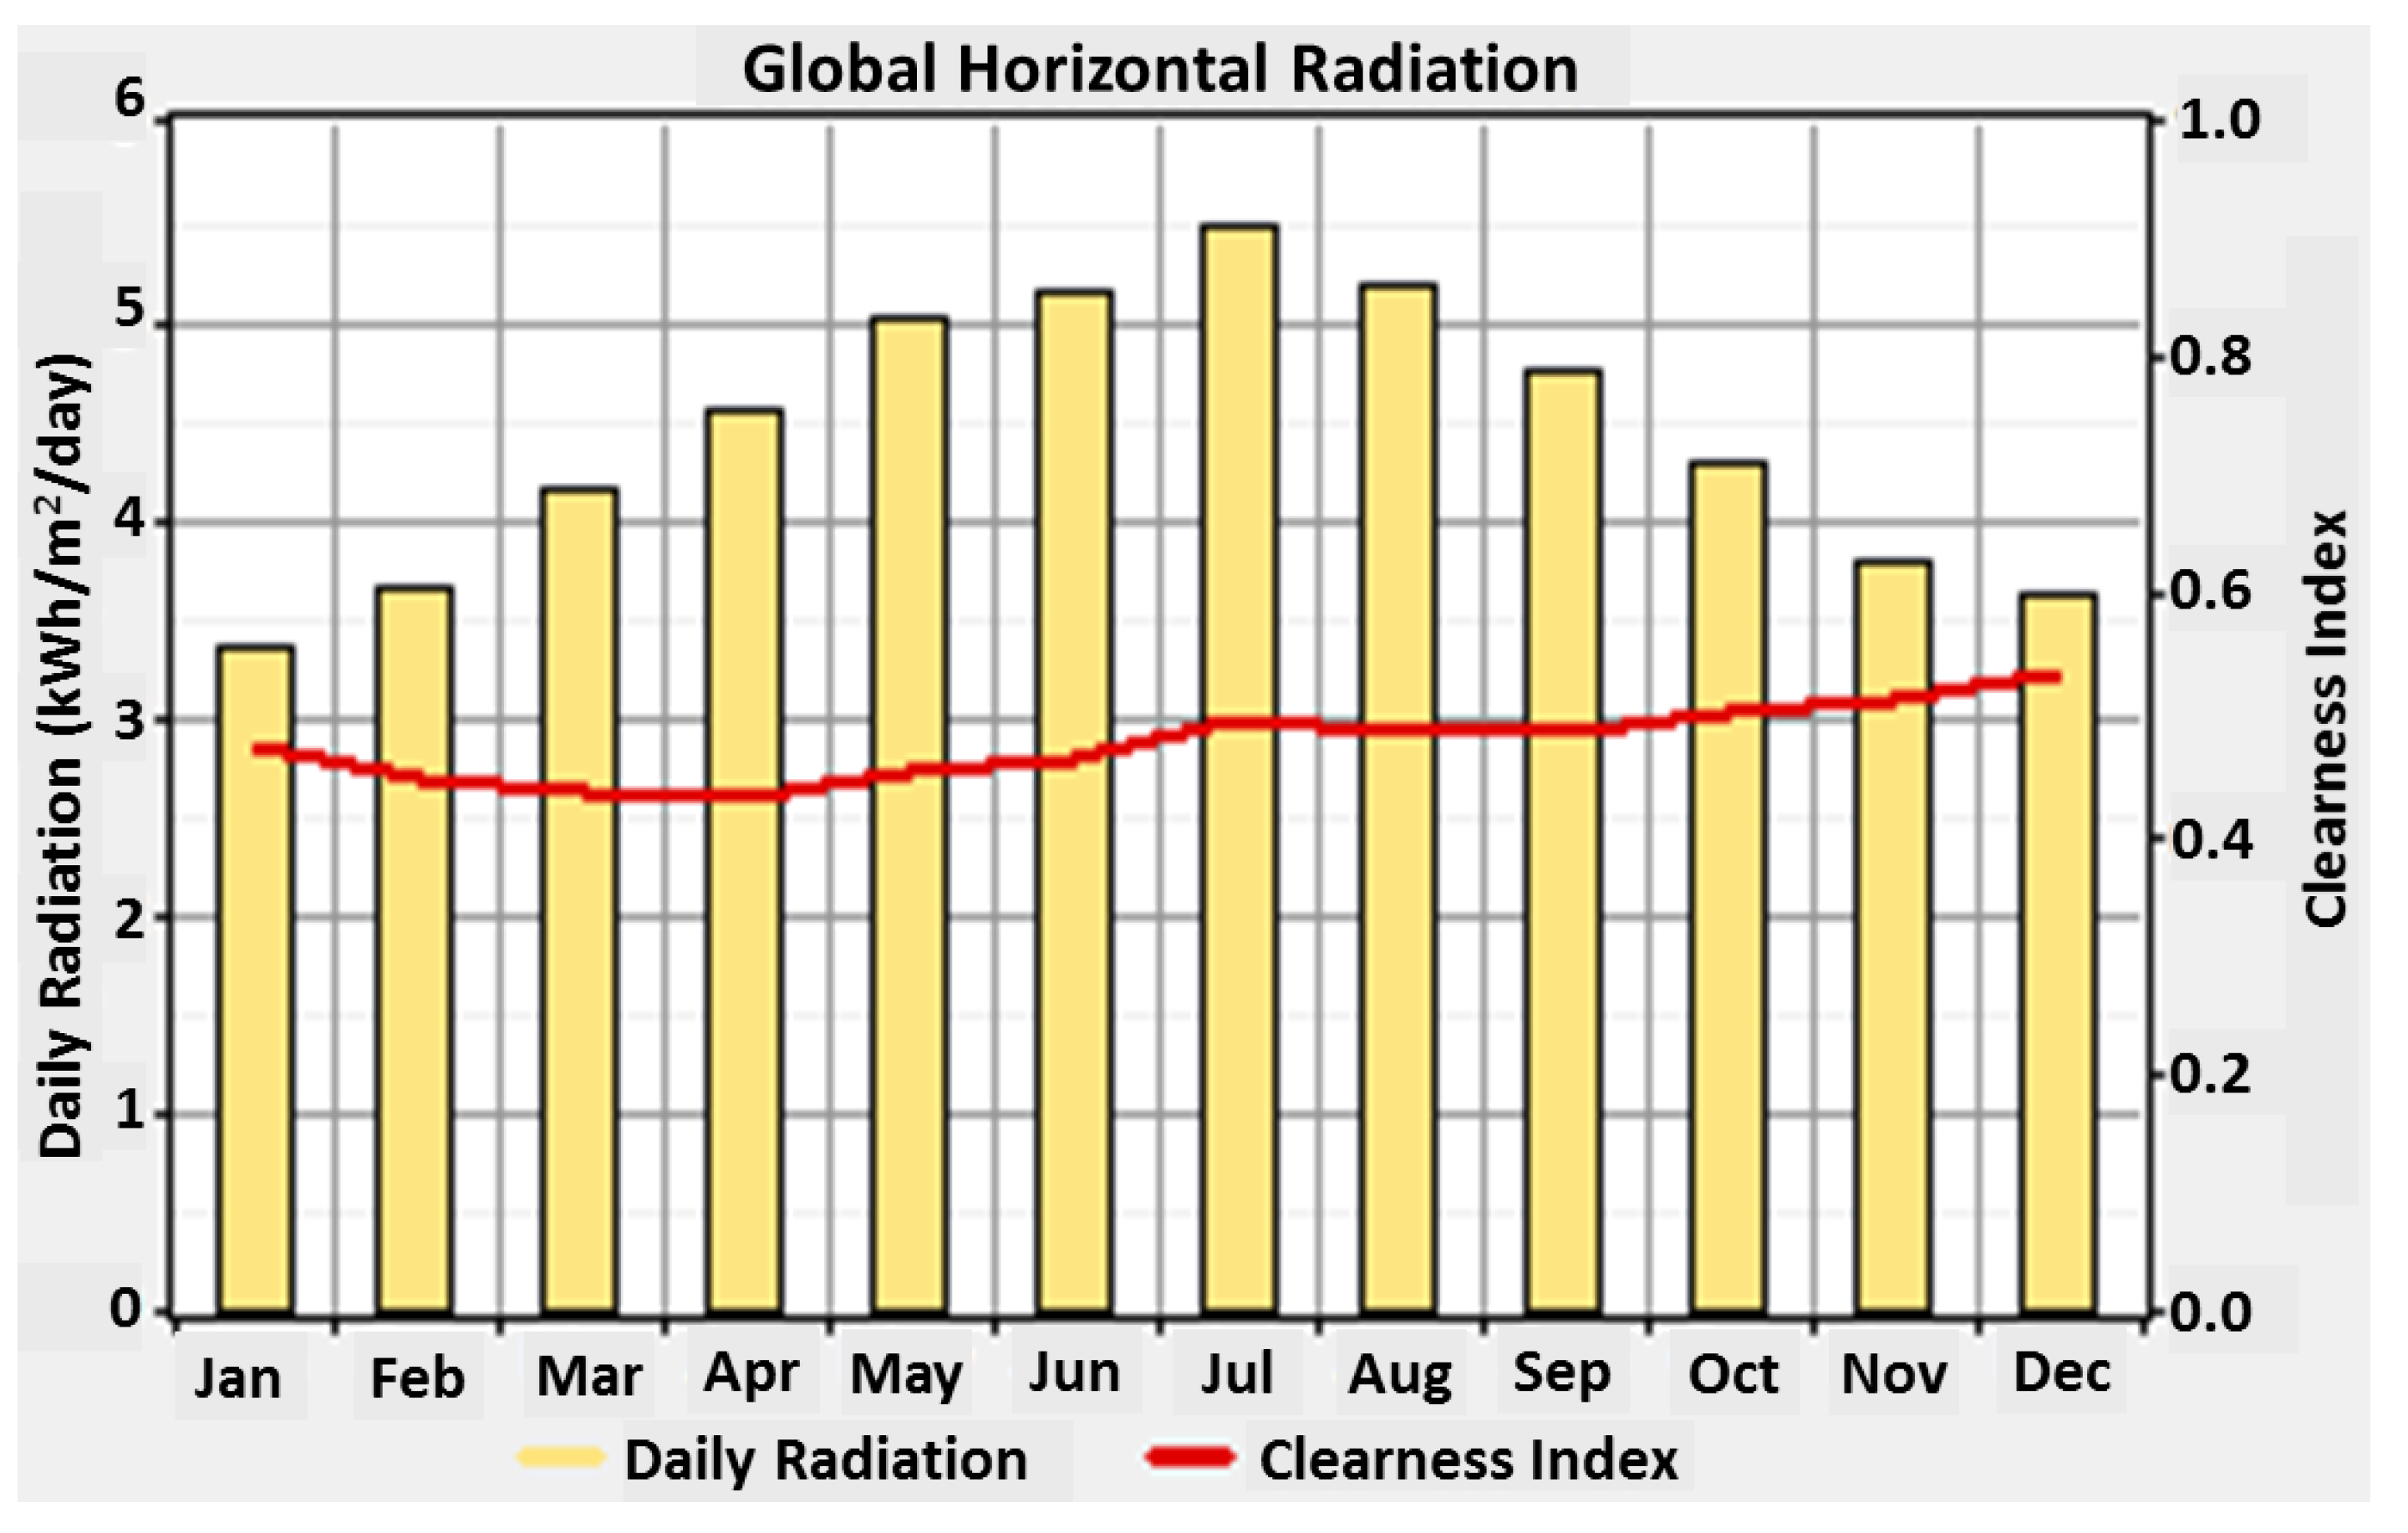
Shenzhen is located between 113°46′ and 114°37′ East longitude, and between 22°27′ and 22°52′ North latitude. HOMER uses latitude values and the clearness value to calculate the average daily solar radiation. On average, the yearly sunshine of the ILCC area is 1875–2080 h and the daily solar radiation is 4.41 kWh/m2 [21]. Figure 2 demonstrates the monthly solar radiation data of a typical year in Shenzhen.
When the installation of the PV panel is limited by space, it is assumed that the maximum available spaces for PV panel installation account for 20% of the total area for each stage.
(2)
Wind Resource
According to the Shenzhen solar and wind resource assessment report, the ILCC area in Shenzhen is not a wind resource–rich region [37]. The Dapeng Peninsula, approximately 30 km away from the ILCC area, has relatively more abundant wind resource, and therefore has a higher value for developing wind energy. From the viewpoint of improving the wind energy resource utilization efficiency and reducing the cost of wind power generation, the wind farm site is selected at the Dapeng Peninsula area. The average wind speed and average wind power density at the height of 10 m and 70 m are 4.0–5.0 m/s and 6.0–7.5 m/s, respectively [37].
(3)
Hydro Resource
Due to the rapid increase in urban size and the relative scarcity of water resources, the urban water conservancy facilities’ construction has been a priority for the Shenzhen government. As a result, the reservoir density in Shenzhen is higher than any other city in China. There are 164 water reservoirs in Shenzhen with a total storage capacity of 223 M·m3 as of 2013. There are two water reservoirs in the ILCC area, the Changken and the Baishitang reservoirs, with a total storage capacity of 2.8 M·m3. According to the storage capacity and water head difference of the two reservoirs, two PSHSs with a total installed capacity of 13 MW can be built for the experimental stage. For the pilot and advanced stage, external water reservoirs are needed.
(4)
Natural Gas
The natural gas supplies of Shenzhen are in two forms: one is via domestic natural gas pipelines, and the second is from imported liquefied natural gas (LNG). The national natural gas pipeline network was extended to Shenzhen in 2013, while the city has also built an LNG receiving dock at the Dapeng Peninsula. The gas supply capacity from domestic sources and abroad is sufficient to meet local gas demand in Shenzhen.
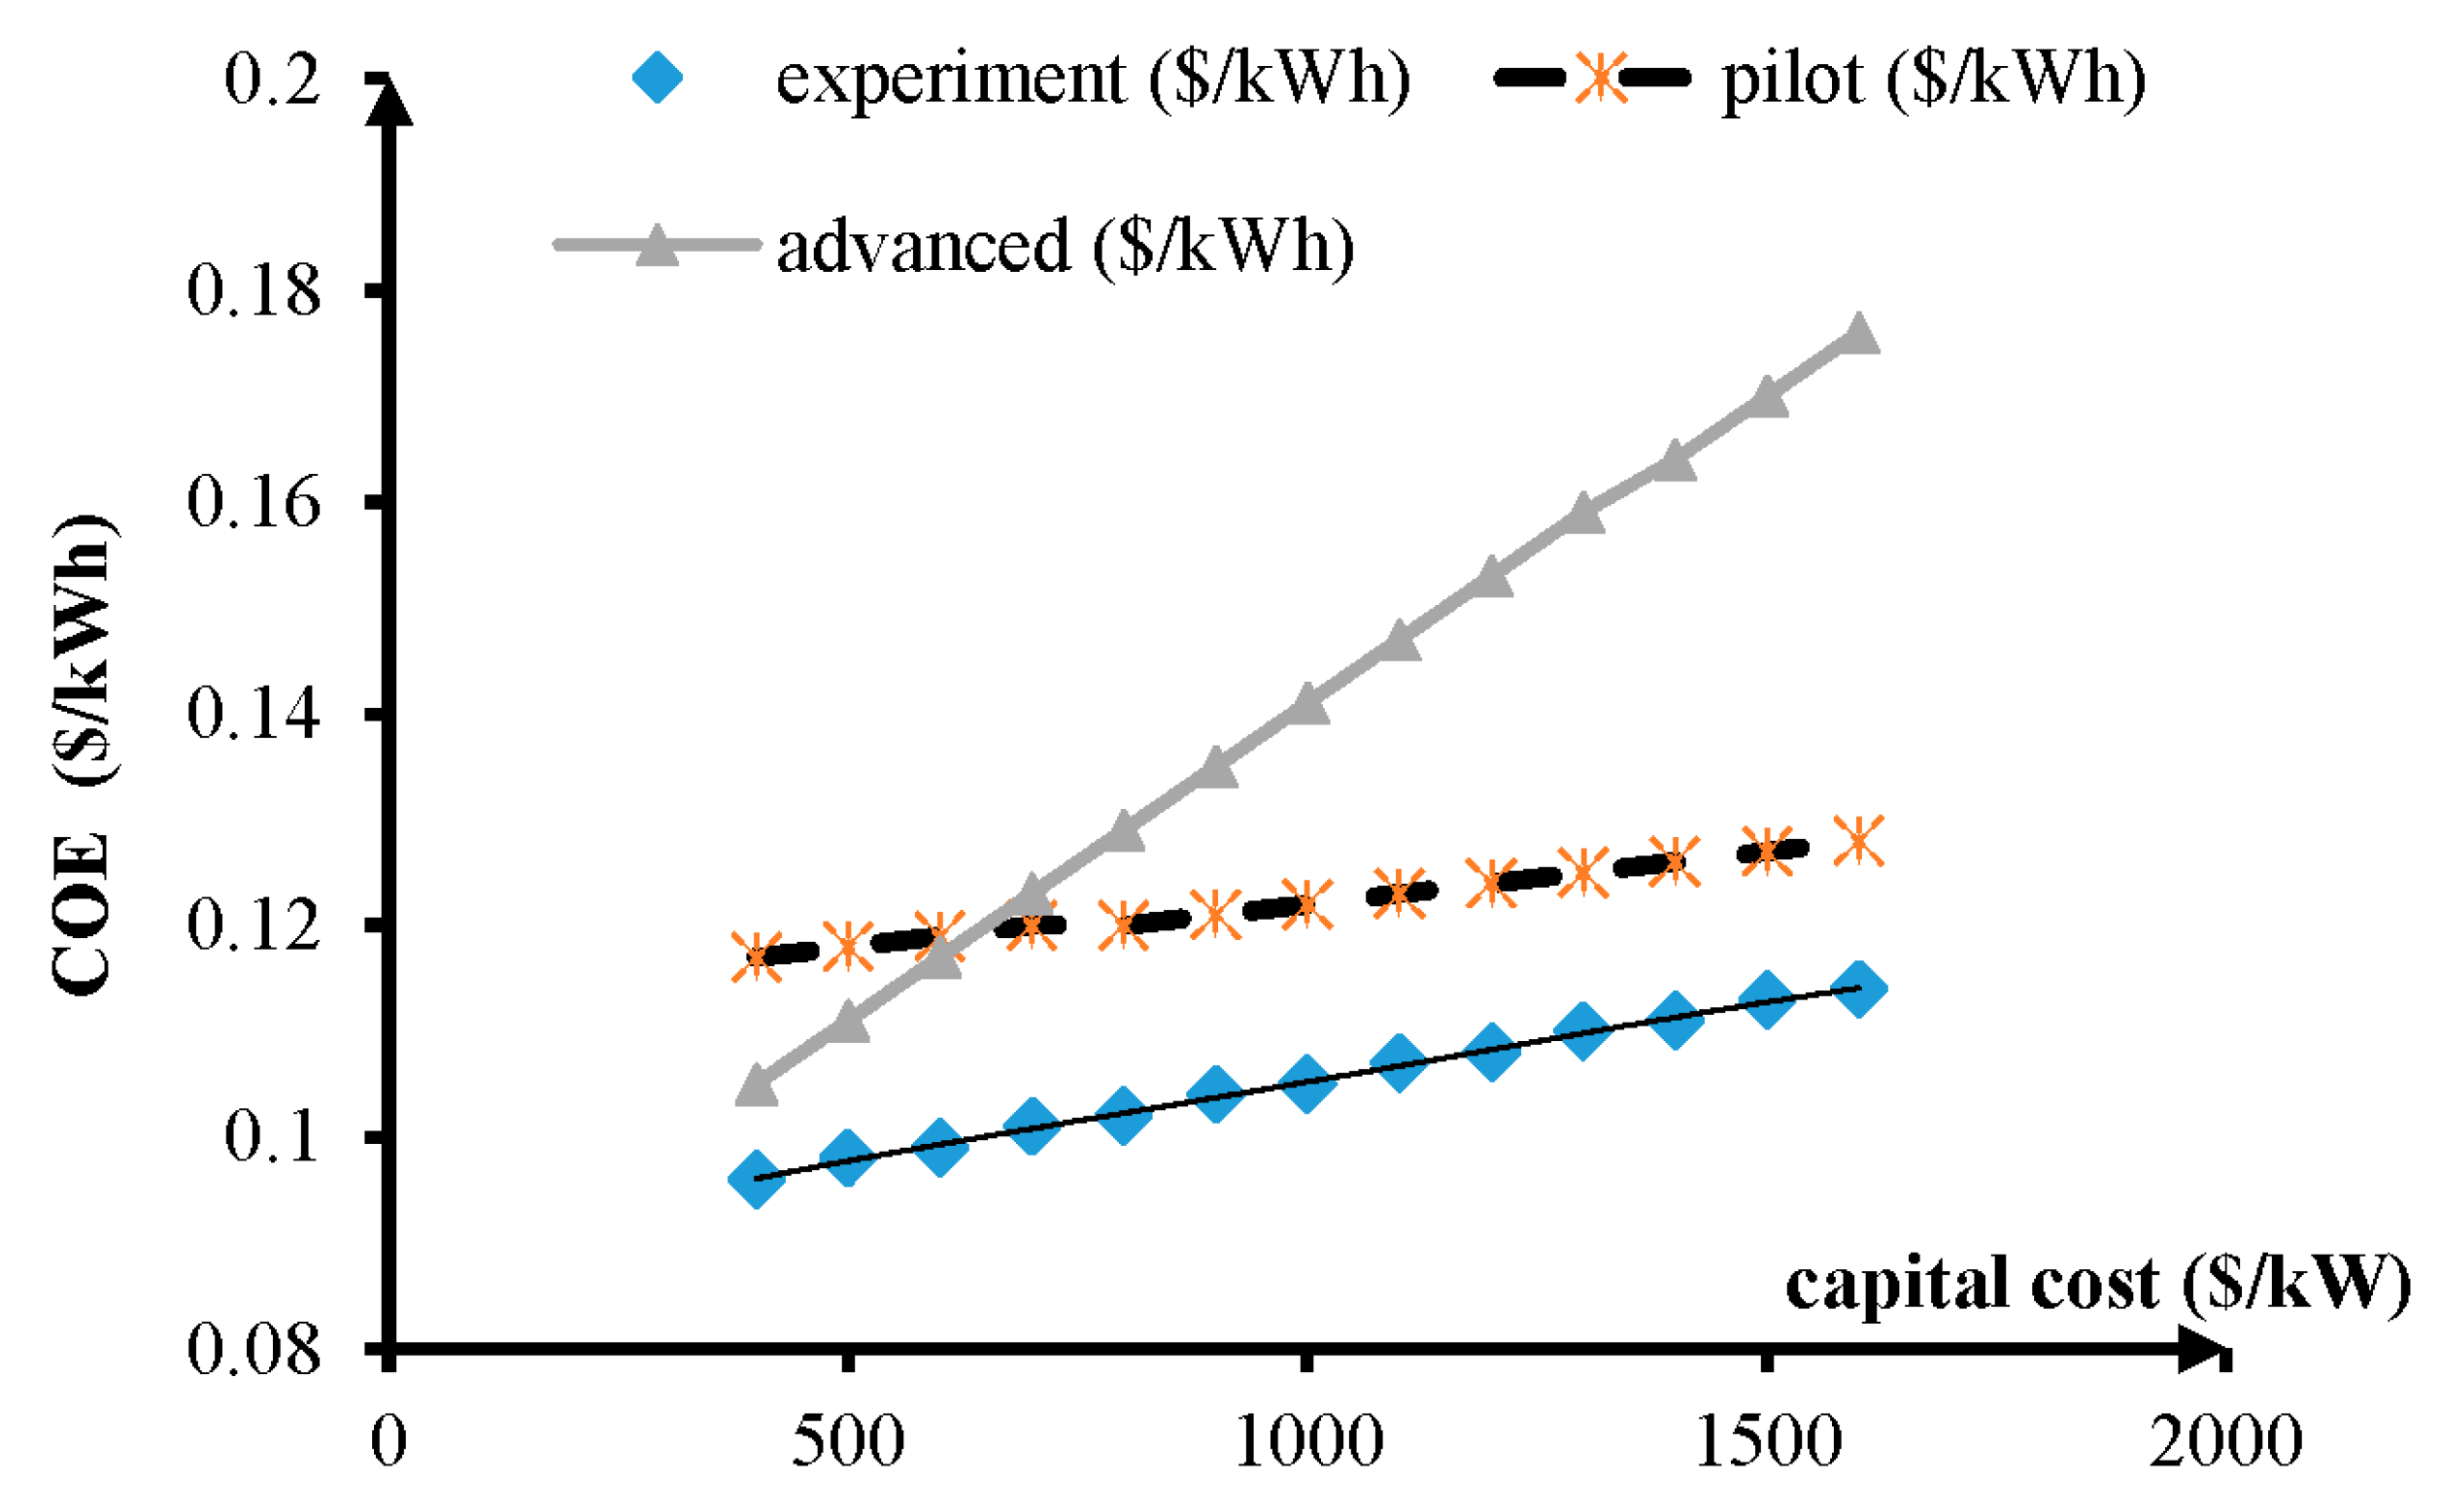
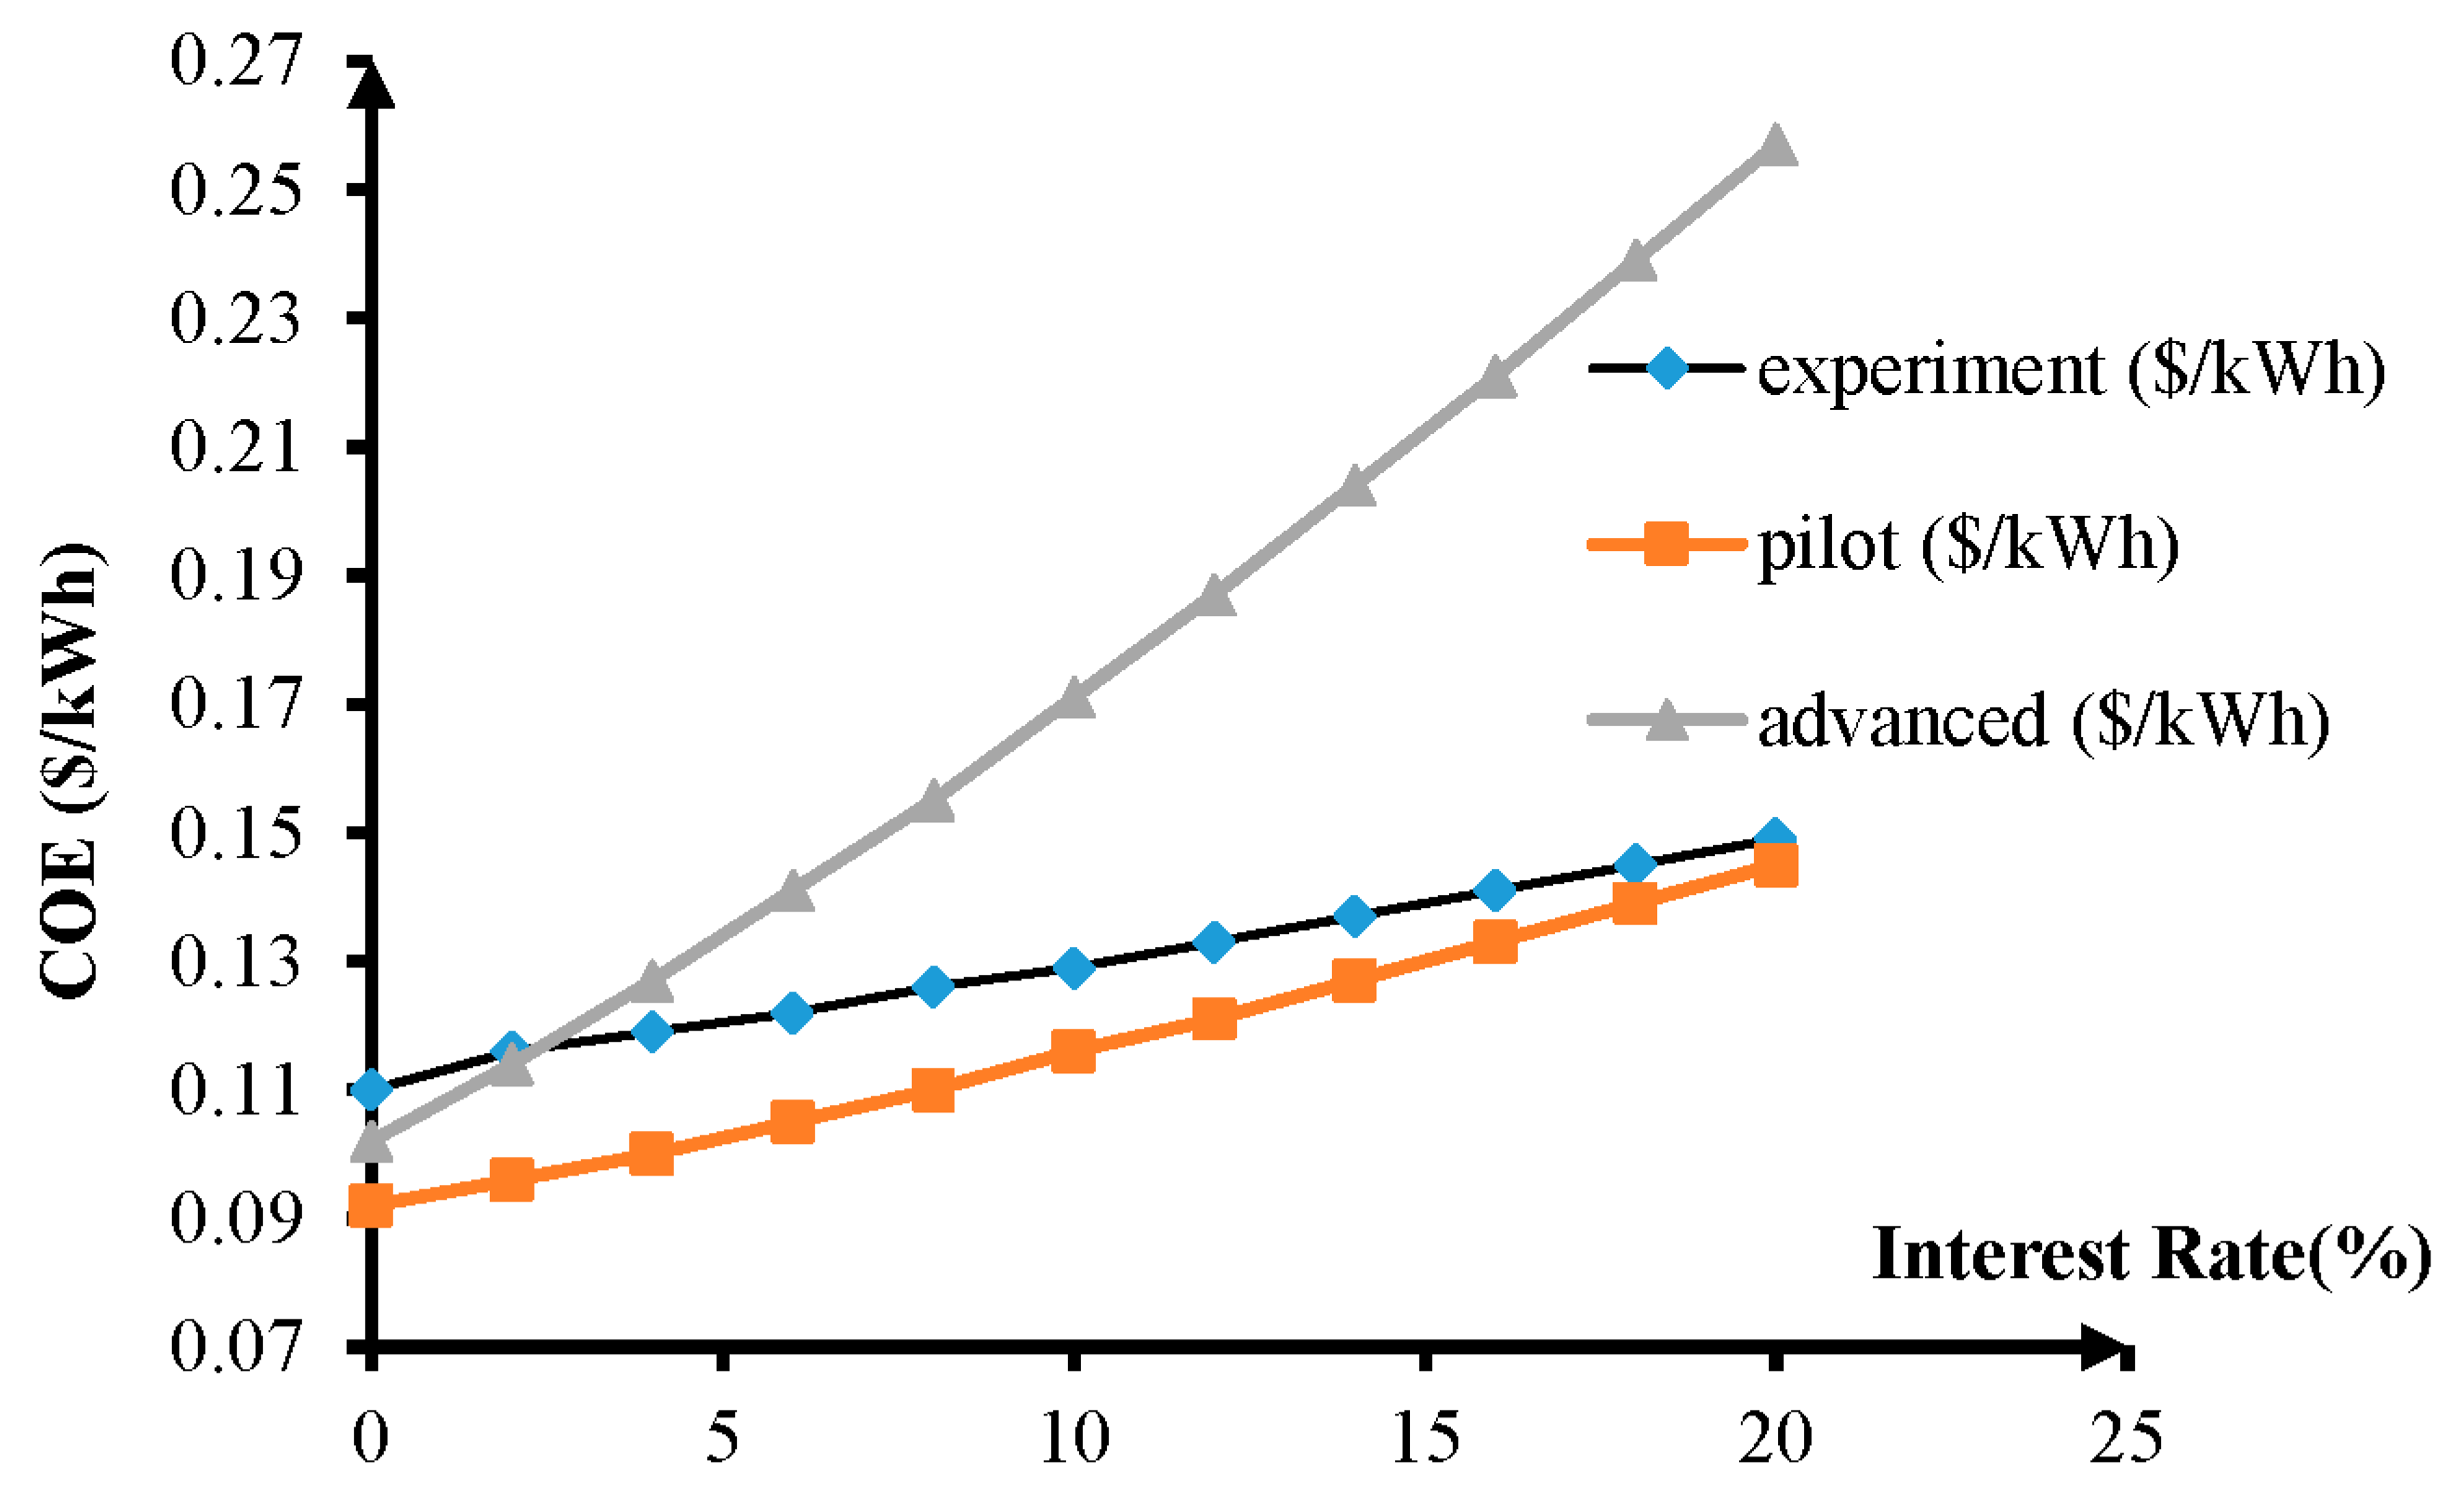
3. Results and Discussion

Based on the load forecasting and power source modeling, this section presents the power configuration optimization results for the three stages of the ILCC project.

3.1. Power Generator Installed Capacity

The hybrid power generators’ installed capacity of the three stages is summarized in Table 7. In order to achieve the goal of a renewable energy proportion larger than 40% for the experiment stage, 4.5 MW wind power, 12 MW PV power, 7 MW natural gas power and 20 MW existing grid power are needed. In addition, in order to eliminate the influence of the instability of renewable energy, 13 MW PSHS should be constructed simultaneously. In order to increase the renewable energy proportion to 60% and 70% in the pilot and advanced stages, the installed capacities of wind power are 390 MW and 16,500 MW, respectively. The optimization results also showed, even if the minimum RF (Renewable fraction) is reduced to 40%, the wind power installed capacities are no less than 210 MW and 11,000 MW for the pilot and advanced stages.

3.2. Electricity Production and Energy Flow Analysis

The energy flow of the three stages is demonstrated in Figure 3 and the proportions of different power types of the three stages are summarized in Table 8. It is assumed that the current for wind power, grid power and the natural gas generator are Alternating Current (AC) while the PV array power is DC. They are connected by an inverter.
Owing to the space limit of solar panel installation, this study set 20% as the maximum solar panel covering rate. The available on-shore and off-shore wind farm resources are relatively abundant in Shenzhen; therefore, wind energy is the only choice for increasing the RF in the ILCC area. However, a wind power capacity of 16,300 MW coupled with a PSHS capacity of 1059 MW is still a huge challenge for the project.

3.3. Economic Analysis

3.3.1. Economic Assessment Criteria

The net present cost (NPC) and cost of energy (COE) are the two major economic assessment indicators of the power system. COE defines the average cost per kWh of useful electric energy produced by the system. HOMER uses the following equation to calculate NPC and COE:
NPC = Cann × /CRF (i, Rpj)
COE = Cann/Etotal = CRF ((inof)/(1 + f), Rproj) × NPC/(Ep + Ed)
where Cann is the total annualized cost; i is the annual real interest rate; Rpj is the project lifetime; n is the number of years; Etotal is the annual total electricity produced by the system, which can be divided into two parts (primary load (Ep) and deferrable load(Ed)); and CRF(i, n) is the capital recovery factor.

3.3.2. Economic Modeling Results

According to Equations (7) and (8), major economic outputs of the optimization are displayed in Table 9. It is shown that COE is 0.122 $/kWh, 0.105 $/kWh and 0.141 $/kWh for the three stages, respectively. The average electricity tariff of Shenzhen was 0.127 $/kWh in 2013 [38].
If the distribution cost of power is negligible, the cost of the hybrid renewable energy system is affordable. The major reason for the relatively low cost lies in two facts: firstly, the renewable energy components’ cost is lower in China than in most of other countries. China has been the largest renewable energy investment country since 2009. The renewable energy industry chain is well developed in China due to the large domestic and foreign demand. Secondly, the construction, operation and management cost is cheaper in China as human cost is relatively lower than in the other countries, especially the developed countries.
The cash flow summaries are demonstrated in Figure 4, Figure 5 and Figure 6 for the three stages. It shows that the NPC for electricity supply over 25 years is $568 million, $2,697 million and $39,331 million for the three stages of the ILCC development.
The disparity of the NPC structure is, obviously, that the cost of electricity purchasing (it is categorized as the grid operating cost) from the grid takes the largest part in the experimental stage, while for the pilot stage and advanced stage, the natural gas fuel cost and wind power capital cost account for the largest part. The change reflects the power structure transformation during the three stages.

3.4. Environmental Aspect

As mentioned in the first section, thermal power accounted for 77% of China’s electricity production in 2014, and as a result, the carbon emission intensity of the major national power grid was especially high. The external power grid of the ILCC is the Shenzhen Grid, the carbon intensity of which was 0.9223 kg/kWh in 2013 according to data released by the Shenzhen Market Supervisory Authority [39]. In this section, the power supply from Shenzhen Grid is taken using the BAU (Business as usual) scenarios. The carbon reduction rate is displayed in Table 10. It shows that carbon reductions for the three stages are all larger than 40% compared with the BAU scenarios. For the advanced stage the annual net carbon reduction amount is larger than 20 Mt, which confirms that the environmental benefit of the ILCC project is obvious.

3.5. Land and Reservoir Storage Capacity Requirement

Land requirement is a significant influence factor for urban planning, especially for a city as large as Shenzhen. If 7.5 m2 of land or roof space is required to install every 1 kW of the PV panel, then the total space required for the PV stations for the three ILCC development stages is 0.09, 1.01, and 10.88 km2, respectively [40]. According to Dalton (2009) [40] and Rahbari (2014) [41], on average, the land requirement for a 1.5 MW wind turbine is 2500 m2; then the total land required for the three stages is 0.075, 0.65, and 27.50 km2, respectively, for wind farms. According to the hydro power installed capacity, the designed flow rates of the PSHSs are 16 m3/s, 140 m3/s, and 1450 m3/s, respectively. If a water head of 100 m and an operation time of 10 h are applied for each PSHS, the total reservoir available adjustable storage capacity should be no less than 0.576 M·m3, 5.04 M·m3, and 52.2 M·m3, according to Equation (6). The land and reservoir storage capacity requirements of the three stages are summarized in Table 11 below.

3.6. Sensitivity Analysis

The key variables of the hybrid energy system are often uncertain. In order to understand the influence of uncertainty on the system, the sensitivity analysis was introduced. As wind power investment accounts for the largest part in all the three ILCC development stages, it has been considered in the sensitivity analysis. In addition, the interest rate is critical in renewable energy projects as they require a huge initial investment and it is also considered in the sensitivity analysis [42].

3.6.1. Influence of the Capital Cost of the Wind Power System

An assessment of the impact of the capital cost of the wind power system on COE is presented in Figure 7 and indicates that the cost increases linearly. Tripling of the capital cost of the wind power system leads to an increase in COE for the advanced stage of approximately 60%, while for the experiment and pilot stages it is less than 15%. The difference is due to the disparity of the proportions of wind power in the three stages.

3.6.2. Influence of Interest Rates

The results presented in Figure 8 indicate that an increase in the interest rate would lead to an increase in the COE for all configurations, but at a greater rate for the advanced stages. The COE increases from $0.102/kWh to $0.257/kWh for the advanced stages as the interest rate increases from 0% to 20%, while for the same increase of the interest rate increment, the COEs for the experiment and pilot stages only increase by about $0.05/kWh.

4. Conclusions

A technology and economic feasibility study on renewable energy–powered low carbon demonstration area was conducted. The study was based on an optimization model using the official city planning road map and local available renewable energy resource data. The optimization results showed that local renewable energy resources cannot meet the energy demand unless external wind power is brought in for the pilot and advanced stages. The COEs for the experiment, pilot and advanced stages of the ILCC project were 0.122 $/kWh, 0.105 $/kWh, and 0.141 $/kWh, respectively, in the presence of external wind farms and PSHSs. The cost of the hybrid renewable energy system was affordable compared to the existing energy price in Shenzhen if the distribution cost of the power was negligible. The optimization results also revealed that the carbon reduction rate is 46.81%, 62.99% and 75.76% for the three stages compared with the BAU scenarios. The sensitivity analysis showed that the capital cost of the wind power and interest rate have more significant influences on the COE in the advanced stage than in the other two stages. The analysis also revealed that the energy storage capability is crucial if a region wants to maximum the utilization of local renewable energy. The PSHS is one kind of stable and reliable energy storage facility. The widely distributed water reservoir in Shenzhen provided an ideal condition for the construction of a PSHS. However, recognizing the fact that a PSHS usually has a great impact on the local environment, a comprehensive environmental impact assessment needs to be carried out in the actual planning process.

Acknowledgments

This work was supported by The Natural Science Foundation of Guang Dong Province, China (Grant No. 2014A030310404) and National Natural Science Foundation of China (No. 71403285).

Conflicts of Interest

The authors declare no conflict of interest.

References

  1. Liu, Z.; Guan, D.; Crawford-Brown, D.; Zhang, Q.; He, K.; Liu, J. Energy policy: A low-carbon road map for China. Nature 2013, 500, 143–145. [Google Scholar] [CrossRef] [PubMed]
  2. Jiang, J.; Ye, B.; Ma, X.; Miao, X. Controlling GHG emissions from the transportation sector through an ETS: Institutional arrangements in Shenzhen, China. Clim. Pol. 2015, 16, 1–19. [Google Scholar] [CrossRef]
  3. Yu, Y.; Yang, J.; Chen, B. The smart grids in China—A review. Energies 2012, 5, 1321–1338. [Google Scholar] [CrossRef]
  4. Ye, B.; Jiang, J.; Miao, L.; Xie, D. Interprovincial allocation of China’s national carbon emission allowance: An uncertainty analysis based on Monte-Carlo simulations. Clim. Pol. 2016. [Google Scholar] [CrossRef]
  5. Ye, B.; Jiang, J.; Miao, L.; Yang, P.; Li, J.; Shen, B. Feasibility study of a solar-powered electric vehicle charging station model. Energies 2015, 8, 13265–13283. [Google Scholar] [CrossRef]
  6. Wang, P.; Dai, H.; Ren, S.; Zhao, D.; Masui, T. Achieving Copenhagen target through carbon emission trading: Economic impacts assessment in Guangdong Province of China. Energy 2015, 79, 212–227. [Google Scholar] [CrossRef]
  7. China Electricity Council. Abandoned Wind Power Amount to 9.1 Billion kWh in the First Half of the Year 2014; China Electric Power Press: Beijing, China, 2014. (In Chinese) [Google Scholar]
  8. Zhou, Z.; Liu, P.; Li, Z.; Ni, W. Economic assessment of a distributed energy system in a new residential area with existing grid coverage in China. Comput. Chem. Eng. 2013, 48, 165–174. [Google Scholar] [CrossRef]
  9. China Electricity Council. Interim Measures for Distributed Power Management; Beijing, China, 2013. (In Chinese) [Google Scholar]
  10. Bhatt, V.; Friley, P.; Lee, J. Integrated energy and environmental systems analysis methodology for achieving low carbon cities. J. Renew. Sustain. Energ. 2010. [Google Scholar] [CrossRef]
  11. Ye, B.; Lu, Q.; Li, J.; Chang, K. Coal power GHG emission intensity model and its application. J. Harbin Univ. Sci. Technol. 2011, 5, 027. [Google Scholar]
  12. Xiong, L.; Shen, B.; Qi, S.; Price, L.; Ye, B. The allowance mechanism of China’s carbon trading pilots: A comparative analysis with schemes in EU and California. Appl. Energ. 2016, in press. [Google Scholar] [CrossRef]
  13. Wang, Z.; Zhang, B.; Zhang, Y. Determinants of public acceptance of tiered electricity price reform in China: Evidence from four urban cities. Appl. Energ. 2012, 91, 235–244. [Google Scholar] [CrossRef]
  14. Zhao, Z.; Chang, R. How to implement a wind power project in China? Management procedure and model study. Renew. Energ. 2013, 50, 950–958. [Google Scholar] [CrossRef]
  15. He, G. Decarbonizing China’s Power Sector: Potential, Prospects and Policy. Ph.D. Thesis, University of California, Berkeley, CA, USA, 2015. [Google Scholar]
  16. He, G.; Kammen, D.M. Where, when and how much wind is available? A provincial-scale wind resource assessment for China. Energ. Pol. 2014, 74, 116–122. [Google Scholar] [CrossRef]
  17. Ye, B.; Yang, P.; Jiang, J.; Miao, L.; Shen, B.; Li, J. Feasibility and economic analysis of a renewable energy powered special town in China. Resour. Conserv. Recycl. 2016, 6, 20–32. [Google Scholar] [CrossRef]
  18. Natarajan, S.; Padget, J.; Elliott, L. Modelling UK domestic energy and carbon emissions: An agent-based approach. Energ. Build. 2011, 43, 2602–2612. [Google Scholar] [CrossRef] [Green Version]
  19. Ho, Y.-F.; Chang, C.-C.; Wei, C.-C.; Wang, H.-L. Multi-objective programming model for energy conservation and renewable energy structure of a low carbon campus. Energ. Build. 2014, 80, 461–468. [Google Scholar] [CrossRef]
  20. Lu, Y.; Wang, S.; Zhao, Y.; Yan, C. Renewable energy system optimization of low/zero energy buildings using single-objective and multi-objective optimization methods. Energ. Build. 2015, 89, 61–75. [Google Scholar] [CrossRef]
  21. Ye, B.; Tang, J.; Li, J.; Huang, J. Feasibility study of renewable energy powered Island-Hainan. In Proceedings of the IEEE 2012 International Conference on Computer Distributed Control and Intelligent Environmental Monitoring (CDCIEM), Zhangjiajie, China, 5–6 March 2012.
  22. Vettorato, D.; Geneletti, D.; Zambelli, P. Spatial comparison of renewable energy supply and energy demand for low-carbon settlements. Cities 2011, 28, 557–566. [Google Scholar] [CrossRef]
  23. Braslavsky, J.H.; Wall, J.R.; Reedman, L.J. Optimal distributed energy resources and the cost of reduced greenhouse gas emissions in a large retail shopping centre. Appl. Energ. 2015, 155, 120–130. [Google Scholar] [CrossRef]
  24. Ye, B.; Jiang, J.; Miao, L.; Yang, P. Sustainable energy options for a low carbon demonstration city project in Shenzhen, China. J. Renew. Sustain. Energ. 2015, 7, 23117–23122. [Google Scholar]
  25. Shenzhen Urban Planning Committee. Shenzhen Urban Planning Standards and Guidelines; Shenzhen, China, 2014. (In Chinese) [Google Scholar]
  26. Lariviere, I.; Lafrance, G. Modelling the electricity consumption of cities: Effect of urban density. Energ. Econ. 1999, 21, 53–66. [Google Scholar] [CrossRef]
  27. Browne, D.; O’Regan, B.; Moles, R. Use of ecological footprinting to explore alternative domestic energy and electricity policy scenarios in an Irish city-region. Energ. Pol. 2009, 37, 2205–2213. [Google Scholar] [CrossRef]
  28. Zhou, X.; Chen, X.; Zhang, T. Impact of megacity jobs-housing spatial mismatch on commuting behaviors: A case study on central districts of Shanghai, China. Sustainability 2016, 8, 122. [Google Scholar] [CrossRef]
  29. Baek, S.; Kim, H.; Chang, H.J. Optimal hybrid renewable power system for an emerging island of South Korea: The case of Yeongjong Island. Sustainability 2015, 7, 13985–14001. [Google Scholar] [CrossRef]
  30. Tang, J.; Ye, B.; Lv, Q.; Li, J. Economic analysis of photovoltaic electricity supply for an electric vehicle fleet in Shenzhen, China. Int. J. Sustain. Transp. 2014, 8, 202–224. [Google Scholar] [CrossRef]
  31. Shen, B.; Ghatikar, G.; Lei, Z.; Li, J.; Wikler, G.; Martin, P. The role of regulatory reforms, market changes, and technology development to make demand response a viable resource in meeting energy challenges. Appl. Energ. 2014, 130, 814–823. [Google Scholar] [CrossRef]
  32. He, G.; Kammen, D.M. Where, when and how much solar is available? A provincial-scale solar resource assessment for China. Renew. Energ. 2016, 85, 74–82. [Google Scholar] [CrossRef]
  33. Duffie, J.A.; Beckman, W.A. Solar Engineering of Thermal Processes, 2nd ed.; Wiley: New York, NY, USA, 1991. [Google Scholar]
  34. Ye, B.; Tang, J.; Lu, Q. Feasibility analysis of renewable energy powered tourism island—Hainan, China. J. Renew. Sustain. Energ. 2012, 4, 63116–63127. [Google Scholar]
  35. Jiang, J.J.; Ye, B.; Ma, X.M. The construction of Shenzhen’s carbon emission trading scheme. Energ. Pol. 2014, 75, 17–21. [Google Scholar] [CrossRef]
  36. Sun, H.; Zhi, Q.; Wang, Y.; Yao, Q.; Su, J. China’s solar photovoltaic industry development: The status quo, problems and approaches. Appl. Energ. 2014, 118, 221–230. [Google Scholar] [CrossRef]
  37. Meteorological Bureau of Shenzhen Municipality. Shenzhen Solar, Wind Resource Assessment Report. Available online: http://www.szmb.gov.cn /article /QiHouYeWu/qhbh/qhyjcg/2011/03/22/4d8866335a86d.html (accessed on 12 April 2016). (In Chinese)
  38. China Electricity Council. China Electricity Supply and Demand Analysis and Report; China Electric Power Press: Beijing, China, 2014. (In Chinese) [Google Scholar]
  39. Shenzhen Market Supervisory Authority. Organizational Level GHG Emissions Quantification and Reporting Guidelines; Shenzhen, China, 2012. (In Chinese) [Google Scholar]
  40. Dalton, G.J.; Lockington, D.A.; Baldock, T.E. Feasibility analysis of renewable energy supply options for a grid-connected large hotel. Renew. Energ. 2009, 34, 955–964. [Google Scholar] [CrossRef]
  41. Rahbari, O.; Vafaeipour, M.; Fazelpour, F.; Feidt, M.; Rosen, M.A. Towards realistic designs of wind farm layouts: Application of a novel placement selector approach. Energ. Convers. Manag. 2014, 81, 242–254. [Google Scholar] [CrossRef]
  42. Ye, B.; Jiang, J.; Miao, L.; Li, J.; Peng, Y. Innovative carbon allowance allocation policy for the Shenzhen emission trading scheme in China. Sustainability 2015. [Google Scholar] [CrossRef]
Figure 1. Hybrid energy system of ILCC.
Sustainability 08 00452 g001
Figure 2. Monthly solar radiation of ILCC.
Sustainability 08 00452 g002
Figure 3. Annual energy flow of the three stages (Unit: M·kWh).
Sustainability 08 00452 g003
Figure 4. Cash flow summary of the experimental stage.
Sustainability 08 00452 g004
Figure 5. Cash flow summary of the pilot stage.
Sustainability 08 00452 g005
Figure 6. Cash flow summary of the advanced stage.
Sustainability 08 00452 g006
Figure 7. Influence of the capital cost of the wind power system.
Sustainability 08 00452 g007
Figure 8. Influence of interest rates on COE.
Sustainability 08 00452 g008
Table 1. Yearly electricity forecast for the experimental stage of the ILCC.
Construction TypesArea of Construction (Million·m2)Electricity Consumption Benchmark (kWh/m2) [25]Electricity Demand (M·kWh)
Research1.20150180
Resident0.404016
Commercial0.2035070
Public0.061006
Others--8
Total1.86147280
Table 2. Floor area ratio and load density for different functional areas.
FunctionArea (Thousand m2)Average Volume RateLoad Density (W/m2)Load Capacity (kW)
Public lawn1271.00.564
Industrial land2312.546.827,027
New industry994.039.215,523
Commercial405.033.86760
Cultural Facilities2231.239.210,490
Residential1004.03012,000
Water area851.00.543
Other---1740
Total---73,647
Table 3. Energy demand and planned power capacity of the three stages.
StageCovering Area km2Electricity Demand (M·kWh)Load Capacity (kW)Diversity FactorPlaned Power Capacity (kW)
Experimental stage1.028073,6470.858,918
Pilot stage5.01400368,2350.6220,941
Advanced stage53.414,9523,932,7500.51,966,375
Table 4. Load profile forecasting of the three stages.
Load Type in ModelFunctionLoad Capacity (kW)Energy Consumption(M·kWh/Year)
Experimental StagePilot StageAdvanced Stage
Primary loadNew industry15,523170.22851.109089.75
Commercial6760
Cultural Facilities10,490
Residential12,000
Deferrable loadIndustrial use27,027109.78548.905862.25
Water area43
Public lawn64
Other1740
Total73,647280.011400.0514,952.53
Table 5. Power station construction–related parameters in the model.
ComponentsParametersValue
PV power station [21]PV panel cost$1000/kW
Auxiliary equipment$150/kW
Converter$300/kW
O & M cost$10/kW·year
Life time20 year
Wind power station [14,34]Wind turbine$700/kW
Auxiliary equipment$300/kW
O & M cost$10/kW·year
Life time20 year
Hub height70 m
Natural Gas power stationsEquipment cost$800/kW
O & M cost$50/kW·year
Life time30 year
PSHSConstruction cost$1050/kW
O & M cost$2/kW·year
Efficiency80%
Life time50 year
Table 6. System-related parameters of the energy system.
ComponentsParametersValue
Economic dataInterest rate6%
Natural gas price$0.40/m3
Carbon emission price [35]$10/t
Electricity sellback rate [36]$0.163/kWh
System parametersMaximum capacity shortage1%
Simulation time step1 h
Minimum renewable fraction (RF)Experimental 40%; Pilot 60%; advanced 70%.
Table 7. Power generator installed capacity of the three stages.
ComponentsExperimental Stage (RF > 40%)Pilot Stage (RF > 60%)Advanced Stage (RF > 70%)
Wind (MW)4539016,500
PV (MW)121351450
Natural gas (MW)790900
Grid (MW)2040150
Converter (MW)8901000
PSHS (MW)131101059
Table 8. Power generation mix of the three stages.
ComponentsExperimental Stage (%)Pilot Stage (%)Advanced Stage (%)
PV (MW)497
Wind (MW)121957
PSHS (MW)263321
Natural gas (MW)152914
Grid (MW)42102
Total100100100
Table 9. Major economic output.
Economic ParametersExperimental StagePilot StageAdvanced Stage
COE ($/kWh)0.1220.1050.141
Total NPC (M·$, 25 years)568269739,331
Table 10. Carbon reduction rate of the three stages.
SeniorEmissions (t/Year)
Experimental StagePilot StageAdvanced Stage
Low carbon scenario148,639517,1223,617,244
BAU scenario279,4501,397,25014,922,625
Reduction rate (%)46.81%62.99%75.76%
Table 11. Land and reservoir storage capacity requirements of the three stages.
Experimental StagePilot StageAdvanced Stage
Land for PV (km2)0.091.0110.88
Land for Wind (km2)0.0750.6527.50
Capacity for PSHS (M·m3)0.5765.0452.2

