Article

Characteristics of Rainfall Runoff Pollutant and Initial Treatment

1
R&D Office, International Center for Urban Water Hydroinformatics Research & Innovation, Incheon 21999, Korea
2
Department of Water Supply & Sewerage, Seoyeong Engineering, Gyeonggi-do 13595, Korea
3
Department of Civil & Environmental Engineering, Incheon National University, Incheon 22012, Korea
*
Author to whom correspondence should be addressed.
Sustainability 2016, 8(5), 450; https://doi.org/10.3390/su8050450
Submission received: 15 March 2016 / Revised: 18 April 2016 / Accepted: 26 April 2016 / Published: 6 May 2016

Abstract

:
The spread of urbanization drives problems which distort the urban water cycle as a form of flood disaster and pollutant loads. When it comes to pollution, a lack of information on the load and characteristics of pollutants has led to insufficient reduction measures. Thus, this study discusses filtration by different types of filter media as an initial treatment to reduce pollutant loads. This study examined the effectiveness of the filtration method with different types of filter to control micro-particles from rainfall runoff water. The particle size and characteristics of pollutants were investigated. In addition, the characteristics of filter media in the filtration process, such as head loss, treatment efficiency, and changes in particle size distribution were also analyzed by lab-scale experiments. This study suggested the best filtration material to treat surface wash-off pollutants based on the results of various experiments on the treatment of real samples collected from roads and combined sewers. The results and discussions shown in this study may be useful as basic information for appropriate design and operating parameters of filtering facilities to control rainfall runoff pollutants caused by urban storms.

1. Introduction

The impermeable area and the peak discharge volume have been consistently increasing due to environmental changes, such as widening urban development and the rehabilitation of roads by covering the surface with impervious materials. Thus, distortion of the water cycle has become a serious problem compared to the past. Even if the problem by point source (PS) pollutants is being decreased by the installation of various environmental facilities, insufficient countermeasures for non-point source (NPS) pollutants is still a big issue as they have complex characteristics and cause difficulties in determining pollution load. NPS pollution generated by a watershed at a particular time, such as during a rainfall event, is generally caused by land-use, and the time and source location of the occurrence are not clearly identified. Hydrological phenomena in urban areas are very sensitive to rainfall events. Generally, initial runoff phenomena stand out at the beginning of rainfall, so maximum pollution load runoff precedes maximum flow rate. Pollution loads per unit area of NPS pollutants which are discharged in urban areas, are highly concentrated compared to other land-use characteristics, and they contain organic matter, nutrients, and heavy matter, as well as toxic substances. In general, the loads of biochemical oxygen demand (BOD) and suspended solids (SS) in the NPS pollutants have increased 92 times and 24 times respectively compared to the loads in the non-developed region [1,2,3,4].
Among land-use in urban areas, areas with many parks and grasslands release less pollutants compared to commercial and industrial areas. Those areas have a large amount of non-point pollutant outflow (runoff) due to quite a number of impermeable areas and pollutant emissions [5]. Due to the fact that roads are a social connecting infrastructure, the pollutants that occur in certain areas can easily move from one place to another. Therefore, pollutants, such as various organic and particulate materials, heavy metals, etc., accumulate on the highways during dry periods, and flow through the nearby water system and land during rainfall, which becomes a permanent internal pollution source and seriously affects water quality and ground water. Cho et al. (2007) reported that most of the particles in bridge runoff had sizes of 10–20 μm, and, depending on rainfall duration time, the size increased [6]. In detail, the particle size was maximized at the beginning of peak runoff and drastically decreased after the maximum point. Lee et al. (2005) stated that, according to the examination of the particle size of road runoff, the average particle size was approximately 20 μm [7].
Lee et al. (2010) proposed that, when the runoff flow rate was measured, the flow rate rapidly increased 2 h after the rainfall, which was two times greater than the flow rate at the same time during the dry season. For particle distribution of the dry season, a particle size range of 5–3000 μm was distributed. There was a significant amount of particles greater than 180 μm in size during rainfall. During dry and rainy seasons, the concentration of Chemical Oxygen Demand (COD), Biochemical Oxygen Demand (BOD), Total Nitrogen (T-N), and Total Phosphorous (T-P) did not change, but the concentration of Suspended Solids (SS) during the rainy season increased to be 5.7 times greater than dry season due to the inflow of road surface sediments and large particles by early-stage storm water [8].
Yoon et al. (2006) conducted a sedimentation study of the depth of a sedimentation column using runoff water. The sedimentation rate of pollutants at different rainfall events showed very different results: the range of removal rates was large, and compared to a median curve of pollutants of combined sewer overflows (CSOs), the sedimentation rate curve of dry season sewage and surface runoff showed a tendency to decline [9]. This means that sediment removal of CSOs is possible despite the larger surface load amount and shorter residence time compared to dry sewage and surface runoff. Also, by this fact, we can conclude that pollutants generated by the re-flotation of sewer sediment have a significant effect. COD and SS showed similar sedimentation velocity change proportional to concentration. In other words, the higher the concentration at the beginning of study, the higher the removal rate of settling speed. This showed a similar trend to the study results of Randall et al. (1982) that showed that early concentration and SS removal by sedimentation were proportional [10]. For COD, setting 0.1 cm/s as the average sedimentation velocity, the removal rate of sedimentation velocity was 10% while it was 40% and 20% for CSOs and surface runoff, respectively. For SS, CSO was 50% and surface runoff was 20%.
As an alternative, Son et al. (2010) introduced the fiber filtration device. As the flow rate increases, the removal efficiency of suspended solids is lowered, but at speeds exceeding about 750 m3/m2/d, the treatment efficiency was not lowered significantly. T-P also showed a similar trend but compared to SS, T-P removal efficiency was relatively low [11]. In addition, Lucas et al. (2013) performed runoff water filtration with recycled organic and mineral materials through physical and numerical studies [12].
Lee et al. (2010) treated CSOs using a Vortex separator and a continuous filtration process device, and the result was that the removal efficiency of COD, BOD, T-N, and T-P was 50%, 50%, 8%, and 18%, respectively [8]. The removal efficiency of the Vortex separator was lower than the fiber filtration device, but if the fiber filtration device was operated alone, the treatment efficiency rapidly decreased because of rapid blocking of the fiber filter media by solids.
In this study, the filtration efficiency of micro-particles from NPS pollutants according to the different types of filtration materials were evaluated, focusing on road runoff and combined sewer overflows (CSOs), which are two major representatives of pollutants that largely affect the water quality of rivers among NPS pollutants. To examine the applicability of the sedimentation and filtration process as a technology for the treatment of NPS pollutants, the characteristics of the sedimentation in the pollutant flow has been investigated. The objective of this study is to propose a method to increase the applicability of sedimentation and filtration treatment processes by evaluation of the filter media as a main variable in the application of those characteristics to the filtration treatment process.

2. Materials and Methodology

2.1. Study Area and Field Study

In this study, water quality treatment efficiency and particle size distribution for each filter media ware examined. The water quality of road runoff and CSOs generated at a diverging tank were evaluated according to the discharge characteristics of NPS pollutants during rainfall. In the case of road runoff, highways, bridges, and three parking lots for Site A and Site B in Gyeonggi-Do, Korea were examined. The overview of investigation points and from field photos of NPS discharge characteristics are shown in Table 1.
Site A is located in a city road with five lanes, and each street storm water inlet has 525 m2 of drainage area. Site B is in a highway with five lanes, and each inlet has 210 m2 of drainage area, which is smaller than Site A. However, Site B is expected to have higher concentrations of contaminants since the movement of vehicles on the highway should be much faster. In order to determine the First Flush during the rainfall, sampling was conducted at five minute intervals by sequentially increasing the yield interval depending on water quality. A preceding case study of road runoff established that toxic substances such as heavy metals are found in fine particles.
For the water quality check, the SS category was measured over time during rainfall, and then COD, Pb, Zn, and Cu were analyzed for the sample where the maximum SS concentration was observed from each source. Additionally, size distribution analysis was conducted to examine the characteristics depending on size distribution.

2.2. Experimental Equipment and Methodology

Up-flow types are selected for the filtration method for NPS pollutants, and because of their high level of treatment efficiency and safety in operation, polymerized floatable filter media are mostly used. As a result, the most widely used in the market are Expanded Polypropylene and Expanded Polystyrene. Perlite is artificial soil made from the perlite formed by the volcanic process which is pulverized, heated, and expanded. As a many-pored light-weight soil, it has several attractive qualities: non-flammability, heat-insulation, sound adsorption, anti-chemical, and non-toxicity, and the volume is very light and has many pores, giving it excellent drainage and air permeability. The characteristics of zeolite are porosity, adsorption performance, and ion exchange performance. Making use of these properties, zeolite is mainly used for moisture removal, and for changing hard water to soft water. The physical characteristics of each filter media used in the experiment are shown in Table 2.
The experimental apparatus had two types: acrylic and stainless steel (STS). The surface area of the filter media was 289 cm2, the filter layer’s height was 50 cm, and by-pass was 40 cm from the upper part of the filter layer. In the case of acrylic, it was used as the experimental apparatus to test the treatment efficiency of outflow compared to inflow for each filter media, and the STS type was used for evaluating the treatment efficiency according to the change of the height of the filter layer by installing an outflow valve with intervals of 10 cm on the 50 cm-high filter media outlet. Figure 1a,b shows the schematic view of the experimental devices.
For the evaluation of filtration performance for road runoff, inflow was created in order to reproduce the water quality during real rainfall. The concentration of road runoff was modified to be similar to that of inflow by mixing tap water with dust collected from the road surface, which was filtered by an 850 μm sieve to remove excess particles. The linear velocity of inflow for the test experiment of treatment efficiency of NPS for each filter media was set as 950 m/day, which is the maximum linear velocity presented by the Ministry of Environment, Sejong-si, Korea. A standard pump was used in order to reach that velocity, and, in order to reproduce the water quality characteristics of CSOs, road dust was mixed into the tap water and waste water during rainfall. The SS concentration of this mixture representing the inflow raw water was in the range of 931–1450 mg/L. In order to keep the conditions constant, a separate agitator was placed in the two-ton water tank to mix the dust and inflow consistently, and for each filter media, inflow and outflow were collected and the particle size and water quality were analyzed at 10 min intervals.

3. Pollutant Characteristics in the Field

3.1. SS Monitoring

The characteristics of road runoff filtration in NPS pollution-reduction facilities using a filtration process were analyzed at roads, bridges, and parking lots in urban Sites A and B in Gyeonggi-Do during the winter time. The generation of road runoff pollution and particle characteristics were analyzed as follows. Site A showed a total rainfall of 6 mm and the intensity was 3 mm/h. Site B’s total rainfall was 15 mm and the intensity was 2.5 mm/h. An overview of the measurement site is described in Table 1. SS monitoring results at each point are shown in Table 3.
The monitoring results for each generation source regarding rainfall runoff in urban areas showed that region-wise, roads and bridges had higher SS concentrations than parking lots overall in Site A. In the case of Site A, it is assumed that a higher SS concentration was shown because the number of antecedent dry days (28 days) was longer than the 15 days of Site B, which allows more pollutants to be accumulated on the roads. Point-wise, it is assumed that roads and bridges showed higher concentrations because they have more pollutants generated due to a large number of vehicles driving at high speeds compared to parking lots. As shown in Table 3, the SS concentration change over time showed that, in spite of a small amount of rainfall (the rainfall intensity of Sites A and B was 3.0 mm/h and 2.2 mm/h, respectively), the maximum SS concentration occurred within 10 to 20 min and then decreased drastically. The regional concentration of roads, bridges and parking lots during the monitoring period were 4.0–25.7 times, 4.0–19.4 times and 2.6–6.0 times, respectively, and it was confirmed that the more antecedent dry days and the more traffic, the greater the difference in the concentration of rainfall road runoff.

3.2. Water Quality Analysis

First flush is defined as a phenomenon wherein highly-concentrated pollutants are discharged in the early stage of storm water, and the CSOs manual of the EPA in the United States defines the range of early stage storm water as “within 30 min after the beginning of rainfall discharge or until the time when concentration at early stage generation decreases to mean sewer concentration during dry season” [13]. Sansalone et al. (1997) defined it to be early stage storm water if the standard cumulative pollutant loads exceed the standard cumulative runoff curve [14]. In addition to this, Deletic, 1998 and Taebi et al. (2004) conducted research into early-stage storm water and reported that early-stage storm water phenomena are complicated and vary greatly according to regional characteristics [15,16]. According to Taebi et al. (2004), it was reported that as the urbanized area and impervious area ratio were higher, the first flush effects were greater [16]. It is expected that in the case of runoff water reduced by filtration facilities, treating the overflows of early-stage rainfall when pollutant loads are relatively higher is the preferred method of maximizing the reduction of pollutant loads.
As shown in Table 3, the result of SS monitoring for each generation source of rainfall road runoff in urban areas demonstrated that Site A, in general, had higher concentrations than Site B. Therefore, additional water quality analyses were conducted on Site A on items such as COD, Cu, Zn, and Pb. Five water quality parameters, including heavy metals, showed the concentration order for SS to be as follows: roads > bridges > parking lots. The COD concentration in road runoff was 1000 mg/L, 521 mg/L and 208 mg/L for roads, bridges and parking lots, respectively. This indicates that, because the organic material concentration mainly consists of particulate substances, as the SS concentration becomes higher, the organic material concentration also becomes higher. For heavy metal components Cu, Zn, and Pb were examined, and among those, Zn components were the highest. For roads, Cu, Zn, and Pb’s concentrations were 0.96 mg/L, 3.69 mg/L and 0.43 mg/L, respectively. For bridges, they were 0.57 mg/L, 2.39 mg/L and 0.28 mg/L, for Cu, Zn and Pb, respectively. Lastly, for parking lots, concentration of Cu, Zn and Pb were respectively 0.07 mg/L, 0.50 mg/L and 0.02 mg/L.
These results showed higher values compared to the existing research results of Kim et al. (2004), which showed the concentration of Cu as 0.01–1.0 mg/L and Pb as 0.01–0.3 mg/L [17]. It is assumed that the result is higher compared to other research because the time of investigation was in the middle of February when there were a greater number of antecedent dry days, and at the time of monitoring, the pollution loads were accumulated in snow on the motorway. Regionally, roads and bridges have more vehicles running at high speed, and thus there are more impurities on roads caused by tire and engine wear. Therefore, it was concluded that the concentration of not only SS but also COD and heavy metal were higher.

3.3. Particle Size Distribution of Pollutant

According to the SS monitoring results for road runoff, the most highly concentrated site, Site A, was selected as the representative area, and the result of SS concentration analysis on this site showed concentrations on roads, bridges, and parking lots as 1320 mg/L, 3004 mg/L and 518 mg/L, respectively. From this result, additional particle size analysis was conducted. The particle size distribution results regarding the maximum generation of Suspended Solids at the onset of road runoff during rainfall are shown in Table 4.
The particle size corresponding to 50% for each region showed similar results for road and bridge: 21.99 μm and 21.81 μm, respectively, but parking lots showed a difference with a value of 31.55 μm. The size representing 75% was also similar in roads (49.09 μm) and bridges (56.36 μm), but again the particle size in parking lots was distinct at 74.31 μm. This was a result of the fact that parking lots contain more particles, that are larger than 100 μm, compared to roads and bridges.
The volume ratio of particles under 10 μm was 24.4%, 27.2%, and 21.3% for roads, bridges, and parking lots, respectively, as shown in Table 5.
The volume ratio of particles under 100 μm, which are very hard to remove in the short retention time of a sedimentation process, was 88.4% for roads, 86.3% for bridges, and 78.5% for parking lots, which indicates that they consist mostly of micro-particles. The SS load ratio of particle sizes that were in a range of 60–100 μm are shown in Table 5 according to region.

4. Investigation of Filter Media Characteristics

4.1. Hydraulic Characteristics for Each Media

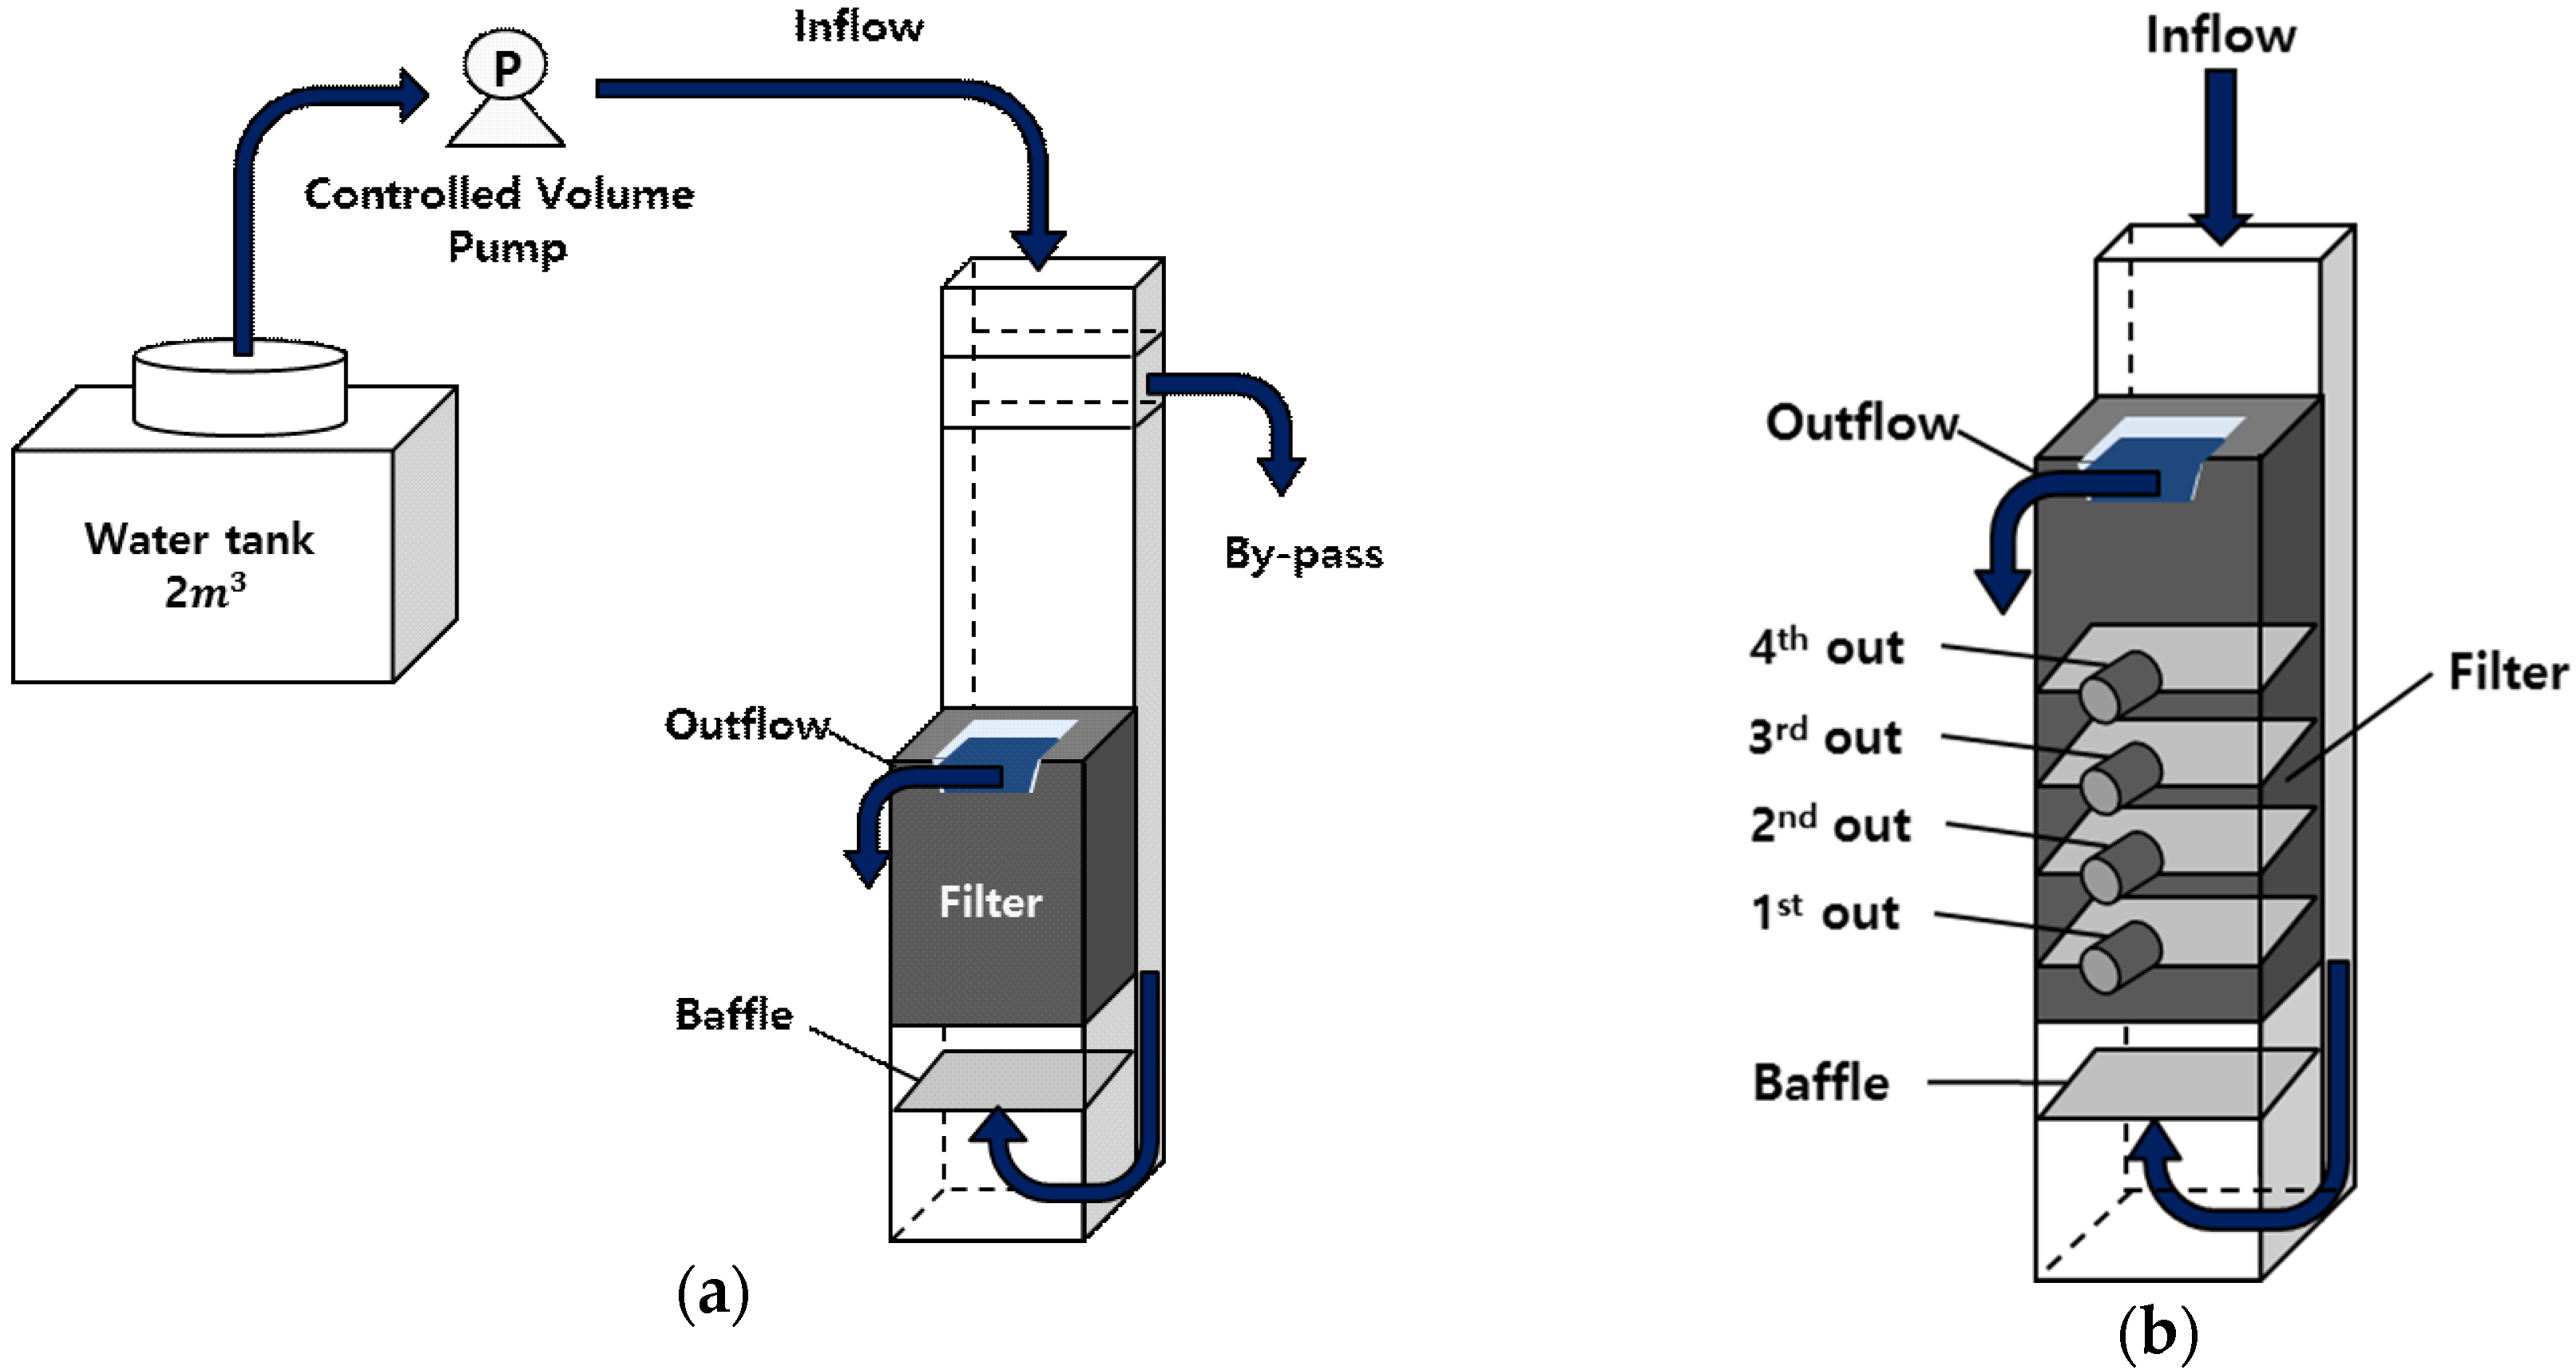
Experimental conditions were the same for each filter media, except that the concentration of inflow raw water differed according to the difference in road surface dust mixed in the course of the experiment. The rate of inflow for each filter media was set at a constant filtration velocity of 950 m/day based on filtration cross-sectional area (289 cm2) of experimental equipment by using a standard pump and pouring inflow of 1.144 m3/h constantly through the flow rate control valve. The result of head loss measurement for each filter media by road runoff during the procedure period up to 4 h are shown in Table 6.
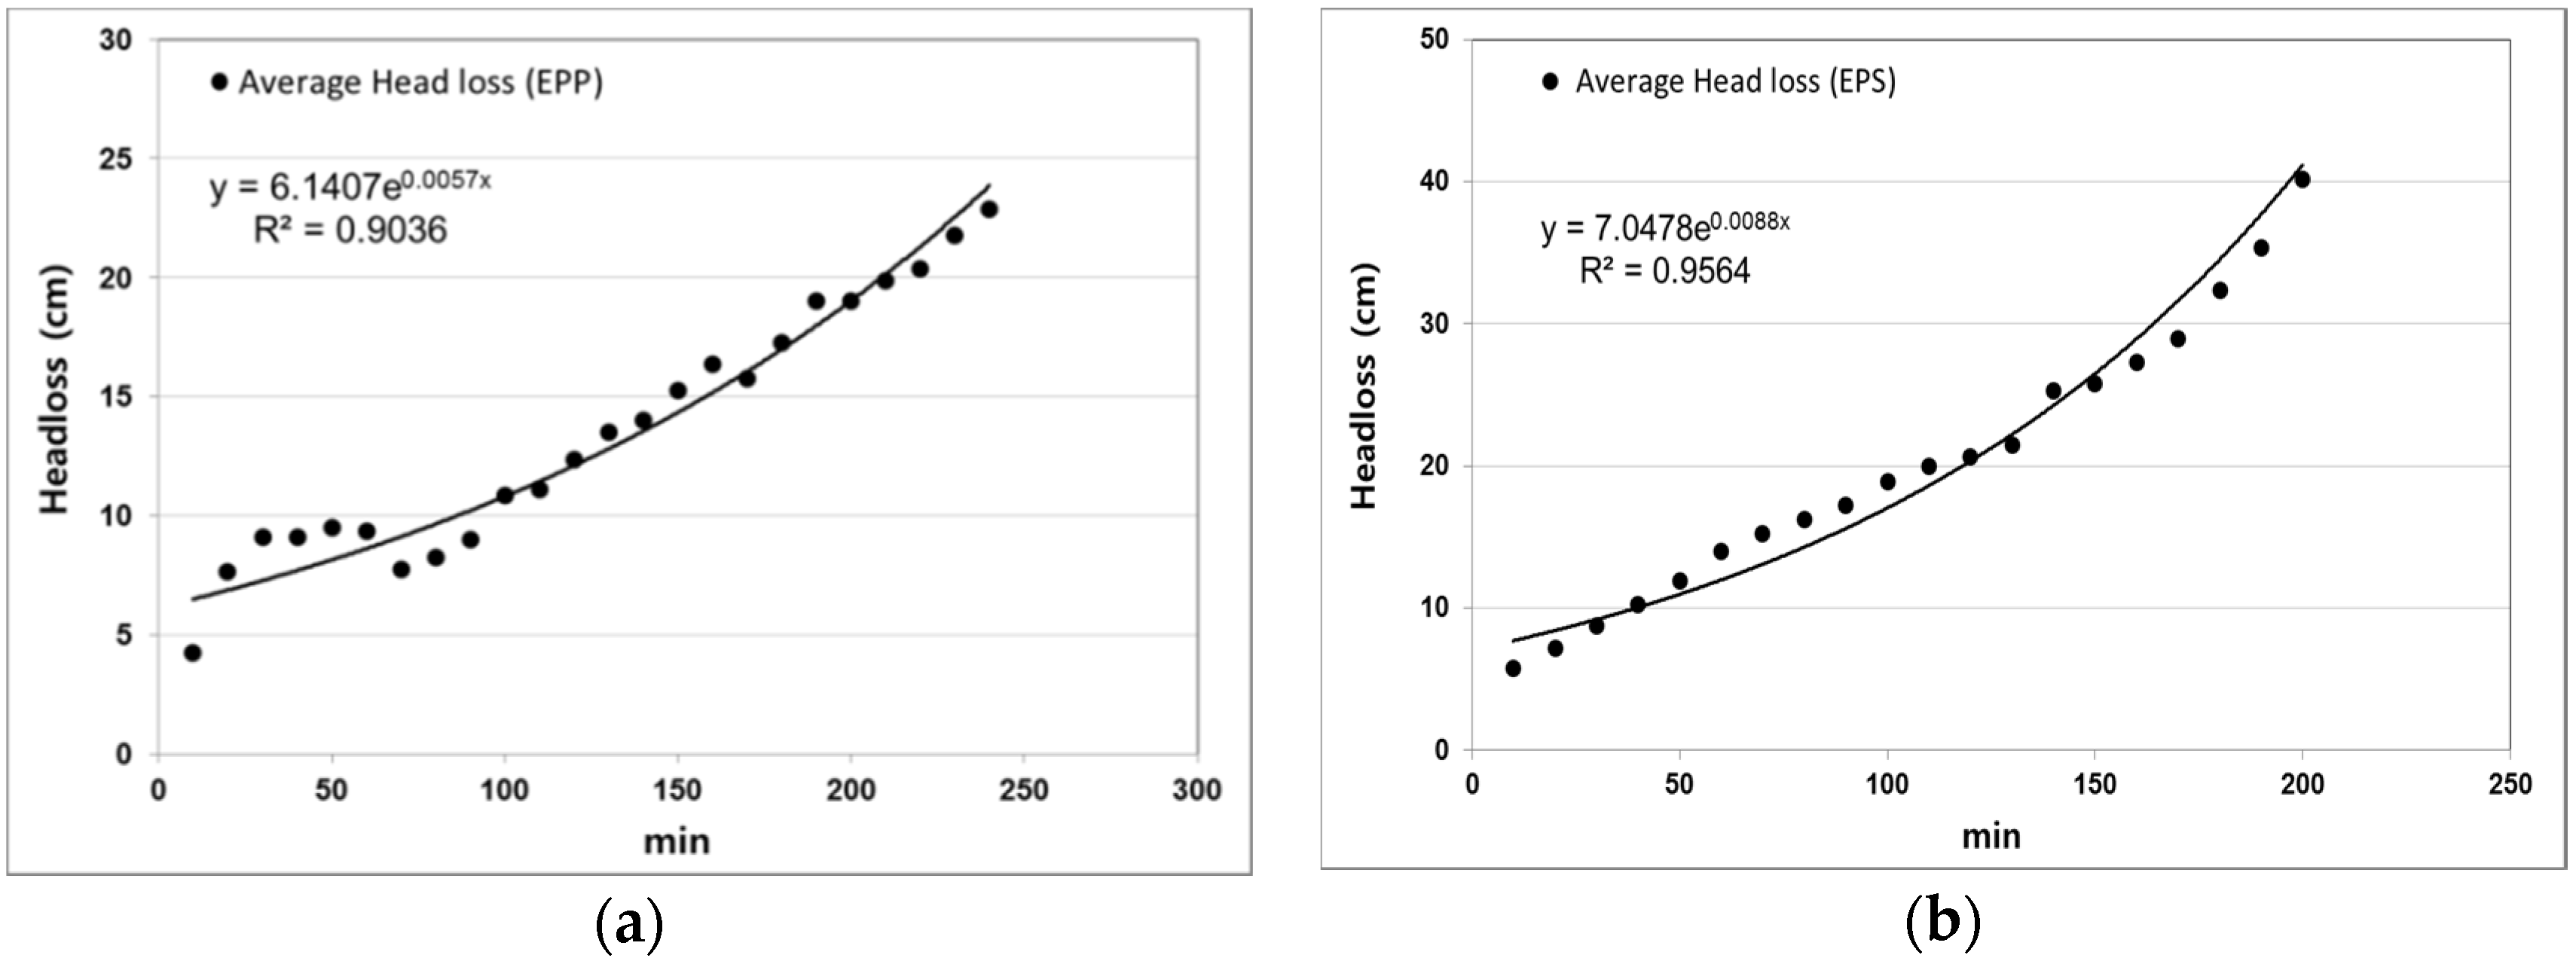
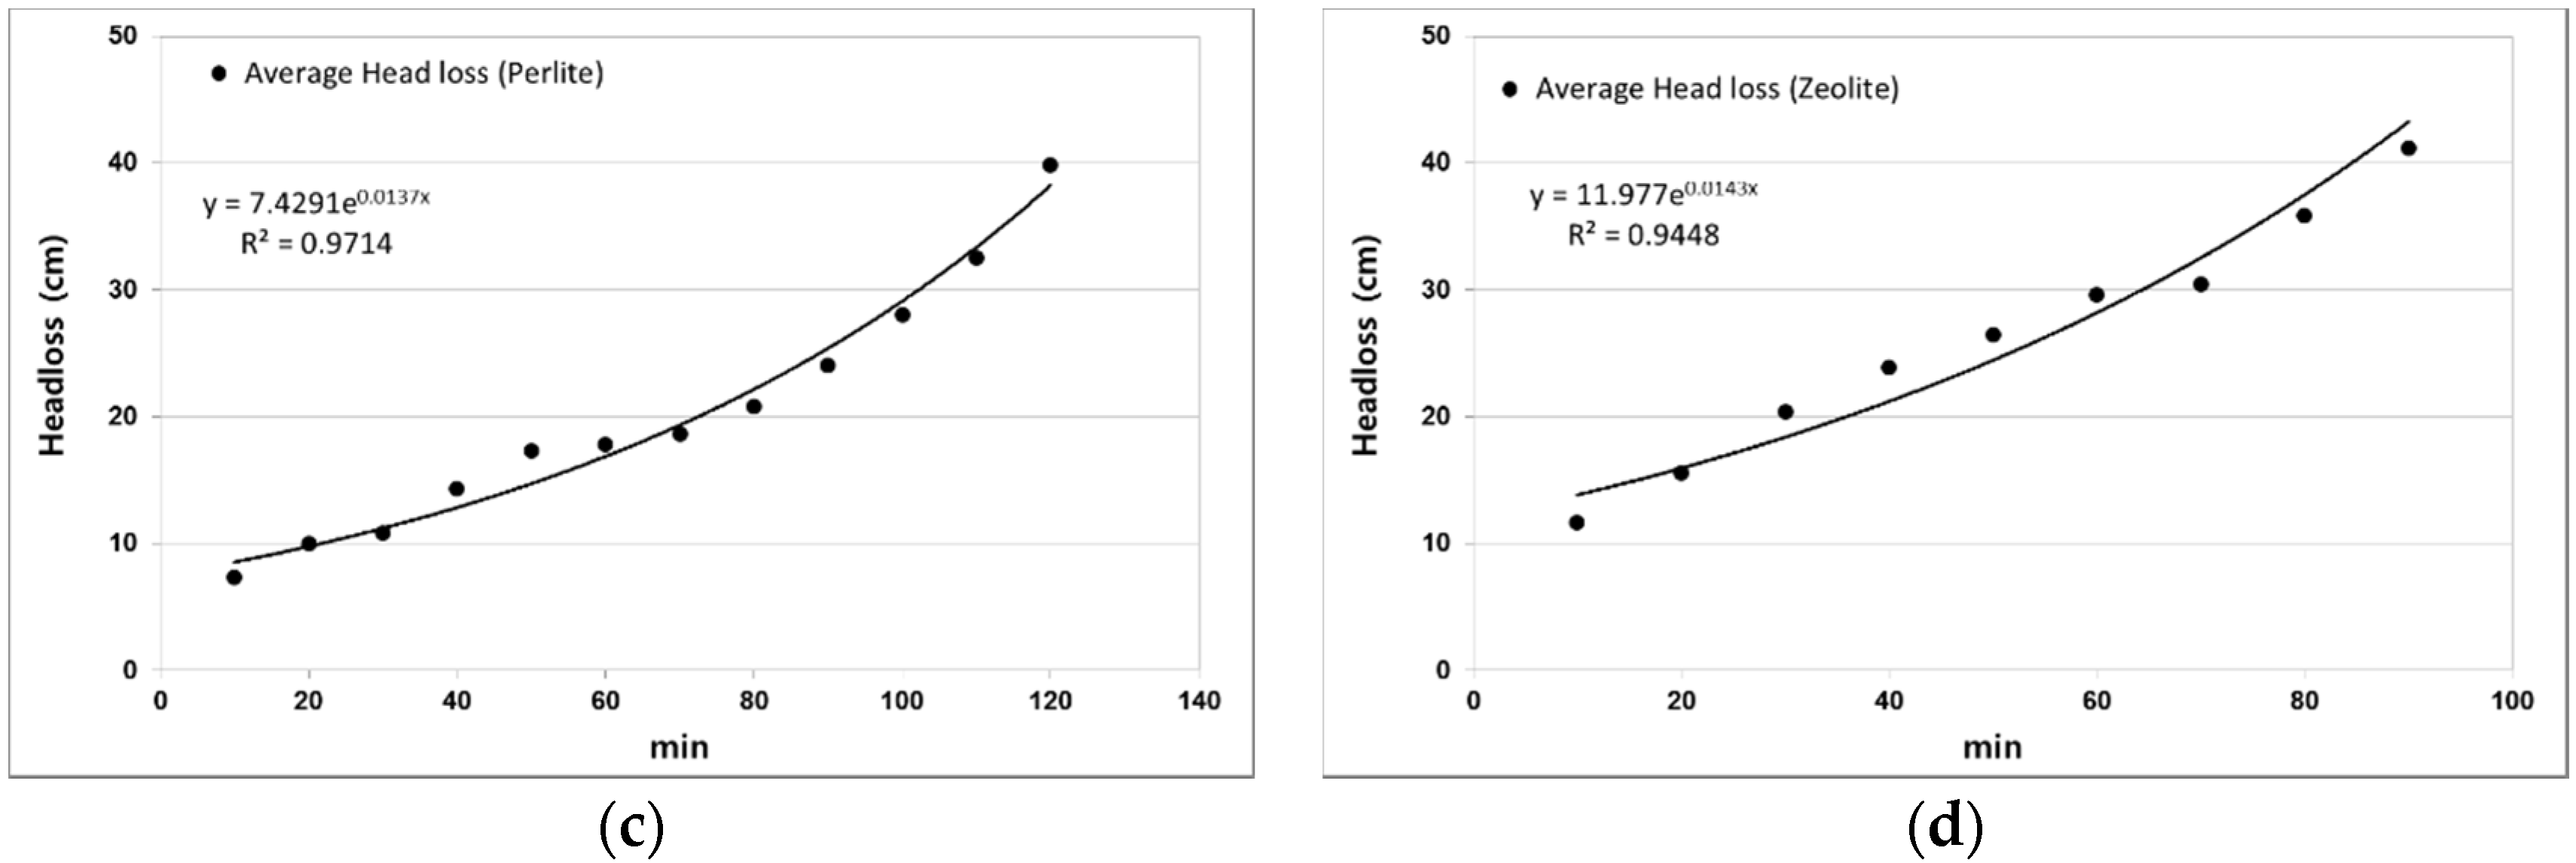
Zeolite showed the shortest time to reach the head loss limit overflow, which was only 90 min. Perlite and EPS respectively took 120 and 200 min. It was also confirmed that the average head loss of EPP was 23, so overflow did not happen, even after 240 min. To standardize the head loss for each filter media, the head loss over time was expressed in an exponential function and the result of the regression is shown in Figure 2 and Table 7.
The exponential function from the regression of charts in Figure 2 can be expressed as,
Y = a e b x
where Y(m) is head loss, a and b are unitless regression coefficients, and x(min) is elapsed time.
For each filter medium, the time taken to reach the maximum head loss of 40 cm was recorded, and it took 215, 134, 104 min, respectively, for EPS, perlite, and zeolite, and the result was very similar to the calculation made by the experiment. EPP did not reach the head loss until 240 min into the experiment, but calculation by log function was shown to be 357 min.
Among the filter media used in the experiment, zeolite was the only non-buoyant filter media that has a specific gravity greater than 1, and by operating with upward type, the concentrated filtration of particulate pollutants occurred at the bottom of the filter layer, which seemed to cause the rapid blockage of the filter medium. Among buoyant filter media, for perlite the limit head loss was reached in the shortest time because the filter media is crushed when operating at maximum linear velocity and generates fine particles. They accumulate at the bottom of the filter layer in which particulate pollutants are mixed and this causes the limit head loss to be reached more quickly.
In the case of EPP and EPS, the crushing of the filter media by high filtration velocity as in perlite was not observed. However, we propose that the physical differences in the porosity of the two filter media, the specific surface area, and the distribution of micro pores causes EPP to show a lower increase of head loss over time compared to EPP. It was shown that the impact of hydraulic loads on head loss over filtration time for four types of filter media could be ordered as follows: zeolite > perlite > EPS > EPP, which suggests that EPP is impacted the least by hydraulic loads compared to other filter media. Therefore, EPP is the most suitable media for NPS reduction facilities operating at high filtration linear velocities for the treatment of road runoff.

4.2. Filtration Characteristics According to the Filter Media

For the four selected filter media (EPP, EPS, perlite, zeolite), to test the filtration treatment efficiency for road runoff, the filtration linear velocity was set to 950 m/day—the maximum velocity of filtration treatment facilities proposed by the Ministry of Environment, and the limitation head was set to 40 cm, considering the economic and field applicability conditions of the treatment facilities. For each filter media, the change in head loss over time, four water quality parameters (SS, COD, Zn, Cu) before and after treatment, and particle size analysis were conducted.
For each filter medium, the average SS influent concentration for road runoff was in the range of, on average, 718.7 mg/L–901.3 mg/L; for EPP, EPS, perlite and zeolite, they were respectively 71.9 mg/L, 98.3 mg/L, 95.4 mg/L, and 116.7 mg/L, and the average treatment efficiencies were 89.0%, 85.3%, 88.5%, and 84.9%, respectively. Zeolite showed the lowest efficiency and EPP showed the highest. In the experimental procedure, there was a massive difference in the concentration of influent according to the inflow time and the amount of the road surface dust mixed into the influent, but regardless of the type of filter media, the quality of treated water showed quite a constant concentration range, and treatment efficiency was over 80%. When we look at each filter media, zeolite, which showed the lowest SS treatment efficiency, suddenly showed a treatment efficiency lower than 80%. It was determined that the reason is because of the temporary exposure of micro-particles collected at the filter layer 40 to 70 min after the experiment started at the high filtration linear velocity of 950 m/day. For perlite, the filter media was gradually crushed over time, and from 80 min after the experiment (when head loss drastically increased), the treatment efficiency tended to decrease gradually. In the case of EPS, after 10 min from the beginning of the experiment, the average SS treatment efficiency was the lowest at 78.4%. It was determined that the efficiency temporary decreased because the filter layer was not yet stabilized. EPP showed a stable treatment efficiency over time of over 85% without any increase or decrease in efficiency.
The results of treatment efficiency, average COD concentrations of treated water, and influent over time classified by filter media are shown in Table 8.
For each filter medium, the average COD influent concentration for road runoff was in the range of 107.7 mg/L–193.6 mg/L; for EPP, EPS, Perlite, and zeolite, they were respectively 16.8 mg/L, 37.2 mg/L, 29.3 mg/L, and 33.3 mg/L, and the average treatment efficiency of SS was over 80%, which was similar for all filter media. However, for the treatment efficiency of COD, only EPP filter media showed the high treatment efficiency of 89%, and other filter media showed lower treatment efficiencies ranging about 63.4%–80.2% compared to the SS category. In the previous case study about removal property of contaminants in storm water runoff by filter media, Kim et al. (2009) reported that COD removal efficiency was 70%–92% when studying perlite and synthetic filter media of polystyrene lines, and Lee and Kim (2008) reported that removal efficiency of COD was over 90% for the treatment device combined with zeolite filter media and eddy current [18,19]. Lee and Kim also suggested a correlation between categories of each pollutant by early-stage storm water runoff and reported that the correlation of COD for SS were 0.756–0.962. In addition, they reported that if the total amount of SS elimination through filter media was taken as 1, COD could remove 0.92, which was the highest value [19].
Among the heavy metals that are included in the storm water runoff of urban areas, Zn and Cu are pollutants caused by the transportation of vehicles, and most heavy metals are attached to buoyant materials. Moreover, it has been reported that the concentration of heavy metals generally increases as the particles size decreases; the highest concentrations are shown at sizes below 50 μm [20,21]. Park et al. (2007) monitored the five categories (Zn, Cu, Pb, Cr, Cd) of heavy metals in road runoff for 2 years and reported that reduction measures concentrating on Zn and Cu are necessary because the concentration of Zn and Cu were higher compared to others due to the usage of brakes and the wearing of tires [22].
Kim et al. (2009) reported that, for dissolved materials and organic substances, the absorption of dissolved organic substances through the chemical properties of filter media, such as ion exchange within filter media or electrical force, are very low (average 10%), despite research about the removal characteristics of dissolved materials by filter media. In addition, they reported that several hours of contact time (according to their chemical properties) are needed in order to remove the pollutants [18].
The average Zn influent concentration for road runoff was in the range of 1.33 mg/L–2.43 mg/L; for EPP, EPS, perlite, and zeolite, they were respectively 0.33 mg/L, 0.54 mg/L, 0.42 mg/L, and 0.88 mg/L. The average Cu influent concentration for road runoff was in the range of 1.01 mg/L–1.58 mg/L for EPP, EPS, perlite, and zeolite were 0.17 mg/L, 0.36 mg/L, 0.20 mg/L, and 0.36 mg/L, respectively. Looking at the average removal efficiency for each filter medium, in the case of Zn, a treatment efficiency decrease can be organized in the following order: EPP (77.1%) > perlite (72.2%) > zeolite (63.6%) > EPS (59.7%). In the case of Cu, the order is as follows: EPP (88.2%) > perlite (82.1%) > zeolite (72.0%) > EPS (65.1%), which indicates that for both cases, EPP shows the highest treatment efficiency, while EPS shows the lowest. The average dissolved Zn and Cu concentration ratio of influent for each filter medium were observed to be 6.6%–13.5% for Zn and 4.1%–7.0% for Cu. It was determined that the dissolved concentration ratio result was very low compared to preceding research cases, where the dissolved ratio of heavy metals in road runoff that are classified under the size of 0.45 μm make up more than 50% of the heavy metals because the experiment was conducted by randomly manufactured influent.
To sum up, it is proposed that the removal mechanism of heavy metals present in road runoffs mostly depends on physical collection by the filter media according to its characteristics; among the four filter media used in this experiment, the EPP filter media’s micro-pores proved most advantageous in removing heavy metals that contain a lot of particulate substances, and EPS filter media are less advantageous.

4.3. Removal Rate of Each Medium

4.3.1. Particle Size Distribution of Outflow by Filtration

In order to determine the removal mechanism for micro-particles that have relatively-greater pollutant loads in samples collected over time in road runoff for each filter medium, the particle size analyses were conducted at 30 min intervals, and the results are shown in Table 9.
As the particle size of water treated by filter media compared to influent gets smaller, the removal of micro-particles is at an advantage and it can be indirectly determined that the treatment efficiency decreases for particle sizes lower than that. The particle size of motorway runoff pollutant was analyzed between 78.1 μm and 317.3 μm in size, for particles that fall under the volume ratio within 50%–90% of the average particle size distribution. The results showed that D (0.1) was in the range of 2.6 μm–4.4 μm, D (0.5) was in the range of 14.4 μm–25.7 μm, and D (0.9) was in the range of 68.6 μm–98.5 μm.
For each filter media, excluding D (0.1) for which the size is similar, the D (0.5) of treated water can be organized in decreasing order as follows: perlite (25.7 μm) > EPS (21.6 μm) > EPP (18.9 μm) > zeolite (14.4 μm). D (0.75) of treated water can be organized in decreasing order as follows: perlite (53.5 μm) > EPS (48.1 μm) > EPP (38.6 μm) > zeolite (33.4 μm). D (0.9 μm) of treated water can be organized in decreasing order as follows: EPS (98.5 μm) > perlite (89.3 μm) > EPP (70.9 μm) > zeolite (68.6 μm). Therefore, zeolite showed the smallest particle size and perlite and EPS showed larger particle size compared to other filter media.
Looking at the change in particle size distribution over time, the particle size of outflow tended to increase gradually for all media except zeolite. It is determined that the reason for this comes from the gradual blockage of pores caused by collection of micro-particles on pores and the greatest increase of size was shown for EPS filter media and D (0.9) which corresponds to 90% volume ratio.

4.3.2. Efficiency Classified by Particle Size Distribution

For each filter medium, SS treatment efficiency, classified by size distribution, was calculated along with the size distribution and SS results of influent and treated water over time. When calculating the SS treatment efficiency, all particles were assumed to be spherical and the range of particle sizes was classified into nine steps (less than 100: step 6, over 100: step 3). The specific gravity for each particle size was referred to the specific gravity classified by road surface dust particle size proposed by USEPA and classified into 3 steps (less than 30 μm: 2.14, 30 μm–60 μm: 2.15, over 60 μm: 2.6).
The calculation process of SS removal efficiency classified by particle size distribution was as follows: volume ratio was deducted from the particle size distribution results, and this result was then converted to weight ratio by applying the specific gravity corresponding to the range of particle size and SS loads (g), classified by particle size distribution and treatment efficiency, and calculated by applying the SS concentration to the converted weight ratio.
The calculation results of SS treatment efficiency, classified by particle size distribution and calculated for each filter medium is shown in Table 10.
Regardless of the type of filter media, the range of particle sizes greater than 100 μm had over 95% of treatment efficiency, whereas in the range of particle sizes under 100 μm, the treatment efficiency tended to decrease as the particle size decreased. Classifying by filter media, zeolite and EPS showed a greater decrease in treatment efficiency based on the decrease in particle size compared to EPP and perlite. For particles with sizes greater than 100 μm, the treatment efficiency was high, and it is determined that the reason for this is that they precipitate at the bottom before they are exposed passing through the filter media in an upward system. For particles with a size less than 100 μm, which are treated by collecting while passing through the filter media, treatment efficiency varied according to the properties of filter media.
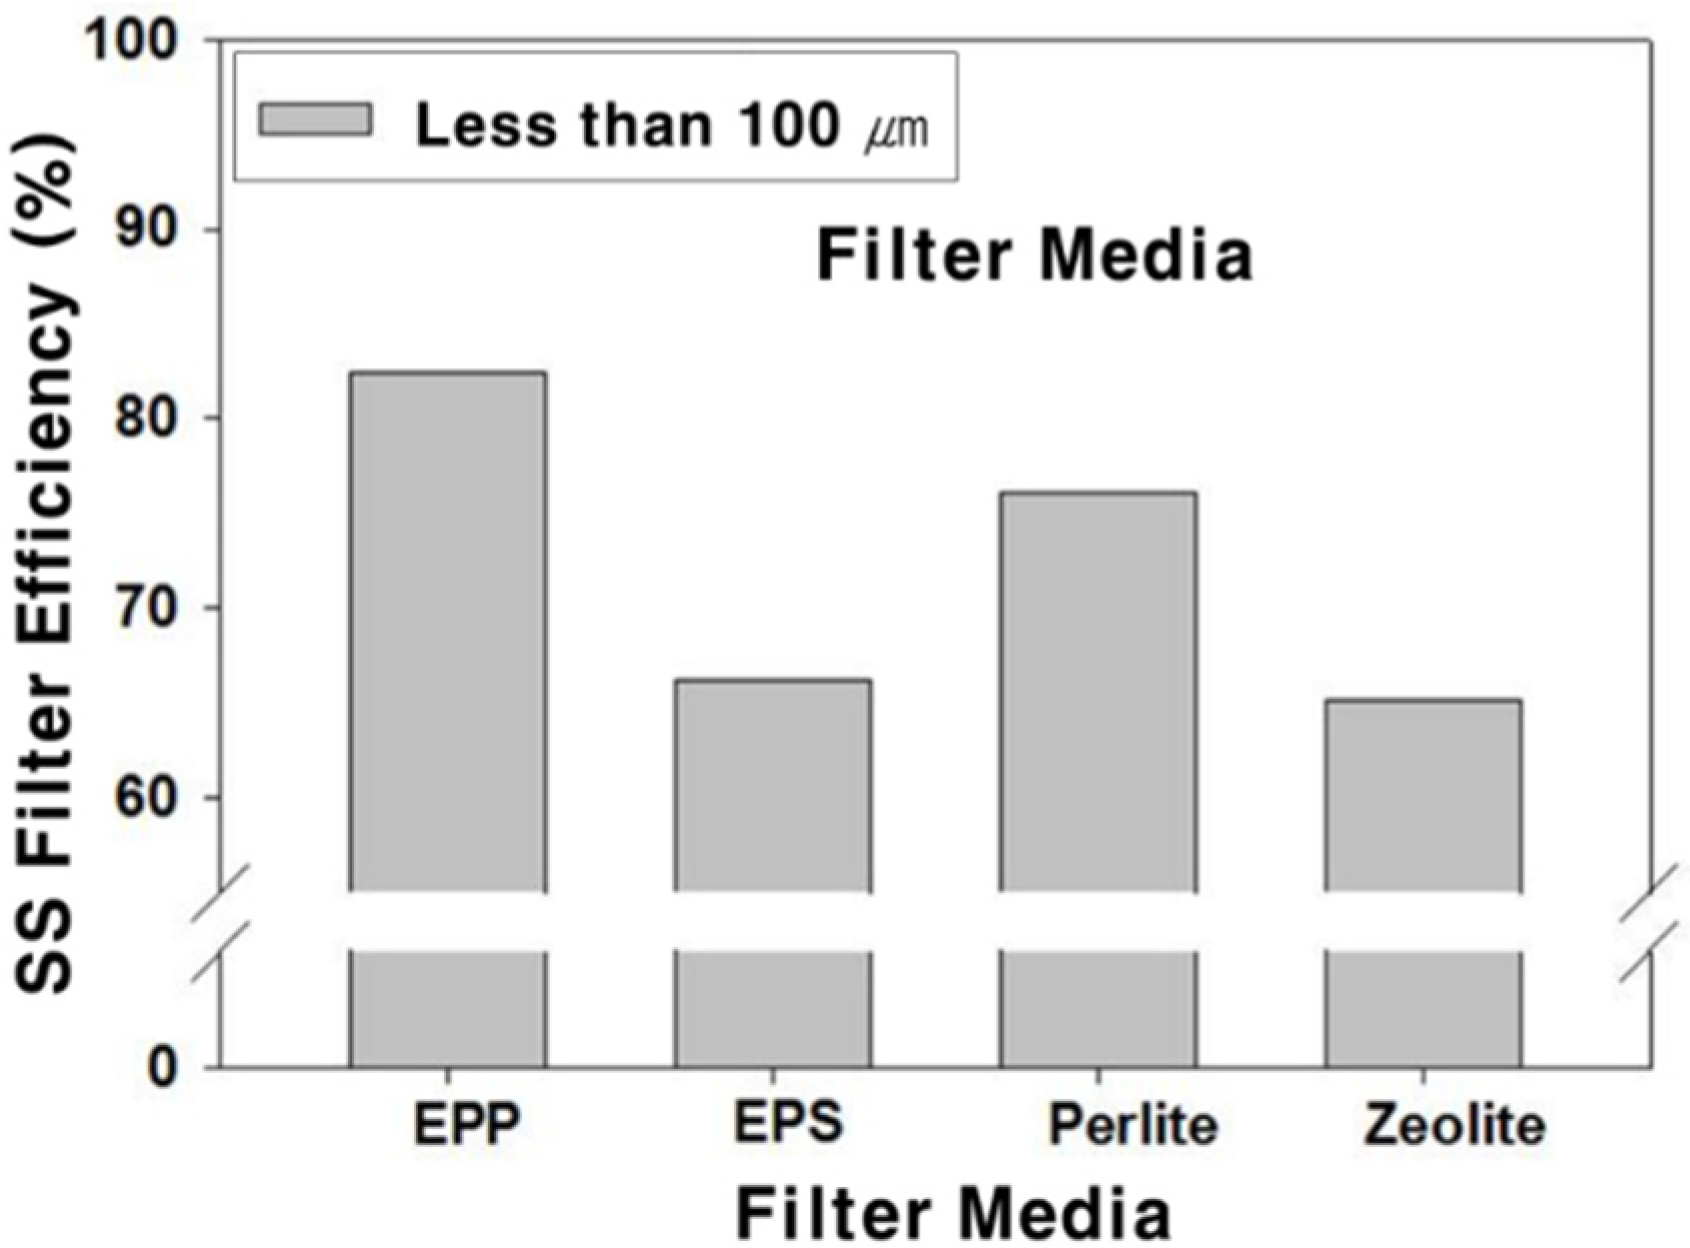
Figure 3 shows the average SS removal efficiency by each filter medium for micro-particles with size less than 100 μm. The efficiency was shown to be in decreasing order as follows: EPP (82.4%) > perlite (76.1%) > EPS (66.2%) > zeolite (65.2%), which confirmed the fact that EPP filter media are more favorable compared to other filter media for the treatment of micro-particles that have high pollutant loads. For EPP filter media, the treatment efficiency according to particle size distribution is more than 80% for small particles under 30 μm. Therefore, EPP can manage the broad size range of pollutant particles.
For EPS, perlite, and zeolite filter media, their treatment efficiency is more than 80% for particles over 40 μm—quite a small treatment range.

5. Summary and Conclusions

This study discusses the filtration treatment of non-point source (NPS) pollution generated from combined sewer overflows and road runoff. The physical and hydraulic characteristics of pollutants were investigated through field work and experiments. In addition, the characteristics of filter media as a part of the initial treatment method, such as physical properties, treatment efficiency, and hydraulic characteristics were also analyzed. In order to conduct comparison analyses of treatment efficiency classified by filter media within the filtration process, the four typically-used filter media—Expanded Polypropylene (EPP), Expanded Polystyrene (EPS), perlite, and zeolite—were used and analyzed. For experimentation and analysis, a lab-scale upward device-type filtration reactor was constructed. In addition, in order to deduce various design factors, brief numerical simulations were practiced side by side, with the following results.
First, through lab-scale experiments, filtration processes for road runoff samples were conducted and the results showed that expanded polypropylene among the four filter media evaluated showed an 89% removal efficiency of non-point pollutants (SS, COD). In addition, the removal efficiency of heavy metals such as Zn and Cu by EPP was approximately 80%, which was a 7%–40% higher removal efficiency compared to that of other filter media.
Second, the recurrence days of filter media among filtration processes for non-point pollutants were studied and the result showed that zeolite, perlite, Expanded polystyrene, and expanded polypropylene showed blockage of filter media after 43, 60, 100, and 163 days, respectively, which supported the fact that EPP was the most favorable with respect to recurrence days.
Third, in order to analyze the particle size distribution characteristics of particles with size less than 100 μm, which require a filtration process determined based on the NPS generation source—the runoff of roads, bridges, and parking lots were analyzed and the result was that the micro-particle ratio was highest for road runoff and the order was as follows: roads > bridges > parking lots.
This study suggests the proper filter media to be used when applying filtration technology as a treatment process for NPS pollution, such as road runoff and CSOs. The study result of removal characteristics of pollutants in sedimentation and the filtration process can be applied to the proper design and operation variables of filtration treatment devices for non-point pollutants.
For future study, a review of filter media cleaning methods and an understanding of the relation between filter media and filtration duration time are necessary for the improvement of non-point pollutants inflow function and improved performance of filtration treatment equipment. It is expected that a more efficient treatment process can be suggested by conducting various studies into structure forms for filtration.

Acknowledgments

This research was supported by a grant [MPSS-NH-2015-79] through the Disaster and Safety Management Institute funded by Ministry of Public Safety and Security of Korean government.

Author Contributions

Byeon led the work performance and wrote the manuscript; Koo coordinated the research and contributed to writing the article; Jang collected data and Baeck generated the result. All authors read and approved the final manuscript.

Conflicts of Interest

The authors declare no conflict of interest.

References

  1. Dai, H.; Sun, T.; Zhang, K.; Guo, W. Research on Rural Nonpoint Source Pollution in the Process of Urban-Rural Integration in the Economically-Developed Area in China Based on the Improved STIRPAT Model. Sustainability 2015, 7, 782–793. [Google Scholar] [CrossRef]
  2. Choi, J.Y.; Shin, E.S.; Lee, D.H. A Study on the Urban Non-Point Source Pollutant Loadings in Seoul. J. Korean Soc. Water Environ. 1999, 15, 315–323. [Google Scholar]
  3. Lee, H.S.; Choi, G.W.; Kim, N.K. The Analysis of Characteristic of Efficiency in the Diffusion Pollution Improvement Facilities with Vortex Type according to Detention Time. Korean Rev. Crisis Emerg. Manag. 2013, 9, 127–136. [Google Scholar]
  4. Nichols, P.; Lucke, T.; Drapper, D. Field and Evaluation Methods Used to Test the Performance of a Stormceptor® Class 1 Stormwater Treatment Device in Australia. Sustainability 2015, 7, 16311–16323. [Google Scholar] [CrossRef]
  5. Jin, Y.H.; Park, S.C. Study on the Discharge Characteristics of Non-point Pollutant Source in the Urban Area of the Youngsan-River Basin. J. Korean Soc. Water Environ. 2006, 22, 605–613. [Google Scholar]
  6. Cho, Y.J.; Lee, J.H.; Bang, K.W.; Choi, C.S. Water Quality and Particle Size Distributions of Bridge Road Runoff in Storm Event. J. Korean Soc. Environ. Eng. 2007, 29, 1353–1359. [Google Scholar]
  7. Lee, S.Y.; Oh, J.H.; Ryu, S.H.; Kwon, B.G.; Jung, T.H. Analysis of Hydrodynamic Separators for Combined Sewer Overflows and Strom water Runoff Control. J. Korean Soc. Water Wastewater 2005, 19, 117–124. [Google Scholar]
  8. Lee, B.J.; Na, J.H.; Kim, J.S.; Joo, J.Y.; Bae, Y.S.; Jung, I.H.; Park, C.H. A Study on Treatment of CSOs by Vortex Separator and Continuous Fiber-Filter System. J. Korean Soc. Water Wastewater 2010, 24, 443–451. [Google Scholar]
  9. Yoon, H.S.; Lee, D.J.; Park, Y.S. Application of Particle Size Analysis to Predict the Settleability of CSO Pollutants. J. Korean Soc. Water Wastewater 2006, 20, 295–302. [Google Scholar]
  10. Randall, C.W. Stormwater detention ponds for water quality control. In Stormwater Detention Facilities: Planning, Design, Operation, and Maintenance; American Society of Civil Engineers: Fairfax County, VA, USA, 1982; pp. 202–204. [Google Scholar]
  11. Son, S.M.; Jutidamrongphan, W.; Park, K.Y.; Park, C.H. Performance of fiber media filter device for combined sewer overflows treatment. J. Korean Soc. Water Wastewater 2010, 24, 231–236. [Google Scholar]
  12. Lucas, S.; Lee, C.C.; Love, E. The performance of recycled organic and mineral materials as reactive filter media based on column studies and music v5 modelling. In Proceedings of the 2013 Stormwater NSW Conferencethe, Blue Mountains, Leura, Australia, 17–19 September 2013.
  13. U.S. Environmental Protection Agency (USEPA). Combined Sewer Overflow Control; USEPA: Washington, DC, USA, 1993. [Google Scholar]
  14. Sansalone, J.J.; Buchberger, S.G. Partitioning and First Flush of Metals in Urban Roadway Storm Water. J. Environ. Eng. 1997, 123, 134–143. [Google Scholar] [CrossRef]
  15. Deletic, A. The First Flush Load of Urban Surface Runoff. Water Res. 1998, 32, 2462–2470. [Google Scholar] [CrossRef]
  16. Taebi, A.; Droste, R.L. First Flush Pollution Load of Urban Storm water Runoff. J. Environ. Eng. Sci. 2004, 3, 301–309. [Google Scholar] [CrossRef]
  17. Kim, L.H.; Kang, J.H. Determination of Event Mean Concentrations and Pollutant Loadings in Highway Storm Runoff. J. Korean Soc. Water Environ. 2004, 20, 631–640. [Google Scholar]
  18. Kim, T.G.; Cho, K.W.; Song, K.G.; Yoon, M.H.; Ahn, K.H.; Hong, S.K. Evaluation of the Removal Characteristics of Pollutants in Storm Runoff Depending on the Media Properties. J. Korean Soc. Environ. Eng. 2009, 31, 483–490. [Google Scholar]
  19. Lee, H.C.; Kim, H.G. A Study on the Characteristics of Filter Media for Filtration System to Control Water Quality of the First-flush. J. Korean Soc. Water Sci. Technol. 2008, 16, 29–38. [Google Scholar]
  20. Liebens, J. Heavy Metal Contamination of Sediments in Storm Water Management System: The Effect of Land-Use, Particle Size and Age. Environ. Geol. 2001, 41, 341–351. [Google Scholar]
  21. Jartun, M.; Ottesen, R.T.; Steinnes, E.; Volden, T. Runoff of particle bound pollutants from urban impervious surfaces studied by analysis of sediments from stormwater traps. Sci. Total Environ. 2008, 396, 147–163. [Google Scholar] [CrossRef]
  22. Park, S.W.; Oh, J.I.; Choi, Y.H.; Kim, J.H.; Ha, J.W. Characteristics of Non-point Pollutants from the Road Runoff (2): Heavy Metals and Pathogens. J. Korean Soc. Water Wastewater 2007, 21, 235–242. [Google Scholar]
Figure 1. Schematic diagram of the experimental device: (a) Acrylic material device for lab-scale experiment; (b) Stainless steel type for field application.
Sustainability 08 00450 g001
Figure 2. Headloss characteristics of road runoff by each filter media: (a) Average head loss by using EPP filter media; (b) Average head loss by using EPS filter media; (c) Average head loss by using perlite filter media; (d) Average Head loss by using zeolite filter media.
Sustainability 08 00450 g002aSustainability 08 00450 g002b
Figure 3. SS treatment efficiency for small particle sizes.
Sustainability 08 00450 g003
Table 1. Overview of investigation sites. COD: Chemical Oxygen Demand; SS: Suspended Solids.
CategorySite CharacteristicsTimeTotal Rainfall (mm)Preceding Dry days (days)Survey Items
Road RunoffSite ACity road with 5 lanes18 February 2013628- Water Quality (COD, SS, Pb, Zn, Cu)
Drainage area: 525 m2- Particle size analysis
(Per 1 street inlet)
Site BHighway with 3 lanes25 February 20131515- Water Quality (COD, SS, Pb, Zn, Cu)
Drainage area: 210 m2- Particle size analysis
(Per 1 street inlet)
Table 2. Physical properties of filter media. EPP: Expanded Polypropylene; EPS: Expanded Polystyrene.
ItemsEPPEPSPerliteZeolite
Appearance Sustainability 08 00450 i001 Sustainability 08 00450 i002 Sustainability 08 00450 i003 Sustainability 08 00450 i004
Particle size1.0–3.0 mm2.0–3.0 mm1.0–3.0 mm1.0–4.0 mm
Specific gravity0.80.80.04–0.252.01–2.20
Porosity80% over33%80%45%–55%
Specific surface siteOver 800 m2/m3Over 500 m2/m3600 m2/g600–700 m2/g
Distribution of micro pores50–300 μm100–500 μm20–100 μm3–20 μm
Table 3. SS concentration by road runoff source.
DivisionSource QuantitySS Concentration (mg/L)
MinimumMaximumAverage
Site ARoads811730041091
Bridges11681320445
Parking lots887518229
Site BRoads1674298178
Bridges15154611345
Parking lots14121313197
Table 4. Road runoff particle size distribution results.
DivisionParticle Size (μm)
RoadsBridgesParking Lot
D(0.1)4.704.084.65
D(0.25)10.749.3512.33
D(0.5)21.9921.4331.56
D(0.75)49.0956.3674.31
D(0.9)102.34129.13184.34
Table 5. Volume and load ratios by each particle size range.
Particle Size (μm)RoadsBridgesParking Lots
Volume (%)Load (%)Volume (%)Load (%)Volume (%)Load (%)
<1024.423.427.226.121.319.9
10–6056.254.051.849.846.943.9
60–1007.89.17.38.510.311.8
100<11.613.513.515.721.524.4
Table 6. Time to reach the limit head loss of each filter medium at maximum filtration velocity.
DivisionEPPEPSPerliteZeolite
Influent SS concentration range (mg/L)261–1886261–1886533–2020463–1546
Average (mg/L)722.6718.7901.3833.2
Limit head loss reaching time (min)unreached20012090
Table 7. Standardization of headloss through expression by exponential function.
DivisionEPPEPSPerliteZeolite
Coefficient “a”6.14077.04787.429111.977
Coefficient “b”0.00570.00880.01370.0143
Root mean square error0.90360.95640.97140.9448
Elapsed time (min)Calculated357215134104
Observed-20012090
Table 8. COD removal efficiency by each filter medium.
DivisionNumber of SamplesSS concentration (mg/L, Average ± Standard Deviation)
EPPInfluent16193.6 ± 87.5
Treated water1616.8 ± 6.8
Removal rate (%) 89.3 ± 5.4
EPSInfluent14107.7 ± 25.3
Treated water1437.2 ± 15.3
Removal rate (%) 63.4 ± 12.0
PerliteInfluent8190.4 ± 99.3
Treated water829.3 ± 6.6
Removal rate (%) 80.2 ± 11.6
ZeoliteInfluent6148.5 ± 45.8
Treated water633.3 ± 10.1
Removal rate (%) 76.8 ± 6.1
Table 9. Particle size distribution of influent and treated water for each filter medium.
DivisionNumber of SamplesParticle Size (μm, Average ± Standard Deviation)
D (0.1)D (0.5)D (0.75)D (0.9)
Influent2210.8 ± 3.378.1 ± 16.6152.1 ± 41.6317.3 ± 52.5
Treated waterEPP83.9 ± 0.518.9 ± 2.838.6 ± 8.070.9 ± 15.4
EPS74.4 ± 0.721.6 ± 3.648.1 ± 10.098.5 ± 24.3
Perlite44.3 ± 0.125.7 ± 4.653.5 ± 7.989.3 ± 8.6
Zeolite32.6 ± 0.314.4 ± 1.833.4 ± 4.668.6 ± 7.8
Table 10. SS average treatment efficiency by particle size distribution for each filter medium.
Particle Size Range (μm)SS Treatment Efficiency (%, Average ± Standard Deviation)
EPPEPSPerliteZeolite
<1000.1–1069.0 ± 13.046.0 ± 26.468.1 ± 9.739.8 ± 19.2
10–2073.1 ± 8.749.2 ± 24.370.8 ± 7.647.5 ± 20.9
20–3079.8 ± 6.459.6 ± 19.171.6 ± 8.656.7 ± 25.0
30–4085.6 ± 5.170.5 ± 13.974.9 ± 8.466.5 ± 24.4
40–6091.2 ± 3.581.4 ± 8.781.7 ± 6.386.3 ± 5.2
60–10095.8 ± 1.890.4 ± 4.389.5 ± 3.894.4 ± 3.3
100<100–20098.7 ± 0.895.6 ± 2.395.3 ± 2.097.1 ± 2.8
200–40099.7 ± 0.497.6 ± 1.499.9 ± 0.298.6 ± 1.6
400 or more99.1 ± 1.191.1 ± 5.7100.0 ± 0.091.8 ± 2.8

