Article

Development of a Novel Co-Creative Framework for Redesigning Product Service Systems

Department of Industrial and Systems Engineering, Dongguk University, Pil-dong, Jung-gu, Seoul 100715, Korea
*
Author to whom correspondence should be addressed.
Sustainability 2016, 8(5), 434; https://doi.org/10.3390/su8050434
Submission received: 2 February 2016 / Revised: 26 April 2016 / Accepted: 28 April 2016 / Published: 3 May 2016
(This article belongs to the Special Issue Sustainable Business Models)

Abstract

:
Product service systems (PSS) have been researched in academia and implemented in industry for more than a decade, and they bring plenty of benefits to various stakeholders, such as: customers, PSS providers, the environment, as well as society. However, the adoption of PSS in industry so far is limited compared to its potentials. One of the reasons leading to this limitation is that PSS design is tricky. So far, there are several methods to design PSS, but each of them has certain limitations. This paper proposes a co-creative framework, which is constructed using the concept of user co-creation. This novel framework allows designers to design PSS effectively in terms of users’ perception of PSS value, design quality and evaluation. The authors also introduce a case study to demonstrate and validate the proposed framework.

1. Introduction

1.1. Product Service System

Before the 2000s, consumers were familiar with the paradigm in which companies sell tangible products to the market. For instance: Nokia provided mobile phones; Electrolux provided washing machines; HP provided printers, etc. Nowadays, the demands of customers become more and more diversified, and the business environment becomes more and more competitive. This leads to the fact that companies are having a difficult time competing with the conventional business model of selling purely tangible products [1,2]. There is a need for finding new ways to enhance competitiveness, to attract new customers, as well as to keep existing ones. This need is fulfilled by incorporating the concept of product service systems (PSS) [3,4,5]. These PSS are a form of servitization in which a combination of a tangible product and an intangible service, called a “PSS offering” or simply “PSS”, is provided to the customers [6].
There are several examples of PSS in reality. According to Goedkoop et al. [7], PSS is “a marketable set of products and services capable of jointly fulfilling a user’s needs”. By this definition, the offering of an iPhone and the Appstore from Apple Inc. can be considered as a PSS. In the same manner, a car-sharing service, where the users check in and pick up a car at a station, use and return the car at another station, check out and pay per use, is also a PSS. In the car-sharing example, users do not buy the car; they buy the “mobility” or the use of the car. This new concept of buying is similar to a “functional economy” [8], where customers are interested in “hiring products to get jobs done” [3,9,10]. Baines et al. also introduced a well-known example of a PSS, which is the “document management solution” [11]. In this example, the customer does not buy a photocopier. Instead, the customer only buys its use. The company still owns the product and takes care of refilling, maintenance, replacing parts, etc.
Since the very first work by Goedkoop et al. nearly two decades ago, PSS has gone a long way with various research having been carried out by various researchers. The pioneering works also include the ones by Mont [8] and Morelli [12]. So far, PSS is classified into several types. According to Tukker [13], there are three types of PSS: product-oriented PSS, use-oriented PSS and result-oriented PSS.

1.2. Adoption of PSS in Industry

PSS brings benefits to various stakeholders, as studied in the literature [5,11]. For the customers, PSS provides flexible services with a higher level of personalization, better and continuously-improved quality and, finally, total satisfaction. For companies, thanks to the implementation of PSS, they gain the loyalty of customers, as well as better control of product quality, continuous improvement, chances for reducing costs, increasing knowledge and innovation. For society and the environment, PSS is also beneficial in terms of reducing materials’ consumption through sharing their use, increasing the responsibility of manufacturers, expanding the lifecycle of the products and creating more jobs in the service sector.
PSS is now adopted more and more in industry. In order to promote the adoption of PSS, several challenges need to be resolved. These challenges were mentioned in various works by Mont [8], Baines et al. [11] and Beuren et al. [5]. The first challenge is that “ownerless consumption” is not familiar to the vast majority of customers. They are familiar with the concept of paying and getting “physical” items. Another challenge is for the manufacturers. They might have difficulties when making decisions on pricing, managing risks and changing the organization due to a changing business model. The major challenge for expanding PSS adoption is “PSS design”. This is not an easy task, because PSS is a complicated system. In PSS, besides products and services, there are also other elements, such as the delivery network, stakeholders, value proposition, etc.
In order to design PSS, several methods have been introduced. Vasantha et al. reviewed eight well-known PSS design methods that have been implemented widely so far [6]. As will be analyzed in Section 2, there is still a lack of an effective method to design PSS collaboratively and practically. This lack somehow limits the expansion of PSS adoption in industry.

1.3. Motivation for This Work and Research Goal

This research is motivated by the following real-world scenario: Mulenserv is a company that provides various engineering services to customers in the industrial market. One of Mulenserv’s services is a PSS, which leases technical manuals and books together with supporting services (lectures, application workshops, technical contests, etc.). Their target customers are engineering individuals, as well as small technical companies. This is a niche market, and the PSS is highly customized due to the diversified demands of various customers. After six months of the initial release, the response of the market was limited: acceptance of potential customers, as well as satisfaction of customers who purchased the PSS were lower than expected. The company needs to redesign to improve the PSS, so that the acceptance rate and customer satisfaction can be improved and the sales can be increased sustainably. In order to achieve this goal, they need an effective customer-centric framework to improve the PSS design, i.e., redesign the new PSS starting from the existing one. According to Vezzoli et al. [14], most of the successful cases of PSS applications are from the B2B (business to business) sector, not B2C (business to consumer). Mulenserv is a typical B2C case, and a design solution is needed to help its PSS survive when being launched.
Since customer acceptance and satisfaction with the PSS is of critical importance to its success and this acceptance strongly depends on the perception of the users of the provided service [14], this paper aims to develop a co-creative framework that allows companies to redesign a PSS in order to improve the design of the PSS in terms of users’ perception of its value, design quality and evaluation and, thus, leading to increasing customer acceptance and, therefore, increasing its success. In this work, we set the scope of the framework in a B2C environment. We construct this framework by incorporating the concept of user co-creation.
The next parts of this paper are organized as follows: Section 2 reviews existing literature that is related to the research topic. Section 3 analyzes solutions and proposes the framework. Section 4 introduces the case study, the experimental implementation, results and discussions. Section 5 draws concluding remarks and suggests future work.

2. Literature Review

2.1. Existing Methods to Design and Redesign PSS

PSS providers need tools, techniques and methods to design and enhance their PSS to satisfy their customers. There has been much research conducted to propose PSS design methodologies with similar intentions and different ideas [15].
Several methods for designing PSS have been introduced so far [1,2,11]. Beside case-specific methods, which were developed to design very specific PSSs [16,17], there are several generic methods that can be used to design various cases of PSS. These methods were summarized by Vasantha et al. [6]. Although being well known and widely implemented, these methods have limitations. One of them is the lack of user co-creation in the design processes [6]. These methods do not mention in detail the importance of co-creation, and there are no clear definitions of the roles of customers in the PSS design process.
More recently, Pezzotta et al. [18] proposed a framework to design and assess PSS from a service engineering approach. This framework utilizes computer-aided modeling tool for service design. It starts with functional analysis and the identification of customer needs, simulating and testing various scenarios to find out the best solution. Although being well structured, this method has little involvement in co-creation, and the case study provided in the work [18] is more like a B2B case.
Morelli [19] commented that design methods should identify who is involved in the design process and their roles, as well as possible scenarios that could occur. The need for implementing customer co-creation is also raised in the work of Beuren et al. [5]. Vezzoli et al. [14] implied that a design method should include details of where and when to involve stakeholders (producer/provider, customer, etc.) and to allow customers to customize a PSS according to their preferences.
Beside the lack of co-creation, existing PSS design methods provide little practical guidelines for practitioners (i.e., companies) [2]. Incorporating incremental steps in a path or practice is necessary for a design method [14]. There is a lack of illustrating cases that can demonstrate and give insights into how PSS design methods work in various situations. This explains why existing methods are not effective in terms of practical implementation. Furthermore, Qu et al. [15] suggested that more quantitative works need to be conducted in the literature because these works are more objective and persuasive.
In summary, existing design methodologies have not considerably included co-creation in the design processes and are not effective enough to act as practical guidelines for practitioners. In this sense, the involvement of each stakeholder in the design phases is not clarified in detail, and the representation of PSS itself is complicated. There is a need for a new method that is co-creative with user involvement in the design process, better defined roles and responsibilities of stakeholders and a simpler PSS representation and that can provide practical guidelines. This method also need to be evaluable.

2.2. Value Perception

In a service-oriented system, like a PSS, value perception is a critical issue to decide the buying potential of customers, because the service part in PSS is intangible and its value is difficult to measure and estimate [9,11,12]. In order to increase the value perception of PSS, the value of the PSS needs to be visualized. One of the methods to visualize PSS value is communicating and demonstrating PSS to the customers [20]. The importance of PSS value and value proposition has been mentioned in several works [21,22,23]. In one of the PSS design methods reviewed by Vasantha et al. [6], the value proposition is considered as an important dimension that forms the PSS [24]. Value is claimed to be the differentiating factor that enables the success of a PSS, and new methods are needed to understand value perception in order to evaluate PSS performance [11].
There are also several notable works on PSS value visualization. The value proposition was emphasized in the PSS design method proposed by Morelli [12]. Several tools that support value visualization have been introduced, including the “PSS board” [9] and color-coded CAD models [25]. A framework to enhance value visualization and perception has also been proposed by Kowalkowski and Kindstrom [20]. The above works focus on either value perception of the company (instead of the customers) [9,12,25] or value perception particularly in industrial markets [20].
Vezzoli et al. [14] commented that because of the lack of understanding about PSS and the deep perception of its value, customers are not eager to adopt PSS solutions. This is a barrier for PSS application at the industrial scale. There is a need for new strategies and approaches to make consumers accept this new model of consumption.
In order to increase users’ acceptance of PSS offerings, designers must find ways to increase users’ perception of PSS value, and thus, the visualization of PSS becomes critical. In Section 3, the authors of this work propose a method to represent and present PSS to enhance the communication of PSS value to the users and enable user participation in co-creation.

2.3. Co-Creation in the Design Improvement and Evaluation of PSS

Steen et al. [26] identified three types of benefits of co-creation for the design project, the customers and the PSS provider. They did this by reviewing the literature and observing three service design projects. In that work, experimental results were not reported in terms of numerical data, and they also implied that there was a need for conducting another experiment and performing a numerical analysis to validate the effectiveness of user involvement in a service-oriented design project.
The design and development of PSS is a participatory process, and thus, co-creation has been mentioned in the literature as one of the success enabling factors for PSS [6,11]. Co-creation refers to the participation of customers or users in various phases of its lifecycle, such as ideation, design, development and implementation (i.e., use), etc. The role of user participation is critical to the success because of the importance of users in a PSS model. Users are among the most important stakeholders, and because of the presence of the “service” part in which users only buy or hire things that help them to get jobs done [3,9], users’ voices deserve a deep consideration. As pointed out by Vansantha et al., to improve PSS design, co-creation is employed limitedly in existing PSS design methods [6].
PSS evaluation is an essential issue that has been mentioned by various researchers [9,27,28,29,30]. Especially, evaluation at the development stage can help companies to reduce the risks of PSS launching. Existing PSS design methods do not consider co-creation deep enough [6,11].
There are several works that dealt briefly with the evaluation issue in PSS design. A “lifecycle simulation” model was proposed by Komoto and Tomiyama [30] and was demonstrated with a maintenance service. The evaluation of PSS was also considered in the tool developed by Lim et al. [9]. Another approach to PSS evaluation through prototyping was proposed [28]. These works [9,28,30] focused on the evaluation of PSS mostly for companies, not for customers.
Customers can be used as a source of innovation by involving them in the PSS design process [1,11,31]. A PSS design process in which the participation of customers is used for evaluation was proposed by Shih et al. [27]. In other work, an algorithm for PSS evaluation was proposed by Yoon et al. [28]. However, still, in these works [27,28], customers are not the main drive for making a difference in the effectiveness of the evaluation result.
We aim to develop a novel co-creative framework that uses the co-creation of customers (i.e., users), has detailed defined roles, responsibilities and activities of stakeholders throughout the design process and includes a simple and clear PSS representation. This proposed framework is used to enhance the value perception, evaluation and design quality of PSS. It starts with the existing PSS or initial PSS conceptual idea and produces an improved PSS design as the outcome. The PSS that is developed using the proposed framework can be better accepted by customers. This leads to the success of PSS and encourage the application of PSS in industry.

3. Methodology

Figure 1 shows the research procedure of this paper. This explains how we construct this research. The authors analyze solutions to implement user co-creation and PSS representation. Based on those analyses and the sequence of co-creative design activities, the authors propose the framework. This framework is explained in detail and implemented in a case study as an experiment. The results were collected, analyzed and validated to evaluate the framework.

3.1. Implementation of the Co-Creation Concept

The co-creation of customers/users in the PSS design process can be enabled by the participation of users in various design activities. Previous research pointed out that allowing users to participate in the design process might make significant changes [32]. Users can participate in proposing ideas, suggesting design corrections or even generating new concepts.
As pointed out in a previous work [33], to make user participation become easy and effective, the co-creation tasks need to be clarified and simplified. In order to achieve this, we carefully train the participants about each task in which they are involved. We also use simplified PSS representation so that the users can contribute their innovation properly and systematically.

3.2. Simplified PSS Representation

In order to simplify co-creation activity and maximize effective participation, we break down PSS into basic elements so that the representation of PSS can be in the simplest form. When being shown to the participants, the PSS will be represented as a combination of the following elements:
  • Product: The tangible part of a PSS, for instance an iPhone.
  • Service: The intangible part of PSS, for instance the Appstore
  • Process: Serial and parallel activities happen inside a PSS. This describes the process of how a PSS is served to the customer.
  • Parameters: The metrics of product and service features. For example: how long is the service time; how much is the charge per mile for a car sharing service, etc.
  • Network: The infrastructure of PSS showing the interactions of products, services, users, etc. For example, to deliver technical support services to PC (personal computer) buyers, the company may use email, telephone, on-site, etc.
  • Stakeholders: Companies, customers, suppliers, etc.
  • Value proposition: Model that explains how PSS provides value to a customer, a company and other stakeholders.
A PSS can be represented in a simple form using a set of the above elements. Each representation is called a “PSS configuration” or “PSS design” in this work. The purpose of this simplification is to briefly represent a PSS as a combination of various “specifications”, and thus, it allows users to suggest PSS designs easily by filling in the form with their favorite inputs for those specifications. We would like to note that this is for the convenience of user participation, and this simplification is used only within this work.

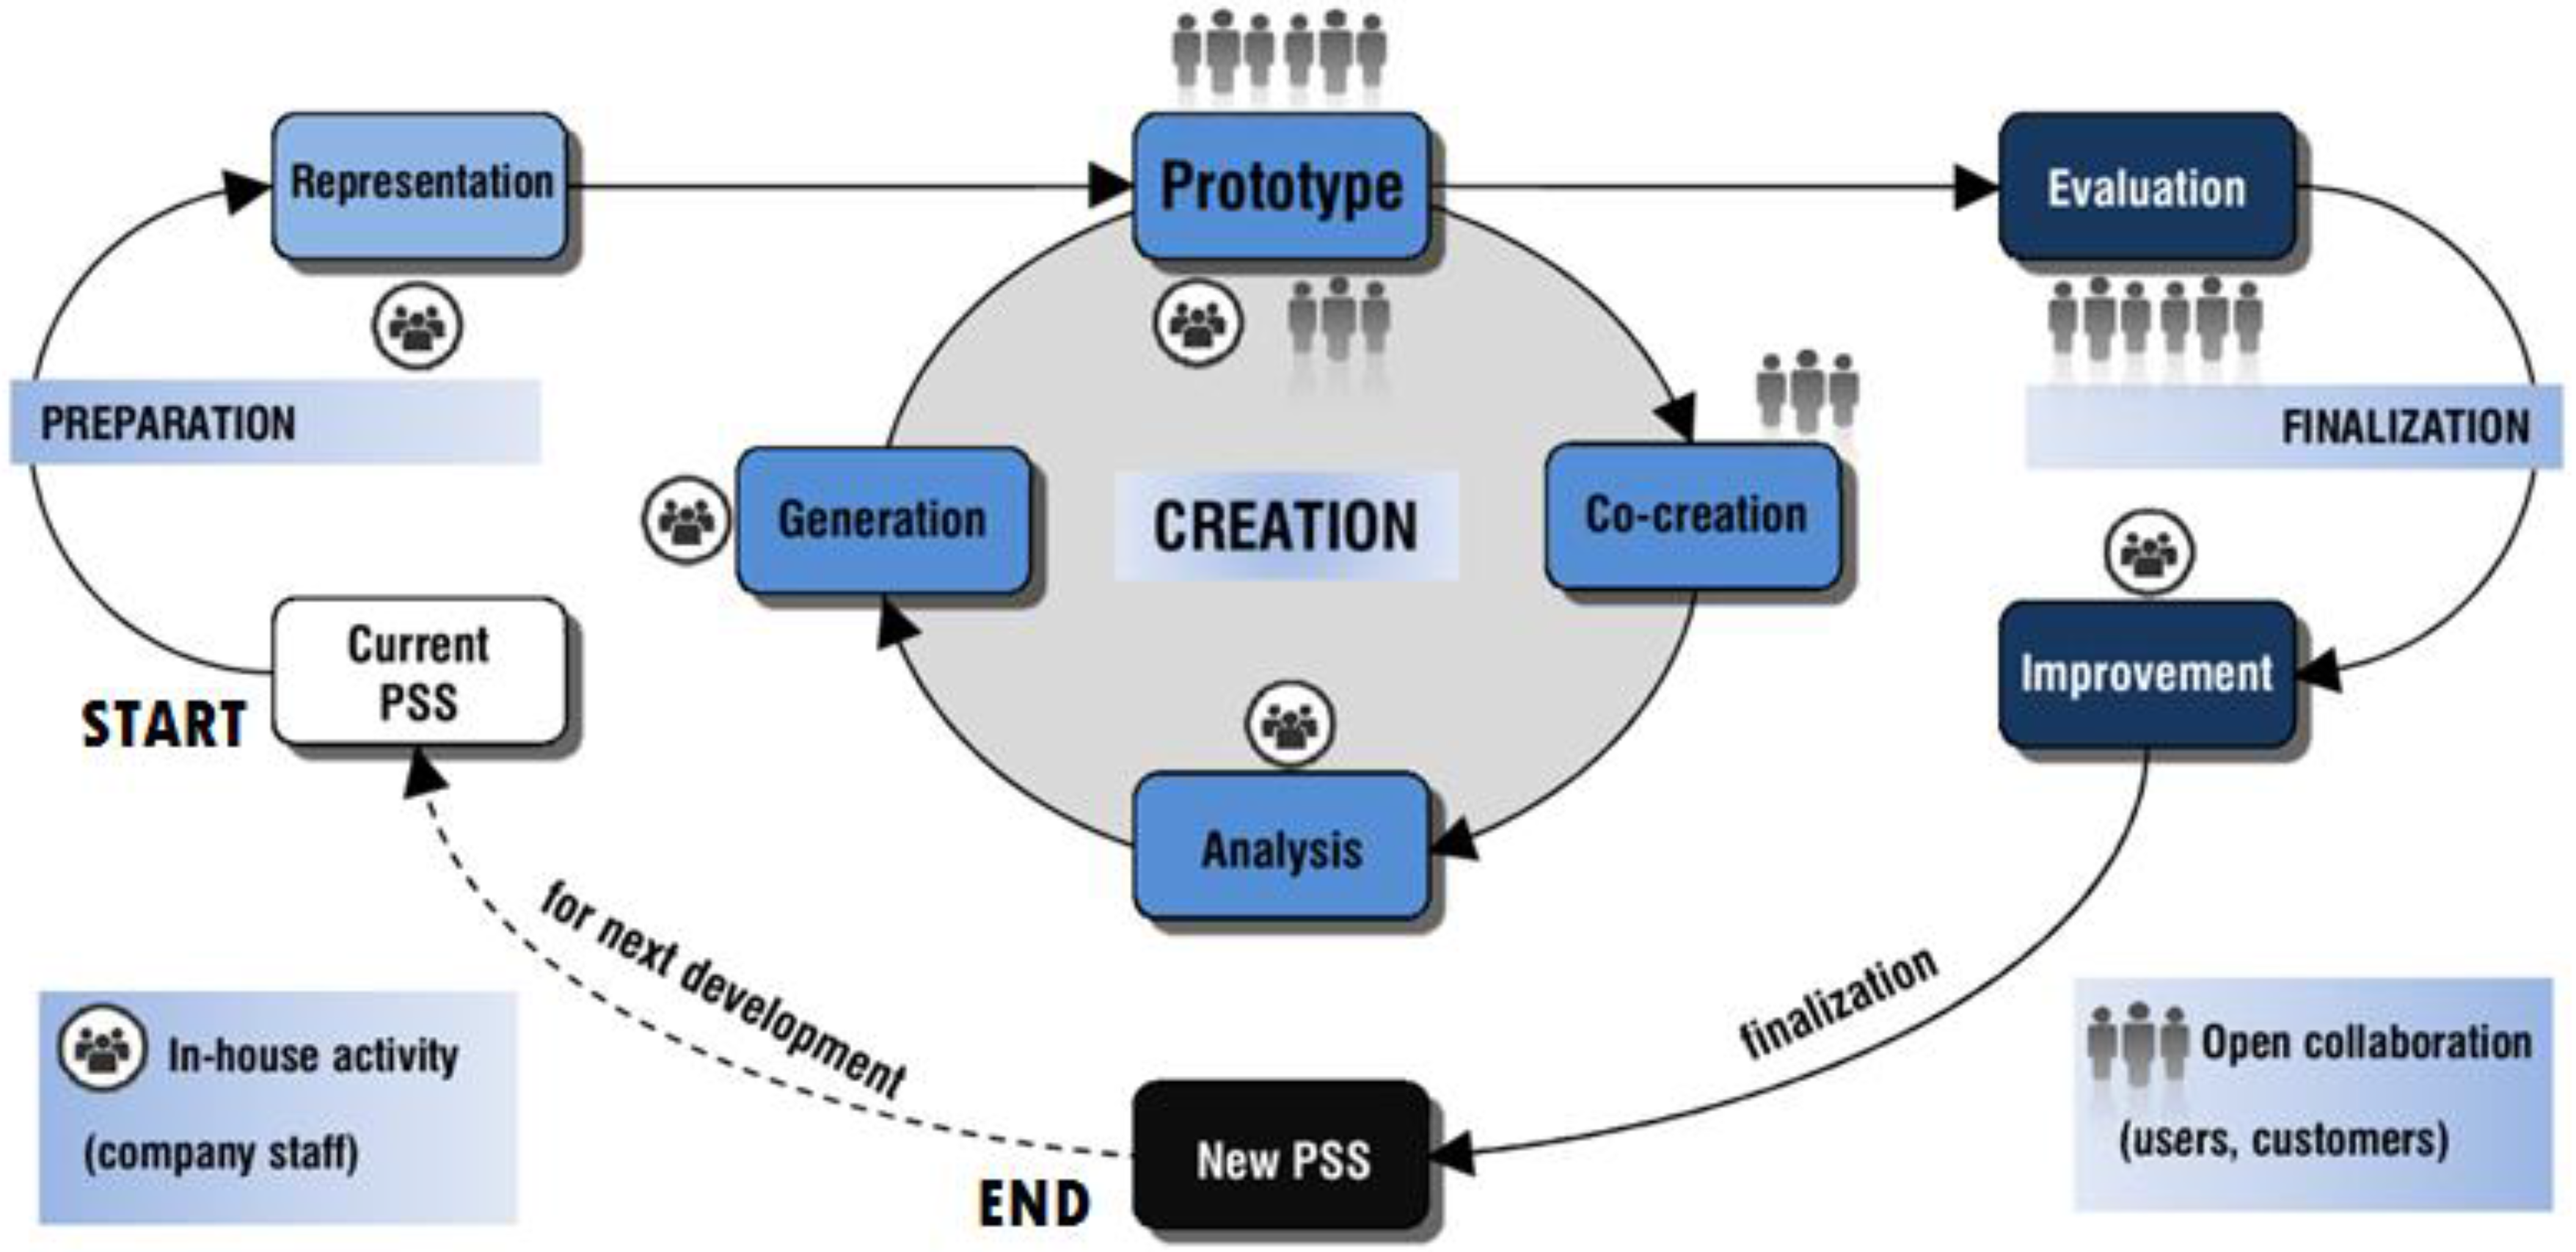
3.3. The Proposed Framework

Based on the analysis of solutions and the PSS design process, we propose a framework to enhance the value perception, evaluation and design quality of PSS. The proposed framework is shown in Figure 2.
The proposed framework can be generally described as follows: The company wants to improve their current PSS by redesigning it with user co-creation. To do that, they first invite a group of users (Group 1) to participate. In order to make these users understand the PSS, the company represents the PSS in a simple form, and then, they prototype the PSS so that the users can actually see and experience the PSS. After that, these users co-create by suggesting various PSS options that they think might meet their needs. The company collects inputs from users, analyzes those inputs and produces new possible PSS designs. After new PSS designs are produced, the company invites another group of users (Group 2) to participate in prototyping and evaluating the newly-created designs. The designs will be evaluated by scoring along various criteria, and the one that gains the highest score will be selected as the winning design. The company will try to improve this design, if possible, and finally, they have a new PSS that is improved compare to the previous version. The detailed explanation of the proposed framework, its phases and corresponding methods can be found in Table 1.
Section 4 introduces a case study that is used to explain how the proposed framework can be used and validated.

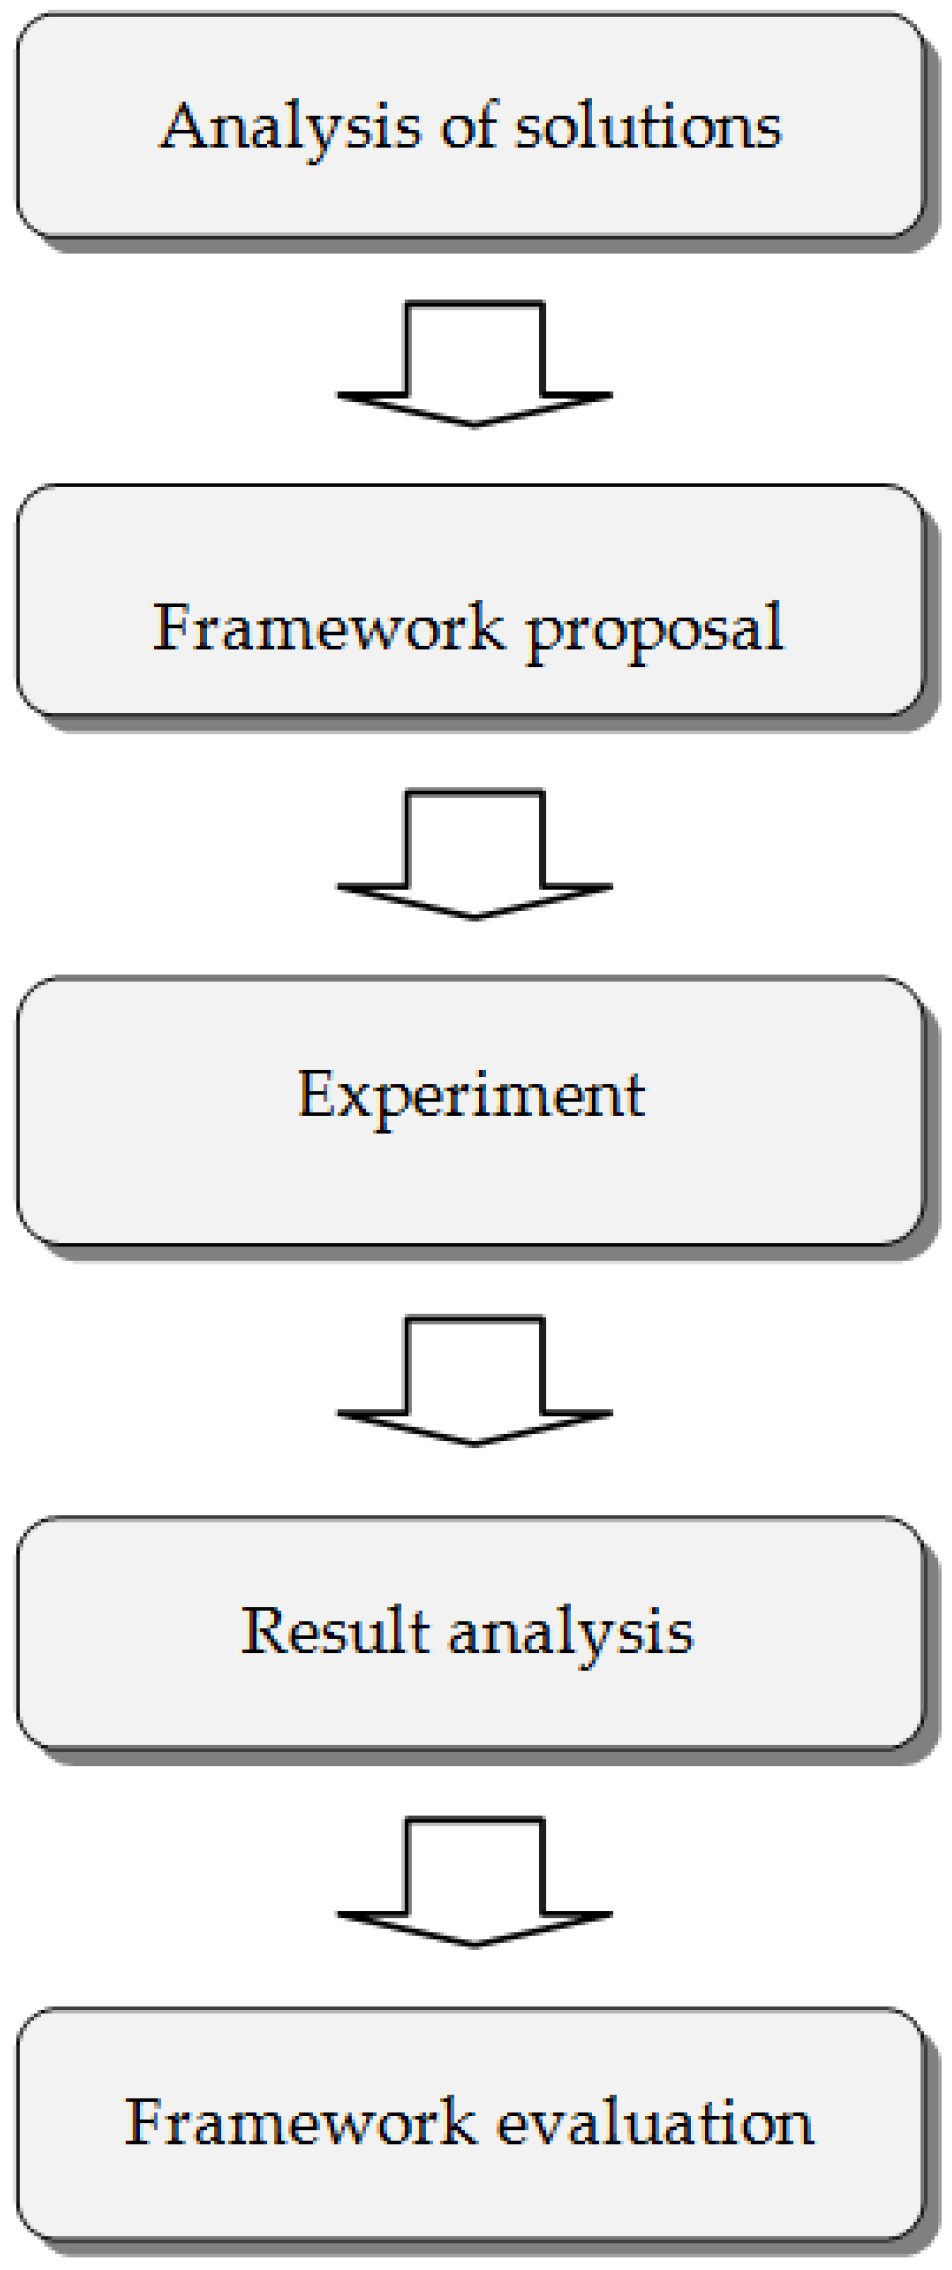
4. Case Study and Validation of the Framework

4.1. Introduction to the Case

In Section 1, we mentioned Mulenserv and its PSS briefly. Mulenserv has a PSS called “N-Handbook”, which is a book plus additional services for individuals and enterprises to learn new product development (NPD) at a professional level. The N-Handbook is a complex PSS offering, as shown in Table 2.

4.2. Experimental Implementation of the Proposed Framework

In order to demonstrate, as well as to validate the proposed framework, we conduct an experiment with user participation. In this experiment, a group of users is asked to comment, suggest, give feedback to the existing design of the N-Handbook and to further ideate their own configuration of the N-Handbook. Details are as follows:
Step 0: Start
The company starts with the existing design of the N-Handbook, which is currently offered to customers. This design is denoted as D0.
Step 1: Representation
The PSS is represented using a simplified representation.
In this experiment, assuming that the process, network, stakeholders and value proposition elements are fixed, the existing N-Handbook can be described as in Table 3.
Step 2: Prototype
The company communicates about the printed books and shows media about the additional services and explains the process, network, value proposition, parameters, etc., of the N-Handbook in detail to a group of 21 participants (Group 1). These participants are selected from the database of individuals who showed interest in the N-Handbook, including the persons who asked for information and the persons who actually purchased. This is to ensure that the selected participants are enthusiastic enough about the future PSS and that we can keep them in the loop of participation.
Step 3: Co-creation
The participants are asked to give comments and suggestions for improving the existing design. The participants are also asked to propose their own preferences for the N-Handbook offering, including product, service and parameters. This is done by direct input to a pre-defined form.
Step 4: Analysis
The feedback (comments, suggestions) from the participants are collected and applied to improve the design of the existing N-Handbook.
The proposed preferences of the participants are collected and analyzed to find “favorite patterns” or the favorite PSS configurations. This is done manually by the designers by counting each and every proposed preference and making detailed statistics.
Step 5: Generation
The designers generate “new PSS designs” in this step. The design that is the result of implementing participants’ comments and suggestions is called D0X. There are three “favorite patterns” from participants’ proposed preferences, and thus, the designers produce three more “new PSS designs”, which are called D1, D2 and D3. The details of D0X, D1, D2 and D3 can be found in Table 4 below.
Step 6: Prototype
The company demonstrates the prototypes of the PSS concepts to a new group of 65 participants (Group 2) who are selected from the database of individuals who showed interest in the N-Handbook, including the persons who asked for information and the persons who actually purchased.
Step 7: Evaluation
After explaining the four designs (i.e., D0X, D1, D2 and D3) thoroughly, the participants are asked to score each design along various criteria on a one to five scale. The scoring criteria are retrieved from the survey result from both groups of users before their participation. These are the most agreeable criteria to be used to evaluate the designed PSS among the participants. Details of the scoring criteria are provided below (Table 5).
Various designs are scored along the above criteria, and the results are recorded for further analysis. The analyzed results are shown in Section 4.3.
Step 8: Improvement
After scoring, the best design is identified, and the designers would try to improve it by trying to implement the strong aspects of other designs into it.
Step 9: End
The company achieves an improved PSS design with higher quality, user acceptance and satisfaction.

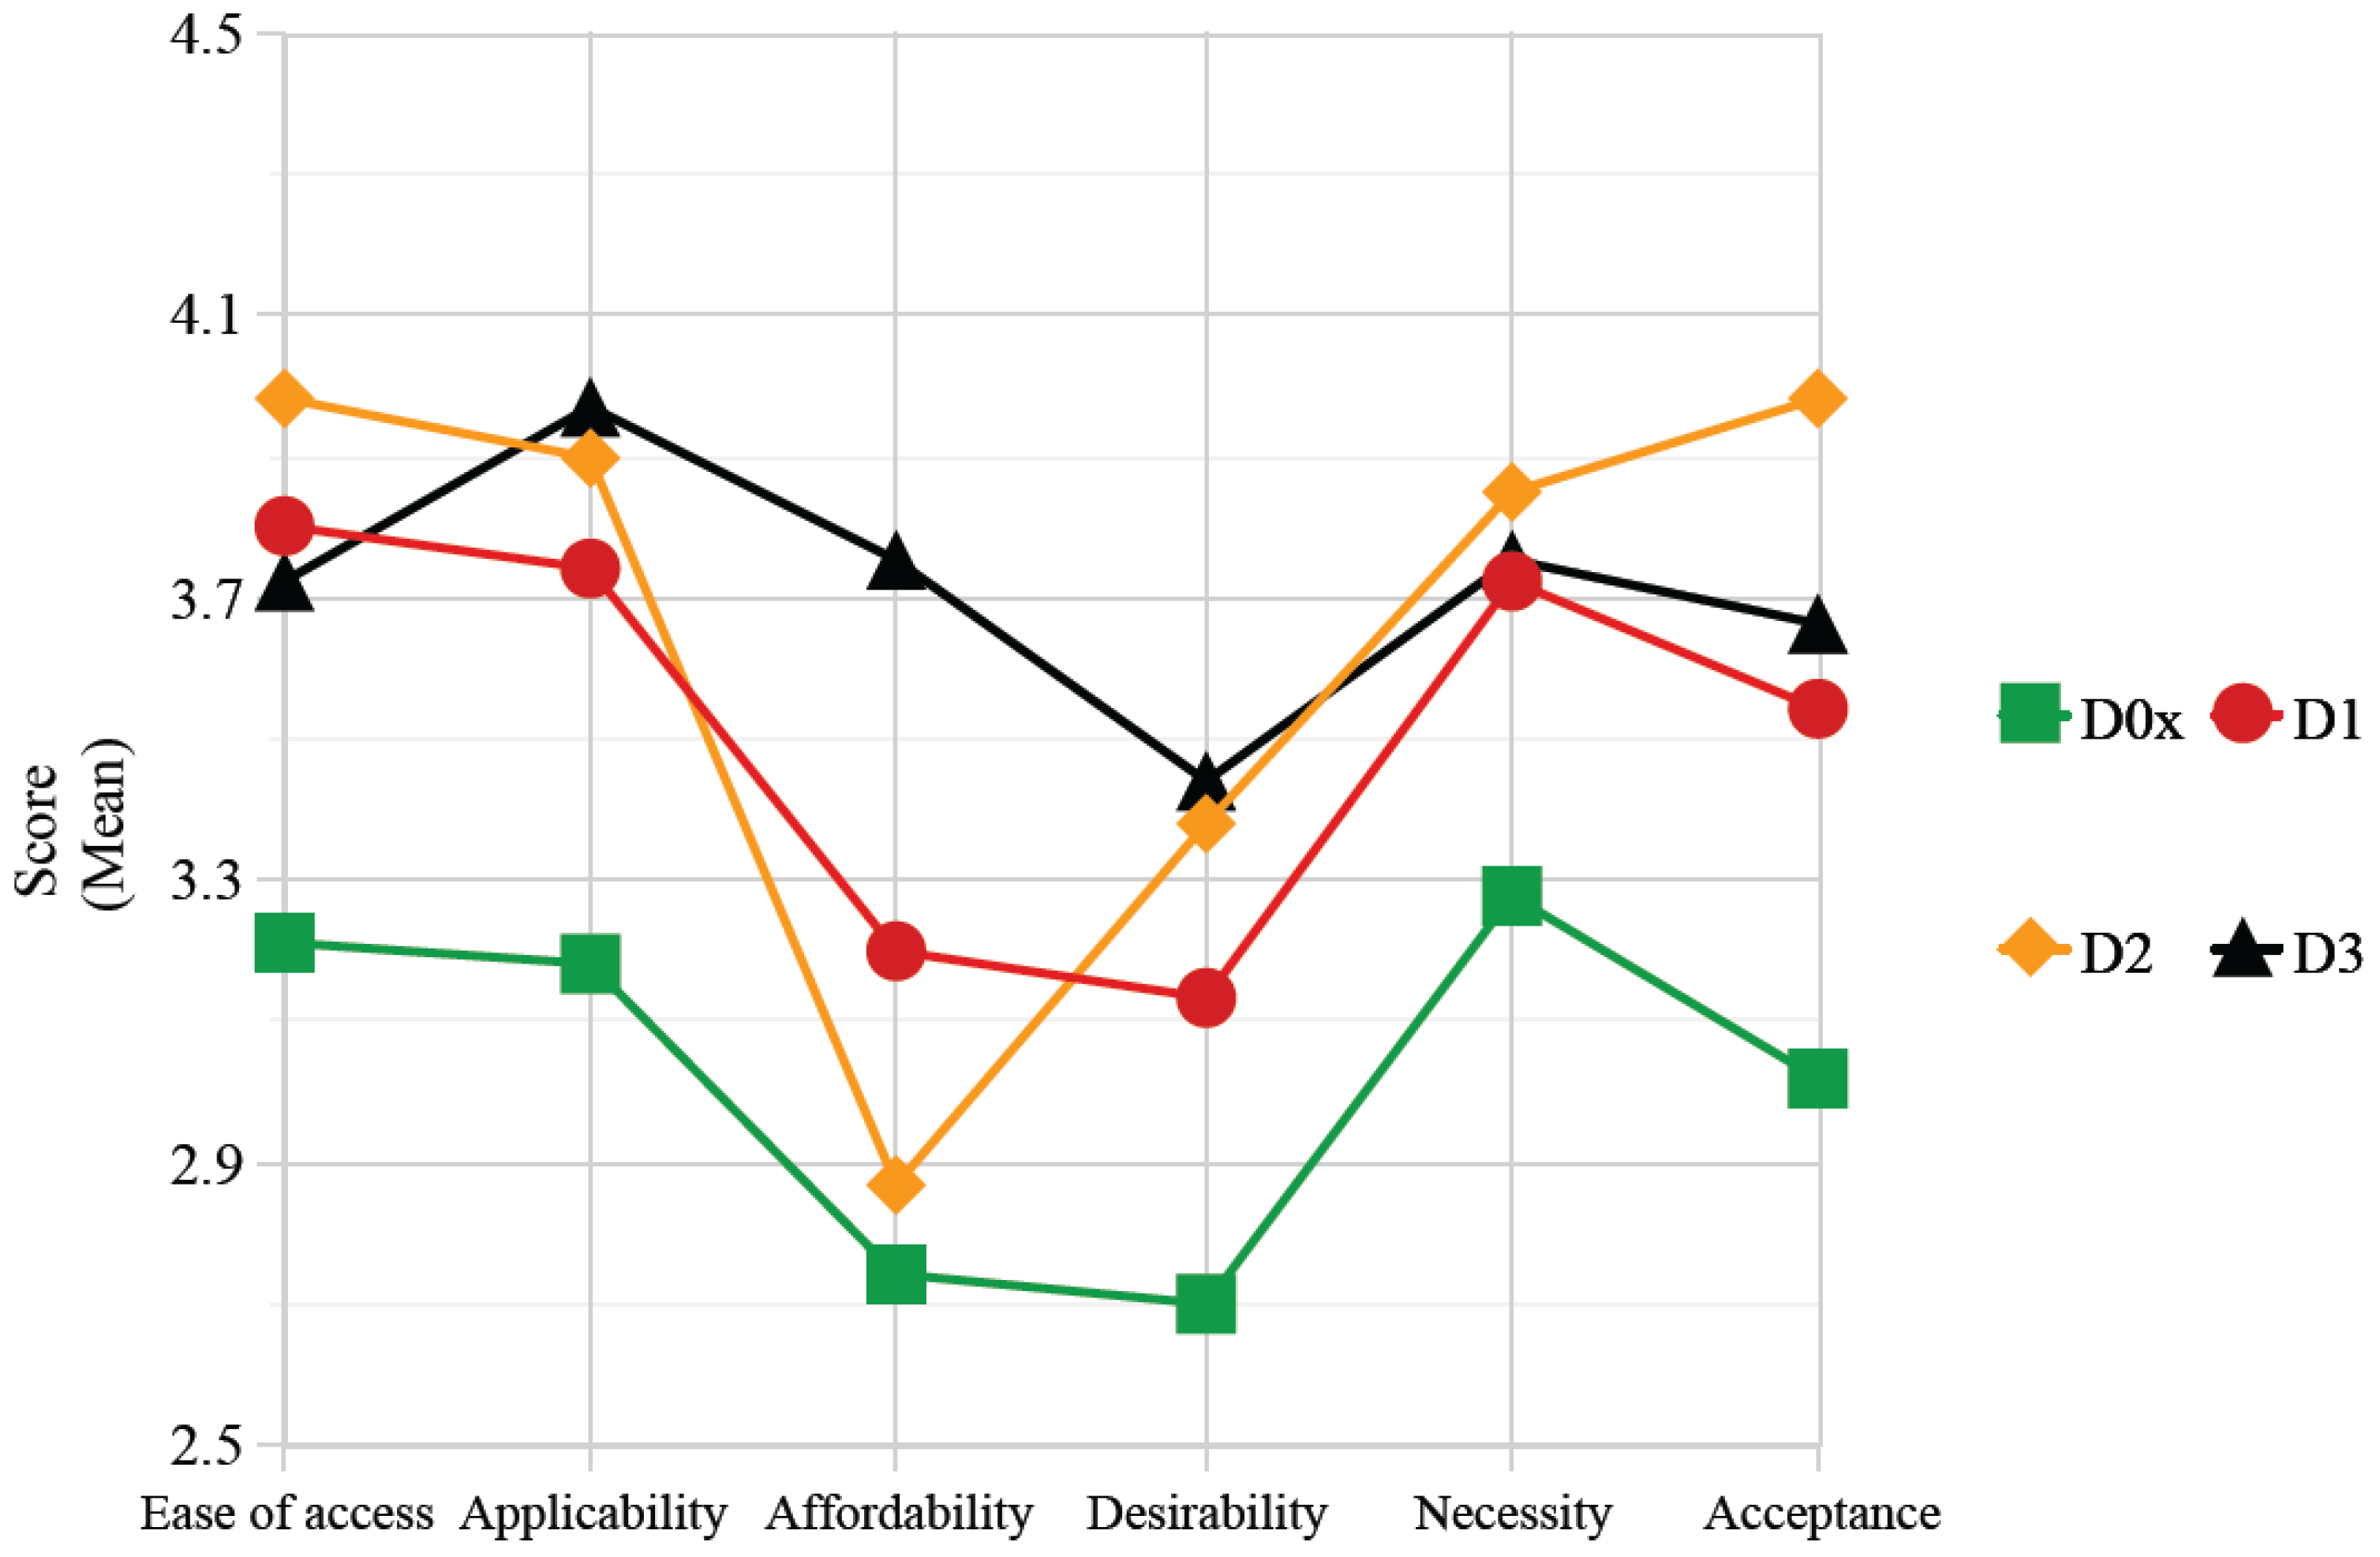
4.3. Experimental Results

After collecting the scores from participants, we calculate the mean values of scores for all 65 participants, as shown in Table 6.
Figure 3 shows the data in Table 6 graphically.
Figure 3 shows that, for all criteria, designs that were suggested by users (i.e., D1, D2 and D3) perform better than the design that was developed solely by Mulenserv’s designers (i.e., D0X, represented by the line with square points), especially in terms of “ease of access”, “applicability” and “acceptance”. This shows the outperformance of user-suggested designs, and thus, it shows the benefits of user co-creation and the use of the proposed framework.

4.4. Result Analysis and Validation

In order to validate the significance of experimental results to draw conclusions on the advantage of the proposed framework, the authors perform a t-test on the collected data of D0X and D2. The dataset for this t-test is collected from scoring results by all participants. This means that we use the result of the experiment performed at Mulenserv in the case study for this validation. The analysis results, which are rounded, are shown in Table 7.
The reason why we choose D2 to compare to D0X is that D2 performs the highest among the three user-suggested designs in terms of “acceptance”, which is the most important criteria for a PSS.
Table 7 shows that, for almost all criteria, the differences between D2 and D0X are large enough to confirm the significance of the collected data because of the t-test result, P (Tt) < 0.05 for both one-tailed and two-tailed tests. There is only one exception for “affordability”. For this criterion, the t-test result cannot ensure the real difference between D2 and D0X. Another t-test result shows that, in terms of “affordability”, D3, which was also suggested by the users, significantly outperforms D0X. In order to improve D2 to become even better, Mulenserv can consider applying D3’s pricing strategy to enhance D2’s “affordability”.
Eventually, we can say that the experimental data are significant, the results are validated and the user-suggested designs perform better than the design that was solely developed by Mulenserv’s team. This confirms the advantage of the proposed framework.
The key to successful implementation of this framework is user co-creation throughout the process. Users understand what they need the most and would be ready to accept offerings that are tailored to their needs. Two other important factors are the simplification of PSS configurations using elements and the demonstration of PSS prototypes so that the users can experience and understand the PSS before co-creation. The proposed framework is structured regarding all of those factors.
There are several issues when adopting the design process of conventional NPD (new product development) to the PSS context. In NPD, the company designs and develops products according to the requirements that were retrieved from customer needs and the results of competitive benchmarking. In some cases, the communication of customer needs to the design team is not done properly, and that leads to ineffective products. When being applied to PSS design, where user emotion, behavior and preferences are highly significant, conventional NPD processes may not work properly. These cases of designing PSS need a new approach, such as our proposed framework. On the other hand, if the design requires technical skills, such as engineering, drafting, manufacturing, etc., the co-creation task may become difficult for users to participate in, and the model may not be applied effectively. In summary, the proposed framework can effectively deal with the designing of user-sensitive components, such as consumer PSS in a B2C environment (not industrial PSS in a B2B environment).
After proposing the framework and conducting the experiment, we gained more insights and experience of how users are actually involved in a co-creative design process. To gain the expected result for implementation, several guidelines can be found below:
  • Prepare the scenario of implementing the framework in the case, and communicate necessary activities during the process to all design team members.
  • Prototypes of PSS are very important. The prototypes help users to fully understand how the PSS works, allowing them to experience it so that they can generate and evaluate the PSS in a correct way.
  • Representing of the PSS is also important. PSS representation needs to be simple, but thorough enough to cover all possible PSS elements and parameters. This allows users to co-create effectively in terms of quantity and quality.
  • Selection of the right participants is essential. Since the participation to co-create in this process is time consuming and requires plenty of effort, only users who are enthusiastic enough can ensure effective participation.

4.5. Managerial Implications

As shown by the validation of the experimental data, proper implementation of the proposed framework can lead to better performance of the PSS. This suggests that the concept of co-creation and user involvement can be implemented to bring innovation and breakthroughs to PSS development. The proposed framework can also be used to estimate the response of potential users (buyers) to the “to be launched” PSS. Companies can customize the proposed framework for their specific PSS design projects while keeping the basic principles: the right users; simple representation; thorough prototypes; easy input forms; and comprehensive evaluation.
In the case study of this paper, we use an on-site participatory design for invited users. Other methods of involving users can also be used, such as crowdsourcing. In this case, we can use a website where we upload a call for participation, demonstrations of the PSS, guidelines for each and every step, etc. This is another option for PSS projects. As suggested in the “Tasks” column of each step (Table 1), companies can choose various tools to perform tasks in the process of the proposed framework.

5. Conclusions

In this work, the authors propose a co-creative framework for redesigning a PSS. For the first time, a framework for user co-creation in PSS design has been proposed, detailed and evaluated with experimental implementation.
Our work provides a practical guideline for developers in designing and redesigning PSS. It enhances the value perception, evaluation and design quality of PSS. The experimental implementation with the case study and the analysis of the experimental results shows that the proposed framework is valid.
The proposed framework can effectively deal with the designing of user-sensitive components, such as consumer PSS in a B2C environment. In cases that requires a high level of technical skills and knowledge or cases with complicated service processes, such as industrial PSS (in a B2B environment), this framework might not work effectively.
Whether PSS can lead to achieving sustainability depends on how the technical design and the business model are developed to address sustainable development criteria. One limitation of this work is that, due to its focus, there is a lack of such consideration. Therefore, this work cannot claim the possibility of achieving sustainability through PSS. In our following work, where the focus is more appropriate, we would consider this issue as a separate research topic.
Furthermore, for future work, in order to prove the advantages of the proposed framework, a comparison between its implementation results and those of other existing methods will be carried out. Furthermore, an architecture of a computer program (or a mobile application) that employs this framework as the backbone can be developed. This program can assist design teams to design PSS collaboratively within their own team and with innovative customers.

Acknowledgments

This research was supported by the Basic Research Program through the National Research Foundation of Korea (NRF) funded by the Ministry of Education (No. 2013R1A1A2013649).

Author Contributions

Tuananh Tran conceived of, designed and performed the experiments; Joon Young Park proposed and Tuananh Tran performed the analysis of the experimental data. Tuananh Tran wrote the initial manuscript. Joon Young Park corrected and revised the final writing.

Conflicts of Interest

There is no conflict of interest for this work.

References

  1. Weber, C.; Steinbach, M.; Botta, C.; Deubel, T. Modeling of product–Service systems (PSS) based on the PDD approach. In Proceedings of the International Design Conference, Dubrovnik, Croatia, 18–21 May 2004; pp. 547–554.
  2. Aurich, J.C.; Mannweiler, C.; Schweitzer, E. How to design and offer service successfully. CIRP J. Manuf. Sci. Technol. 2010, 2, 136–143. [Google Scholar] [CrossRef]
  3. Bettencourt, L.A.; Ulwick, A.W. The customer—Centered innovation map. Harv. Bus. Rev. 2008, 5, 109–114. [Google Scholar]
  4. Sakao, T.; Birkhofer, H.; Panshef, V.; Dorsam, E. An effective and efficient method to design services: Empirical study for services by an investment machine manufacturer. Int. J. Internet Manuf. Serv. 2009, 2, 95–110. [Google Scholar] [CrossRef]
  5. Beuren, F.H.; Ferreira, M.G.G.; Miguel, P.A.C. Product-service systems: A literature review on integrated products and services. J. Clean. Prod. 2013, 47, 222–231. [Google Scholar] [CrossRef]
  6. Vasantha, G.V.A.; Roy, R.; Lelah, A.; Brissaud, D. A review of product-service systems design methodologies. J. Eng. Des. 2012, 23, 635–659. [Google Scholar] [CrossRef] [Green Version]
  7. Goedkoop, M.J.; van Halen, C.J.G.; te Riele, H.R.M.; Rommens, P.J.M. Product Service Systems, Ecological and Economic Basis. Report to Ministry of Housing, Spatial Planning and the Environment Communications Directorate, The Hague, The Netherlands. 1999. Available online: http://docplayer.net/334668-Product-service-systems-ecological-and-economic-basics.html (accessed on 29 April 2016).
  8. Mont, O.K. Clarifying the concept of product-service system. J. Clean. Prod. 2002, 10, 237–245. [Google Scholar] [CrossRef]
  9. Lim, C.H.; Kim, K.J.; Hong, Y.S.; Park, K.T. PSS Board: A structured tool for product-service system process visualization. J. Clean. Prod. 2012, 37, 42–55. [Google Scholar] [CrossRef]
  10. Hussain, R.; Lockett, H.; Vasantha, G.V.A. A framework to inform PSS conceptual design by using system–in–use data. Comput. Ind. 2012, 63, 319–327. [Google Scholar] [CrossRef] [Green Version]
  11. Baines, T.S.; Lightfoot, H.; Steve, E.; Neely, A.; Greenough, R.; Peppard, J.; Roy, R.; Shehab, E.; Braganza, A.; Tiwari, A.; et al. State-of-the-art in product service systems. Proc. Inst. Mech. Eng. Part B 2007, 221, 1543–1552. [Google Scholar] [CrossRef]
  12. Morelli, N. The design of product/service systems from a designer’s perspective. Common Ground (Lond.) 2002, 18, 3–17. [Google Scholar]
  13. Tukker, A. Eight types of product-service system: Eight ways to sustainability? Experiences from SusProNet. Bus. Strategy Environ 2004, 13, 246–260. [Google Scholar] [CrossRef]
  14. Vezzoli, C.; Ceschin, F.; Diehl, J.C.; Kohtala, C. New design challenges to widely implement ‘Sustainable Product–Service Systems’. J. Clean. Prod. 2015, 97, 1–12. [Google Scholar] [CrossRef] [Green Version]
  15. Qu, M.; Yu, S.; Chen, D.; Chu, J.; Tian, B. State-of-the-art of design, evaluation, and operation methodologies in product service systems. Comput. Ind. 2016, 77, 1–14. [Google Scholar] [CrossRef]
  16. Luiten, H.; Knot, M.; van der Host, T. Sustainable product service systems: The kathalys method. In Proceedings of the 2nd International Symposium on Environmentally Conscious Design and Inverse Manufacturing, Tokyo, Japan, 11–15 December 2001; pp. 190–197.
  17. Manzini, E.; Vezolli, C. A strategic design approach to develop sustainable product service systems: Examples taken from the “environmental friendly innovation” Italian prize. J. Clean. Prod. 2003, 11, 851–857. [Google Scholar] [CrossRef]
  18. Pezzotta, G.; Pirola, F.; Pinto, R.; Akasaka, F.; Shimomura, Y. A Service Engineering framework to design and assess an integrated product-service. Mechatronics 2015, 31, 169–179. [Google Scholar] [CrossRef]
  19. Morelli, N. Developing new product service systems (PSS): Methodologies and operational tools. J. Clean. Prod. 2006, 14, 1495–1501. [Google Scholar] [CrossRef]
  20. Kowalkowski, C.; Kindström, D. Value visualization strategies for PSS Development. In Introduction to Product/Service-System Design; Sakao, T., Lindahl, M., Eds.; Springer: London, UK, 2009; pp. 159–182. [Google Scholar]
  21. Sakao, T.; Shimomura, Y. Service Engineering: A Novel Engineering Discipline for Producers to Increase Value Combining Service and Product. J. Clean. Prod. 2007, 15, 590–604. [Google Scholar] [CrossRef]
  22. Kim, Y.S.; Wang, E.; Lee, S.W.; Choi, Y.C. A Product-Service System Representation and Its Application in a Concept Design Scenario. In Proceedings of the 1st CIRP Industrial Product Service Systems (IPS2) Conference, Cranfield University, England, UK, 1–2 April 2009; pp. 32–39.
  23. Maussang, N.; Zwolinski, P.; Brissaud, D. Product-service system design methodology: From the PSS architecture design to the products specifications. J. Eng. Des. 2009, 20, 349–366. [Google Scholar] [CrossRef]
  24. Tan, A.R.; Matzen, D.; McAloone, T.; Evans, S. Strategies for Designing and Developing Services for Manufacturing Firms. CIRP J. Manuf. Sci. Technol. 2010, 3, 90–97. [Google Scholar] [CrossRef]
  25. Bertoni, A.; Bertoni, M.; Isaksson, O. Communicating the Value of PSS Design Alternatives using Color-Coded CAD Models. In Proceedings of the 3rd CIRP International Conference on Industrial Product Service Systems, Braunschweig, Germany, 5–6 May 2011.
  26. Steen, M.; Manschot, M.; De Koning, N. Benefits of co-design in service design projects. Int. J. Des. 2011, 5, 53–60. [Google Scholar]
  27. Shih, L.H.; Hu, A.H.; Lin, S.L.; Chen, J.L.; Tu, J.C. ; Kuo T.C. An Integrated Approach for Product Service System Development: II. Evaluation Phase. J. Environ. Eng. Manag. 2009, 19, 343–356. [Google Scholar]
  28. Yoon, B.; Kim, S.; Rhee, J. An evaluation method for designing a new product-service system. Expert Syst. Appl. 2012, 39, 3100–3108. [Google Scholar] [CrossRef]
  29. Exner, K.; Lindow, K.; Buchholz, C.; Stark, R. Validation of Product-Service Systems-A Prototyping Approach. Procedia CIRP 2014, 16, 68–73. [Google Scholar] [CrossRef]
  30. Komoto, H.; Tomiyama, T. Design of Competitive Maintenance Service for Durable and Capital Goods using Life Cycle Simulation. Int. J. Autom. Technol. 2009, 3, 63–70. [Google Scholar]
  31. Dorst, K. The core of ‘design thinking’ and its application. Des. Stud. 2011, 32, 521–532. [Google Scholar] [CrossRef]
  32. Kleemann, F. Un(der)paid Innovators: The Commercial Utilization of Consumer Work through Crowdsourcing Science. Technol. Innov. Stud. 2008, 4, 5–26. [Google Scholar]
  33. Tran, T.; Park, J.Y. Crowd Participation Pattern in the Phases of a Product Development Process that Utilizes Crowdsourcing. Ind. Eng. Manag. Syst. 2012, 11, 266–275. [Google Scholar] [CrossRef]
Figure 1. The research procedure.
Sustainability 08 00434 g001
Figure 2. The proposed framework.
Sustainability 08 00434 g002
Figure 3. Visualized data showing the scores of various designs along various criteria.
Sustainability 08 00434 g003
Table 1. Working mechanism of the proposed framework.
StepTasksMethodImplementation of Method
Preparation phase
0Start
Description: The company has a PSS to be redesigned or a PSS idea to design further.
Purpose: This step is the kickoff of the process.
N/AN/A
1Representation
Description: The company breaks down a complex PSS into basic elements and prepares to communicate to users so that they can understand.
Purpose: This step is the preparation for prototyping and user co-creation in the next phase.
Method: Simplified PSS presentation (Section 3.2)
Purpose: This method is used to make users understand the PSS well, so that they can contribute their ideas effectively (Section 3.1).
A PSS is represented as a combination of elements, and the representation is summarized in a table (see Table 2 below).
Creation phase
2Prototype #1
Description: The company demonstrates the prototype to a group of users. The users see and experience how the PSS works. This prototype can be presented in the form of a working prototype, such as: participatory prototyping or in the form of a storyboard, a simulation or any media-based illustration, depending on the type and characteristics of the PSS.
Purpose: This step makes users (user Group 1) clearly understand what the PSS is like and how it might be provided. By understanding this, they can experience the PSS to some extent, and this allows them to contribute ideas more properly.
Method: Storyboard and participatory game
Purpose: The storyboard explains briefly the PSS structure and mechanism, as well as elements and parameters, while the participatory game actually allows users to experience the PSS themselves by playing roles in the PSS process.
The PSS is introduced to the users firstly in the form of a storyboard, which explains what is included and how the PSS is provided (process, parameters, etc.). After that, the users are invited to participate in the participatory simulation of the PSS by playing roles.
3Co-creation
Description: The users participate actively to propose their own “PSS configurations” and customize the PSS design according to their own preferences. This can be done by inviting users, hosting participatory games or crowdsourcing.
Purpose: This step allows users to contribute their ideas by directly inputting their desired parameters.
Method: User submission forms
Purpose: These are forms that are created especially for collecting user inputs. The pre-defined forms helps to simplify the task for user submission and, thus, ensure effective contribution.
Users are asked to fill in a form with their desired parameters for the PSS. They are also asked to give comments and suggestions for the existing PSS, which was previously demonstrated in the “Prototype #1” step.
4Analysis
Description: The company analyzes user-generated PSS configurations and identifies the “favorite” configurations.
Purpose: This step summarizes user inputs and analyzes how various alternatives of PSS options are favored by users. From this analysis, new PSS concepts might emerge.
Method: Simple statistical analysis
Purpose: This method allows designers to collect and classify options to find “patterns”.
Designers collect user input options and parameters, cluster them into segments of closely equivalent values, count frequencies and figure out the “favorite” configurations.
5Generation
Description: Based on the “favorite configurations” above, the company builds new PSS concepts, i.e., “user-generated concepts”.
Purpose: This step makes new PSS concepts from users’ favorite options and parameters.
Method: Concept generation
Purpose: This method helps to generate various concepts or alternatives by combining various favorite options and parameters.
Designers combine various options and generate several alternatives that can be considered as user-generated concepts.
6Prototype #2
Description: The company demonstrates the prototypes of newly-generated concepts to a group of users so that they can evaluate them.
Purpose: This step ensures that the users (user Group 2) understand the PSS thoroughly as, well as experience the PSS themselves, so that they can give a precise and proper evaluation.
Method: Storyboard and participatory game
Purpose: The storyboard explains briefly the PSS structure and mechanism, as well as the elements and parameters, while the participatory game actually allows users to experience the PSS themselves by playing roles in the PSS process.
The PSS is introduced to the users firstly in the form of a storyboard that explains what is included and how the PSS is provided (process, parameters, etc.). After that, the users are invited to participate in the participatory simulation of the PSS by playing roles.
Finalization phase
7Evaluation
Description: The evaluation criteria are explained to the users, and the users score to evaluate various concepts. Based on the evaluation results, the company can select the winning (i.e., the best) concept.
Purpose: This step collects the evaluation of users (user Group 2) for the newly-designed PSS, as well as the existing PSS, so that the performances of alternatives can be compared quantitatively.
Method: Multi-criteria scoring
Purpose: This method allows users to evaluate the PSS along various criteria, and thus, a comprehensive evaluation can be achieved to give deeper insights and a precise comparison.
A list of criteria is proposed (Table 5) and a scoring scale of 1 to 5 is used to score PSS concepts. Scores are collected and calculated, and the results will be used to compare concepts to identify the best one.
8Improvement
Description: The company can improve the winning concept by selecting strong aspects of other concepts and implementing these aspects in the winning concept to achieve an “improved concept”.
Purpose: This step helps designers to exploit the best aspects of each concept to ensure that there is no waste of innovation.
Method: Manual improvementDesigners try to find strong aspects of low scored concepts and try to implement those aspects in the winning concept.
9End
The company achieves a new PSS design that is improved compared to the initial idea or the previous design.
N/AN/A
Table 2. Elements of the N-Handbook.
ElementContent
Product
  • A printed book
  • Optional additions: USB/DVD for lecture video storage, wooden box for keeping the book and accessories
Service
  • Lecture videos (YouTube channel)
  • Offline lectures
  • Additional documentation (tutorials, case studies, exercises, etc., on closed discussion boards)
  • Questions and Answers (QnAs)
  • Offline seminars, examination and certification, project guidance, consulting
Process
  • Online/offline announcement
  • Customer consulting
  • Customer purchase + delivery
  • Customers use
  • Provide services
  • Feedback and prepare for next version
Parameters
  • Forms of support
  • Number of offline lectures
  • Length of each offline lecture
  • Availability of online lectures
  • Length of project practice
  • Availability of examination and certification
  • Recommendation for job seeking
  • Annual update frequency
  • Number of offline seminars/best practices
  • Renewal fee for new release
  • Price of the package
Network
  • Existing web systems of Mulenserv, social network, email, etc., for delivering services
  • Offline network for delivering products (shops, post offices)
Stakeholders
  • The company (designers, staff)
  • Users
  • Suppliers (print shops, network providers)
  • Others
Value proposition
  • Bringing long-term benefits with flexible costs
  • Users make the most of the N-Handbook
Table 3. Details of the existing N-Handbook.
ElementContent
Product
  • A printed book: black and white
Service
  • Lecture videos: YouTube channel
  • Offline lectures: Yes
  • Additional documentation (tutorials, case studies, exercises, etc., on closed discussion boards): Yes
  • QnAs: Yes
  • Offline seminars: Yes
Process
  • Online/offline announcement
  • Customer consulting
  • Customer purchase + delivery
  • Customers use
  • Provide services
  • Feedback and prepare for next version
Parameters
  • Forms of support (FOS): No
  • Number of offline lectures (NOL): 12
  • Length of each offline lecture (LEL): 2 h
  • Availability of online lectures (AOL): Yes
  • Length of project practice (LPP): not available (N/A)
  • Availability of examination and certification (AEE): No
  • Recommendation for job seeking (RJS): No
  • Annual update frequency (AUF): 1 per year
  • Number of offline seminars/best practices (NOS): 1 per year
  • Renewal fee for new release (RFR): 50% discount (DC)
  • Price of the package (POP): 210 USD
Network
  • Existing web systems of Mulenserv, social network, email, etc., for delivering services
  • Offline network for delivering products (shops, post offices)
Stakeholders
  • The company (designers, staff)
  • Users
  • Suppliers (print shops, network providers)
  • Others
Value proposition
  • Bringing long-term benefits with flexible costs
  • Users make the most of the N-Handbook
Table 4. Comparison of various new N-Handbook designs.
ElementContent of N-Handbook Designs
D0XD1D2D3
ProductColor printed bookBlack and white printed book
Wooden box
USB
DVD
Color printed book
Wooden box
DVD
Black and white printed book
DVD
ServiceYouTube channel
Offline lecture
Additional documentation
QnAs
Offline seminars
Offline lecture
Additional documentation
QnAs
Offline seminars
Offline lecture
Additional documentation
QnAs
Offline seminars
YouTube channel
Offline lecture
Additional documentation
QnAs
Offline seminars
Process
  • Online/offline announcement
  • Customer consulting
  • Customer purchase + delivery
  • Customers use
  • Provide services
  • Feedback and prepare for next version
ParametersFOS: No
NOL: 12
LEL: 2 h
AOL: Yes
LPP: 3 months
AEE: Yes
RJS: Yes
AUF: 2 per year
NOS: 2 per year
RFR: 70% DC
POP: 210 USD
FOS: Facebook
NOL: 4
LEL: 2 h
AOL: Yes
LPP: 3 months
AEE: Yes
RJS: Yes
AUF: 1 per year
NOS: 4 per year
RFR: 70% DC
POP: 200 USD
FOS: Multi (*)
NOL: 12
LEL: 2 h
AOL: No
LPP: 3 months
AEE: Yes
RJS: Yes
AUF: 3 per year
NOS: 3 per year
RFR: 70% DC
POP: 230 USD
(*): Facebook, Boards, email, Mobile apps
FOS: Multi (*)
NOL: 8
LEL: 2 h
AOL: No
LPP: 2 months
AEE: Yes
RJS: Yes
AUF: 3 per year
NOS: 2 per year
RFR: 80% DC
POP: 190 USD
(*): Boards, email
Network
  • Existing web systems of Mulenserv, social network, email, etc., for delivering services
  • Offline network for delivering products (shops, post offices)
Stakeholders
  • The company (designers, staff)
  • Users
  • Suppliers (print shops, network providers)
  • Others
Value proposition
  • Bringing long term benefits with flexible costs
  • Users make the most of the N-Handbook
Table 5. Scoring criteria.
CriteriaDescription
Ease of accessHow easily can the users access, use and leverage the package?
ApplicabilityIs this package applicable to the users’ job?
AffordabilityIs the price of the offering affordable (considering its content)?
DesirabilityDo the users want to buy the package?
NecessityIs this package necessary for the users’ job?
AcceptanceIf the users are offered this package, would they accept the offering?
Table 6. Mean values of scores for various designs along various criteria.
CriteriaMean Value of Scores for Various Designs
D0XD1D2D3
Ease of access3.213.803.983.72
Applicability3.183.743.903.97
Affordability2.743.202.873.75
Desirability2.703.133.383.44
Necessity3.283.723.853.75
Acceptance3.023.543.983.66
Table 7. t-test analysis results.
ValueEase of AccessApplicabilityAffordabilityDesirabilityNecessityAcceptance
Pearson correlation coefficients0.2570.3170.4030.3910.3900.0314
t-statistic4.3875.0680.7984.1283.8795.030
P (T ≤ t) one-tailed2.191 × 10−51.833× 10−60.2145.399 × 10−51.250 × 10−42.111 × 10−6
P (T ≤ t) two-tailed4.382 × 10−53.667 × 10−60.4281.080 × 10−42.501 × 10−44.221 × 10−6

