Article

Life Cycle Inventory Analysis for a Small-Scale Trawl Fishery in Sendai Bay, Japan

by
Kazuhito Watanabe
1,† and
Kiyotaka Tahara
2,*,†
1
Fisheries Industry and Fishing Port Department, Miyagi Prefecture Kesennuma Regional Promotion Office, 47-6 Suginosawa Akaiwa, Kesennuma-city, Miyagi 988-0066, Japan
2
Research Institute of Science for Safety and Sustainability, National Institute of Advanced Industrial Science and Technology (AIST), 16-1 Onogawa Tsukuba-city, Ibaraki 305-8569, Japan
*
Author to whom correspondence should be addressed.
These authors contributed equally to this work.
Sustainability 2016, 8(4), 399; https://doi.org/10.3390/su8040399
Submission received: 21 October 2015 / Revised: 14 April 2016 / Accepted: 18 April 2016 / Published: 22 April 2016

Abstract

:
A reduced environmental burden, while maintaining high quality and low cost, has become an important factor for achieving sustainability in the fisheries sector. The authors performed life cycle inventory (LCI) analysis targeting the fish production for a small-scale trawl fishery including small trawlers operating in Sendai Bay, Japan. The average annual cumulative CO2 emissions for the small trawlers were 4.7 ton-CO2/ton-product and 8.3 ton-CO2/million Japanese yen (JPN). Total fuel consumption contributed to 97% of the global warming potential. The range of variation in the basic unit of CO2 for each small trawler was also elucidated. Energy conservation through lower fuel consumption is shown to be an effective measure for reducing CO2 in a small trawler fishery. Moreover, the authors examined the system boundary, the determination of the functional unit, and the allocation method of applying LCI analysis to fisheries. Finally, the economy and environment of small trawler fisheries are discussed as important factors for sustainable fisheries, and the life cycle approach is applied to a new fishery type in Japan.

1. Introduction

There is increasing action toward solving environmental problems to make our society more sustainable. In line with this trend, the fisheries industry has reached a stage wherein environmental conservation must be promoted as a third new factor in addition to quality and cost. It is important to monitor and quantify the environmental impacts that occur through fishing activities. Although various types of environmental impact exist, it is certainly necessary to improve greenhouse gas emissions from fisheries.
The small-scale trawl fishery, hereafter referred to as small trawlers, consists of powerboats of less than 15 ton. The main targets of this fishery are fish and shellfish that inhabit the seabed. According to 2008 fishery statistics [1], the amount landed by small trawlers is the second largest in Japan after large and medium purse seine fisheries. Small trawlers are used along various areas of the Japanese coast. In Miyagi Prefecture, small trawlers serve as the core of the coastal fishery along with the gill net and set net fisheries. This fishing method is important for supporting the coastal fishery production of Miyagi Prefecture.
Sendai Bay, the main fishing area of Miyagi Prefecture, is shallow with a maximum of 50 m in depth at a considerable distance from the shore, and its seabed is covered with sand or mud inhabited by many types of fish and shellfish. Figure 1 shows the location of Sendai Bay including the fishing ground and the Miyagi Fishermen’s Cooperative Association, Watari branch office, hereafter referred to as MF-Watari. The coastal fishery in Sendai Bay includes many fisheries such as small trawler, gill net, and set net. The Watari fish market managed by MF-Watari handles the landings of the coastal fisheries of Sendai Bay. The amount of marine products landed at the Watari fish market in the 2009 fiscal year was 483 ton, worth 220.7 million Japanese yen (JPN). The landings by small trawlers, gill nets, set nets, and all other methods at the Watari fish market by mass were 212, 54, 153, and 64 ton with values of 114.7, 39.3, 46.3, and 20.4 million JPN, respectively. The amount of catch handled by small trawlers accounted for 44% of activity at the Watari fish market. Of the fish caught, flatfish and wild salmon were the top two. The landings of flatfish, salmon, and all others were 192, 161, and 130 ton, respectively, equivalent to 112.3, 42.02, and 66.33 million JPN, respectively. At the Watari fish market, flatfish accounts for 40% of the fish handled.
Life cycle assessment (LCA), which is standardized by ISO 14040 and 14044 [2,3], is used for evaluating the environmental impact of a product from a life cycle perspective. This technique was initially developed for evaluating industrial products but is also applied to the fisheries industry. Research on LCA related to boat fisheries and aquaculture has been conducted. Ziegler and Hansson [4] reported the results of LCA on the gill net and trawl fisheries targeting the codfish of Sweden. In their report, interpretation of environmental impacts peculiar to the fishery industry was conducted, and their environmental burden was quantified. Ziegler et al. [5] referred to the LCA methodology for allocation in a fishery. In addition, Thrane [6] presented a case study on Danish seine-trawl fishery and calculated the amount of fuel consumption and CO2 emission per t of flatfish caught. Moreover, Ziegler et al. [5] and Thrane [7] showed the results of impact assessments. Minami et al. [8] surveyed the tuna long-line fishery of Japan and calculated the environmental burden including CO2, NOx, and SOx emissions. Hospido and Tyedmers [9] covered purse-seine fishery of tuna in Spain and calculated the environmental burden, including ship’s bottom paint. Hospido et al. [10] also calculated the impact from the canned tuna industry and reported that a considerable amount of CO2 is emitted by the fishery. Moreover, Ando and Hasegawa [11] calculated the environmental impacts of mackerel canning. Watanabe et al. [12] compared the environmental burden of three fishing methods for Japanese squid and demonstrated a method for reducing CO2 emissions. Furthermore, Vázquez-Rowe et al. [13] reported on coastal purse-seine and trawl fisheries for horse mackerel in the Atlantic Ocean. Vázquez-Rowe et al. [14] conducted LCA for fresh hake. Schau et al. [15] discussed the energy consumption of Norwegian fisheries. Ellingsen et al. [16] showed the environmental analysis results of the Norwegian fishery and aquaculture industry. Driscoll and Tyedmers [17] discussed fisheries management relative to environmental conservation. Fréon et al. [18] assessed common assumptions regarding the exclusion of items from the life cycle inventory (LCI) of the Peruvian industrial anchoveta fleet. Regarding aquaculture, Iribarren et al. [19] showed the LCI results of mussels. Watanabe [20] also discussed the LCI for scallops, sea tangle, and brown seaweed as non-feeding aquaculture. For feeding aquaculture, Ayer and Tyedmers [21] and McGrath et al. [22] conducted LCI analysis for salmon, and Cao et al. [23] surveyed a case study of shrimp in China. In the case of feeding aquaculture, feed represents the main environmental burden. Regarding methodologies, Parker and Tyedmers [24] expanded a discussion of the functional unit, and Ayer et al. [25] discussed allocation. Parker [26] conducted the comprehensive LCA reviews for features of fisheries and aquacultures. Many LCA studies of the fishery industry have been reported in Europe and North America; those in other regions are fewer. Trawl fisheries and salmon aquaculture are popular research topics, with cod and salmon studies reported most often. Other fisheries and fish species have increasingly been reported, although the number of such studies remains small. The fish species caught, fishing method, and resource management differ among regions. Hence, the fisheries of these different regions must be analyzed. Such regional differences are considered to affect the results of the environmental impact. Although Japan has abundant fishery production, few reports of LCA for fisheries are available in that country. Therefore, LCA research must be promoted in Japan to advance the fisheries industry. Even though trawl fishery is the most commonly reported, no LCA research for Japanese small trawlers has been conducted. The targeted fish resources and fishing methods also differ among regions. Therefore, in order to consider a reasonable policy for sustainable small trawling in the future, it is essential to understand the environmental burden of Japanese small trawlers.
Most of the past LCA research into fishery production utilized a model ship or statistical data and calculated the average value of production in one year or one fishing season as a basic unit. However, because a fishery is an industry synchronized to nature, it is assumed that the value of its basic units also changes according to differences in fishing boats and seasons. This characteristic is different from industrial products. At present, the range of variation of the basic unit of each fishery is not clear. Therefore, it is necessary to elucidate the degree of variation in the environmental burden of fisheries. These results should be considered in the evaluation of marine products.
An inventory analysis of the production stage for small trawlers operating mainly in Sendai Bay, Japan, is conducted in the present research. One result is a quantitative estimate of the greenhouse gas emitted by small trawlers in Japan. Moreover, measures for reducing the environmental impact are discussed. In addition, the methodology of LCA in fisheries is examined including the system boundaries, functional unit, and allocation. Furthermore, conditions needed to develop the small trawler into a sustainable fishery are discussed.

2. Methods

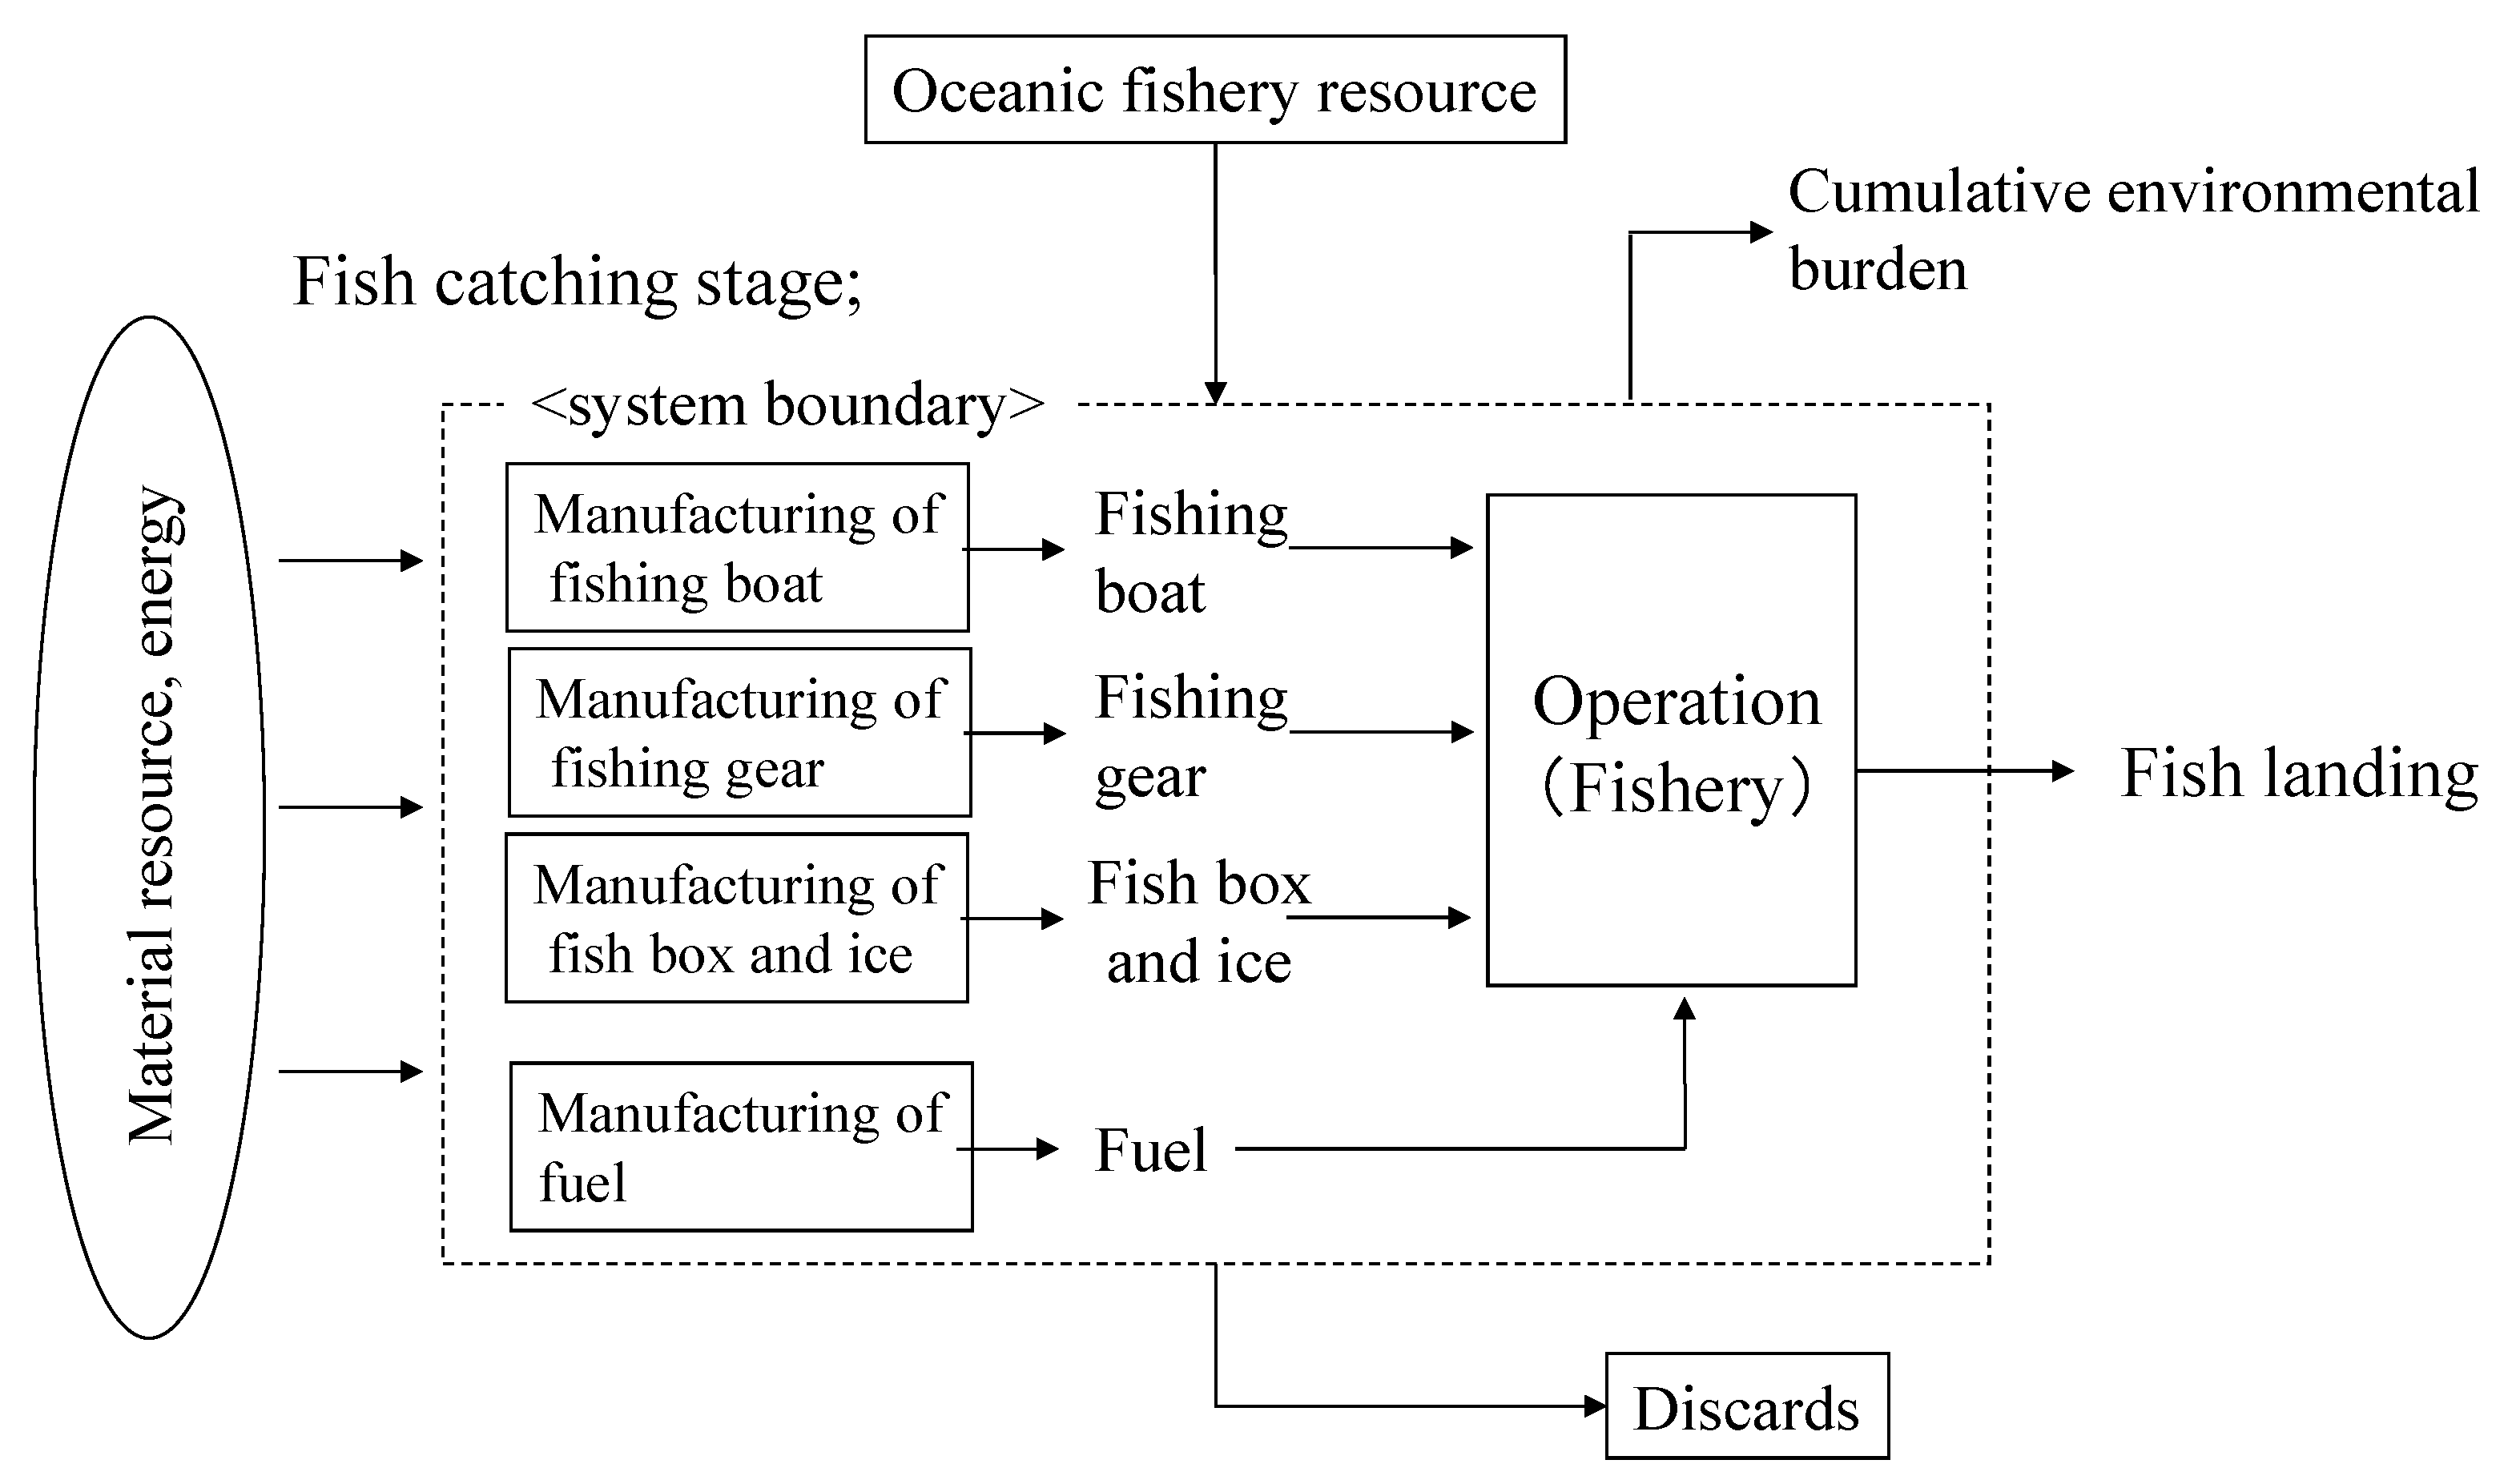
2.1. System Boundary

The construction of fishing boats, manufacture of fishing gear, consumption of fuel, and consumable goods usage have been incorporated in the system boundary of fisheries in previous research [9,12,18]. As a result, greenhouse gas emissions have been linked to fuel consumption. Other studies have reported that fishing gear accounts for approximately 30% of the set net fishery [12]. Moreover, it has been highlighted that fishing items should not be ignored in the LCI [18]. Considering the previous research, the system boundaries of this study are shown in Figure 2. These boundaries include the evaluation of fish boxes and ice, which are used in large quantities. Input data are related to the fishing boat, fishing gear, fishing box including ice, and fuel consumption. The output data are related to landed seafood products and cumulative emissions into the environment. In addition to the actual fishing operation, the processes of the manufacturing of fishing gear, fishing boats, and fuel are also considered in this system. Regarding fishing equipment, we considered the material composition and mass of each material at the pre-assembly stage and the electric power consumed during assembly. The environmental burden of the transportation stage of fishing gear (e.g., from factory to fishing boat) was not determined in the present study. The disposition stage of fishing equipment was also excluded from this investigation because the flow and the type of work involved were not clear.

2.2. Data Collection

Data on small trawlers were collected from July 2009 to February 2011. MF-Watari is located in southern Sendai Bay (Figure 1) in the Arahama fishing port, which is the base of the small trawler fishery. The data used for analysis were gathered by conducting interviews and questionnaire surveys at MF-Watari. The data covered one year from January to December 2009 and included operational conditions such as the number of fishermen, the tonnage of the fishing boats, details of the fishing gear, number of fishing days per year, number of trawls per day, and towing time per trawl, and fish production information such as the species landed, the catch weight, and the value of the catch. Data were collected from MF-Watari for 10 small trawler boats belonging to the association. Moreover, data of the management income and expenses of each fishing boat were also obtained.

2.3. Analysis of Data

The environmental burden of each item used in the small trawler fishery was calculated by using LCA support software developed by the Japan Environmental Management Association for Industry (JEMAI). In accordance with Figure 2, the authors evaluated the intensity of the global warming potential for fishing boats, fishing gear, fuel, and fish boxes including ice. More information on fishing boats have been reported previously [27]. The fishing gear data were determined by obtaining the material and power consumption for each item as foreground data for each component to evaluate the environmental impact intensity by using the background data of JEMAI. The basic unit for fuel use was determined from the background data of JEMAI. Fish boxes created in the background data of JEMAI used foreground data for the material and the actual measurement. In addition, ice included the electric power consumption and the amount of water used by the ice-making machine. Although various environmental impacts were assumed to be related to the environmental burden caused by small trawlers, in this work, CO2 was used as an indicator for global warming potential. Each target item related to small trawlers was calculated by multiplying the amount of input for each unit by its CO2 intensity. Because items such as fishing boats and fishing gear are used for several years, their lifetimes were assigned values of 30 years and 3 years, respectively. The cumulative CO2 emission of small trawlers was then obtained by totaling the CO2 generated by each item. The period covered by the analysis was one year (2009). When inventory analysis is performed, it is necessary to define a functional unit in the evaluation criteria. In previous studies mass, monetary value, energy, and protein have all been used as allocation keys [24]. The choice of functional unit can also be an important methodological choice when comparing fisheries because certain fisheries may perform better when assessed in terms of per-mass environmental burden, whereas others may perform better when assessed in economic terms [25]. Based on the above, in this research, two standards (mass and monetary value) often used in the fisheries market were both adopted as functional units. The mass criterion was defined as the amount of CO2 per t of fresh fish landed in the fish market (essentially round type); the monetary criterion was defined as the amount of CO2 per fresh fish landed worth 1 million JPN in the fish market. Because the small trawlers could land any of the many species of fish at any given time, allocation information was needed to perform CO2 calculations for fish species. Hence, allocation was assigned using both mass criteria and monetary criteria.

3. Results

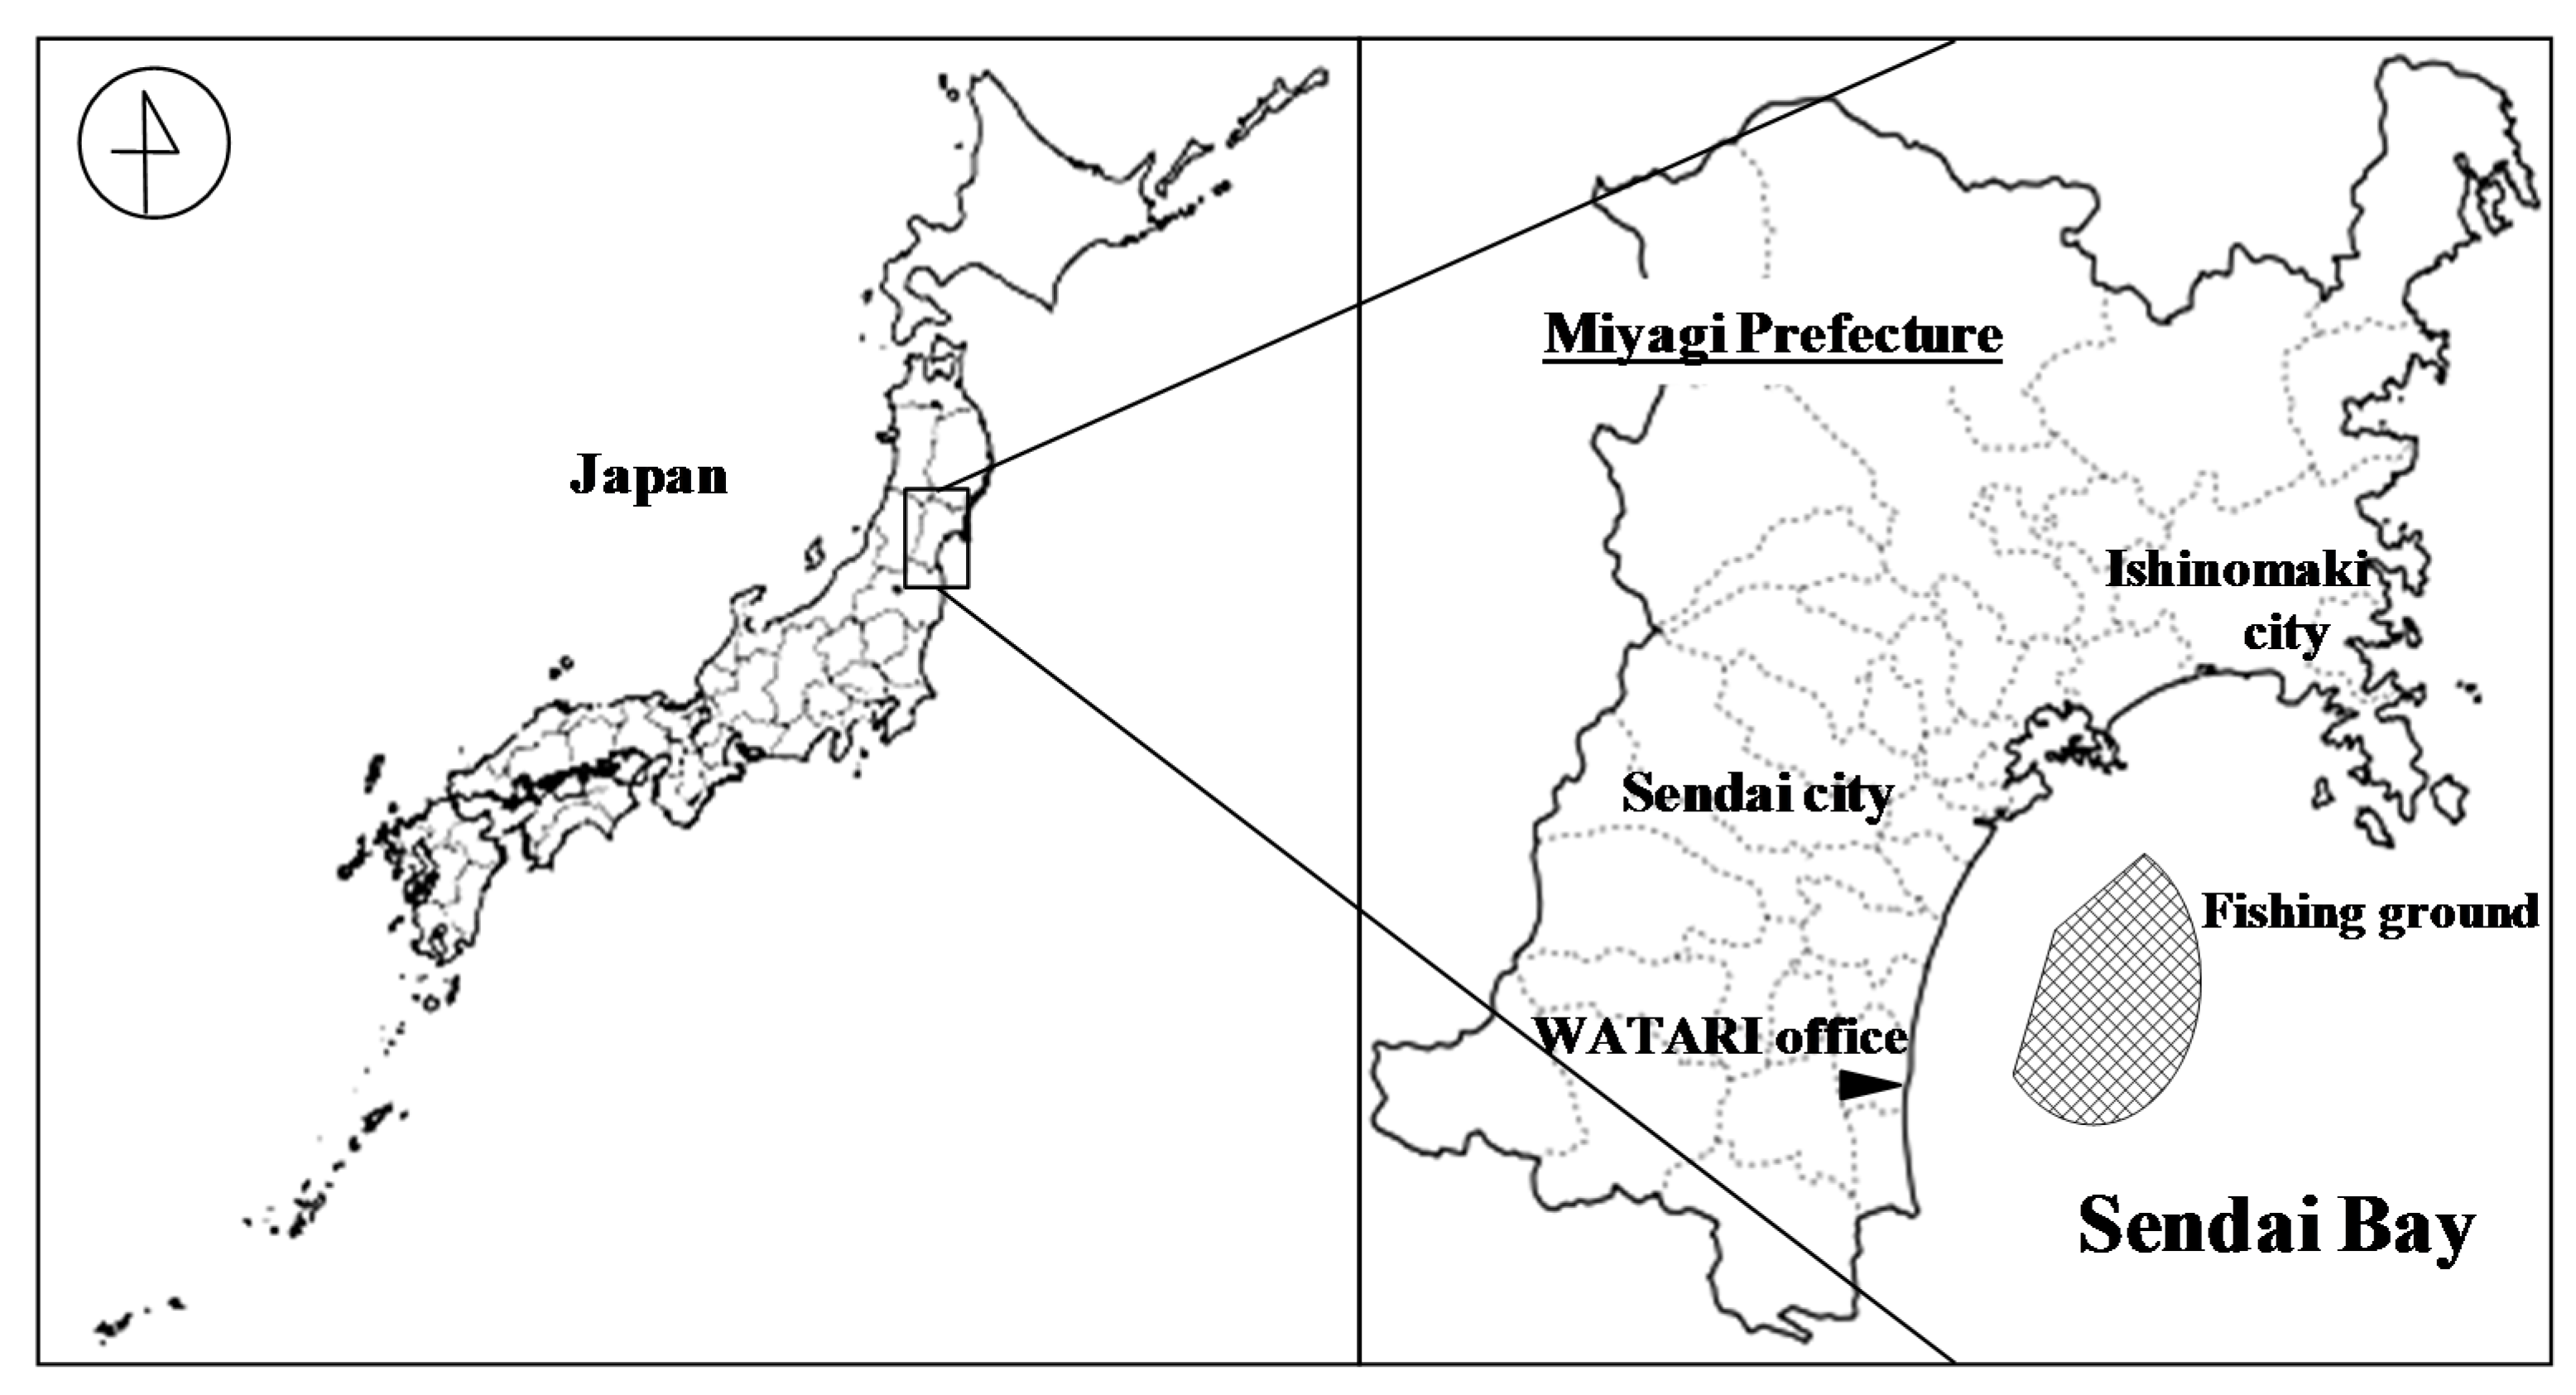
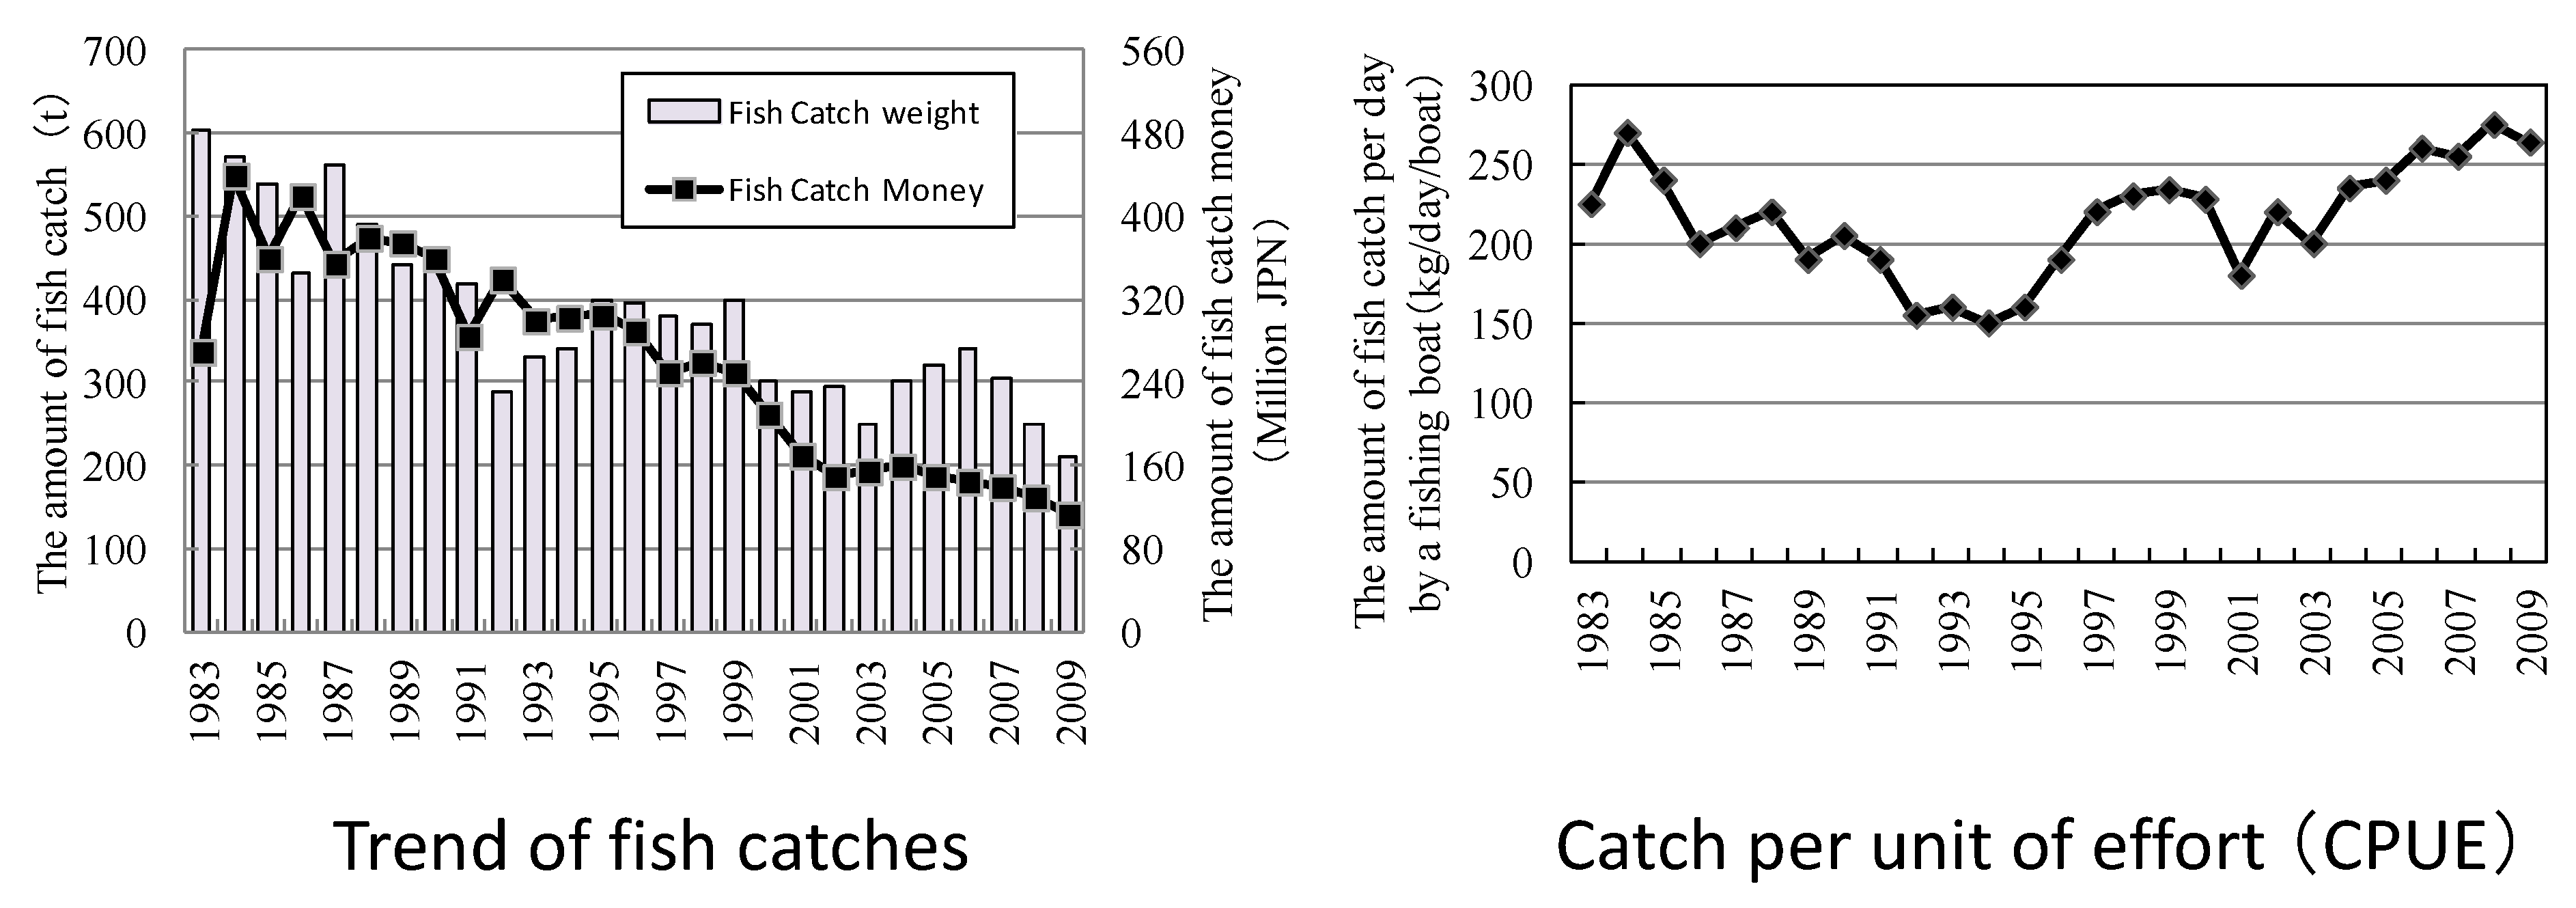
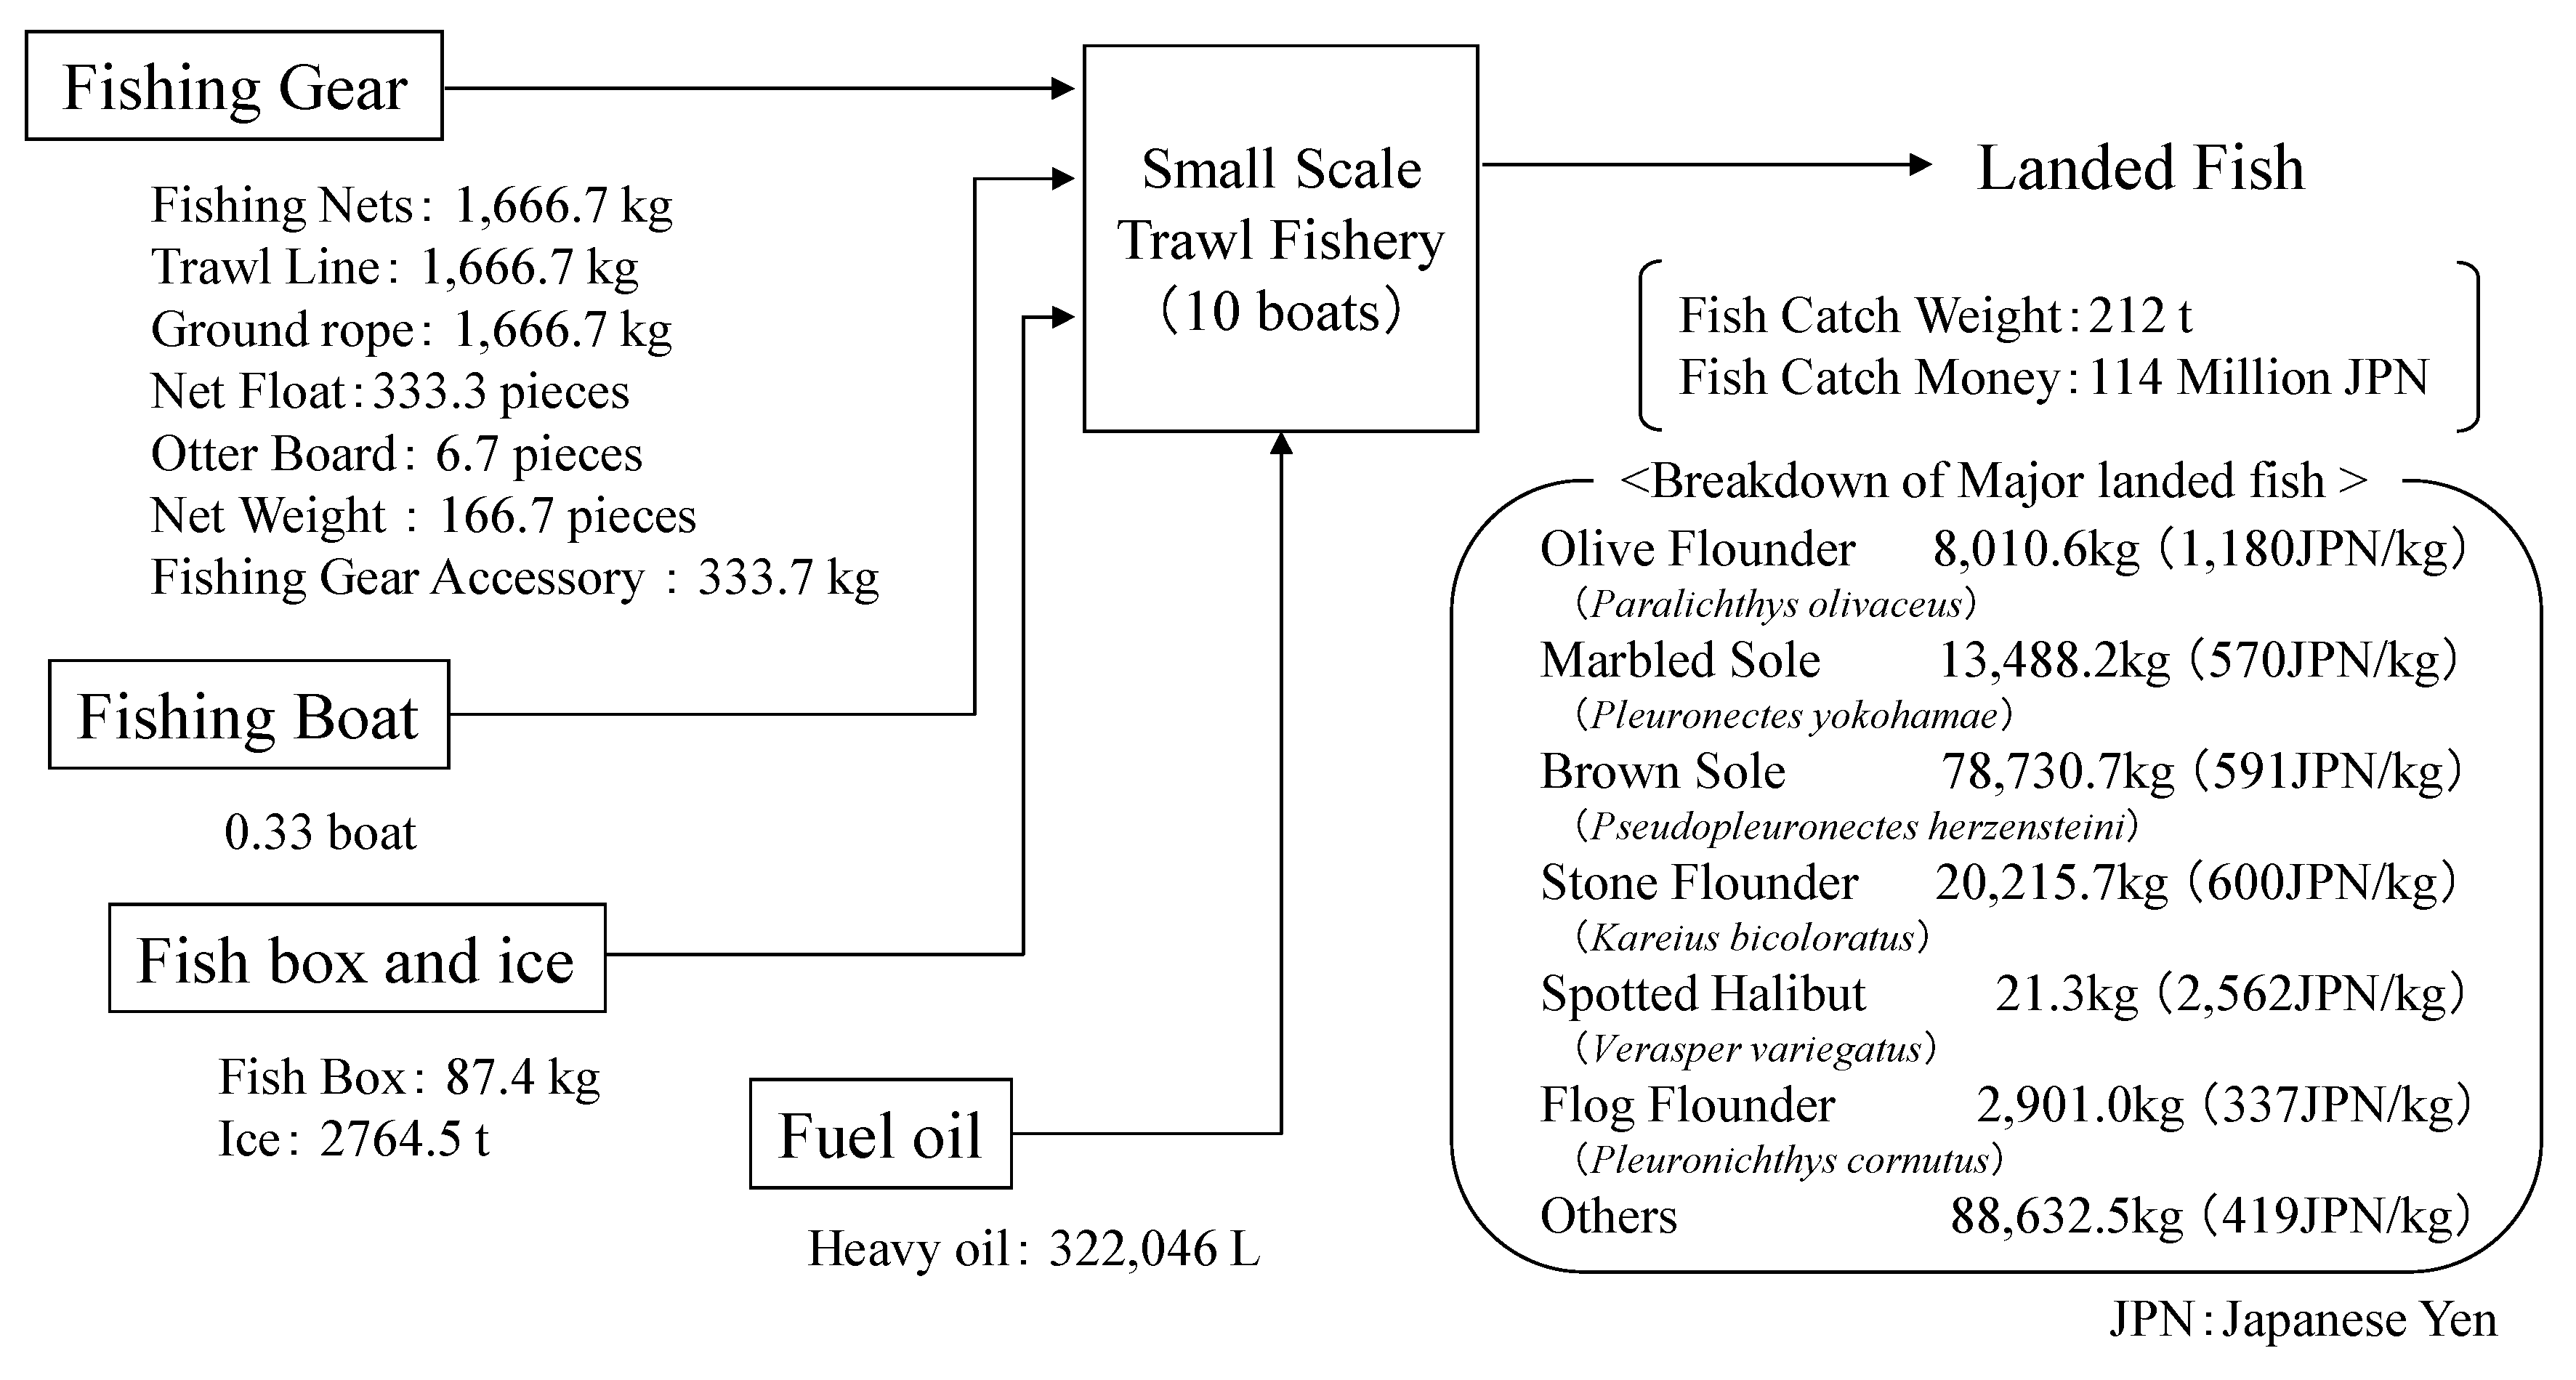
3.1. Operation of the Small Trawlers

According to the fisheries law of Japan, governor-licensed small trawlers are classified into five types. The small trawlers of MF-Watari were classified as “Other small type Danish seine fisheries”, i.e., the small otter trawl fishery. Although MF-Watari operated 26 small trawlers at its peak in the 1970s, the number of fishing boats has trended downwards since then, and as of February 2011, only 10 boats were still in operation. The MF-Watari fishing boats classified as small trawlers fall in the range of 7.3–9.7 ton (one 7 ton boat, four 8 ton boats, and five 9 ton boats). Many small trawlers operated by MF-Watari are of advanced age, considering that the average number of usable years for Japanese fishing boats is 20. Nine of the boats are about 30 years old, and one boat is 3 years old. Although the landing sum total of all the small trawlers was 600 t (430 million JPN) in the peak period of the 1970s, it has decreased to less than half that of the peak period in the past several years. However, the catch per unit of effort (CPUE), which is an important index for fish resource management, has trended upward since 2001, and has recovered to the level seen in the peak period (Figure 3).
The fishing season for small trawlers is currently set at 10 months (January–February and May–December) by the fishery adjustment rule of Miyagi Prefecture. Thus, the fishing season is closed in March and April. The number of annual operation days is in the range of 55–105, although it is different for each boat. On a typical fishing day, boats leave port at 04:00, do four trawls (each lasting about 2.5 h), a set (lasting 1.5 h), and sorting (lasting 1 h), after which they return to port at around 17:00. This pattern varies slightly according to season. The daily work time for a boat is about 13 h. After returning to port, the catch of fish is transferred to the Watari fish market for auction the next day.

3.2. Inventory Analysis

A schematic of the flow of materials and energies used for the small trawlers belonging to the MF-Watari in 2009 is shown in Figure 4. This figure represents the materials and energy used for landings in 2009. Materials that have multi-year usage were converted into input amount per unit year. For example, since the 10 fishing vessels have a lifetime of 30 years, they are expressed as 0.33 vessels in the unit year. The CO2 intensity of each item used for calculation is described in Table 1. The cumulative CO2 emissions of all 10 MF-Watari small trawlers in 2009 was obtained by multiplying the items shown in Figure 4 by the values presented in Table 1 (for the corresponding fishing boats, fishing gear, fishing boxes including ice, and fuel) and then totaling the obtained values. Therefore, total CO2 is shown in the following equation: Total CO2 = Σ (CO2 intensity × the amount of input of each item/lifetime of each item). As a result, the annual cumulative CO2 emission for the small trawler fleet is 1001.6 ton. When expressed in terms of the functional units, these amounts are estimated to be 4.7 ton-CO2/ton-product and 8.3 ton-CO2/million JPN, respectively (Table 2).
As shown in Figure 5, the percentage distribution of the amount of CO2 emissions shows that the main source of CO2 emission is fuel consumption (97%); fishing boats, fishing gear, and fishing box with ice contribute just 1% each. This study shows that fuel consumption is a hotspot of CO2 emissions, which agrees with other reports. Even though fish boxes and ice were newly added items to the system, they did not significantly contribute to the total CO2 discharge.
The CO2 emissions for fish caught in the small trawlers, calculated by mass and money-based allocation are summarized in Table 3. The amounts of CO2 per kg-product of brown sole, olive flounder, stone flounder, marbled sole, and all others by mass-based allocation are 4.7 kg each. On the other hand, the amounts of CO2 per kg-product of brown sole, olive flounder, stone flounder, marbled sole, and all others by monetary-based allocation are 5.2, 5.5, 5.2, 5.0, and 3.2 kg, respectively.

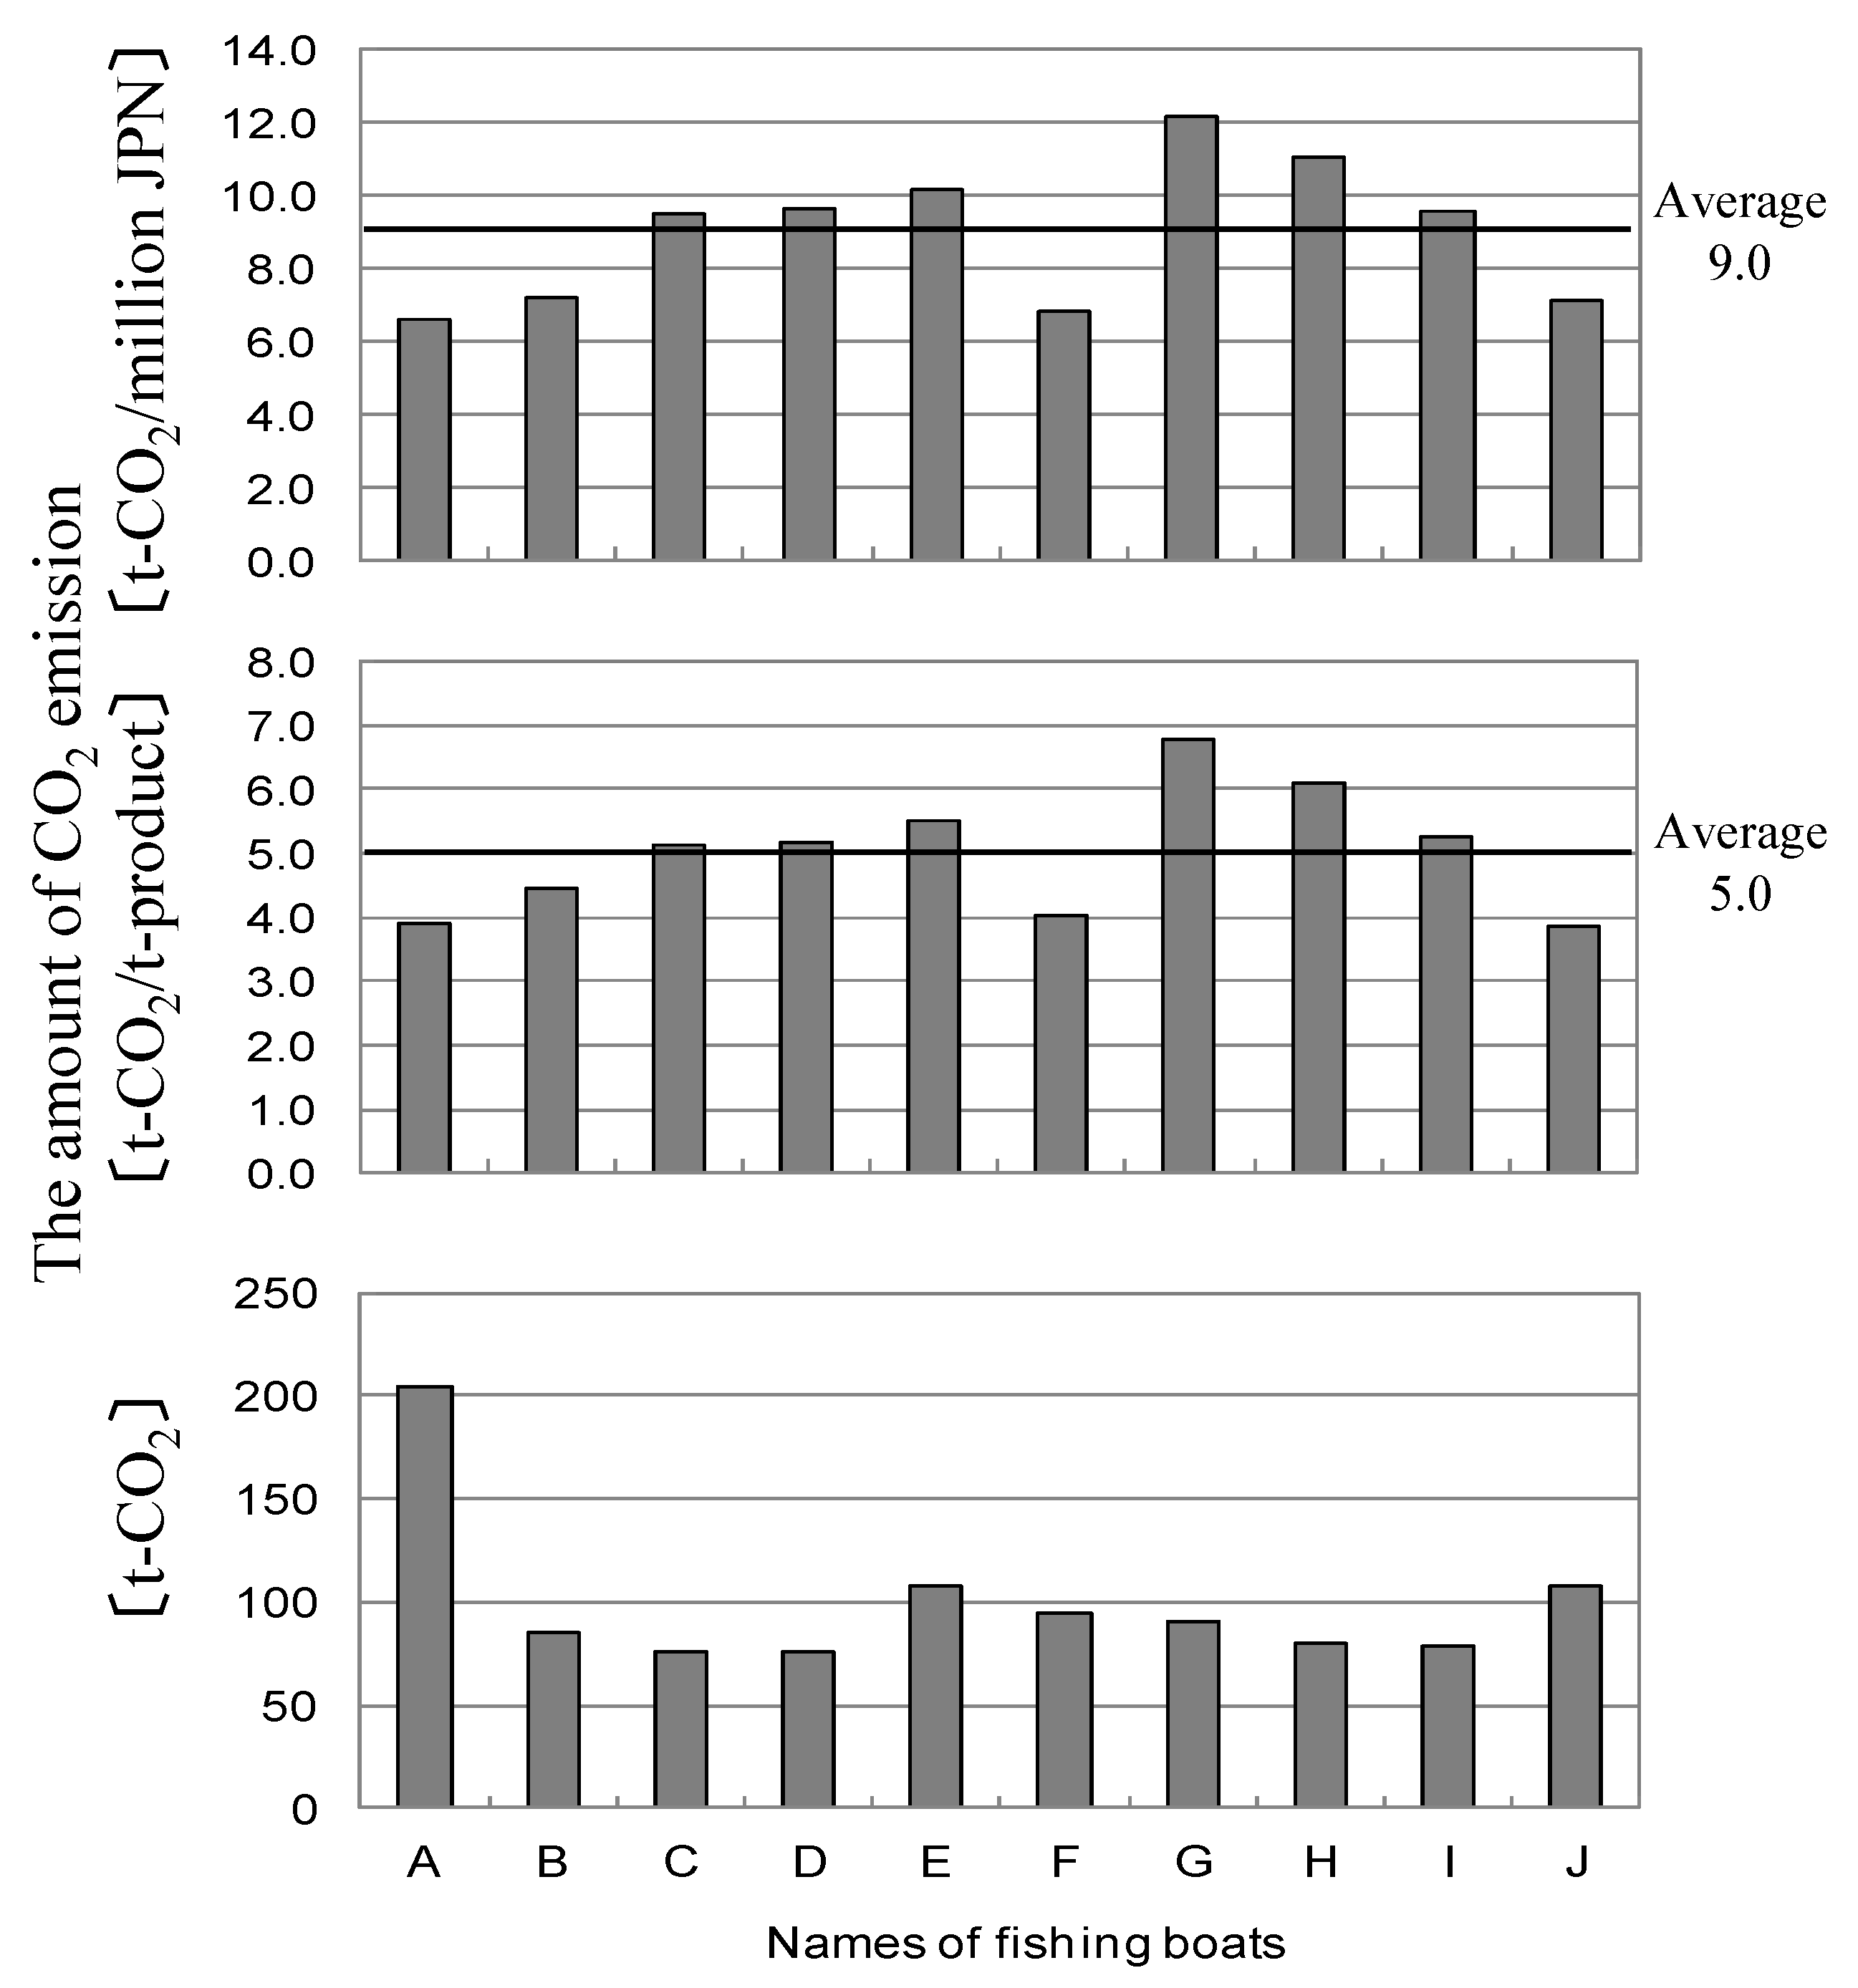
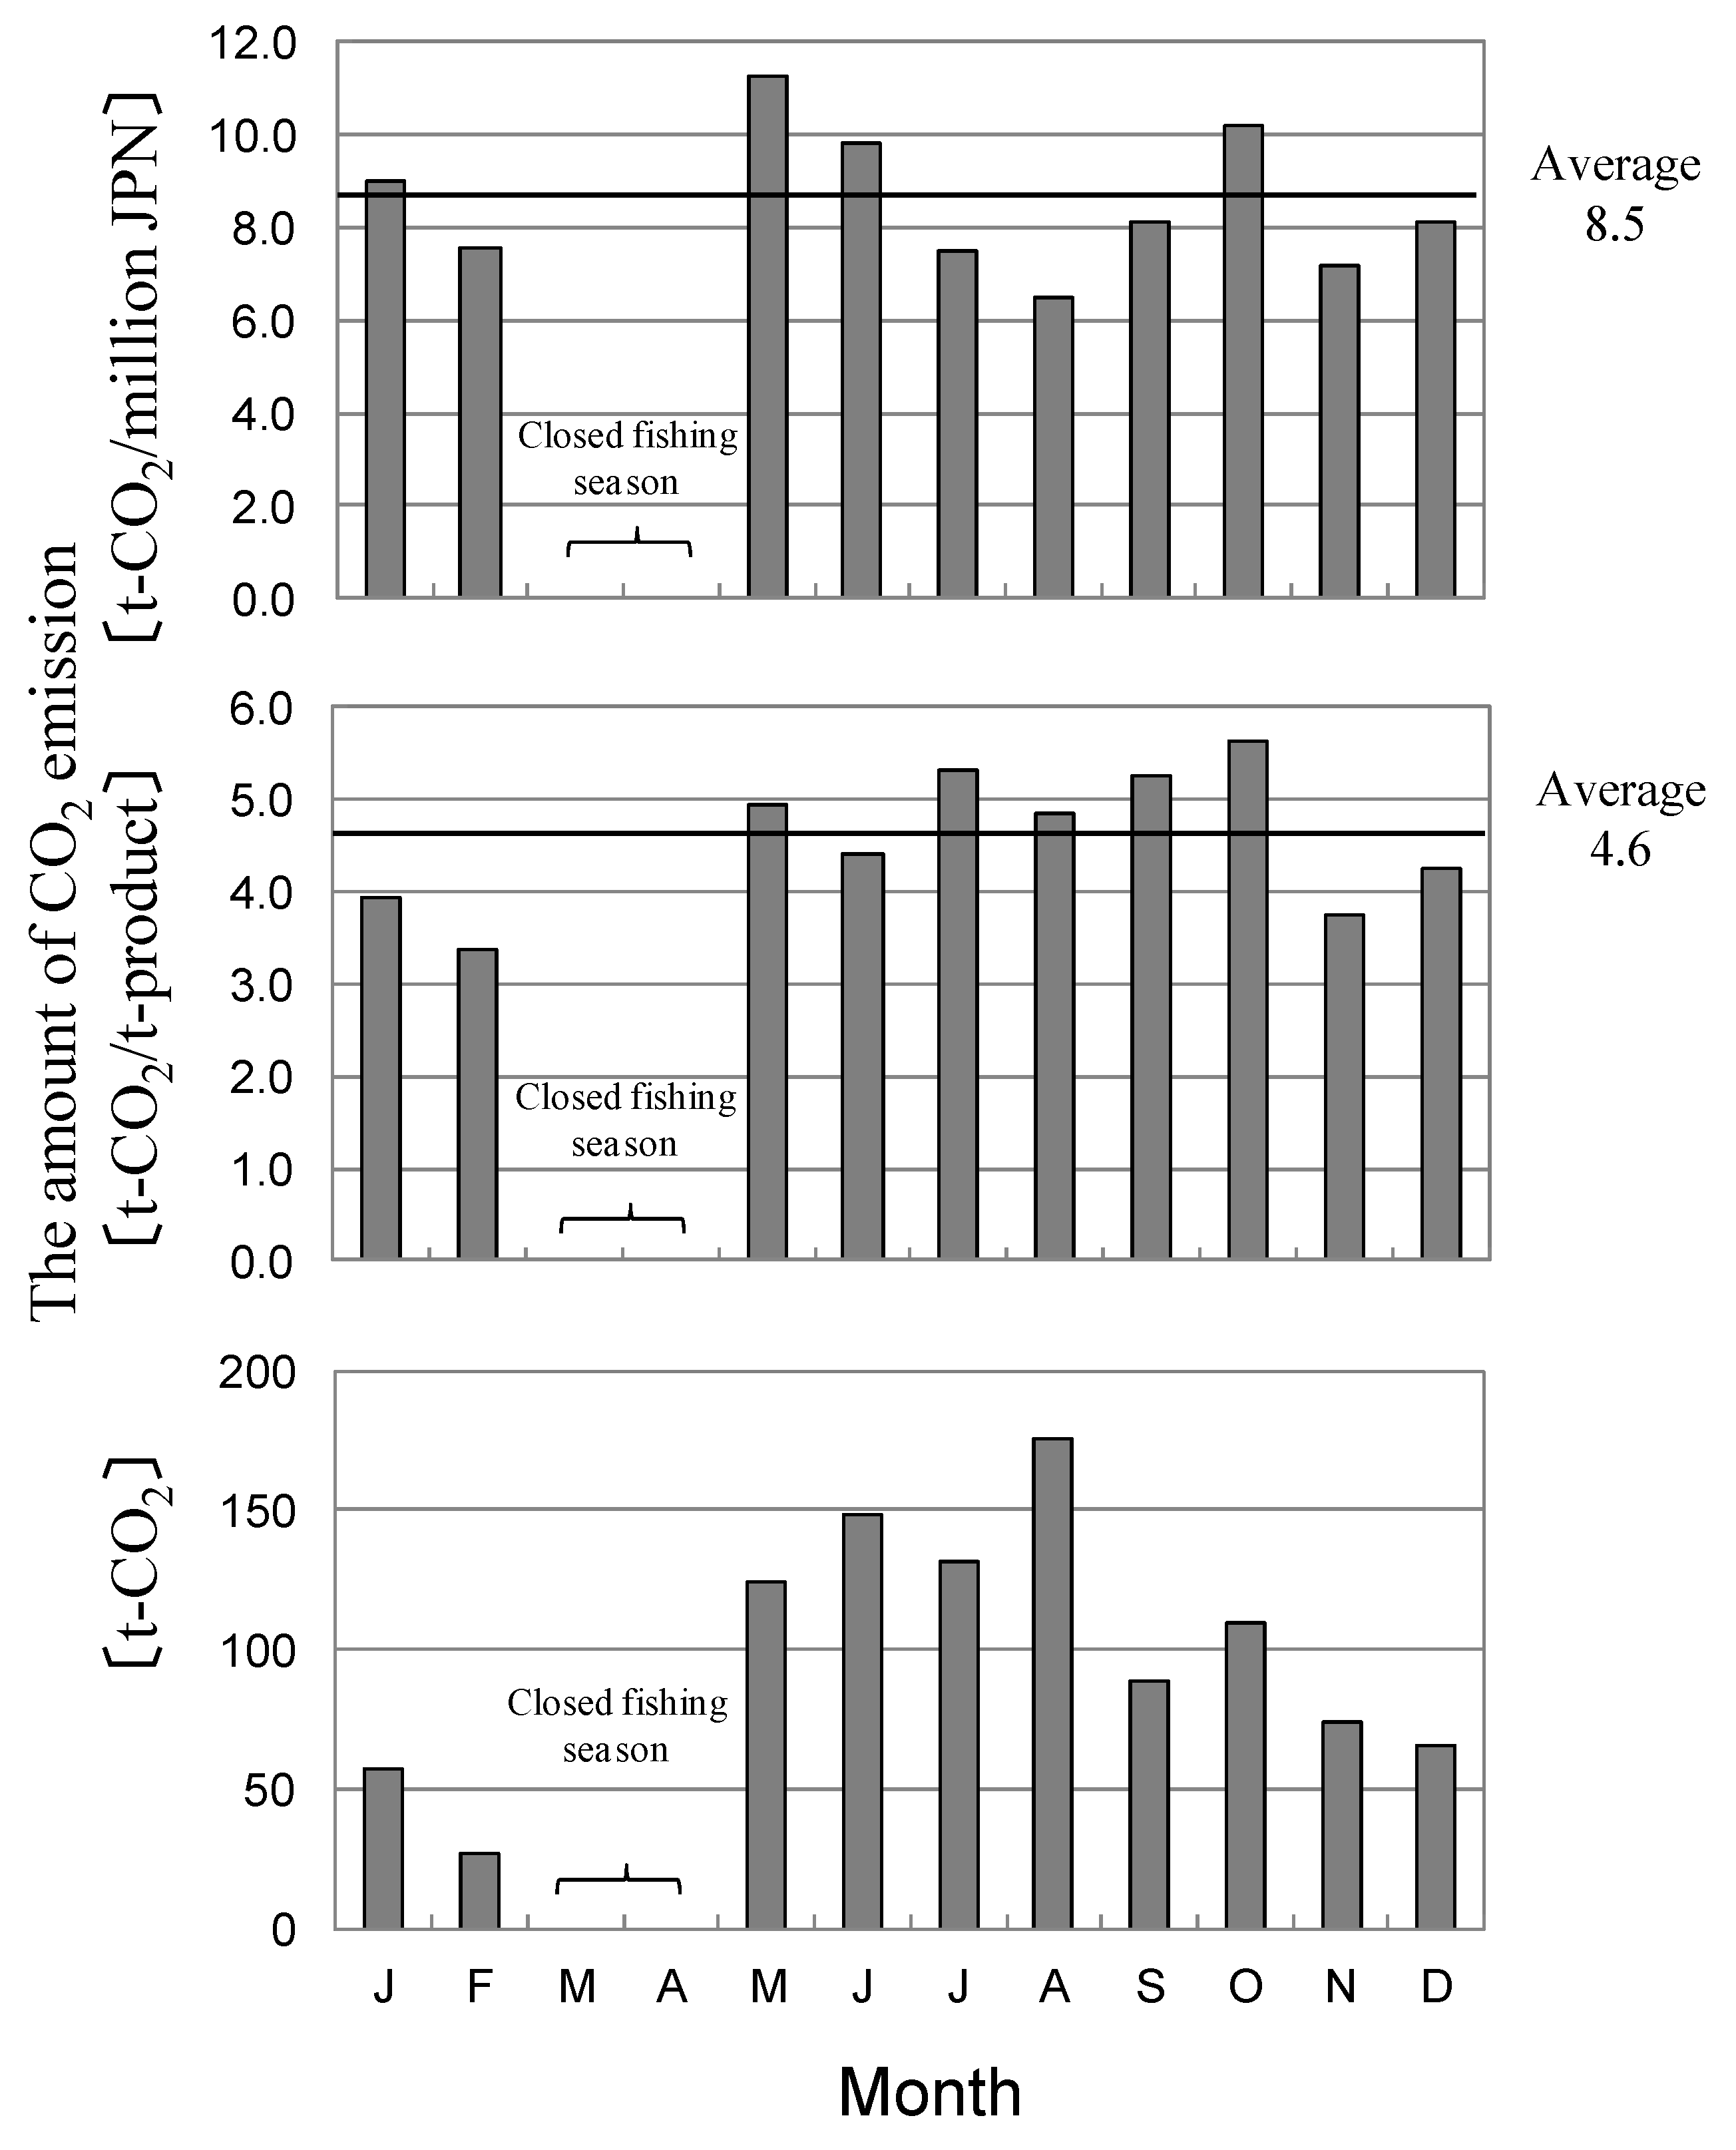
3.3. Variation in CO2 Emissions

The CO2 emissions of each individual boat in the small trawler fleet were calculated. Figure 6 shows the CO2 emissions of each of the 10 small trawler fishing boats (small trawlers A–J) belonging to MF-Watari. All the boats (except small trawler A) discharged about the same amount of CO2 (100 ton). On the other hand, small trawler A discharged twice this amount. The maximum and minimum CO2 emissions per t of fish catch by boat are 6.8 ton (for small trawler G) and 3.9 ton (for small trawler A and J), and the average is 5.0 ton. A difference of 2.9 ton was shown by subtracting the minimum emissions per ton of fish from the maximum. The standard deviation (S.D.) is 0.98 and the standard error (S.E.) is 0.31. The maximum CO2 emission per million JPN of fish catch by each boat is 12.2 ton (for small trawler G), and the minimum is 6.6 ton (for small trawlers A). The average value is 9.0 ton, and the 5.6 ton difference was confirmed by subtracting the minimum emissions per million JPN from the maximum. The S.D. is 1.93 and the S.E. is 0.61.
Furthermore, the monthly change in CO2 emissions is described in Figure 7. In August, 175 ton were discharged (maximum), while in February only 27 ton were discharged (the minimum). The CO2 emissions per ton of fish caught by month in October are 5.6 ton (maximum) and 3.4 ton in February (minimum). The average value is 4.6 ton, and the 2.2 ton difference was shown by subtracting the minimum emissions per t of fish from the maximum. The S.D. is 0.74 and the S.E. is 0.23. The maximum CO2 emission per million JPN of fish catch by month was 11.3 ton in May (maximum) and 6.5 ton in August (minimum). The average value is 8.5 ton, and the 4.8 ton difference was confirmed by subtracting the minimum emissions per million JPN from the maximum. The S.D. is 1.51 and the S.E. is 0.48. The statistics by both boat and month are described in Table 4.

4. Discussion

4.1. Verification of the CO2 Emissions of Small Trawlers

In this study, average emissions of the MF-Watari small trawlers were calculated to be 4.7 ton-CO2/t-product and 8.3 ton-CO2/million JPN. The main cause of CO2 discharge was fuel consumption. The validity of the results obtained was confirmed by comparing them with the results of other case study analyses and/or input-output table analyses.
Previous studies [5,11] quoted CO2 emissions of fishing boats similar to the MF-Watari small trawlers as follows: Danish Seine A (EU), 1.0 ton-CO2/ton-product; Danish Seine B (EU), 1.1 ton-CO2/ton-product; and Hokkaido offshore trawl fishing boats, 0.5 ton-CO2/ton-product. Moreover, in the same coastal fishery, the values for the squid-jigging fishery and gill-net fishery were reported to be 2.2 and 1.5 ton-CO2/ton-product, respectively. The MF-Watari small trawlers were classified in a category higher than these other boats because their emission value was 4.7 ton-CO2/ton-product. This difference was attributed to differences in fishing-boat size, fishing grounds, and fish stocks. Firstly, the Danish Seine fishing boats (EU) and the offshore trawl fishing boats of Hokkaido (Japan) do not operate in coastal areas (<10 km from land), but in offshore areas. Although the offshore fishing boats are larger, meaning that fuel consumption and CO2 emissions increase, they are much more effective in catching fish than coastal fishing boats. Therefore, the CO2 emissions of the small trawler fleet were higher than those of the Danish Seine (EU) and Hokkaido offshore trawl fishing boats. Moreover, within the same coastal fishery, gill net fishing is a passive fishing method that neither consumes fuel nor emits CO2 in quantities as large as for the small trawlers. Lastly, although fuel consumption and CO2 emissions are increased by the use of fish lamps used in the squid-jigging fishery, the squid catch is large. Thus, the latter two fishing methods exhibit a CO2 emission efficiency higher than that of the small trawlers. When the functional unit of comparison is mass, small trawler fishing appears detrimental to the environment compared to other fishing methods. However, a comparison among fishing methods using the monetary-based functional unit presents a slightly different perspective. Quoting from the squid report [11], emissions from squid-jigging fishing and offshore trawl fishing amounted to 14.4 ton-CO2/million JPN and 9.3 ton-CO2/million JPN, respectively. Thus, when the functional unit is monetary-based, small trawler fishing can be considered as having a lower environmental burden because, despite the small size of the catch, the price per unit is high. This case study indicates that the results obtained depend on the functional unit employed.
It was necessary to ensure the reliability of the data obtained during this research by comparing them with actual inventory data obtained from national fishery statistics. Therefore, we compared the inventory data from the input-output table for the primary food industries in Japan with our data. Figure 8 shows the results of the input-output table analysis for agriculture, forestry, and fishing industries in Japan for 2005 [28]. According to the data, the emissions from marine fisheries, which were 8.9 ton-CO2/million JPN, were much higher than those from rice, vegetables, and dairy farming. However, it should be noted that the results in the input-output table analysis are average values of the entire marine fishing industry. On the other hand, the cumulative CO2 emission per million JPN for the small trawler fishery was 8.3 ton-CO2/million JPN. A comparison with all marine products indicated that the average CO2 emission value for small trawler fishing was lower than that of the marine fisheries in the input-output table. Moreover, the main factor affecting CO2 emission was fuel consumption for both small trawler fishing and marine fisheries in general. Therefore, other factors were unlikely to affect these results, and these results were therefore judged appropriate.

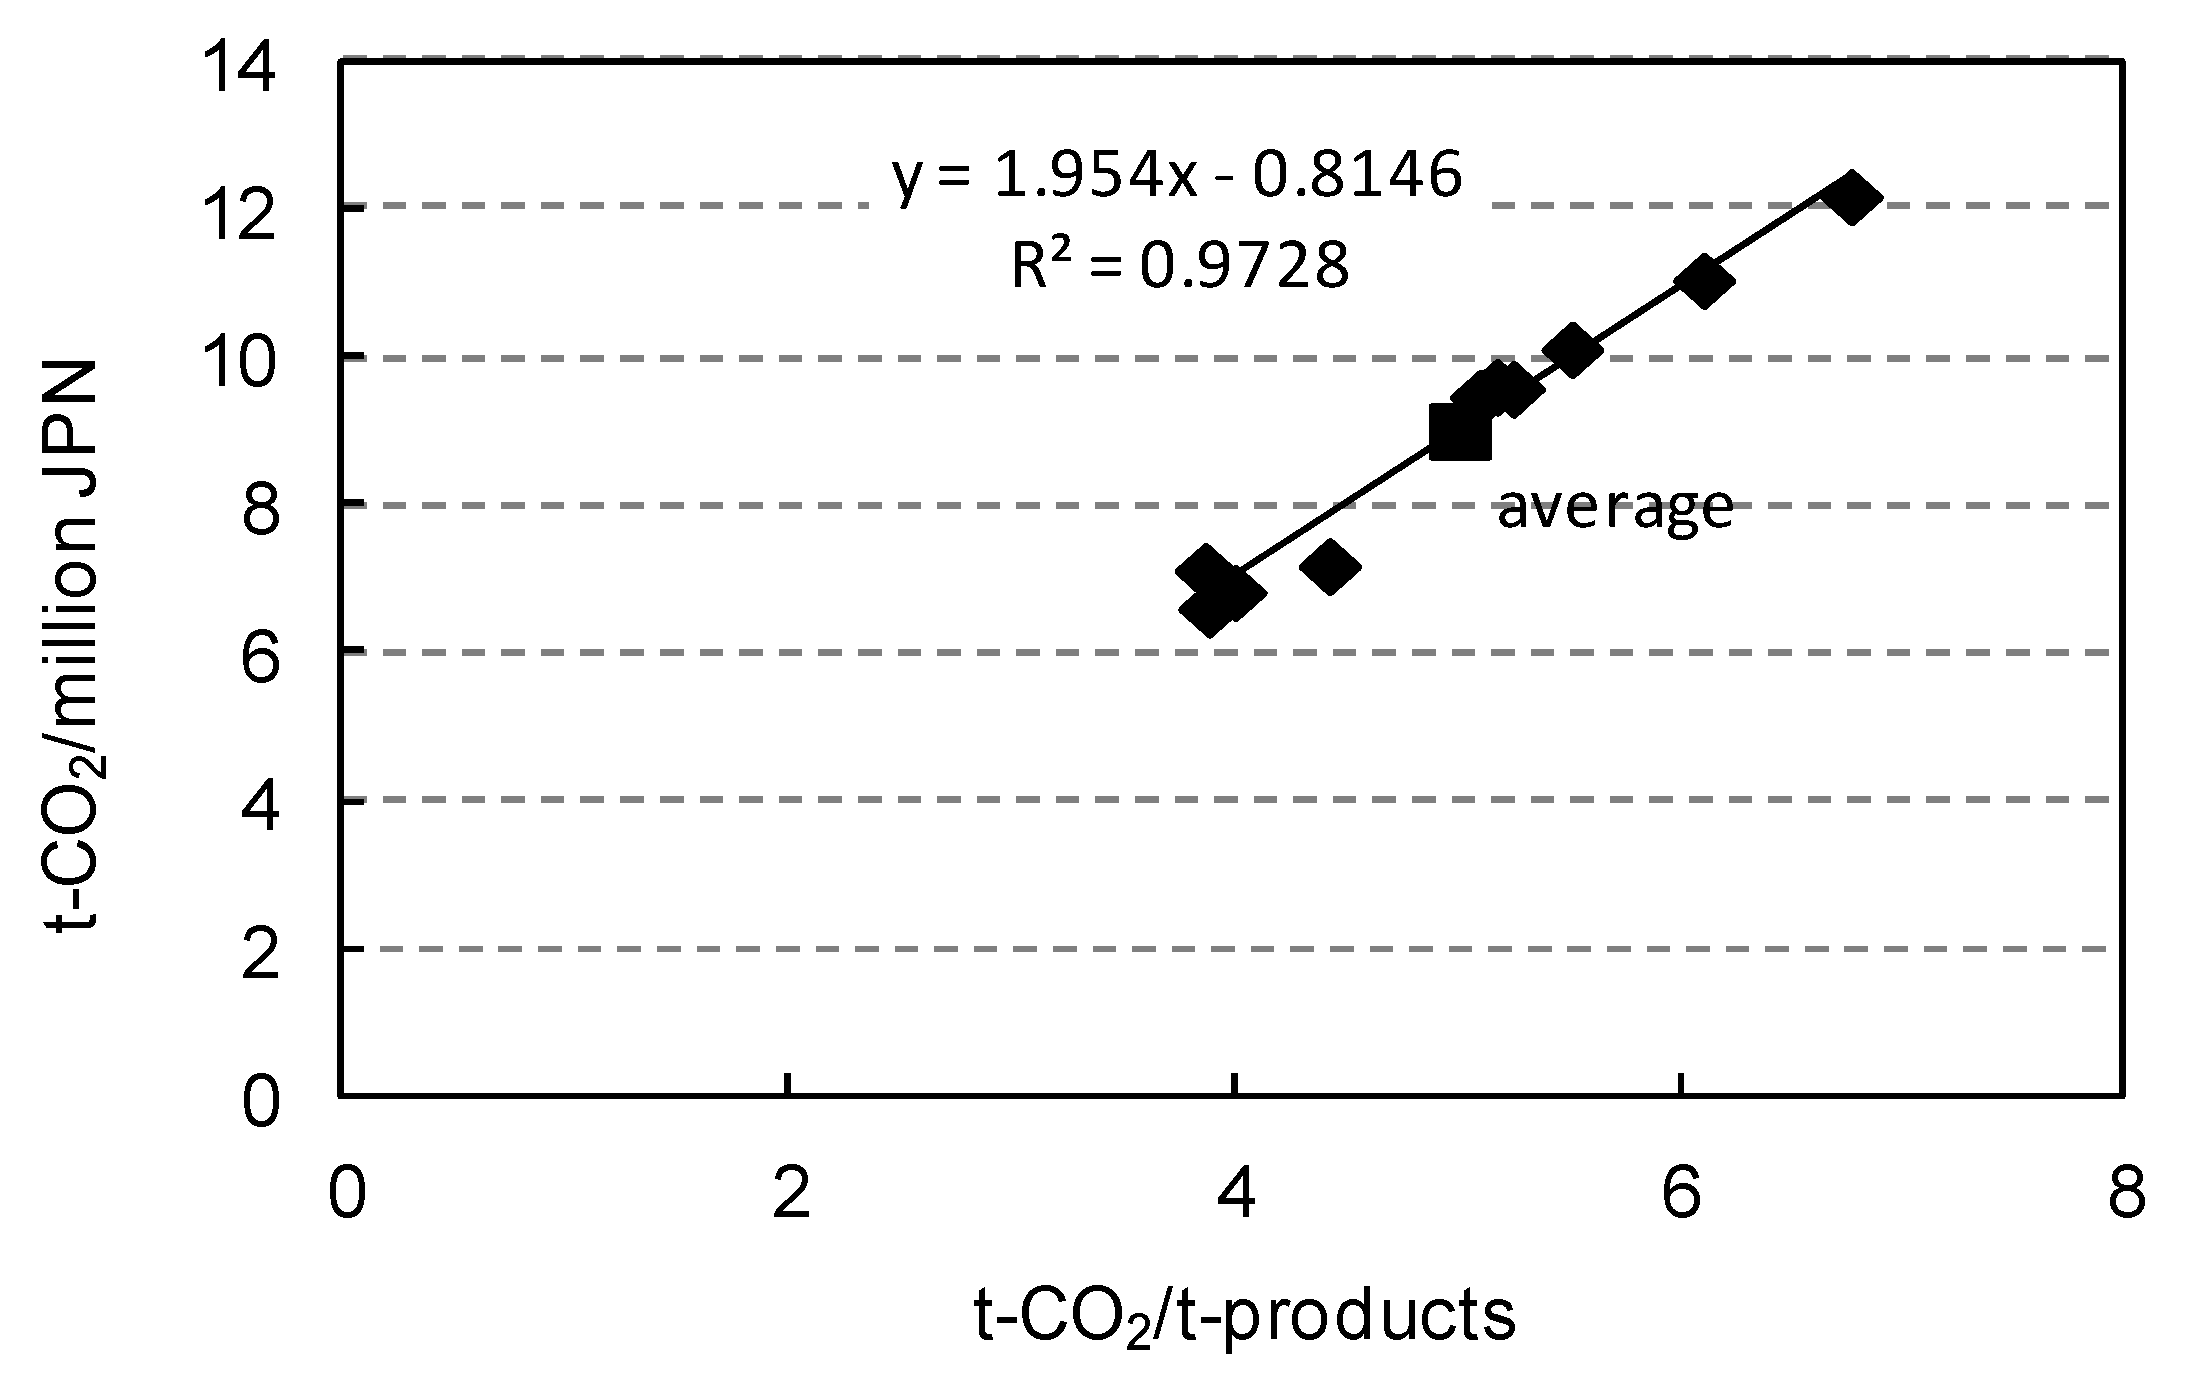
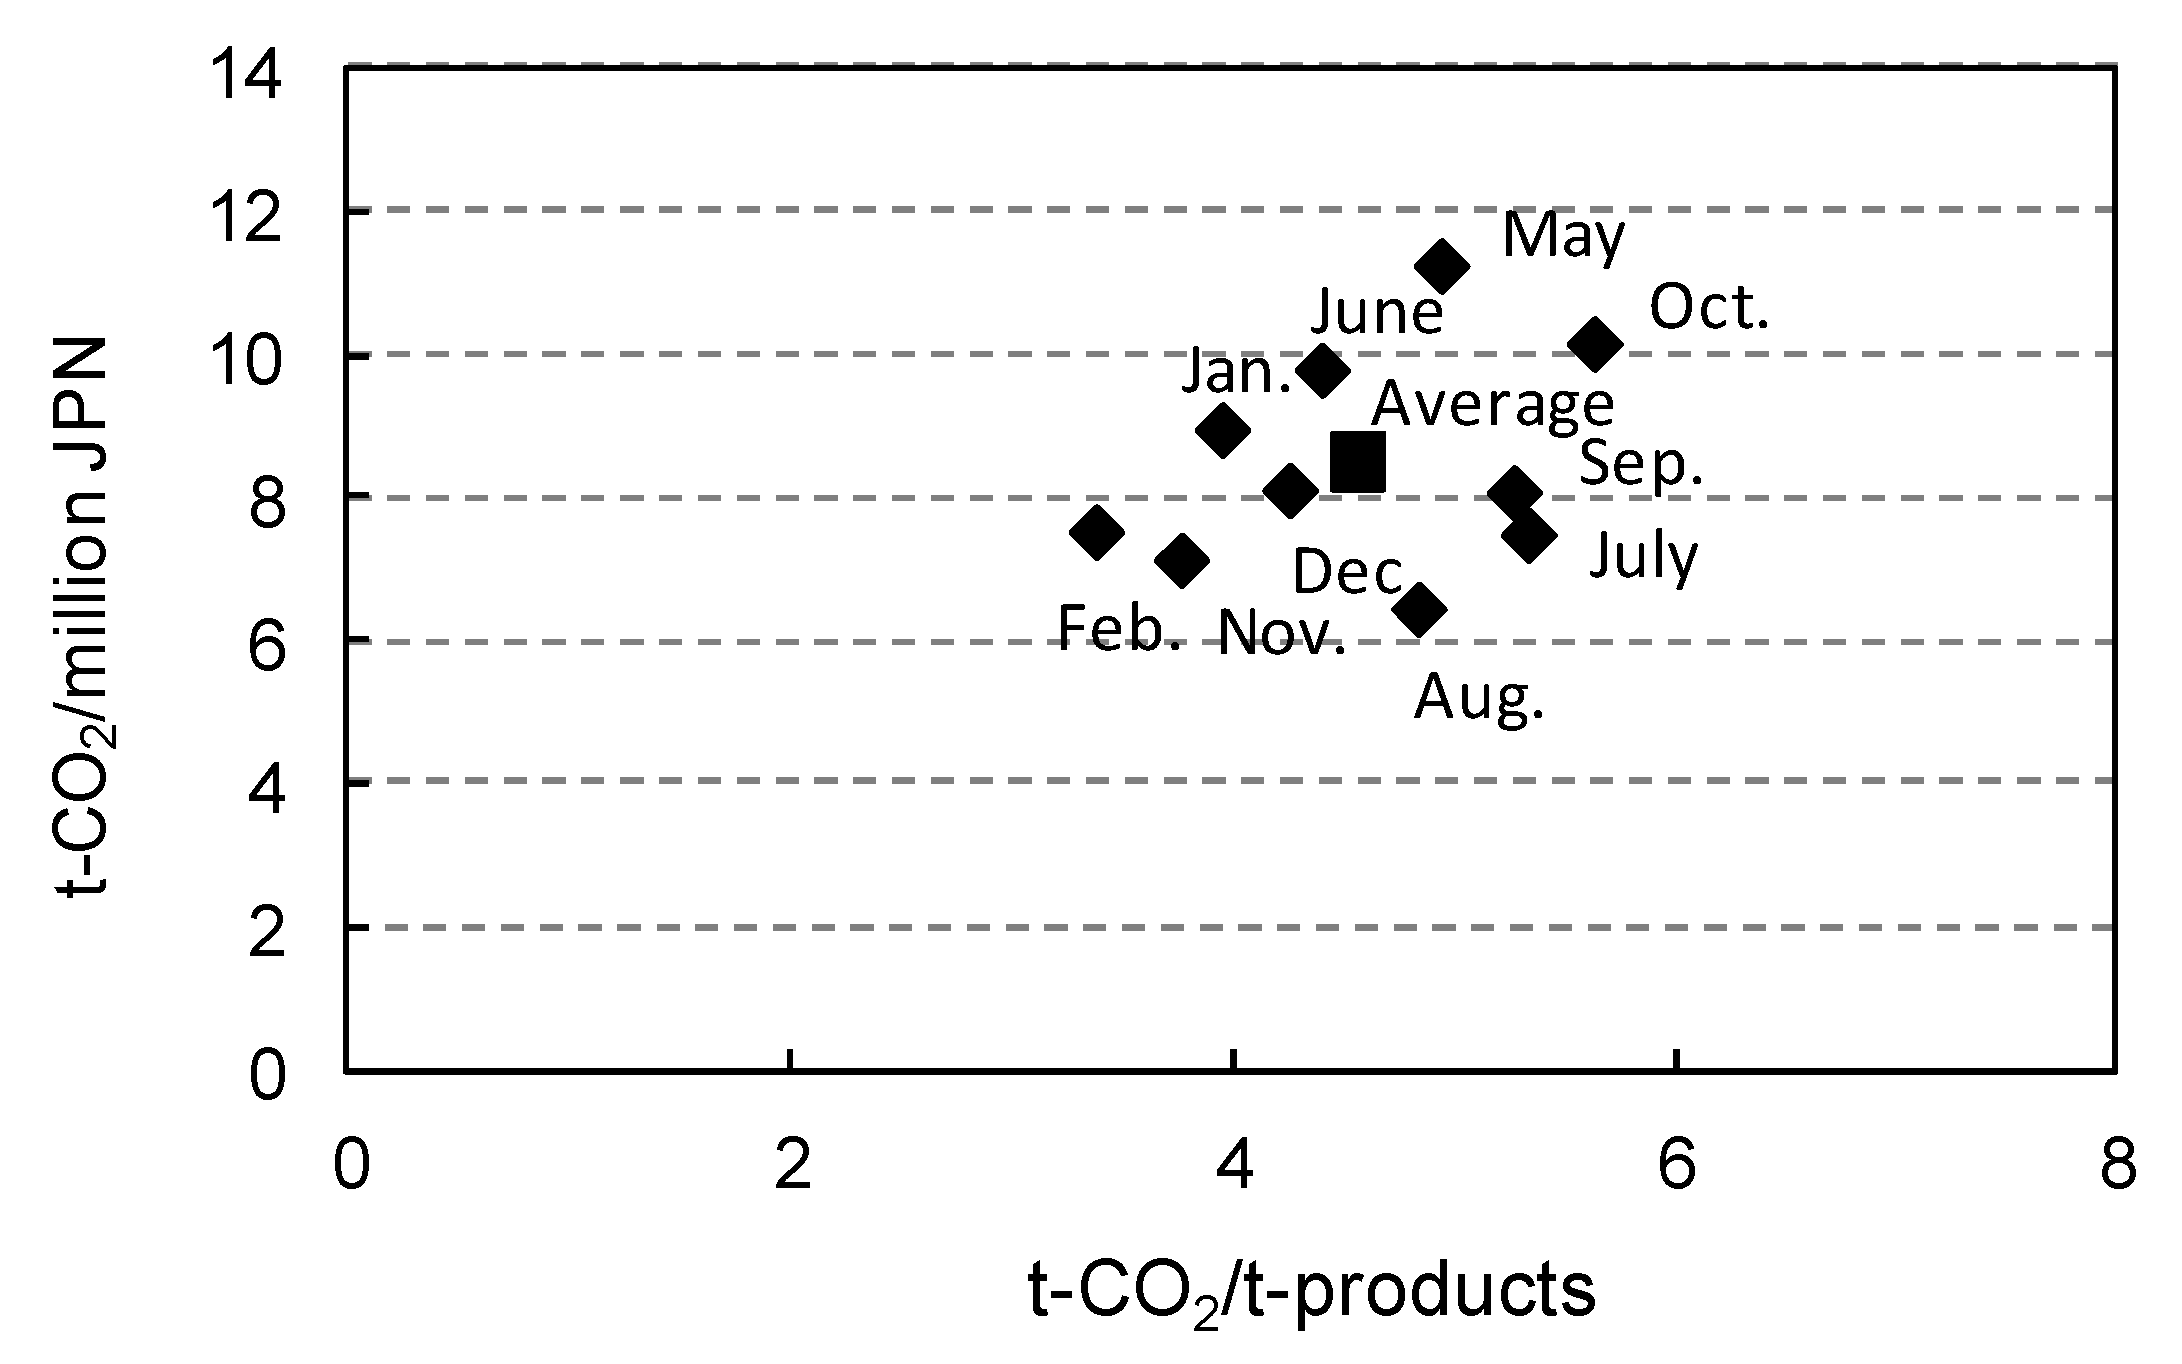
4.2. Consideration for Scatter of Basic Unit

Variations in CO2 emissions were observed for each boat and each month. Here, the scatter (variation) of the data was statistically analyzed in order to determine the range of fluctuation. Moreover, the authors discuss the relationship between two different functional units (mass and revenue).
The amount of CO2 discharged by small trawler A was twice that of other boats. This is because it sailed out on twice as many days as the other boats. The engine and fishing equipment of small trawler A were the newest; therefore, it could sail even in poor sea conditions. However, when the CO2 emissions were calculated per t of product or per million JPN earned, small trawler A had the lowest environmental impact of all the boats.
Next, the confidence interval for the scatter (variation) was calculated, including the error of having assumed that the CO2 emissions of the boats were normally distributed. Because the sample number was as small as 10, based on the t-distribution, the population mean value (μship, t) was calculated using the 95% (p = 0.05) confidence interval for each value of the number of specimen samples, sample average, and standard deviation. As a result, the population mean value of t-CO2 emissions per t-product was in the range of 4.3 < μship, t < 5.8. Moreover, the population mean value (μship, m) of t-CO2 emissions per million JPN was in the range of 7.5 < μship, m < 10.4. Thus, the variation on either side of the average values was found to be less than 20%.
Regarding monthly CO2 emissions, the confidence interval for the scatter (variation) was calculated similarly. Because it also had sample size as small as 10 (March and April were closed to fishing, thus fishing months = 10), based on the t-distribution, the population mean value was calculated using the 95% (p = 0.05) confidence interval for each value of the number of specimen samples, sample average, and standard deviation. As a result, the population mean value (μmonth, t) of t-CO2 emissions per t of product was in the range of 4.0 < μmonth, t < 5.1. Moreover, the population mean value (μmonth, m) of t-CO2 emissions per million JPN was in the range of 7.4 < μship, m < 9.6. Thus, the variation on either side of the average values was found to be less than 20%.
The relationship between a mass-based functional unit and a monetary-based functional unit was also considered. In Figure 9, the x-axis indicates t-CO2/t-product, and the y-axis indicates t-CO2/million JPN and the CO2 emissions of each small trawler are plotted. Changes in the evaluation criteria showed no significant effect on the CO2 emissions of each small trawler. The correspondence between the x and y axes was roughly one to one, and Y = 1.954X − 0.8146 (R2 = 0.97) was obtained as an approximate expression. Because the fishing grounds were the same, no small trawler boat showed a significant difference in the kind of fish caught or the unit price of fish. Therefore, CPUE was considered to relate to the CO2 emissions of the fish caught. In Figure 10, the CO2 emissions per million JPN are plotted according to month. The monthly data on CO2 emissions had a scattered form, and the choice of evaluation criteria influenced the result. For example, in August, the CO2 emissions per t of product were higher than average, but the CO2 emissions per million JPN were lower than average. Various factors influenced this result. The first to note is the low CO2 emissions in November and December. It is known that the flatfish spawning season lasts from November to December. The fish that reach the spawning grounds are larger than those caught in spring or summer. Furthermore, many kinds of flatfish in Sendai Bay put on fat from November. These factors make the flatfish attractive to consumers. Because the demand from consumers is strong, the product value is high; fishers can also work more efficiently when the fish are highly concentrated at the spawning grounds. As a result, CO2 emissions were lower than for other months. Compared with July or September, there were relatively low values of both t-CO2/t-product and t-CO2/million JPN in August. Special events, such as a summer festival and the Bon Festival, take place in August. In certain areas, it is customary to eat flatfish during these festivals, which leads to a rise in flatfish prices in August. It is thought that the results for August are a reflection of this custom. Thus there are two major seasons of consumption, one when the food species matures and the other regarding human events. This indicates that it is environmentally friendly to eat products seasonally. In addition, February showed a low value in mass for CO2 emissions. One reason is that stormy weather prevails in February, so there are fewer days available for fishing. Moreover, the unit prices were high at this time because some high-value catch species, such as squid and octopus, were among the species in the marine products. When evaluating the CO2 emissions related to a marine product, care must be taken to consider how that product is influenced by fish ecology, and by seasonal events or other monthly changes.

4.3. Fishery Management, Fish Resource Control, and Reducing the Environmental Burden

The CO2 emissions of the small trawler fishery were considered from the perspective of fishery management and/or fish resource control. In 2009, the costs of heavy oil, fish box/ice, labor, and charges by the fishery cooperative were 34%, 14%, 14%, and 13% of total expenditure, respectively, for small trawlers. The heavy oil that accounts for 34% of expenditure was also the cause of 97% of the entire CO2 emissions. Because the industrial structure of wild-capture fisheries is essentially equivalent to hunting, the trends in CO2 emissions differed from other primary food industries, such as farming. Therefore, it was shown that development of energy-saving technologies would contribute to a more environmentally friendly fishery system and better management of the small trawler fleet.
Thus, to minimize the CO2 emissions from small trawlers, energy saving is essential. Currently, economical navigation speeds and improvement in fishing gear are being promoted to improve the energy efficiency of small trawlers. Economical speed refers to energy saving by reducing navigation speed to 70%–80% of maximum speed. This results in a trade-off between energy saving and navigation time. Competition with rivals makes it important for fishers to reduce sailing time as much as possible. However, if a mechanism was in place whereby fishers could be assured a quota of fish catch, or access to fishing grounds, there would be no need to use excessive speeds to reach fishing grounds before other vessels. Sailing at economical navigation speeds can reduce energy consumption by 10%, which amounts to savings of almost 2 million JPN and a reduction of almost 98 ton in CO2. There is a need for coordinated discussions within the fishery to encourage the creation of such a rule. In addition, improvements to fishing equipment in the form of increasing the mesh size used by trawler nets and the development of weight-saving fishing gear have been suggested. These efforts aim to reduce energy consumption during fishing by lowering the resistance of the fishing gear to water. Increasing mesh size also helps to better manage fish resources. It is important that there is a premise that can maintain the current catch level. The development of improved fishing gear that does not reduce the catch level will be more acceptable to fishers. It is now proposed that economical sailing speeds and the technical development of weight-saving and low-water-resistance fishing gear are essential to reduce energy consumption in the small trawler fleet. The method of analysis used in this study would also be effective for evaluating the impact of introducing this new technology.
The control of fish resources and its effect on global warming potential were evaluated. Although the total fish catch (Figure 3) landed by MF-Watari was consistent with the recent downward trend in number of fishing boats, CPUE has recovered to a level comparable to that of the peak period. This means that fish resources have recovered due to fish resource controls such as proper use of fishing grounds, designation of no-fishing areas, and the release of small fish from the nets. It is important to maintain management systems that can sustain the continuous use of marine resources. Because the demand for fish is driven by the use of fish as a seasonal food and as traditional food at festivals, it is also important to consider the production system from the point of view of the consumer. In order to increase the value of the catch MF-Watari and the small trawler fishers should consider the marketing of their products and collaborate with the sales force of various companies to open new channels of sale. MF-Watari is also working to raise the commodity value of fish species for which catch is limited by adopting the strategy of keeping fish alive during shipment, though most fish caught by small trawl boats generally die. In fact, about 47% of the total fish catch in 2009 became live-fish landings. As a result, the average unit price of the MF-Watari fish was 541 JPN/kg, about twice as high as the national average (271 JPN/kg). Though the sector of marine fisheries was higher than other sectors of primary production in Japan when CO2 emissions per million JPN were estimated in an input-output table, CO2 emissions of small trawlers in MF-Watari were estimated to be lower value (see Table 2; 8.3 ton-CO2/million JPN) than the Japanese average (see Figure 8; 8.9 ton-CO2/million JPN). Although it does not lead to direct reduction of CO2, improvement in the value of goods contributes to improvement of eco-efficiency. As a future strategy for small trawlers, the following points are important. First, it is critical to maintain a fish-resource control system, and to aim for continuous fishing. Appropriate resource management is the foundation of small trawler fishing. Second, it is very helpful to add value to the fish caught by increasing the percentage of live fish in MF-Watari, thereby increasing profit. Third, reducing environmental impact by minimizing CO2 emissions through adopting economical speed and improving fishing gear should be added as an aim. By creating a mechanism for transmitting initiatives such as eco-labeling to consumers, the authors think it is desirable to implement a system in the future in which consumers can select a sustainable fishery. It is thought that, by fulfilling these three conditions, a new form of sustainable small trawler fishing can be created.

5. Conclusions

In this research, the CO2 emissions of small trawlers were quantified by constructing LCI data for which no prior analysis has been performed in Japan. Moreover, this study showed the range of fluctuation of the functional units, which was not clear before. Furthermore, in keeping with LCI methodology for fisheries, it mentioned the system boundaries and the functional units for the allocation of caught fish. Finally, it indicates the direction of the efforts required to achieve sustainability and reduce the environmental impact of small trawler fishing. This article deals mainly with global warming potential, but it is obvious that there are many other important issues at stake. Future work should consider the association between LCA-evaluated techniques and marine-ecosystem management.

Acknowledgments

The authors hereby express appreciation for the cooperation of Isamu Hashimoto of the Miyagi Fishermen’s Cooperative Association, Watari Branch Office, in the collection of data. The actual operation of the small trawler was taught by Kunio Shirai, captain of Kouhou-maru, and Kenji-Shirai, captain of Seikou-maru, in their ships. The authors also received support from people concerned with the Miyagi Fishermen’s Cooperative Association, Watari Branch Office. The authors would like to thank Editage (www.editage.jp) for English language editing.

Author Contributions

Kiyotaka Tahara directed the research. Kazuhito Watanabe undertook the field research and developed the inventory data. The first draft of this article was written by Kazuhito Watanabe and subsequently revised by Kiyotaka Tahara.

Conflicts of Interest

The authors declare no conflict of interest.

References

  1. Statistics Department of Ministry of Agriculture Forestry and Fisheries. Statistics Report on Production of Fisheries and Aquaculture 2008; Association of Agriculture and Forestry Statistics: Tokyo, Japan, 2010; p. 53. [Google Scholar]
  2. ISO 14040: Environmental Management—Life Cycle Assessment—Principles and Framework (ISO 14040:2006); International Standards Organization: Geneva, Switzerland, 2006; pp. 1–20.
  3. ISO 14044: Environmental Management—Life Cycle Assessment—Requirements and Guidelines (ISO 14044:2006); International Standards Organization: Geneva, Switzerland, 2006; pp. 1–46.
  4. Ziegler, F.; Hansson, P.-A. Emissions from fuel combustion in Swedish cod fishery. J. Clean. Prod. 2003, 11, 303–314. [Google Scholar] [CrossRef]
  5. Ziegler, F.; Nilsson, P.; Mattsson, B.; Walther, Y. Life Cycle Assessment of Frozen Cod Fillets Including Fishery-Specific Environmental Impacts. Int. J. Life Cycle Assess. 2003, 8, 39–47. [Google Scholar]
  6. Thrane, M. Energy Consumption in the Danish Fishery: Identification of Key Factors. J. Ind. Ecol. 2004, 8, 223–239. [Google Scholar] [CrossRef]
  7. Thrane, M. LCA of Danish Fish Products. New Methods and Insights. Int. J. Life Cycle Assess. 2006, 11, 66–74. [Google Scholar] [CrossRef]
  8. Minami, W.; Yasui, K.; Nakano, K.; Kim, H.-J. Life Cycle Inventory of Air Pollutants for Consumption of Tuna. Nippon Suisan Gakk. 2004, 70, 548–554. [Google Scholar] [CrossRef]
  9. Hospido, A.; Tyedmers, P. Life cycle environmental impacts of Spanish tuna fisheries. Fish. Res. 2005, 76, 174–186. [Google Scholar] [CrossRef]
  10. Hospido, A.; Vazquez, M.E.; Cuevas, A.; Feijoo, G.; Moreira, M.T. Environmental assessment of canned tuna manufacture with a life-cycle perspective. Resour. Conserv. Recycl. 2006, 47, 56–72. [Google Scholar] [CrossRef]
  11. Ando, T.; Hasegawa, K. Estimating the “Life Cycle CO2 (LC-CO2)” of Canned Mackerel (Scomber spp.) and its Potential as an Environmental Education Tool. A Case Study (2008) at Choshi City, Chiba Prefecture. J. Fish. Technol. 2011, 3, 99–105. [Google Scholar]
  12. Watanabe, K.; Tahara, K.; Fujimori, Y.; Shimizu, S.; Miura, T. Life Cycle Inventory of Environmental Burden on Squid Fisheries. Environ. Sci. 2006, 19, 15–24. [Google Scholar]
  13. Vázquez-Rowe, I.; Moreira, M.T.; Feijoo, G. Life cycle assessment of horse mackerel fisheries in Galicia (NW Spain): Comparative analysis of two major fishing methods. Fish. Res. 2010, 106, 517–527. [Google Scholar] [CrossRef]
  14. Vázquez-Rowe, I.; Moreira, M.T.; Feijoo, G. Life Cycle Assessment of fresh hake fillets captured by the Galician fleet in the Northern Stock. Fish. Res. 2011, 110, 128–135. [Google Scholar] [CrossRef]
  15. Schau, E.M.; Ellingsen, H.; Endal, A.; Aanondsen, S.A. Energy consumption in the Norwegian fisheries. J. Clean. Prod. 2009, 17, 325–334. [Google Scholar] [CrossRef] [Green Version]
  16. Ellingsen, H.; Olaussen, J.O.; Utne, I.B. Environmental analysis of the Norwegian fishery and aquaculture industry—A preliminary study focusing on farmed salmon. Mar. Policy 2009, 33, 479–488. [Google Scholar] [CrossRef]
  17. Driscoll, J.; Tyedmers, P. Fuel use and greenhouse gas emission implications of fisheries management: The case of the New England Atlantic herring fishery. Mar. Policy 2010, 34, 353–359. [Google Scholar] [CrossRef]
  18. Fréon, P.; Avadí, A.; Vinatea Chavez, R.A.; Iriarte Ahón, F. Life cycle assessment of the Peruvian industrial anchoveta fleet: Boundary setting in life cycle inventory analyses of complex and plural means of production. Int. J. Life Cycle Assess. 2014, 19, 1068–1086. [Google Scholar] [CrossRef]
  19. Iribarren, D.; Moreira, M.T.; Feijoo, G. Revisiting the Life Cycle Assessment of mussels from a sectorial perspective. J. Clean. Prod. 2010, 18, 101–111. [Google Scholar] [CrossRef]
  20. Watanabe, K. LCI Analysis of Non-Feeding Aquaculture for Scallop, Sea Tangle and Brown Seaweed. In Proceedings of the 25th Conference on Environmental Information Science, Utrecht, The Netherlands, 18–21 April 2011; pp. 1–6.
  21. Ayer, N.W.; Tyedmers, P.H. Assessing alternative aquaculture technologies: Life cycle assessment of salmonid culture systems in Canada. J. Clean. Prod. 2009, 17, 362–373. [Google Scholar] [CrossRef]
  22. McGrath, K.P.; Pelletier, N.L.; Tyedmers, P.H. Life Cycle Assessment of a Novel Closed-Containment Salmon Aquaculture Technology. Environ. Sci. Technol. 2015, 49, 5628–5636. [Google Scholar] [CrossRef] [PubMed]
  23. Cao, L.; Diana, J.S.; Keoleian, G.A.; Lai, Q. Life Cycle Assessment of Chinese Shrimp Farming Systems Targeted for Export and Domestic Sales. Environ. Sci. Technol. 2011, 45, 6531–6538. [Google Scholar] [CrossRef] [PubMed]
  24. Parker, R.W.R.; Tyedmers, P.H. Uncertainty and natural variability in the ecological footprint of fisheries: A case study of reduction fisheries for meal and oil. Ecol. Indic. 2012, 16, 76–83. [Google Scholar] [CrossRef]
  25. Ayer, N.W.; Tyedmers, P.H.; Pelletier, N.L.; Sonesson, U.; Scholz, A. Co-product allocation in life cycle assessments of seafood production systems: Review of problems and strategies. Int. J. Life Cycle Assess. 2007, 12, 480–487. [Google Scholar] [CrossRef]
  26. Parker, P. Review of Life Cycle Assessment Research on Products Derived from Fisheries and Aquaculture—A Report for Seafish as Part of the Collective Action to Address Greenhouse Gas Emissions in Seafood. Available online: http://www.seafish.org/media/583639/seafish_lca_review_report_final.pdf (accessed on 11 April 2016).
  27. Kihara, T.; Kameyama, M.; Hiraoka, K.; Senda, T.; Naruse, T.; Shirota, H.; Sakurai, A.; Fukumoto, M. Study for the Application of LCA to ship. Natl. Marit. Res. Insti. Rep. 2002, 2, 35–185. [Google Scholar]
  28. Keisuke, N.; Yasushi, K.; Shigemi, K.; Sangwon, S.; Kenichi, N.; Rokuta, I.; Susumu, T. Estimates of Embodied Global Energy and Air-Emission Intensities of Japanese Products for Building a Japanese Input-Output Life Cycle Assessment Database with a Global System Boundary. Environ. Sci. Technol. 2012, 46, 9146–9154. [Google Scholar]
Figure 1. Location of Miyagi Fishermen’s Cooperative Association, Watari (MF-Watari) office and Sendai Bay.
Sustainability 08 00399 g001
Figure 2. System boundaries of this research.
Sustainability 08 00399 g002
Figure 3. Fish catch statistics of the small trawlers of the Watari Fishermen’s Cooperative Association.
Sustainability 08 00399 g003
Figure 4. Schematic flow of small trawler fishery in 2009.
Sustainability 08 00399 g004
Figure 5. Causes of CO2 emission.
Sustainability 08 00399 g005
Figure 6. CO2 emissions of each boat in the small trawler fishery.
Sustainability 08 00399 g006
Figure 7. Monthly variation of CO2 emissions.
Sustainability 08 00399 g007
Figure 8. Input-output table analysis of CO2 for the primary food industries in Japan (2005).
Sustainability 08 00399 g008
Figure 9. Evaluation criteria (mass or monetary) and CO2 emissions of each small trawler.
Sustainability 08 00399 g009
Figure 10. Evaluation criteria (mass or monetary) and monthly CO2 emissions.
Sustainability 08 00399 g010
Table 1. CO2 intensity of each item used for calculation of CO2 emissions.
Item〔UNIT〕〔kg-CO2/UNIT〕
BoatFishing Boatboat41,800.0
Fishing GearFishing Netskg0.8
Trawl Linekg1.4
Ground ropekg1.5
Net Floatpiece4.2
Otter Boardpiece400.0
Net Weightpiece0.6
Fishing Gear Accessorykg1.6
Fuel OilHeavy OilL3.0
Fish Box and IceFish Boxkg1.95
Icet60.0
Table 2. CO2 emissions of small trawlers.
CO2 Emission
Small Scale Trawl Fishery (10 fishing boats)Total1001.6ton
/ton-product4.7ton
/million JPN8.3ton
Table 3. CO2 emission of fish species caught per kg by allocation.
Fish Name (Scientific Name)Mass AllocationMonetary Allocation
Olive flounder (Paralichthys olivaceus)4.75.5
Marbled sole (Pleuronectes yokohamae)4.75.0
Brown sole (Pseudopleuronectes herzensteini)4.75.2
Stone flounder (Kareius bicoloratus)4.75.2
Others4.73.2
Unit: kg-CO2/kg-product.
Table 4. CO2 emission statistics analyzed by boat and month.
NameUnitNSample AverageMaximum valueMinimum valueStandard DeviationStandard Error
Each fishing boatt-CO2/t-products105.06.83.90.980.31
t-CO2/million JPN109.012.26.61.930.61
Each montht-CO2/t-products104.65.63.40.740.23
t-CO2/million JPN108.511.36.51.510.48

