Article

Analysis of the Influencing Factors of the Public Willingness to Participate in Public Bicycle Projects and Intervention Strategies—A Case Study of Jiangsu Province, China

School of Managemant, China University of Mining and Technology, Da Xue Road 1, Xuzhou 221116, China
*
Author to whom correspondence should be addressed.
Sustainability 2016, 8(4), 349; https://doi.org/10.3390/su8040349
Submission received: 13 February 2016 / Revised: 28 March 2016 / Accepted: 31 March 2016 / Published: 9 April 2016

Abstract

:
In this study, factors influencing the willingness to participate in public bicycle projects were analyzed using the binary logistic model. The study builds on a broad and practical conceptual framework that embraces four dimensions of influencing factors, including household demographic, psychological, external, and public bicycle variables. The empirical results are based on a questionnaire survey that was sent to 520 urban residents in Xuzhou, Taizhou, and Suzhou in Jiangsu province. The survey indicates that environmental responsibility, improvement of the public transport system, health and safety considerations in relation to public bicycles, and environmental crisis consciousness have appreciable impacts upon the willingness to participation in public bicycle projects. The first three of these have a positive impact, whereas the last (environmental crisis consciousness) has a negative impact. Consequently, some policy suggestions are proposed.

1. Introduction

With the rapid development of urbanization and motorization, pressures from urban road traffic in China are growing in intensity, and traffic congestion and air pollution are becoming prominent issues. Urban traffic in major Chinese cities in 2014 shows the congestion delay index of some Hyper-megalopolis and large cities is greater than 2 [1]. That is, the public spends more than twice the time expected in the non-congested state to reach the destination. The report indicates that the congestion of some second-tier cities is even more serious than first-tier cities because the business centers in second-tier cities are relatively concentrated and the public transit facilities are not perfect. The key factor of urban air pollution is automobile emissions or exhaust. Based on the 2013 IEA (International Energy Agency) report, CO2 emissions from the transport sector account for 23% of total CO2 emissions from fuel combustion in the world, and the road transport sector accounts for 75% of all transport sectors. In China, the road transport sector accounts for 81% of CO2 emissions from all transport sectors [2]. The apparently hazy weather conditions are a direct manifestation of the urban air pollution problem. The most serious hazy weather for 52 years occurred in 2013. The 2013 haze affected 25 provinces and more than 100 large-medium cities, and, on average, was present for 29.9 days [3]. In 2014, long period, large range, heavy pollution haze occurred in February, and again in October. The Beijing-Tianjin-Hebei region was the worst affected in 2014, with 209 days that did not reach the urban air quality standard [4]. Against this background, the Chinese government explicitly states that green travel must be enforced to achieve energy saving and emission reduction. As a low-carbon, environmental friendly, flexible, and green mode of transportation, public bicycles have been promoted and developed rapidly in many large-medium Chinese cities.
Similar to bus, subway, and other rail transit systems, public bicycles are a component of the urban public transit system, and are managed and operated by the government or private enterprises. The concept of the public bicycle originated in Europe, and so far has spread to 712 cities in the world according to the data collected by Sustainable Transport Research Center of University of California, Berkeley [5]. China established the first public bicycle system in Hangzhou, Wuhan, Shanghai, and other cities in 2008. There are now more than 100 cities and regions with a public bicycle system, making China’s public bicycle uptake the largest in the world [6]. Although Chinese public bicycle schemes started relatively late, the quantity of public bicycles has exceeded the sum of the number of the other countries in the world [7]. Jiangsu province is very populated and wealthy; public bicycle projects are currently running successfully in all 13 cities in this province [8], so we chose Jiangsu province as our research subject.
As a measure to alleviate urban traffic congestion and improve city air quality, the key to the effectiveness of the public bicycle project is the urban residents’ participation. Thus, it is essential to understand the willingness of urban residents to participate in the public bicycle project. The major focus of this article is the influencing factors for public participation in the public bicycle project, and intervention strategies to increase the public willingness to participate.

2. Literature Review

The use of public bicycles has quickly expanded, although as a newly-developing mode of transportation its related theory and research is still in the early stages and largely focuses on site planning and scheduling, changes to and influence of transportation mode, analysis of the operation model, evaluating user satisfaction, and the characteristics of public bicycle users. For example, in terms of site planning, Fishman et al. [9] quantified the barriers to the public bicycle system usage in Australia, and showed that the most influential barriers were motorized travel being too convenient and public bicycle sites not being sufficiently close to frequented destinations. Consequently, they recommended that public bicycle stations should be extended and optimally designed. Utilizing a hub location inventory model, Lin et al. [10] addressed the strategic design problem for bicycle sharing systems. Their key design decisions considered were the quantity and locations of public bicycle sites, the creation of bicycle lanes between public bicycle sites, the selection of paths of users between origins and destinations, and the inventory levels of public bicycles at the bicycle stations. In terms of scheduling, Nakamura and Abe [11] evaluated the operational effect of the public bicycle projects in different cities with various numbers of stop stations. Dell’Amico et al. [12], Regue and Recker [13], Ho and Szeto [14], and Forma et al. [15] discussed how to achieve balance and static positioning of the public bicycle system, and how to minimize total cost while maximizing convenience for the users. To achieve optimal scheduling of bicycles between different public bicycle stations, Liu et al. [16] applied dynamic programming to calculate optimal scheduling paths for two stages: collection and rent out. In terms of both the changes to and influence of the transportation mode, reports released from several related research institutes in Dublin [17], London [18], and Washington [19] showed that the substitution rate of public bicycles for public transport and walking was relatively high, but for car was relatively low. Using relevant data from public bicycle systems of five cities in America, Great Britain, and Australia, Fishman et al. [20] counted the substitution rates of public bicycles for existing modes of transportation, and showed the substitution rates were public bicycles, walking, cars, private bicycles, and taxis, in descending order. In terms of an analysis of the operation model, Zhang et al. [21] discussed and analyzed the commonality and uniqueness of the development history, operational model, quantity of bicycles and stations, and the usage rate of the public bicycle systems of Beijing, Hangzhou, Shanghai, Wuhan, and Zhuzhou in China. They provided recommendations for optimizing the design and service of the public bicycle projects. Liu et al. [22] analyzed the major operational problems of the public bicycle system of Beijing, including unreasonable station planning and usage charges, security issues, imperfect supporting facilities, and unclear policy directions. Incorporating their outcomes, and other countries’ experience, a new public bicycle project execution plan was proposed. In recent years, Chinese domestic scholars have begun to consider user satisfaction of the public bicycle system. For example, Liu et al. [23] and Cui [24] evaluated the user satisfaction of the public bicycle system of Wuhan using factorial analysis and the combination of factorial analysis and multiple regression models, respectively. Qian et al. [25] structured a comprehensive evaluation index system on the development of the public bicycle system in four dimensions: user service, service station efficiency, urban construction, and socioeconomic performance. In terms of the characteristics of public bicycle users, Fishman et al. [26] quantized the key characteristics of members of two public bicycle projects in Australia, and used the logistic model to show that respondents aged 18–34, respondents with relatively high incomes, and public bicycle stations within 250 m of the workplace were statistically significant predictors of membership of the public bike project. LDA Consulting [19] investigated the configuration of public bicycle users in Washington, and showed that public bicycle users were more likely male, generally had relatively high employment rates, relatively high educational backgrounds, and relatively low average ages. Fuller et al. [27] made a telephone survey of 2502 adults in Montreal, and concluded that significant correlates of public bicycle use were a docking station within 250 m of home, and users who were 18–24 years of age, university educated, on work leave, and using cycling as the primary mode of transportation to work. The result of the survey of Castillo-Manzano et al. [28] showed that 41% of users of public bicycle sharing systems declare that they alternate the use of public bicycles with the use of their own privately-owned bicycles.
The influencing factors of the public willingness to participate in public bicycle projects have received relatively less attention, and apparently no related research. As a newly-developing mode of transportation, the public bicycle is a type of cycling trip. Heinen et al. [29] reviewed numerous articles addressing influencing factors for cycling trips, and summarized the major factors as follows: urban format; infrastructure of the cycling trip; design of the stop stations; situation of the public bicycle project; social norms; trip cost; trip security; legal protection of the riders; ownership of the bicycles and cars; frequency of the trips; individual environmental beliefs, attitudes and habits, gender, age, income, educational level, occupation, status, and family structure.
Since it is a low-carbon mode of transportation, the use of a public bicycle can be interpreted as an environmental behavior. That is, the public bicycle mode of transportation is a conscious behavior, based on the individual’s accountability and values, undertaken to avoid or alleviate environmental problems [30]. There is an existing significant body of research regarding major influencing factors for environmental behavior. Steg and Vlek [31], Bodur and Sarigollu [32] argued that environmental sensitivity was the major factor of environmental behavior, whereas Stern [33] and Tanner and Kast [32] argued that environmental responsibility was the effective predictive variable of environmental behavior. Furthermore, Tanner and Kast [34] showed that environmental behavior largely depends on the moral norms of the citizens themselves. Hines et al. [30] and Fransson and Garling [35] found that people with internal control views were more likely to implement environmental behavior than those with external control views, the reason being that people with internal control views believe they have impact on the environment whereas those with external control views believe the opposite. Scott et al. [36] suggested that one’s individual social circle has an important impact on one’s individual environmental behavior (i.e., social responsibility norms affect environmental behavior). These factors are largely psychological variables. However, situational factors also have been shown to be significant influences on environmental behavior. Since the congestion of a city’s public transportation usually occurs during the peak hours, Fishman et al. [37] found that the public bicycle system could be an effective way to alleviate traffic jams. Shaheen et al. [38] and Alta Bike Share [39] showed that the ease of use of a public bicycle was identified as an important factor for the public bicycle system use. The survey of Chinese scholars Tang et al. [40] identified the economy as one of the main influences of public bicycle usage, and those who considered that the use of public bicycles was easier than private bicycles accounted for 60%–70% of all respondents. Researching the public bicycle system in Brisbane, Fishman et al. [41] concluded that safety factors were the main barriers for the public bicycle system, which decreased the attraction of the public bicycle system to some degree. The safety factors they suggested included mandatory helmet legislation, the poor road awareness of riders, and imperfect cycling facilities.
The purpose of this paper is to provide insights into the factors influencing urban residents’ willingness to participate in the public bicycle project. Section 2 presents a conceptual framework and correlational hypotheses. In Section 3, the analysis method, survey design, and experimental procedures are presented. In Section 4, analysis results are presented and discussed, and Section 5 presents the conclusions and policy implications.

3. Conceptual Framework and Hypotheses

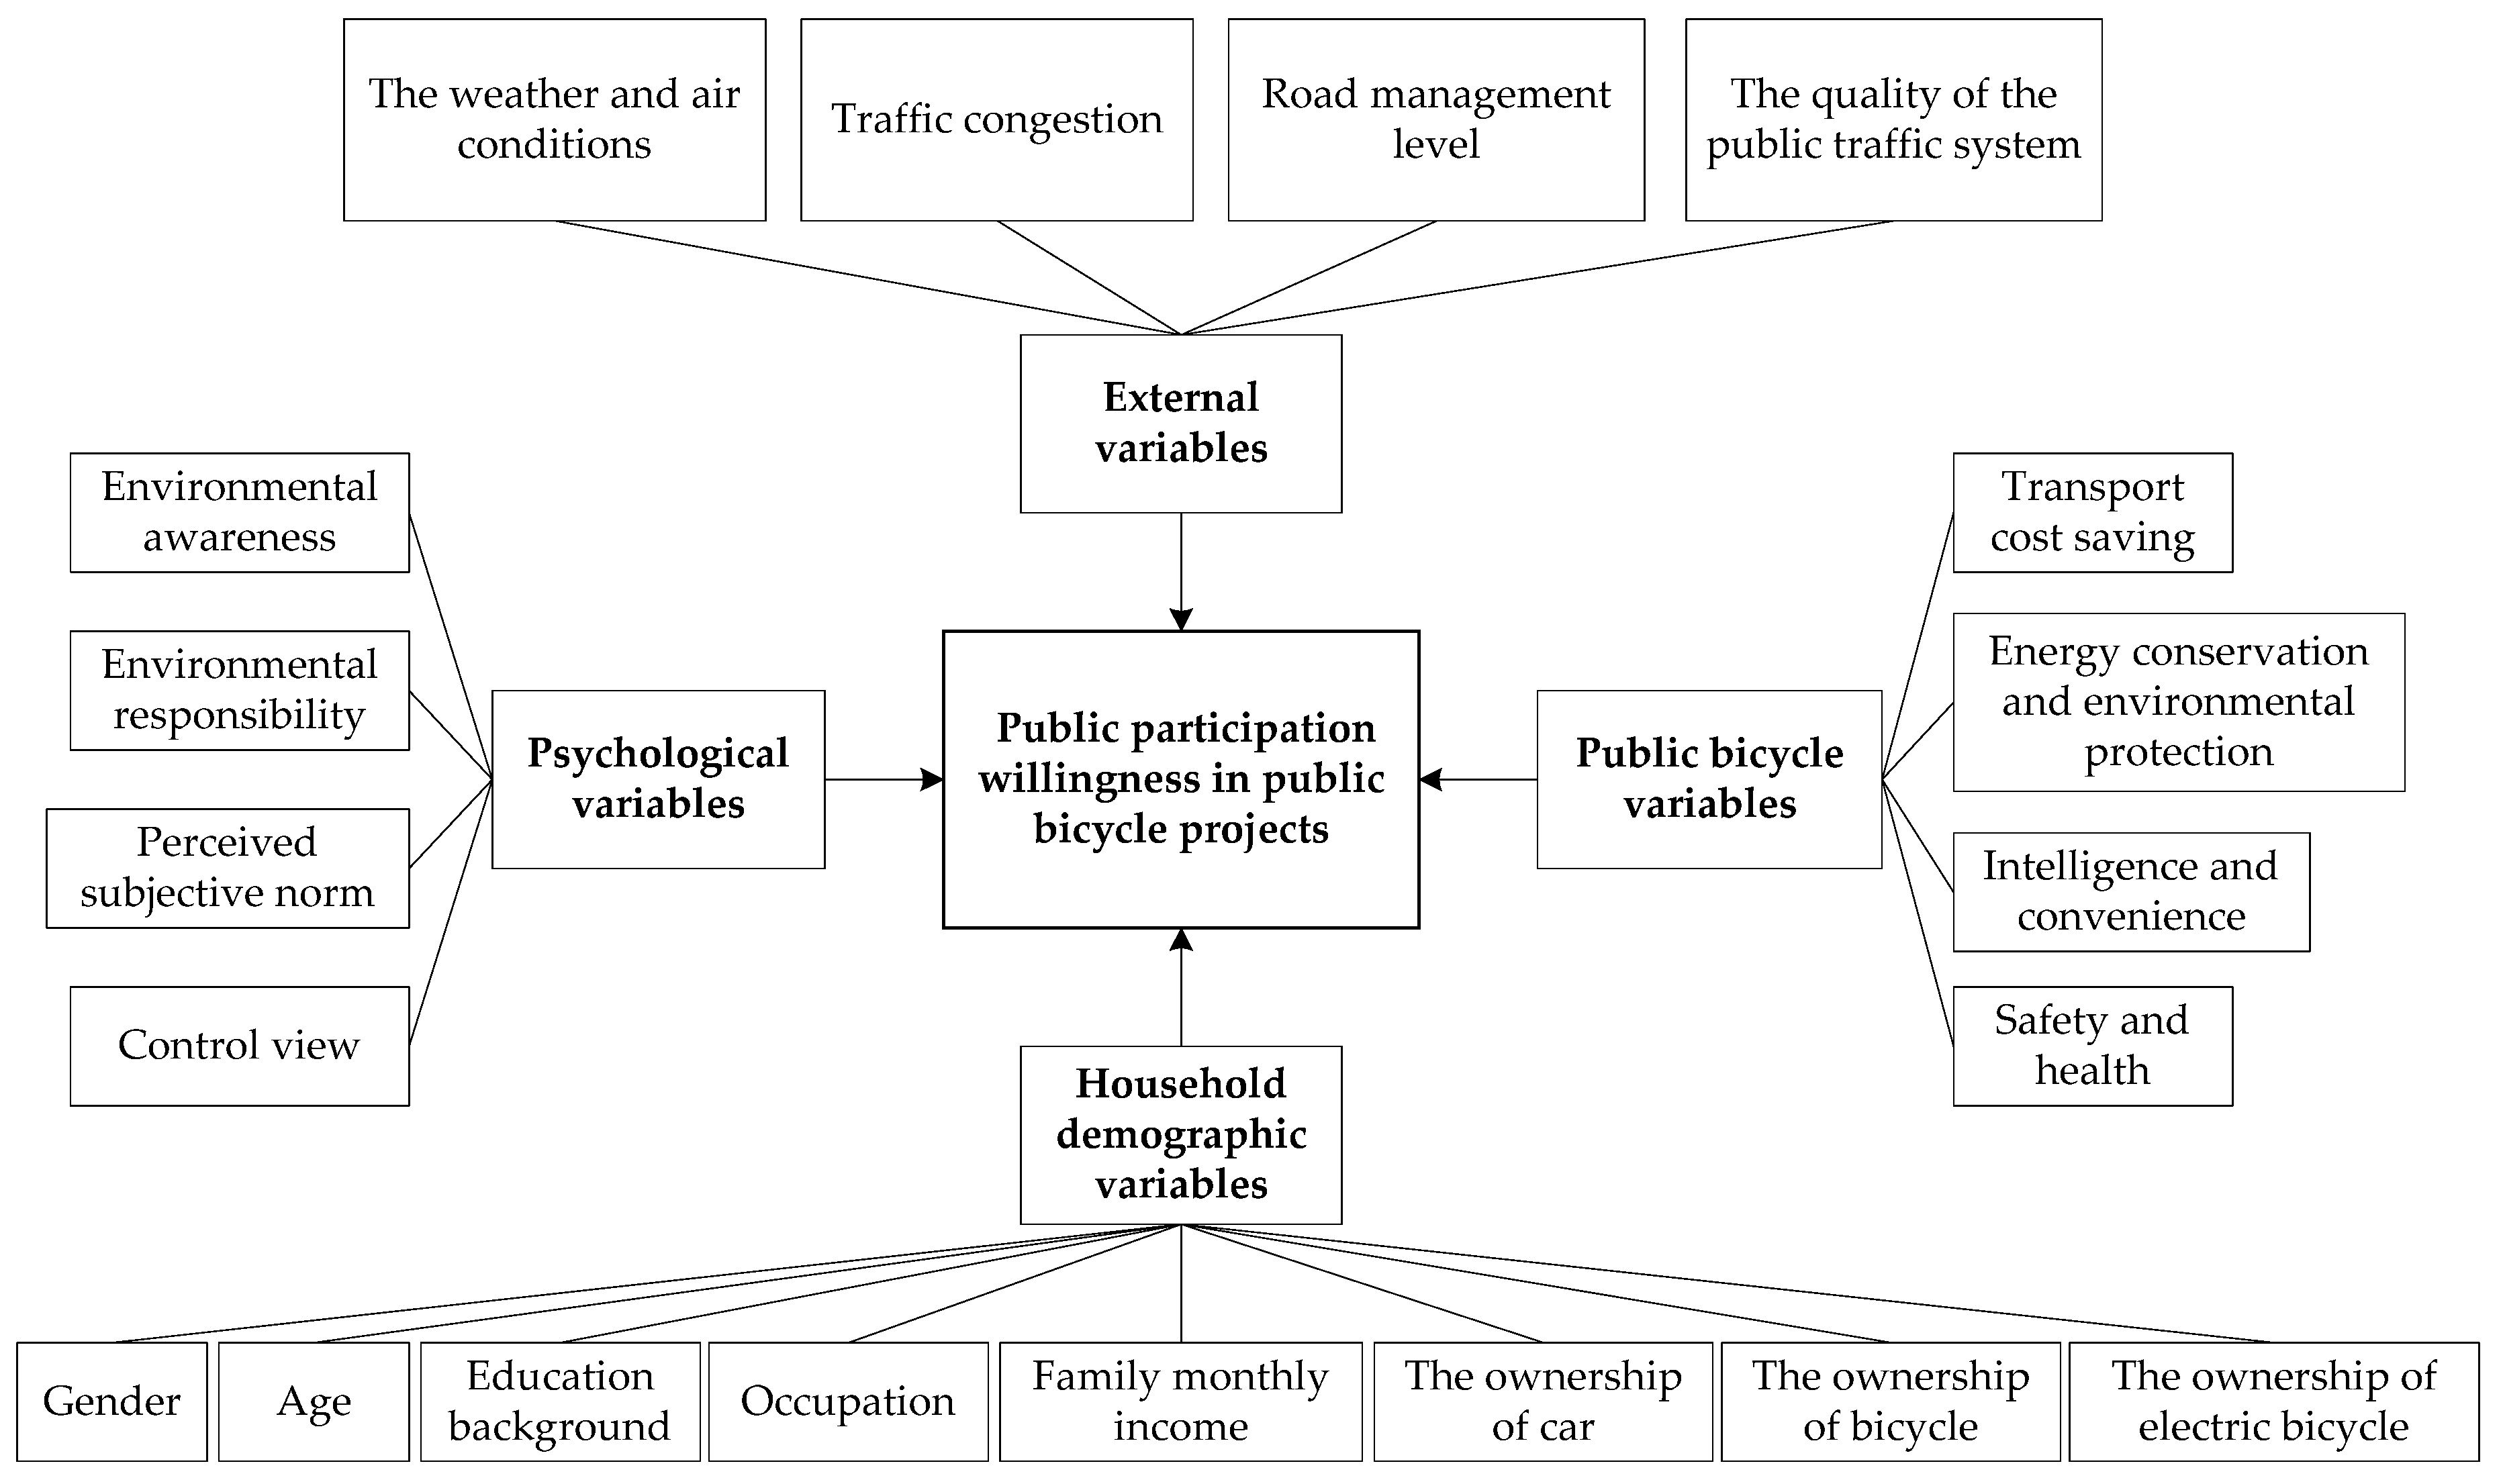
3.1. Conceptual Framework Subsection

Recent research regarding the influencing factors for urban residents’ willingness to participate in public bicycle projects has been largely focused on a few factors which have been widely investigated in the literature. To obtain more practical survey results, we designed an in-depth interview outline based on grounded theory to identify and separate the main influencing factors from those extracted from qualitative material. The interview questions focus on respondents’ attitudes regarding environmental and energy problems, their perceptions and attitudes about the public bicycle project, and what they consider to be the key factors influencing the willingness or urban residents to participate. The in-depth interviews were performed with 45 respondents from Xuzhou, Taizhou, and Suzhou in Jiangsu province (typically representing the northern, central, and southern regions of Jiangsu province, respectively). The public bicycle projects of Xuzhou, Taizhou, and Suzhou started in 2012, 2014, and 2010, respectively. So far, the quantities of public bicycles of these cities are 17,780, 2000, and 36,399, respectively [6]. Grounded theory requires that the respondents have a level of understanding and cognition about the problem studied, and so the respondents needed to have a high level of knowledge of the public bicycle project, be thoughtful, information-rich, and able to accept new concepts. The number of interviews was chosen from the principle of theoretical saturation (i.e., interviews were conducted until the point where further interviews could not provide new important information).
The analytical procedure of the grounded theory included open, axial, and selective coding. The extracted factors were summarized into four categories: household demographic, psychological, external, and public bicycle variables. Household demographic variables included gender, age, education background, occupation, income, and transportation ownership. Psychological variables included environmental awareness, environmental responsibility, perceived subjective norms, and control view. External variables included the weather and air conditions, traffic congestion, road management level, and the quality of the public traffic system. Public bicycle variables included transportation cost saving, energy conservation, environmental protection, intelligence and convenience, safety and health. Combining the Theory of Reasoned Action put forward by Ajzen and Fishbein [42] and the Theory of Planned Behavior put forward by Ajzen [43], the conceptual framework for willing to participate in public bicycle projects was structured as shown in Figure 1.
The partial variables are explained as follows:
  • Public environmental awareness: the degree of the public’s perception of environmental problems.
  • Environmental responsibility: public opinion on their responsibility for protecting the environment.
  • Perceived subjective norm: self-assessment of the influence that others have on the individual or the perceived social pressure on whether to participate in public bicycle projects.
  • Control view: the individual’s view about the benefit from participating in public bicycle projects and the amount of influence any individual has on environmental issues.
  • Weather and air conditions: whether the weather and air conditions of their cities are suitable for cycling.
  • Traffic congestion: the extent of road traffic congestion for the cities in which the respondents live.
  • Road management level: the level of the overall construction and management of roads in the individual’s city, such as specific roadways for bicycles on most roads, etc.
  • Quality of the public traffic system: the completeness and service level of the public traffic system, such as route planning and bus routes and settings.
  • Transport cost saving: compared with other modes of transportation, the extent to which public bicycle usage is more economical.
  • Energy conservation and environmental protection: compared with other modes of transportation, the extent to which public bicycle usage is more eco-friendly.
  • Intelligence and convenience: the system for the off-site obtainment and parking of bicycles using intelligent cards.
  • Safety and health: compared with other modes of transportation, public bicycles have a relatively high safety factor, and their use improves physical fitness and general health.

3.2. Hypotheses

From the literature review and grounded theory, research hypotheses were proposed as follows relevant to the conceptual framework.
H1. Public willingness to participate in the public bicycle project varies with different household demographic factors.
In general, women pay more attention to energy conservation [44], whereas a number of researchers contend that men are more concerned about environmental problems [45]. Thus, we assume that the public willingness to participate is different for men and women (H1a). However, the way in which gender impacts on willingness to participate requires further study. The capacity for adopting something new is relatively high for those who are relatively young and have high education, and researchers have shown that public bicycle projects largely appeal to those with high educational backgrounds, and relatively low average ages [19,27]. Consequently, the willingness to participate for younger (H1b) and high-educated (H1c) residents should be relatively high. On the other hand, researchers have shown there is no significant relationship between occupation and environmental behavior [46]. However, some researchers have argued that occupation could determine residents’ daily routine and consciousness, and those with higher social status occupations are more likely to implement environmental behavior because their environmental consciousness is relatively higher [47]. Consequently, the impact of occupation on willingness to participate requires further study (H1d). Those with lower incomes are likely to be more willing to use public bicycles than those with higher incomes (H1e) because of the economy of the public bicycle; in other words, public bicycles save more trip expenses than other modes of transportation. Since a car is more convenient and flexible than a bicycle, those who own a car may be less inclined to choose a public bicycle as their transportation (H1f). On the other hand, Fuller et al. [27] has shown that public bicycle projects are more appealing to those whose travel modes are mainly centered upon using a bicycle, but Nikitas et al. [48] indicated that many people tend to exclude themselves from using a bike-sharing scheme due to their ownership of private bicycles; for these individuals, their acceptance of the projects could be higher since they are more likely to appreciate the validity of bicycles as a viable transport mode. According to the results of the grounded theory, we assume for that those who have a private (H1g) or electric bicycle (H1h) may be more likely to use public bicycles because this reduces the chances of privately owned bicycles being stolen or damaged.
H2. Psychological variables are positively associated with the willingness to participate.
Many researchers have shown that residents with relatively strong environmental awareness and environmental responsibility are more likely to embrace environmental behavior [34,49]. Hence, we can assume that environmental awareness (H2a) and environmental responsibility (H2b) are positively correlated with the willingness to participate. On the other hand, Yu [50] studied the relation between subjective norm and behavior, and indicated that consumers’ environmental awareness was enhanced when they perceived group pressure (one manifestation of perceived subjective norm), and that this subsequently influenced their behavior. Consequently, we assume that those with more positive perceived subjective norms to public bicycles are more likely to be willing to participate (H2c). Similarly, those with an internal control view are more likely to be willing to participate (H2d) because they generally believe that their behavior effects the environment [30].
H3. External variables are associated with the willingness to participate in public bicycle projects.
If the city has good air quality and nice weather, the public may be more willing to use public bicycles (H3a). If traffic congestion is a serious issue, the public may also be more willing to participate (H3b) because of the flexibility of the public bicycle. Fishman et al. [37] suggested that public bicycles could potentially be an effective way to reduce traffic congestion based on a literature review study. Improvement of public consideration and security of cycling, good road quality management, and adequate cycling lanes will also increase public willingness to participate (H3c). Furthermore, according to Lin and Yang [51], the public bicycle project is more meaningful as an extension or part of a public transport system, therefore the better a public transport system is, the more functional (and thus more favorable) a public bicycle project is. (H3d).
H4. Public bicycle variables (transportation cost savings, energy conservation, environmental protection, intelligence and convenience, safety and health) are positively associated with the willingness to participate. Increasing any characteristic would, in principle, increase the attraction for the public [52].

4. Methods

4.1. Model Selection

Public willingness to participate in the public bicycle projects is a function of household demographic, psychological, external, and public bicycle variables.
Usually, a multivariable linear regression model is used to analyze the linear relation between several independent variables and a dependent variable, and its requirement is that the dependent variable must be routine data (interval scale) rather than qualitative data. However, the multivariable linear regression model will not work when the dependent variable is in the form of qualitative data, and with two states. As such, a binary logistic regression model should be used in this case. In this paper, we analyzed the influence of the various factors using the logistic regression model. According to the research targets and contents of this paper, the dependent variable was public willingness to participate in public bicycle projects, which is qualitative, with discrete values: willingness and unwillingness.
Public bicycle systems of most cities are membership based (i.e., to use the bicycles you first register and obtain a membership card (or equivalent)). An individual’s willingness to participate may be expressed by Y ( X i ) , where X i are the various influencing factors discussed above. Therefore, an individual completely unwilling to participate would not register, whereas one with a complete willingness would become a member. Hence, a non-member is expressed by Y = 0 and a member is expressed by Y = 1 . Thus, this is a binary distribution, and so can be analyzed using the binary logistic model. The dependent variable range is (0, 1), and can be expressed as
P = 1 / [ 1 + e ( α + β i X i ) ]
where, P is the probability of public participation of the public bicycle project, I is the index number of the individual, α is the regression intercept, β i is the regression coefficient of the factor, and X i is the i-th factor. Table 1 shows the variable range and implications of each factor of the model.

4.2. Survey Design

The questionnaire was designed based on the results of in-depth interviews and expert consultation. To test the validity of the questionnaire, we implemented it for 50 residents of Xuzhou city in Jiangsu province, including 30 members and 20 non-members of the public bicycle project. The questionnaire was subsequently improved to more accurately address the various hypotheses.
The final questionnaire included four sections:
  • Membership of the public bicycle project.
    This section contained only two options: yes or no.
  • Household demographic information.
    This section included eight variables: gender, age, education background, occupation, monthly family income, the ownership of a car, the ownership of a bicycle, and the ownership of an electric bicycle.
  • Factors influencing the willingness to participate
    This section included 12 variables: environmental awareness, environmental responsibility, perceived subjective norm, control view, the weather and air conditions, traffic congestion, road management level, the quality of the public traffic system, transportation cost saving, energy conservation and environmental protection, intelligence and convenience, safety and health, and 24 items (each variable corresponds to two items).
    Respondents were asked to answer to what extent they agreed with each question (e.g., reducing environmental pollution is every citizen’s responsibility; ordinary people are powerless to affect the environmental problem) and the answer for each question was given on a five-point scale (1 = strongly disagree, 2 = disagree, 3 = neither agree nor disagree, 4 = agree, 5 = strongly agree).
  • Satisfaction with the public bicycle project.
    This section only applied for respondents who were members of the public bicycle project, and included two areas: the members’ overall satisfaction from the public bicycle project, where the answer was on a five-point scale (1 = strongly dissatisfied, 2 = dissatisfied, 3 = neither satisfied nor dissatisfied, 4 = satisfied, 5 = strongly satisfied); and the areas they thought needed to be improved upon, set as a multiple-choice question with six options (nothing needs to be improved, sites need to be increased, service time needs to be prolonged, troubles with smart cards need to be decreased, design of public bicycles needs to be improved, and public bicycles need to be maintained over time).
This questionnaire survey was conducted in three cities: Xuzhou, Taizhou, and Suzhou, representing the northern, central, and southern regions of Jiangsu province, respectively. The questionnaires were sent to 520 citizens in the field. After excluding various interferences and invalid questionnaires, 475 valid surveys were available for analysis, and the effective returned rate of valid surveys to issued surveys was 91.35% (Table 2).
We adopted the empirical guide that the sample size should be at least 15–20 times the number of independent variables [53]. Members of the public bicycle project comprised 274 (57.7%) of the respondents, and 201 (42.3%) were non-members. There were 242 (50.9%) men and 233 (49.1%) women. The age structure was Age 1 (up to 17 years) (1.3%), Age 2 (18–28 years) (53.7%), Age 3 (29–44 years) (24.6%), Age 4 (45–59 years) (15.8%), and Age 5 (60 years and above) (4.6%). It should be noted that non-adults are allowed to have a bike-sharing membership in the schemes we examined, though this is not applicable in other schemes in the world. Education level was divided into five levels (as shown in Table 1): junior high school education and under, senior high school or technical secondary school education, junior college education, bachelor, and above bachelor, with proportions 5.9%, 15.6%, 26.3%, 34.9%, and 17.3%, respectively. Hence, the questionnaire has good representativeness of the population because the related data are fitted to a normal distribution [54], and the results (see Table 3) indicate that the scales used in the questionnaire have high reliability and validity.

5. Results

5.1. Analysis

We employed SPSS 19.0 to process the data. Multicollinearity tests showed variance inflation factors of all 20 variables were less than 5 (i.e., there was no multicollinearity among the variables). Using the binary logistic method, we backwardly eliminated variates using the Wald estimation for convenient calculation because there was no multicollinearity among variables and the sample size was sufficiently large. We first used all the variables, and then removed non-significant variables. Specifically, the variable with the minimum Wald value, below a previously decided upon cutoff, was removed, and then the regression refitted until all the remaining variables in the equation were significant. We adopted the 95% confidence level, selecting a variable where α 0.05 , and eliminating it for α > 0.05 . The final model had 13 degrees of freedom, and a chi-square value of 108.180 ( p = 0.000 ), which meant the model had statistical significance because at least one variable in the model was not 0.
The Hosmer-Lemeshow Test indicated that the fit index of the final model was 0.331, more than 0.05. Thus, the model shows good fit for the data, and we expect no significant difference between the observed and predicted data.
Table 4 shows the contingency table of the model predictions for 475 sample data. For the 201 non-members, 112 cases were predicted correctly (55.7%), and for the 274 members, 223 were predicted correctly (81.4%). Overall, the model prediction for members was good.
Table 5 shows the final fitted result (i.e., the regression analysis). Five variables were selected: gender, environmental awareness, environmental responsibility, the city’s public traffic system, and safety and health considerations from using public bicycles. Aside from gender, the variables were tested for significance in relation to the willingness of individuals to participate ( p < 0.05 ).

5.2. Discussion

Of the psychological variables, environmental awareness and environmental responsibility have significant impacts on the public willingness to participate in public bicycle projects. The regression coefficient of environmental awareness is negative and OR (Exp(B)) = 0.58, thus, with other influencing factors unchanged, the probability of public participation will be 0.58 of the original when public environmental awareness changes by one unit (i.e., more environmental awareness (by one unit) almost halves the expected participation rate). This is inconsistent with the general hypothesis discussed in Section 3.1, and also with many other research conclusions. For example, Steg, et al. [31], Bodur, et al. [32], and Poortinga, et al. [49] showed that increasing sensitivity to environmental problems significantly increased the likelihood of residents to implement environmental behaviors. In this paper, those respondents with higher environmental awareness could be more likely to have their own bikes, and thus might have less need for a bike sharing membership. The discrepancy also may lie with increasing health consciousness having a larger influence than increasing environmental awareness. Increasing environmental awareness indicates that the public is becoming more conscious of environmental matters. However, using public bicycles means they would be more exposed to the air, and so the public may be less likely to participate. At the same time, residents’ recognition of issues (e.g., environmental issues) depends to some extent on the social and economic development level of the city they live in. Consequently, our results are limited to our sample region. On the other hand, the regression coefficient of environmental responsibility is positive and OR = 2.40. That is, with other influencing factors unchanged, the probability of the public participation will be 2.40 of the original when the public environmental responsibility changes by one unit. This is consistent with our hypothesis (Section 3.1), and also with most research conclusions. With increasing environmental responsibility, the intention to improve environmental problems increases, and since public bicycles are a low-carbon transportation mode, the public are more likely to contribute their share to environmental improvement through participation in public bicycle projects.
Of the external variables, only the condition of the public traffic system has significant impact on public willingness to participate in public bicycle projects. The regression coefficient of the imperfect public traffic system is negative and OR = 0.80. That is, with other influencing factors unchanged, the probability of the public participation will be 0.80 of the original when the public traffic system quality decreases by one unit. This is consistent with our hypothesis (Section 3.1). At present, the public traffic system (e.g., subway, BRT) is the main component of urban transportation, while public bicycles are suitable only for short-distance trips. Hence public bicycles are more suitable for the “capillaries” of the traffic system, to provide short-distance door to door service, extending the service area of the public traffic system, and increasing the overall efficiency. That is to say, public bicycles and public traffic systems are complementary to each other [55]. Thus, improving public traffic systems could increase the willingness to participate in public bicycle projects.
Of the public bicycle variables, safety and health has the only significant impact on public willingness to participate in public bicycle projects. The regression coefficient of the safety and health is positive and OR = 2.07. Thus, with other influence factors unchanged, the probability of public participation will be 2.07 of the original when the safety and health improves by one unit, which is consistent with our hypothesis (Section 3.1). A public bicycle trip has a lower accident rate and a higher degree of trip safety than other modes of transportation, and attention to lifestyle and health preservation has gradually increased, with cycling being viewed as a good way to exercise, and hence enhance our health. As a consequence, safety and health considerations hold significant appeal for the public.
Of the household demographic variables, only gender was retained by the model. Our results indicate that while gender has an impact on public willingness to participate in public bicycle projects, this effect is not significant (p = 0.1 > 0.05). The regression coefficient of gender is negative (i.e., the willingness to participate is higher for women than men). From the perspective that the public bicycle is an energy saving travel mode, this is consistent with Schahn and Holzer [44].
Interestingly, the model indicates that most of the possible influencing factors have no impact on the public willingness to participate in public bicycle projects.
Age did not survive into the final model (i.e., it did not pass the model testing), which is inconsistent with our hypothesis. Although there is no general agreement on the relationship between age and environmental behavior, many research outcomes argue that age is one of the factors of environmental behavior. The discrepancy may lie in that, in contrast to implementing other environmental behaviors, there are no barriers to riding public bicycles. The age distribution of our respondents was largely 18-44, with the maximum age less than 65. Their physical fitness levels are comparatively similar, and so there is no evident difference in each age group.
Both educational background and occupation did not pass into the final model, which is inconsistent with our hypothesis, but consistent with other present research [46,56].
Income also did not pass into the final model, which is inconsistent with our hypothesis, and with most research outcomes. The reason for this may be that the income level of our respondents is relatively concentrated (mean value is 2.54), with no significant difference across the sample group.
Ownership of cars, bicycles, and electric bicycles did not survive into the final model. From the group data, ownership rates of cars, bicycles, and electric bicycles were similar for members and non-members. Thus, vehicle ownership cannot be distinguished as a direct impact on public willingness to participate in public bicycle projects.
Perceived subjective norm and control view did not survive into the final model, so they have no statistical significance. Hence, we conclude that perceived subjective norm and control view are not major influencing factors of public willingness to participate in public bicycle projects.
The weather and air conditions, traffic congestion, and road management level did not survive into the final model. The reason may lie in the limitation of our sample region, which may have been homogenous with respect to those variables.
Transportation cost saving, environmental protection, and intelligence and convenience did not survive into the final model. Although transportation cost saving, environmental protection, and intelligence and convenience are some of the main characteristics and attractions of public bicycles, the public bicycle projects of our sample region are still in the early phases of development, and station planning and vehicle scheduling of the public bicycle projects still have many defects. Hence, the actual implementations of these three characteristics are poor.
We also surveyed membership satisfaction of public bicycle projects. Only 38% of members use public bicycles frequently, only 18% were very satisfied with the systems, and 61% supported the creation of additional stations. Maintenance of the public bicycles is very important for 52% of the members, 39% would like to improve the design of the smart cards, and 38% support extending the usage time of the public bicycles. On the other hand, 70% of non-members do not want to participate because they feel there are too few sites to apply for membership and deal with other issues, whereas 58% think the procedures to apply for membership and deal with other issues are too troublesome.

6. Conclusions and Policy Implications

Our model shows that the public willingness to participate in public bicycle projects is significantly influenced by four variables: environmental awareness, environmental responsibility, quality of the public traffic system, and the safety and health considerations surrounding the usage of public bicycles. The survey itself showed only 37.6% members use public bicycles frequently. Therefore, combining the model outcomes and the questionnaire survey results themselves, this paper proposes the following policy changes to enhance public participation and improve the overall service efficiency of public bicycle projects.
(1)
Strengthen public environmental responsibility. The willingness to participate in public bicycle projects will increase with increasing public environmental responsibility. Public environmental responsibility should be considered as environmental literacy, and supported by relevant government sectors to be included in education and publicity channels. All stages of school education should address students’ environmental literacy—especially as part of the compulsory education— in order to guide them at an early age to love the environment and to do what they can to protect the environment. Government agencies should increase publicity channels and enrich publicity content in order to improve public awareness of environmental matters and thereby strike a chord with the public.
(2)
Guide public environmental awareness correctly and reasonably. We assumed that public willingness to participate in public bicycle projects would be increased with increasing environmental awareness. However, to the contrary, the model indicates that increasing environmental awareness will decrease the public’s willingness to participate. We argue this may be because members of the public might want to protect themselves from the direct exposure to environmental pollution if they are more aware of increasing serious environmental problems. Thus, relevant government sectors should guide public environmental awareness correctly and reasonably through publicity and education; efforts should be made to guide the public to face these environmental problems together, and encourage the public to contribute their share towards solving the problems.
(3)
Maximize safety and health aspects of using public bicycles. The model shows that if safety and health aspects are relatively high, public willingness to participate in public bicycle projects will be correspondingly high. Although accident rates for public bicycles are lower than other modes of transportation, the bicycle lanes in many cities are not ideal. Bicycle lanes have been encroached upon gradually, changed to parking spaces, or feature formats which allow motor vehicles to transit the lanes; additionally, bicycle lanes have been omitted from the construction of many new roads. These all increase the dangers associated with cycling. Thus, the relevant government sectors should encourage higher quality standards in the construction of bicycle lanes, recover occupied bicycle lanes, and include bicycle lanes on roads that lack them.
(4)
Constantly improve the public traffic system and the public bicycle system. The model shows that imperfect public traffic systems decreases public willingness to participate in public bicycle projects. Conversely, the better the urban public traffic system becomes, the more likely that there will be higher participation. Public bicycles could resolve some problems which the public traffic system cannot address, such as door to door or station to station service, thereby enhancing the overall trip efficiency. Therefore, the public traffic system and the public bicycle system should be improved synchronously. Thus, they could be mutually beneficial. For the public traffic system, some specific practices should be considered: ensure the effective planning of bus routes and station locations, adjust the shifts and intervals of the transportation schedules according to the specific circumstances of different bus routes, allocate vehicle type allowances according to different passenger numbers, and ensure the timely maintenance of the vehicles. As per the public bicycle systems, numerous suggestions can be made according to the survey results of membership satisfaction, including the need for: further planning and station design considerations; more reasonable schedules which expand the service range of the public bicycles thereby allowing for the satisfaction of public needs at any time and any station; maintaining (or improving) the quality of the bicycles and smart cards in a timely manner in order to improve the service efficiency; better coordination of the service times of the public bicycle systems according to the practical real-world considerations; increases to the number of sites available to apply for memberships and deal with other issues; and simplifications to the working procedures required to apply for memberships and deal with other issues.
In this study, our major goal was to find out the key influencing factors of the public willingness to participate in public bicycle projects. Firstly, we built a broad and practical conceptual framework based on grounded theory. Secondly, using the binary logistic model, we conducted an empirical analysis based on questionnaire survey results. Finally, we proposed four policy recommendations, as can be observed above.

Acknowledgments

We would like to thank the Natural Science Foundation of China (Grant Number: 71473247), and the Innovation Engineering Project of Postgraduate Education in Jiangsu Province (KYZZ_0380), and acknowledge the editors and reviewers for their language assistance and valuable comments.

Author Contributions

Ruyin Long came up with the original idea for this article; Ranran Yang designed the theoretical model, collected the data, and ran the simulation for the research; Ruyin Long and Ranran Yang wrote the paper. All authors read and approved this version.

Conflicts of Interest

The authors declare that they have no conflict of interest.

References

  1. AutoNavi Traffic. The Analysis Reports of Urban Traffic in Major Chinese Cities. Available online: http://trp.autonavi.com/traffic/ (accessed on 10 September 2015). (In Chinese)
  2. International Energy Agency (IEA). CO2 Emissions from Fuel Combustion Highlights. 2015. Available online: http://www.iea.org/publications/freepublications/publication/co2-emissions-from-fuel-combustion-highlights-2015.html (accessed on 24 March 2016).
  3. Chinairn. In the Chinese History of the Most Serious Haze Weather Occurred in 2013-the Biggest in 52 Years. Available online: http://www.chinairn.com/print/3344425.html (accessed on 10 May 2015).
  4. Xinhua News. The Cities of Beijing-Tianjin-Hebei Region Account for 80% of the Top Ten the Worst Air Quality in China in 2014. Available online: http://news.e23.cn/content/2015-02-04/2015020400124.html (accessed on 10 May 2015). (In Chinese)
  5. Huaiqiu Net. Bikeshaing Project Encounters Comprehensive Defeats. Available online: http://oversea.huanqiu.com/article/2014-09/5129365.html (accessed on 22 March 2016). (In Chinese)
  6. Chinese Publicbike Net. Available online: http://www.publicbike.net/ (accessed on 20 May 2015). (In Chinese)
  7. THE PAPER. The Quantity of Chinese Public Bicycles has exceeded the Sum of the Number of Other Countries in the World. Available online: http://www.thepaper.cn/newsDetail_forward_1265087 (accessed on 22 March 2016). (In Chinese)
  8. People.cn. Public Bicycle Projects Cover the Whole Jiangsu Province’s 13 Cities. Available online: http://js.people.com.cn/n/2015/0121/c360302-23628940.html (accessed on 25 March 2016). (In Chinese)
  9. Fishman, E.; Washington, S.; Haworth, N.; Mazzei, A. Barriers to bikesharing: An analysis from Melbourne and Brisbane. J. Transp. Geogr. 2014, 41, 325–337. [Google Scholar] [CrossRef]
  10. Lin, J.R.; Yang, T.H.; Chang, Y.C. A hub location inventory model for bicycle sharing system design: Formulation and solution. Comput. Ind. Eng. 2013, 65, 77–86. [Google Scholar] [CrossRef]
  11. Nakamura, H.; Abe, N. Evaluation of the hybrid model of public bicycle-sharing operation and private bicycle parking management. Transp. Policy 2014, 35, 31–41. [Google Scholar] [CrossRef]
  12. Dell’Amico, M.; Hadjicostantinou, E.; Iori, M.; Novellani, S. The bike sharing rebalancing problem: Mathematical formulations and benchmark instances. Omega 2014, 45, 7–19. [Google Scholar] [CrossRef]
  13. Regue, R.; Recker, W. Proactive vehicle routing with inferred demand to solve the bikesharing rebalancing problem. Transp. Res. E 2014, 72, 192–209. [Google Scholar] [CrossRef]
  14. Ho, S.C.; Szeto, W.Y. Solving a static repositioning problem in bike-sharing systems using iterated tabu search. Transp. Res. E 2014, 69, 180–198. [Google Scholar] [CrossRef] [Green Version]
  15. Forma, I.A.; Raviv, T.; Tzur, M. A 3-step math heuristic for the static repositioning problem in bike-sharing systems. Transp. Res. B 2015, 71, 230–247. [Google Scholar] [CrossRef]
  16. Liu, Z.P.; Ding, W.D.; Cheng, Y.M. Research of optimal scheduling between stations for public bicycle system. Urban Public Transp. 2011, 2011, 39–42. (In Chinese) [Google Scholar]
  17. Murphy, H. Dublin Bikes: An Investigation in the Context of Multimodal Transport; MSc Sustainable Development, Dublin Institute of Technology: Dublin, Ireland, 2010. [Google Scholar]
  18. Transport for London. Travel in London Report 3; Transport for London: London, UK, 2010.
  19. LDA Consulting. Capital Bikeshare 2011 Member Survey Report; LDA Consulting: Washington, DC, USA, 2012. [Google Scholar]
  20. Fishman, E.; Washington, S.; Haworth, N. Bike share’s impact on car use: Evidence from the United States, Great Britain, and Australia. Transp. Res. D 2014, 31, 13–20. [Google Scholar] [CrossRef]
  21. Zhang, L.H.; Zhang, J.; Duan, Z.Y.; Bryde, D. Sustainable bike-sharing systems: Characteristics and commonalities across cases in urban China. J. Clean. Prod. 2015, 97, 124–133. [Google Scholar] [CrossRef]
  22. Liu, Z.L.; Jia, X.D.; Cheng, W. Solving the last mile problem: Ensure the success of public bicycle system in Beijing. Procedia Soc. Behav. Sci. 2012, 43, 73–78. [Google Scholar] [CrossRef]
  23. Liu, L.; Li, Y.; Xu, G.H. Empirical study of bike sharing service satisfactions in Wuhan city. Logist. Eng. Manag. 2011, 33, 116–117. (In Chinese) [Google Scholar]
  24. Cui, M.L. Analysis on the urban residents’ public bicycle trip based on customer satisfaction. Mod. Bus. Trade Ind. 2011, 23, 125–126. (In Chinese) [Google Scholar]
  25. Qian, K.F.; Zhu, W.; Yu, Y.; Zhou, Y.J. A study on the evaluation index system of the development of the urban public bicycle system. Planners 2012, 2012, 95–100. (In Chinese) [Google Scholar]
  26. Fishman, E.; Washington, S.; Haworth, N.; Watson, A. Factors influencing bike share membership: An analysis of Melbourne and Brisbane. Transp. Res. A 2015, 71, 17–30. [Google Scholar] [CrossRef]
  27. Fuller, D.; Gauvin, L.; Kestens, Y.; Daniel, M.; Fournier, M.; Morency, P.; Drouin, L. Use of a new public bicycle share program in Montreal, Canada. Am. J. Prev. Med. 2011, 41, 80–83. [Google Scholar] [CrossRef] [PubMed]
  28. Castillo-Manzano, J.I.; Castro-Nuño, M.; López-Valpuesta, L. Analyzing the transition from a public bicycle system to bicycle ownership: A complex relationship. Transp. Res. D 2015, 38, 15–26. [Google Scholar] [CrossRef]
  29. Heinen, E.; Wee, B.V.; Maat, K. Commuting by bicycle: An overview of the literature. Transp. Rev. 2010, 30, 59–96. [Google Scholar] [CrossRef]
  30. Hines, J.M.; Hungerford, H.R.; Tomera, A.N. Analysis and synthesis of research on responsible environmental behavior: A Meta-analysis. J. Environ. Educ. 1986, 18, 1–8. [Google Scholar] [CrossRef]
  31. Steg, L.; Vlek, C. Encouraging pro-environmental behavior: An integrative review and research agenda. J. Environ. Psychol. 2009, 29, 309–317. [Google Scholar] [CrossRef]
  32. Bodur, M.; Sarigollu, E. Environmental sensitivity in a developing country: Consumer classification and implication. Environ. Behav. 2005, 37, 487–510. [Google Scholar] [CrossRef]
  33. Stern, P.C. Toward a coherent theory of environmentally significant behavior. J. Soc. Issues 2000, 56, 407–424. [Google Scholar] [CrossRef]
  34. Tanner, C.; Kast, S.W. Promoting sustainable consumption: Determinants of green purchases by Swiss consumers. Psychol. Market. 2003, 20, 883–902. [Google Scholar] [CrossRef]
  35. Fransson, N.; Gärling, T. Environmental concern: Conceptual definitions, measurement methods, and research findings. J. Environ. Psychol. 1999, 19, 369–382. [Google Scholar] [CrossRef]
  36. Scott, D.; Parker, P.; Rowlands, H.I. Determinants of energy efficiency behaviors in the home. Environments 2000, 28, 73–96. [Google Scholar]
  37. Fishman, E.; Washington, S.; Haworth, N. Bike share: A synthesis of the literature. Transp. Rev. 2013, 33, 148–165. [Google Scholar] [CrossRef] [Green Version]
  38. Shaheen, S.; Martin, E.; Cohen, A.P.; Finson, R. Public Bikesharing in North America: Early Operator and User Understanding; Mineta Transportation Institute: SanJose, CA, USA, 2012. [Google Scholar]
  39. Alta Bike Share. Melbourne Bike Share Survey; Alta Bike Share: Melbourne, Australia, 2011. [Google Scholar]
  40. Tang, Y.; Pan, H.X.; Shen, Q. Bike-Sharing Systems in Beijing, Shanghai and Hangzhou and Their Impact on Travel Behavior. 2010. Available online: http://assets.conferencespot.org/fileserver/file/29025/filename/12l718.pdf (accessed on 1 July 2015).
  41. Fishman, E.; Washington, S.; Haworth, N. Barriers and facilitators to public bicycle scheme use: A qualitative approach. Transp. Res. F 2012, 15, 686–698. [Google Scholar] [CrossRef] [Green Version]
  42. Fishbein, M.; Ajzen, I. Belief, Attitude, Intentions, and Behavior: An Introduction to Theory and Research; Addison-Wesley Publishing Company: Menlo Park, CA, USA, 1975. [Google Scholar]
  43. Ajzen, I. The theory of planned behavior. Organ. Behav. Hum. Dec. 1991, 50, 179–211. [Google Scholar] [CrossRef]
  44. Schahn, J.; Holzer, E. Studies of individual environmental concern: The role of knowledge, Gender, and background variables. Environ. Behav. 1990, 22, 767–786. [Google Scholar] [CrossRef]
  45. Arcury, T.A.; Christianson, E.H. Environmental worldview in response to environmental problems: Kentucky 1984 and 1988 compared. Environ. Behav. 1990, 22, 387–407. [Google Scholar] [CrossRef]
  46. Curtis, F.; Simpson-Housley, P.; Drever, S. Household Energy Conservation. Energy Policy 1984, 12, 452–456. [Google Scholar] [CrossRef]
  47. Olsen, M. Public acceptance of consumer energy conservation strategies. J. Econ. Psychol. 1983, 4, 183–196. [Google Scholar] [CrossRef]
  48. Nikitas, A.; Wallgren, P.; Rexfelt, O. The paradox of public acceptance of bike sharing in Gothenburg. Proc. Inst. Civ. Eng. Eng. Sustain. 2015. [Google Scholar] [CrossRef]
  49. Poortinga, W.; Spence, A.; Demski, C.; Pidgeon, N.F. Individual-motivational factors in the acceptability of demand-side and supply-side measures to reduce carbon emissions. Energy Policy 2012, 48, 812–819. [Google Scholar] [CrossRef]
  50. Yu, W. Analysis of the formation mechanism of consumers’ green consuming behaviors: From the perspective of group pressure and environment cognition. Consum. Econ. 2009, 25, 75–77. (In Chinese) [Google Scholar]
  51. Lin, J.R.; Yang, T.H. Strategic design of public bicycle sharing systems with service level constraints. Transp. Res. E 2011, 47, 284–294. [Google Scholar] [CrossRef]
  52. Ricci, M. Bike sharing: A review of evidence on impacts and processes of implementation and operation. Res. Transp. Bus. Manag. 2015, 15, 28–38. [Google Scholar] [CrossRef]
  53. Huang, Z.B. Logistic Regression Model. 2011. Available online: http://wenku.baidu.com/view/b65e4886ec3a87c24028c453.html (accessed on 11 September 2015).
  54. National Bureau of Statistics of China. China Statistical Yearbook; China Statistics Press: Beijing, China, 2015.
  55. Zhang, X.; Chen, W.R. The development of the public bicycle. Transp. Enterp. Manag. 2011, 26, 44–45. (In Chinese) [Google Scholar]
  56. Sardianou, E. Estimating energy conservation patterns of Greek households. Energy Policy 2007, 35, 3778–3791. [Google Scholar] [CrossRef]
Figure 1. Conceptual framework for willingness to participate in public bicycle projects.
Sustainability 08 00349 g001
Table 1. Explanation of influencing variables.
VariableValuesExplanationMeanExpected Direction 1
YMembership0,10 = non-members 1 = members0.58
Household demographic variables
X1Gender1, 20 = female, 1 = male1.49+/−
X2Age1–51 = 17 years and under, 2 = 18–28 years, 3 = 29–44 years, 4 = 45–59 years, 5 = 60 years and above2.69
X3Educational background1–51 = junior high school and under, 2 = senior high school or technical secondary school, 3 = junior college, 4 = bachelor degree, 5 = above bachelor degree3.42+
X4Occupation1–91 = government, 2 = education, research, or health, 3 = foreign enterprise, 4 = private enterprise, 5 = self-employed, 6 = general worker and service staff, 7 = student, 8 = unemployed, 9 = retired4.23+/−
X5Family monthly income1–51 = 3000 yuan and under, 2 = 3001–5000 yuan, 3 = 5001–10,000 yuan, 4 = 10,000–20,000 yuan, 5 = above 20,000 yuan2.54
X6The ownership of car0, 10 = no, 1 = yes0.48
X7The ownership of bicycle0, 10 = no, 1 = yes0.60+
X8The ownership of electric bicycle0, 10 = no, 1 = yes0.65+
Psychological variables
X9Environmental awareness1–51 = Environmental problem is not serious, 2 = relatively not serious, 3 = not sure, 4 = relatively serious, 5 = very serious4.43+
X10Environmental responsibility1–51 = No completely, 2 = not strong, 3 = not sure, 4 = relatively strong, 5 = very strong4.51+
X11Perceived subjective norm1–51 = Completely unaffected by others, 2 = less affected by others, 3 = not sure, 4 = relatively easily affected by others, 5 = easily affected by others3.67+
X12Control view1–51 = Completely external control, 2 = tend to be external control, 3 = not sure, 4 = tend to be internal control, 5 = completely internal control3.57+
External variables
X13The city’s weather and air conditions suit cycling1–51 = Strongly disagree, 2 = relatively disagree, 3 = not sure, 4 = relatively agree, 5 = strongly agree=53.40+
X14The city’s traffic congestion is becoming more serious1–51 = Strongly disagree, 2 = relatively disagree, 3 = not sure, 4 = relatively agree, 5 = strongly agree4.32+
X15The city’s road management level meets cycling requirements1–51 = Strongly disagree, 2 = relatively disagree, 3 = not sure, 4 = relatively agree, 5 = strongly agree3.45+
X16The city’s public traffic system is poor1–51 = Strongly disagree, 2 = relatively disagree, 3 = not sure, 4 = relatively agree, 5 = strongly agree3.68+
Public bicycle variables
X17Transport cost saving1–51 = Strongly disagree, 2 = relatively disagree, 3 = not sure, 4 = relatively agree, 5 = strongly agree4.39+
X18Energy conservation and environmental protection1–51 = Strongly disagree, 2 = relatively disagree, 3 = not sure, 4 = relatively agree, 5 = strongly agree4.55+
X19Intelligence and convenience1–51 = Strongly disagree, 2 = relatively disagree, 3 = not sure, 4 = relatively agree, 5 = strongly agree4.23+
X20Safety and health1–51 = Strongly disagree, 2 = relatively disagree, 3 = not sure, 4 = relatively agree, 5 = strongly agree4.28+
1 Expected direction is according to the appropriate hypothesis discussed in the explanation of variables.
Table 2. Distribution and recovery of questionnaires.
CityIssuedReturnedValidValid Rate
Suzhou18517316488.65%
Taizhou17016215188.82%
Xuzhou16516216096.97%
Total52049747591.35%
Table 3. Reliability and Validity testing of the scales used.
VariablesCronbach’s Coefficient AlphaKMO MeasureBartlett’s Test of SphericitySig.
Psychological variables 0.7800.843892.5330.000
Environmental awareness0.715
Environmental responsibility0.752
Perceived subjective norm0.814
Control view0.782
External variables 0.7790.806779.1000.000
The weather and air conditions0.790
Traffic congestion0.811
Road management level0.735
The quality of the public traffic system0.822
Public bicycle variables 0.7620.797301.9740.000
Transport cost saving0.801
Energy conservation and environmental protection0.784
Intelligence and convenience0.721
Safety and health0.800
Table 4. The classification of Table 1 (the last output step).
ObservationPrediction
MembershipPercentage Revised
01
Membership01128955.7
15122381.4
Total percentage 70.5
1 cutoff value was 0.500; 0 = non-member, 1 = member.
Table 5. Variables in the equation (the last output step).
BS.E.WalsdfSig.Exp (B) 1
X1Gender−0.350.212.7310.100.71
X11Environmental awareness−0.540.235.6710.020.58
X12Environmental responsibility0.870.2313.9410.002.40
X18The city’s public traffic system is not perfect−0.220.105.0310.030.80
X22The safety and health considerations of cycling0.730.1428.0710.002.07
Constant−2.870.949.3310.000.06
1 Exp (B) is the odds ratio (or dominance ratio) of the corresponding variable. It denotes, with other conditions unchanged, the change rate of the ratio of event occurrence when the independent variable changes by one unit.

