Article

Changes in Patterns of Seasonality Shown by Migratory Fish under Global Warming: Evidence from Catch Data of Taiwan’s Coastal Fisheries

1
Department of Environmental Biology and Fisheries Science, National Taiwan Ocean University, 2 Pei-Ning Road, Keelung 20224, Taiwan
2
Department of Global Agricultural Sciences, Tokyo University, 7-3-1 Yayoi, Bunkyo, Tokyo 113-8657, Japan
3
Center of Excellence for the Oceans, National Taiwan Ocean University, 2 Pei-Ning Road, Keelung 20224, Taiwan
4
Coastal and Offshore Resources Research Center, Fisheries Research Institute, Council of Agriculture, No. 6, Yugang N. 3rd Rd., Cianjhen District, Kaohsiung 80672, Taiwan
5
Marine Fisheries Division, Fisheries Research Institute, Council of Agriculture, No.199, He 1st Rd, Keelung 20246, Taiwan
*
Author to whom correspondence should be addressed.
Sustainability 2016, 8(3), 273; https://doi.org/10.3390/su8030273
Submission received: 7 January 2016 / Revised: 10 March 2016 / Accepted: 10 March 2016 / Published: 16 March 2016
(This article belongs to the Section Environmental Sustainability and Applications)

Abstract

:
In this study, we analyzed the fish species composition data of coastal capture fisheries in Taiwan between 1963 and 2010. The purpose of the analysis was to understand the long-term changes in marine ecosystems. A ratio-to-moving average method was used in conjunction with adjusted seasonal indices to determine the seasonality of individual catch items and to examine the trends shown by the species with the same seasonality. Over the 48-year timespan of the data, 31 species, i.e., 64% of the total number of species, were identified as seasonal migrants. The catch ratio for species showing a single peak in the spring increased steadily over time; however, those species with a single peak in the winter decreased. The catch ratio for those species with dual peaks in both summer and fall varied greatly before 1978. Increasing trends began in the 1980s and accelerated until 1998. As a result of this increase, the previous concentration of the fishing season in the winter months became highly diffuse. Additionally, the winter and/or spring species continued to decrease year after year as the summer and/or autumn species gradually came to dominate the catch. This change in fishing seasonality is likely not an anthropogenic effect. However, the change coincides with trends in sea surface temperature fluctuations. Such variation may not only cause structural change in marine ecosystems but can also significantly impact the economy and the livelihoods of those associated with the fishing trade.

1. Introduction

The increasing number of publications assessing the impact of climate change on marine ecosystems and fisheries attests to rising scientific and public interest [1]. A selection of recent papers, addressing biological rather than social and economic aspects, is reviewed here, with particular attention given to the climate impact on future fishery yields [1,2]. Climate change has significant effects on marine organisms. It is predicted that by 2050, serious species invasions, local extinctions, and species turnover will have occurred globally; more species will move to higher latitudes [3]. Globally and under the high-range greenhouse gas emission scenario, the 10-year average maximum catch potential will be reduced up to 20% from 2005 to 2055 between 10° N and 10° S. In the Northern Hemisphere, the catch potential will decline moderately in temperate regions (approximately 25–50° N) but increase in higher-latitude regions, particularly in the subarctic region [3,4]. In the Southern Hemisphere, species movement patterns are less clear in the non-tropical regions, except for the large variations in the maximum catch potential (±30% from 2005 level) around the Antarctic region [4]. Therefore, future changes in the position of fish stocks will significantly affect fisheries at both the regional and national levels, especially in low-latitude waters, short-coastline coastal states, and island countries. If these simulations prove true, local fishery resources will change significantly as global warming progresses.
Taiwan is located near the fastest warming marine waters, which can be deemed the “hotspots” of the world [5]; therefore, environmental variation caused by climate change severely affects fishery resources. In the coastal waters of Taiwan, the northward flow of the Kuroshio Current (KC) provides a continuous, year-round addition to the abundant fish resources of Taiwan, influencing the year-round oceanic regime [6]. During the winter north-easterly monsoon period (September to April), the China Coastal Current (CCC) brings cold water from the Yellow Sea and the East China Sea into the Taiwan Strait (TS) [7,8,9]. Water circulation in the TS varies seasonally due to changes in wind direction [7,8,9]. Furthermore, the CCC and KC are tied closely to sea surface temperature (SST) variations in the coastal waters of Taiwan (Figure 1) [6]. In recent years, the rate of SST increase in Taiwan’s waters has accelerated, and the variability has increased [10]. The increase in SST has been accompanied by a shift in ocean currents. However, the mechanisms behind these changes are the decline of the CCC and the enhancement of the KC [6,11,12,13]. The ocean environment changes contribute to modifications in the productivity, distribution, and phenology of marine species, affecting ecosystem processes and altering food webs [5,6,14,15,16].
The global ocean temperature has increased at a rate of approximately 0.11 °C every 10 years from 1982 to 2001 [17]. In Taiwan, the water SST increases over this period have been approximately 0.5 °C per decade, a value much higher than the global average. In recent years, the warmer water temperature has caused seasonal variation in the marine species located off the coast of Taiwan [6,18,19]. The SST in Taiwanese waters has been rising since the 1980s, leading to frequent extreme weather and climatic changes. These warmer temperatures are putting the coastal fisheries of Taiwan in a disadvantageous position [6,10,20]. Previous research on this topic has focused on single species in specific local areas. Rare, comprehensive, multi-species, and island-wide surveys were conducted. However, it is difficult to conduct a long-term, fishery-independent survey covering multiple species in the waters surrounding Taiwan. From 1963 to 2010, the fishing capacity of Taiwan rapidly increased. Excessive fishing capacity may result in mixed impacts, and it is difficult to observe the extent of the impact of climate variability. However, the fishing efforts of Taiwanese coastal fisheries are relatively stable compared to other fisheries. The coastal fisheries of Taiwan, defined as those in which fishing activity occurs within 12 nautical miles of the coast, consist of various subsistence fisheries; most are small-scale and multi-gear fisheries that operate year-round. In this study, we sought to compile and analyze the overall coastal fisheries catch data to better understand the change in the seasonality of the fish in response to climate change.

2. Data and Methods

2.1. Catch Data

Fish landing data in weight by species for the coastal capture fisheries were provided by the Fishery Agency for the period 1963–2010, and were filtered. The data were then subjected to seasonal analysis to examine the differences in seasonal fish catch. In the filtering of fisheries data, the set net fishery catch data, representing approximately 20% of coastal catch, were omitted because a fishing moratorium was in place during the typhoon season (July to September). Moreover, catch data representing multiple species of fish were not included (for example, carangidae, shark, herring, and sardines), representing a catch proportion of 22.5%. Newly recorded species (after 1989) were also omitted (for example, cobia, spear shrimp, crimson crab, silver anchovy, blue-barred orange (parrotfish), small yellow croaker, big head shrimp, and file fish), representing 7.5% of the catch. After making these omissions, this study selected 48 fish species for seasonality analysis.

2.2. Seasonality Analysis of the Catch

Monthly catch data from 1963 to 2010 were used to determine the seasonality of the 48 species. The four seasons defined and analyzed were spring (March–May), summer (June–August), fall (September–November), and winter (December–February). The following method was used to determine the smoothed seasonal time series (MAi):
M A i = Q i 2 + 2 Q i 1 + 2 Q i + 2 Q i + 1 + Q i + 2 8
R M A i = Q i MA i × 100 % ,
where i is the season sequence since 1963 (i = 1, 1963/03–1963/05; i = 2, 1963/06–1963/08; i = 3, 1963/09–1963/11; i = 4, 1963/12–1964/02), Q denotes catch, and RMA is the mean ratio-to-moving-average method.
The Seasonal Index (SI) for a given season k (spring, summer, fall, winter) was calculated as the average RMA of season k from 1963 to 2010 (n = 47). The standard deviation of SI for season k was calculated with the following equations:
S I ¯ k = R M A i n
S D k = ( S I k S I k ¯ ) 2 n 1 .
Using the mean values and the standard deviation of SI, the seasonality of a fish species was then determined by sequence analysis with an ANOVA and an independent-sample T test. The primary tests were performed for the variances of SI across the four seasons (p1); the secondary tests were performed for the variances of SI for the highest two seasons (p2). According to the tests, if the catch yield was concentrated in one season, the seasonality of the species was classified as single-seasonal (p1 < 0.05, p2 < 0.05). If the catch yield was concentrated in two seasons, the seasonality of species was classified as dual-seasonal (p1 < 0.05, p2 > 0.05). If the catch yield was not concentrated in a specific season, the seasonality of the species was classified as non-seasonal (p1 > 0.05, p2 > 0.05). The seasonality of the 48 species was then applied to the catch data for the whole period (1963–2010) to establish the long-term seasonal trend for each species.

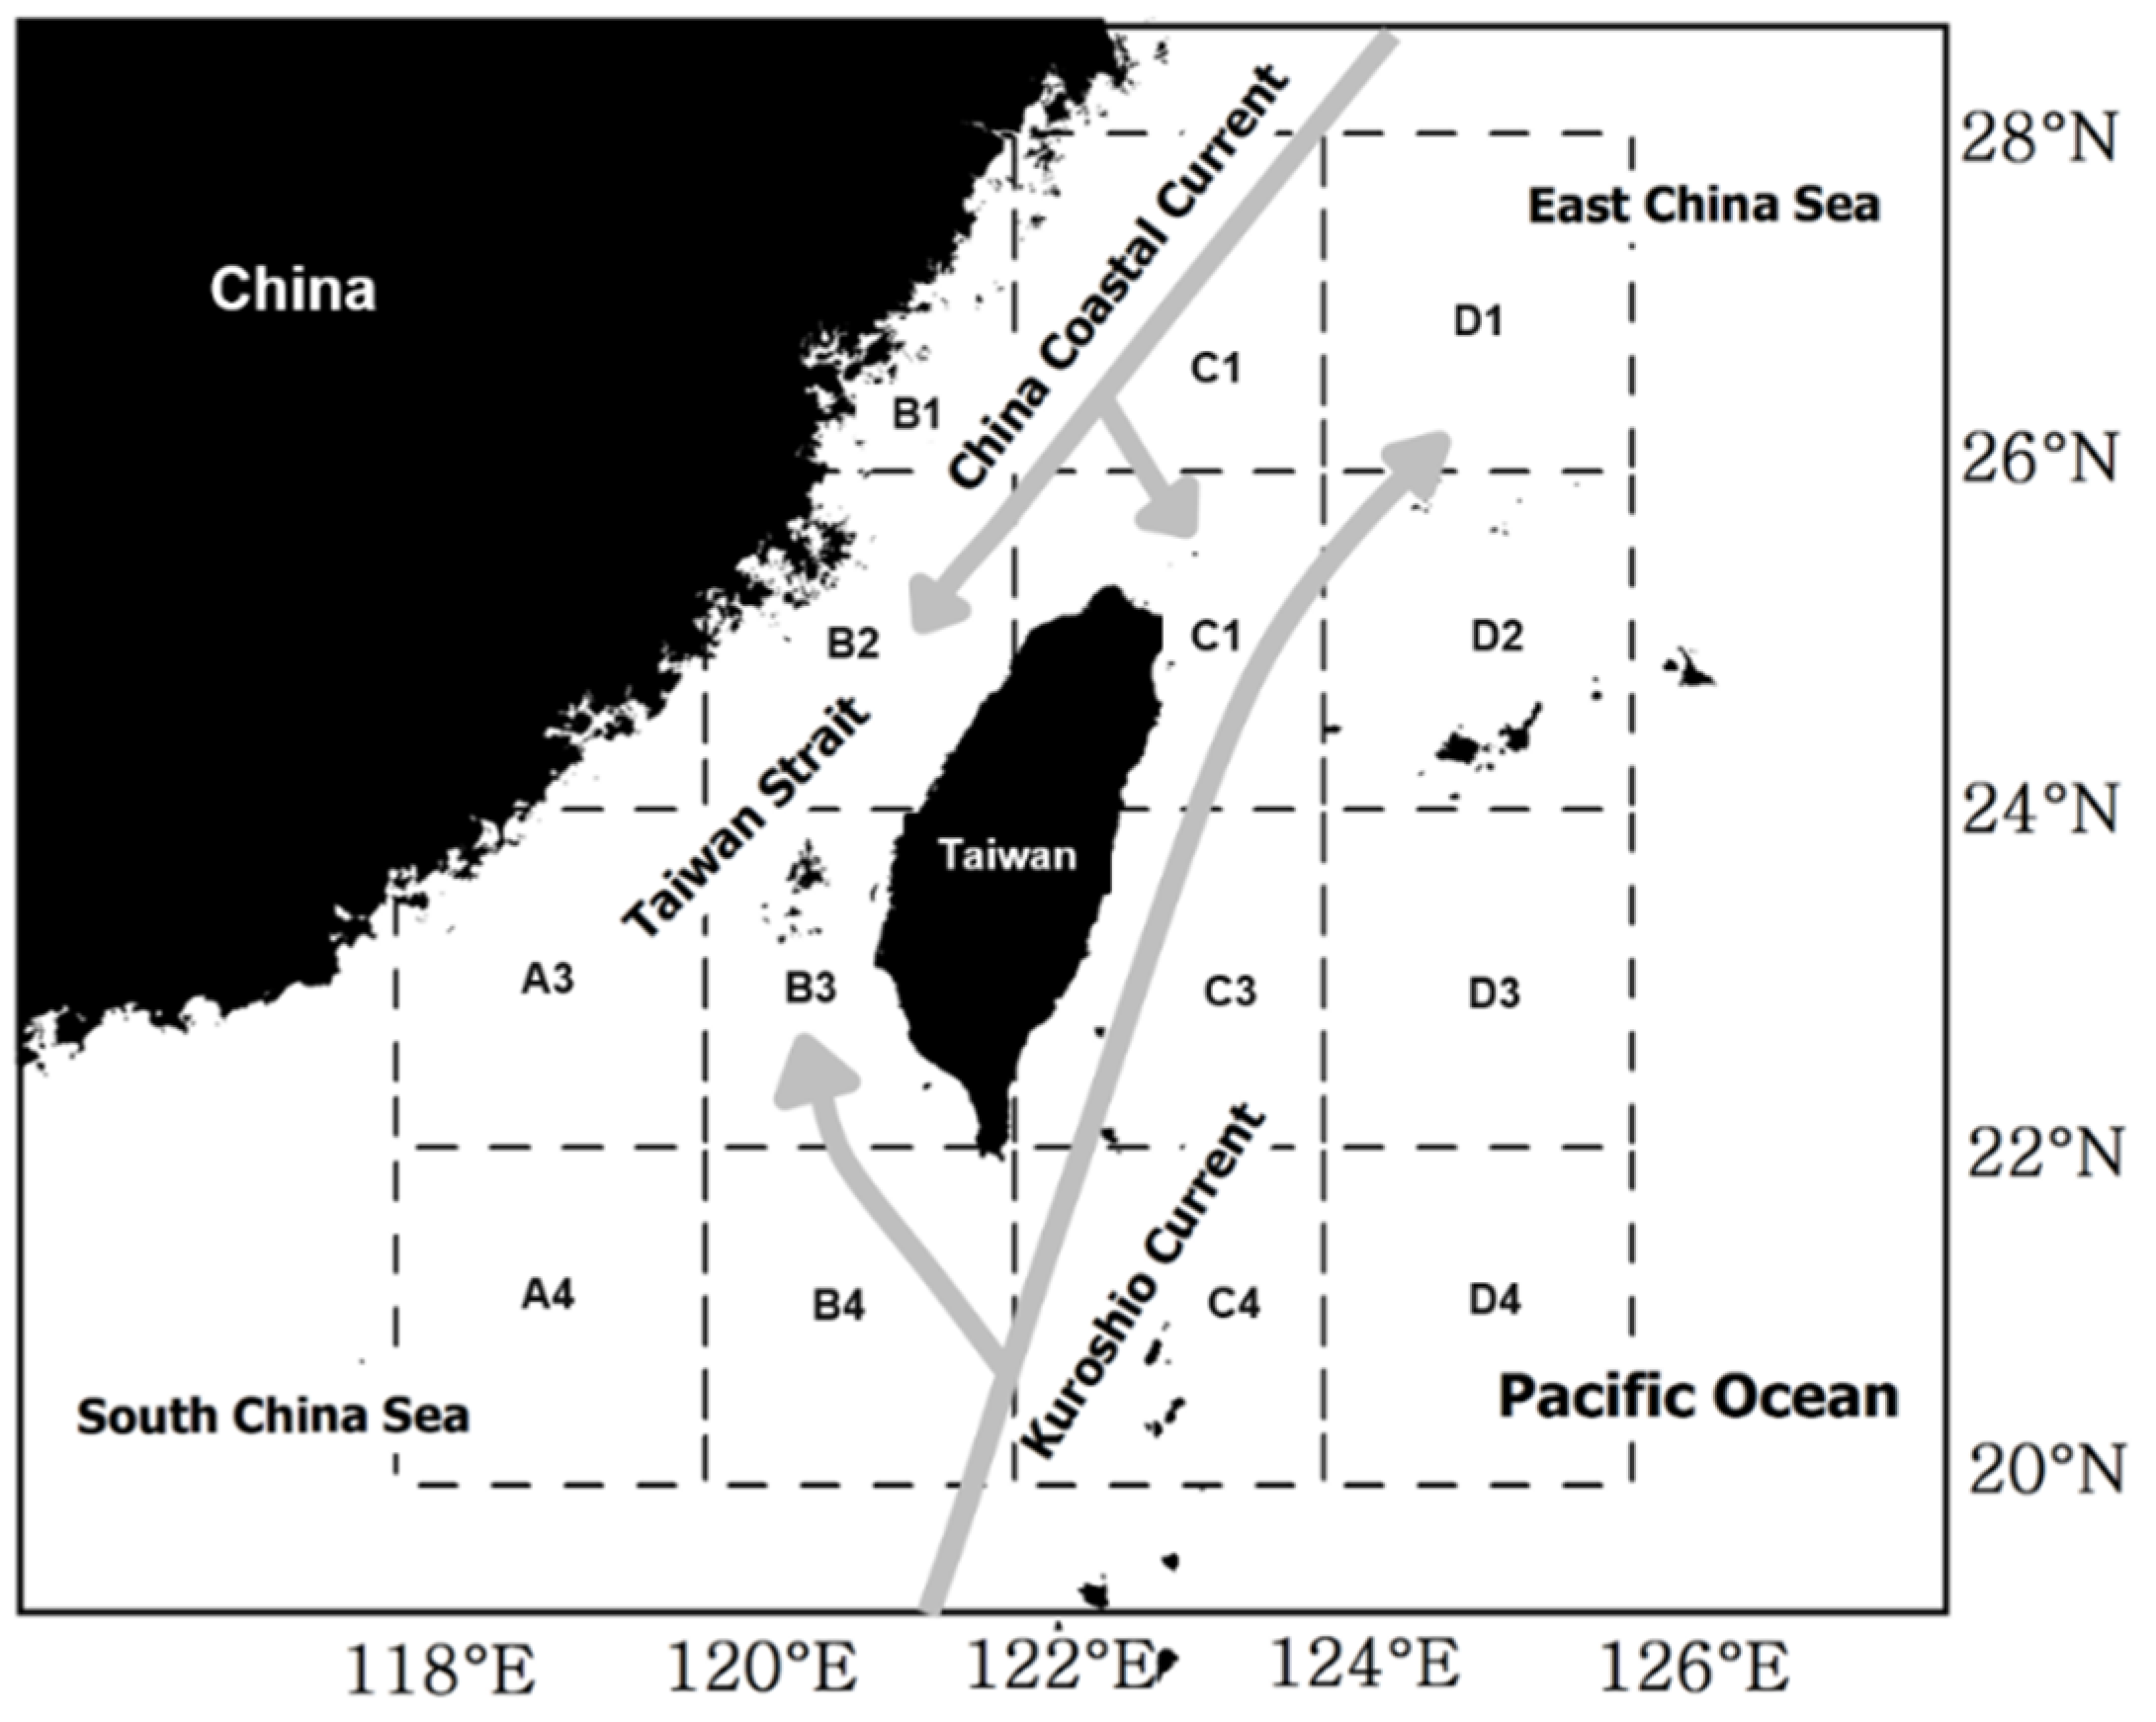
2.3. SST Data Process

The SST data with a monthly 1° × 1° grid resolution obtained from the National Oceanic and Atmospheric Administration (NOAA, USA) Extended Reconstructed Sea Surface Temperature (SST) V2 covering all waters adjacent to Taiwan (116–128° E, 18–34° N) were used to observe the trends in SST variability during the period of 1963–2010. For specific months of various years, the number of grids containing data indicating the SST to be more than one standard deviation below and/or above the mean of all grids (n = 192) was evaluated. The percentage of areas with positive variability (> +1 sd), negative variability (< −1 sd) and those within the normal range (within ±1 sd) were estimated for individual monthly periods, as well as the aforementioned yearly periods.
To understand the changes in SST in the coastal areas, specified grids were selected to indicate the SST change during the period of 1963–2010. As shown in Figure 1, four areas (NW, NE, SW, SE) were selected to determine the monthly sea surface temperature anomalies (SSTA) time series using the following equations:
S S T ¯ m = y = 1963 2010 S S T ¯ y m n
S S T A y m = S S T ¯ y m S S T ¯ m .
In the above equations, y and m denote the year and month, respectively, and N denotes the year.
The time series of the monthly SSTA of certain areas were used to calculate the annual SST offset relative to the base years (1963–2010). This study also calculated the monthly cumulative SSTA (C-SSTA) to assess the total gain and loss of heat in terms of the SST. The C-SSTA of a certain year and month was defined as the summation of all the SSTA values prior to that year and month.

2.4. Correlation between Seasonal Catch and Regional SSTA

The Pearson correlation coefficients ( r ) between the seasonal catch proportions (spring, summer, fall, winter) and the corresponding seasonal SST averages in each grid (n = 192) were calculated. These coefficients were used to create contours denoting spatial areas with significant coefficients (p < 0.05, r > 0.30 or r < −0.30). Areas with significant correlations (p < 0.01, r > 0.35 or r < −0.35) represented the key waters having a decisive effect on the total catch of each season in Taiwan.

3. Results

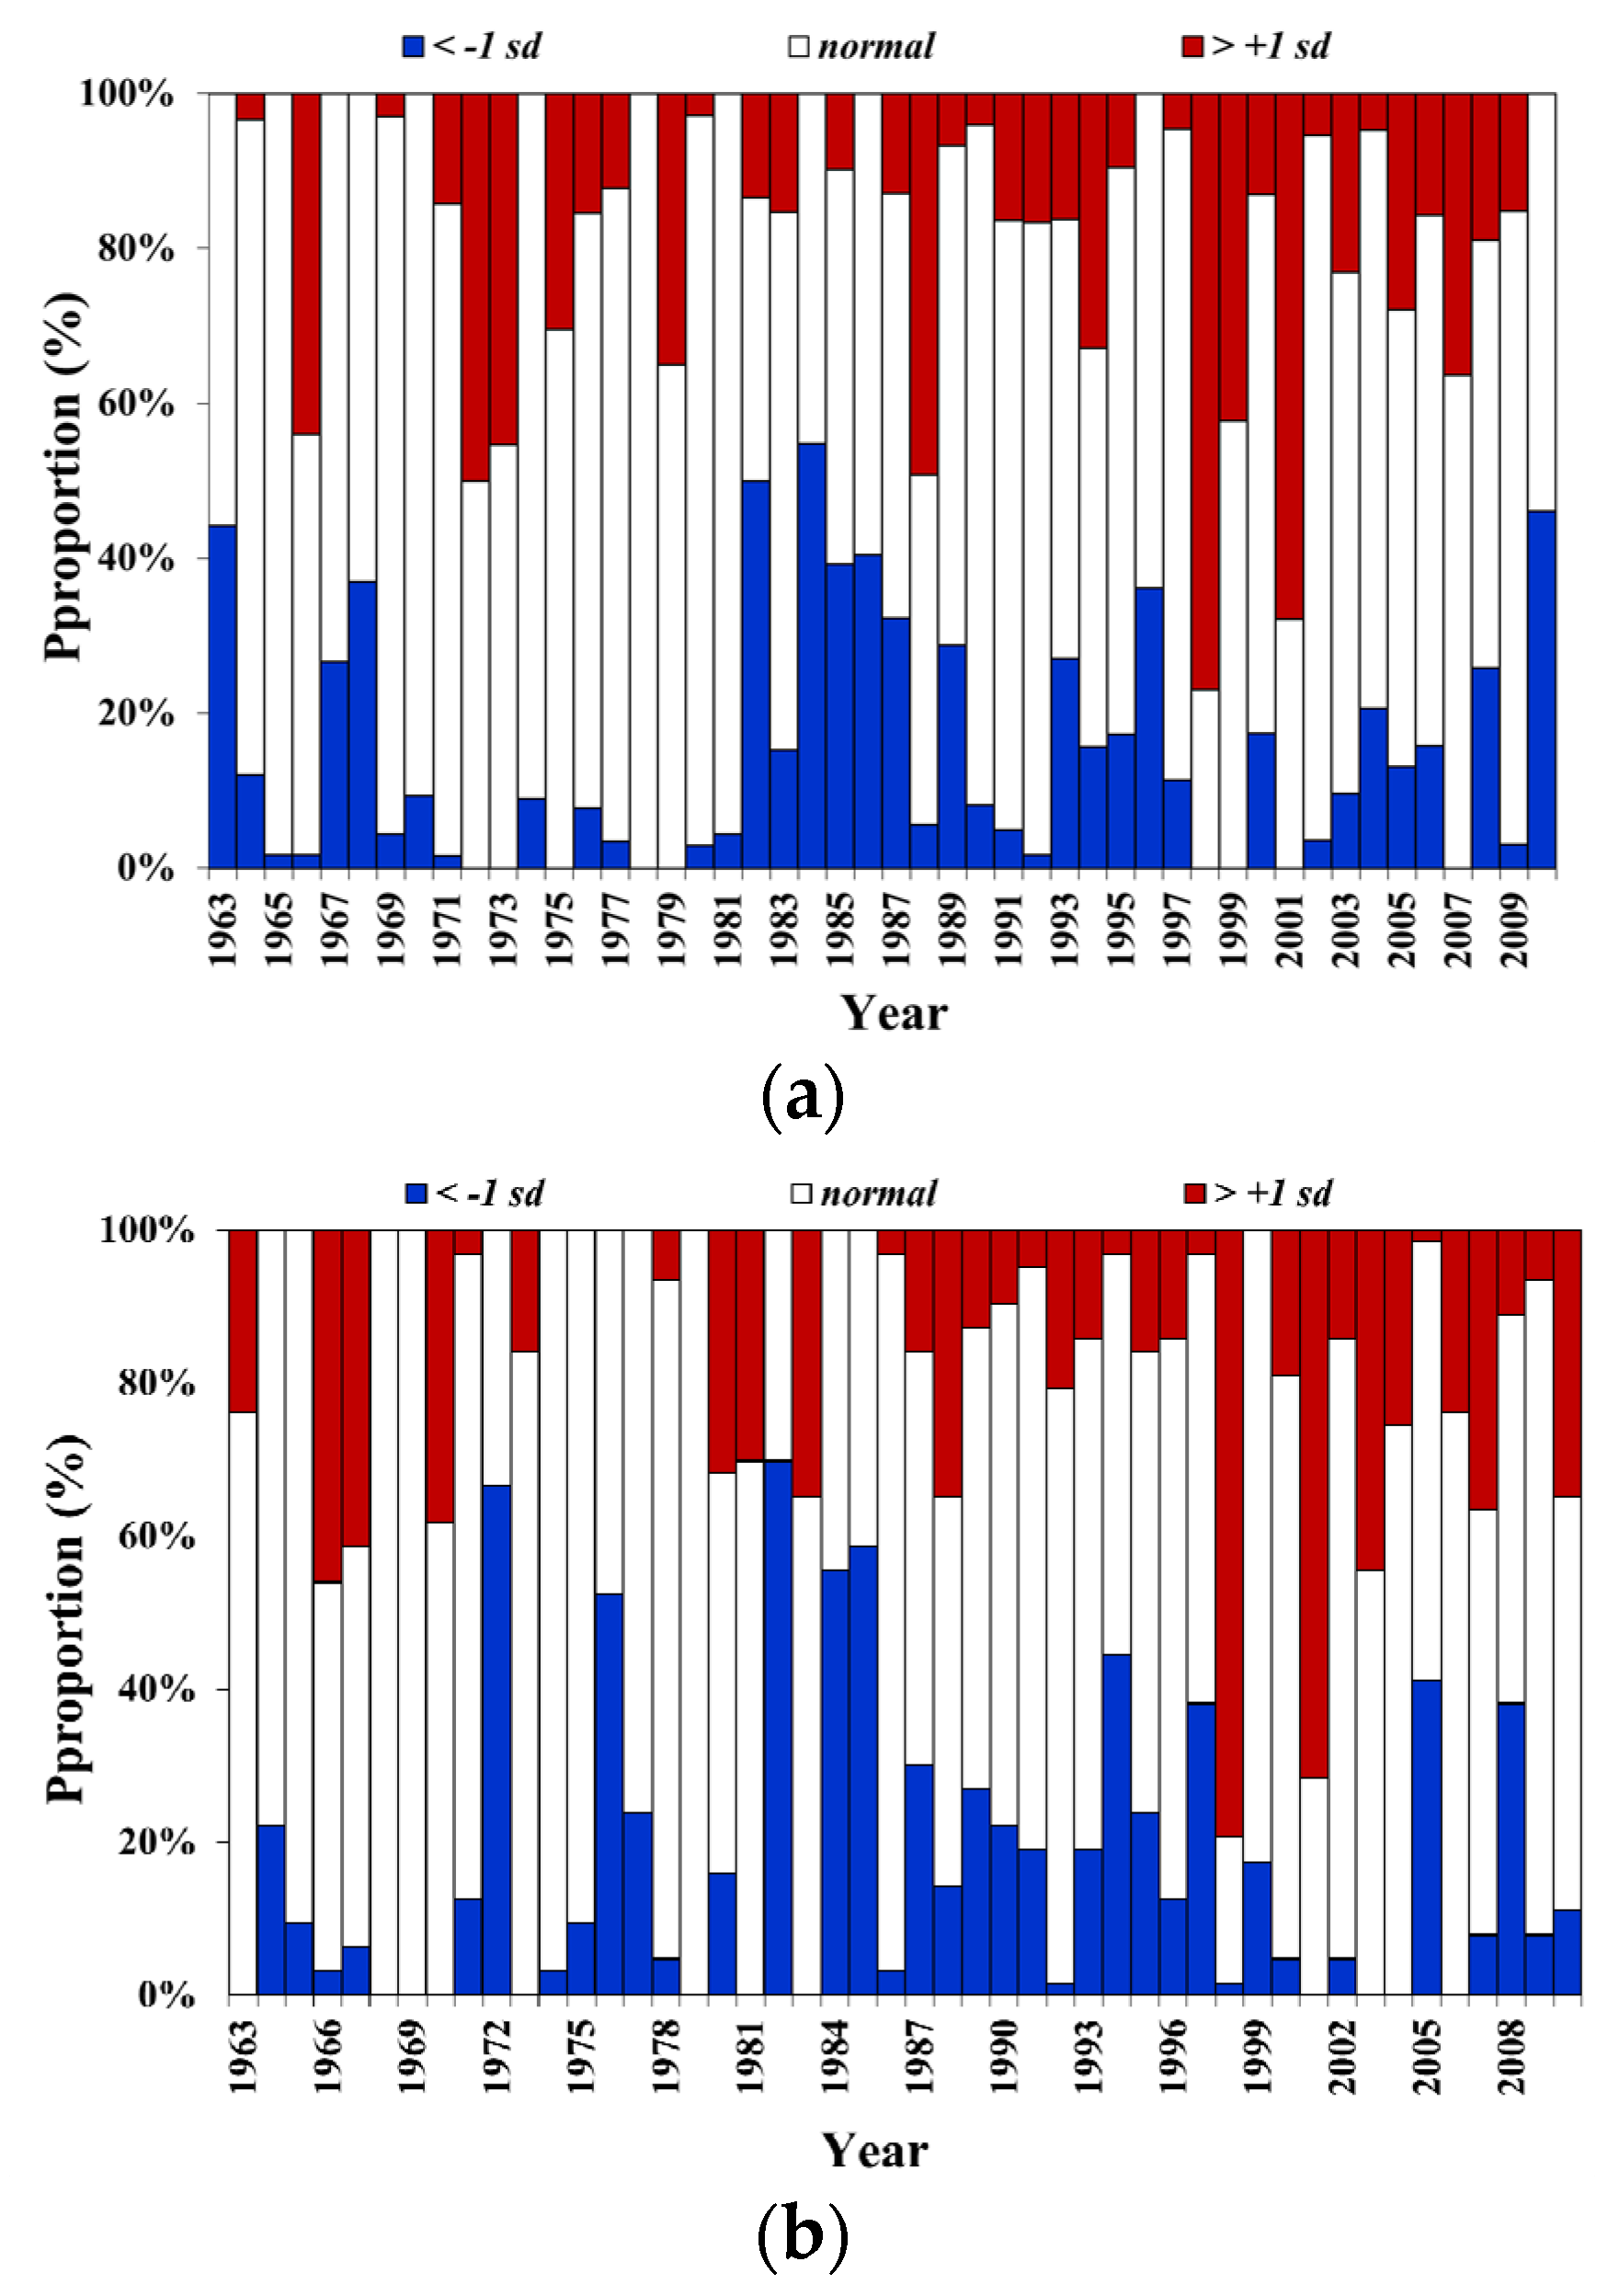
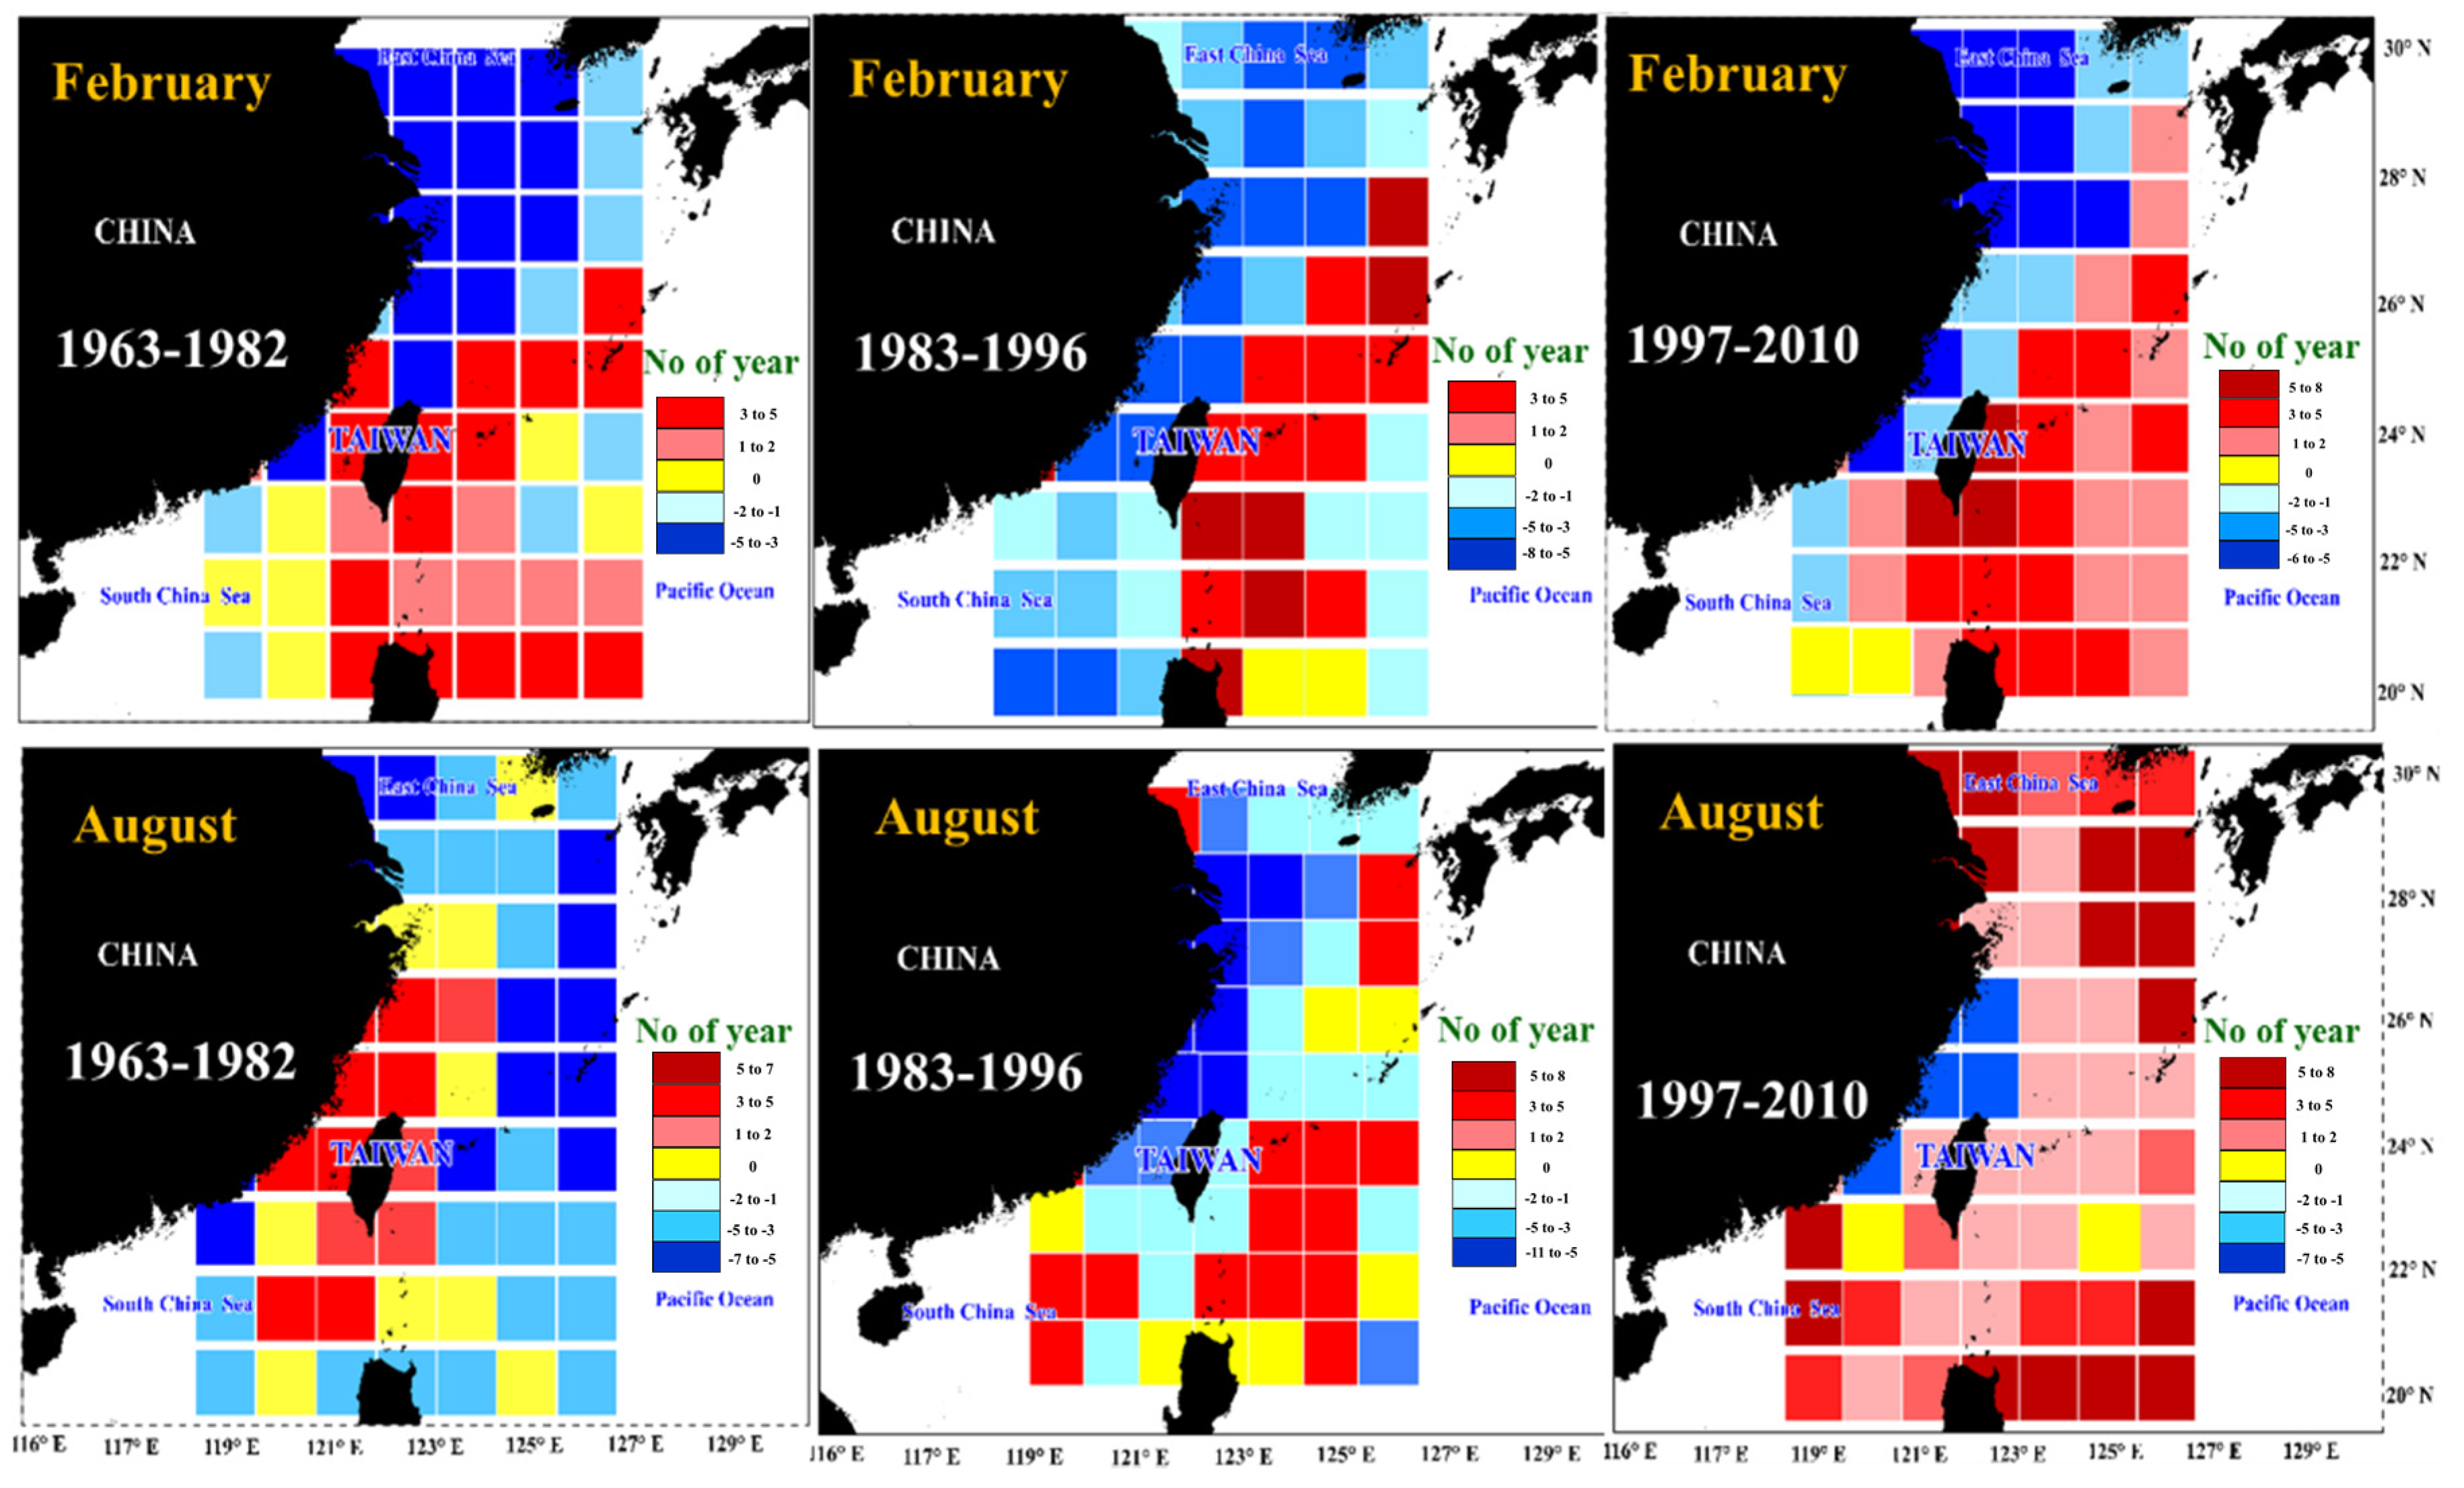
3.1. Data Segregation and Seasonality Determination

According to the ANOVA results and the independent-sample T tests of the SI for the 48 species, there were 31 species with significant seasonality, representing 65% of the total number of species examined. Among these 31 species, 20 species (42%) were classified as single-season migratory species, and 11 species (23%) were classified as two-season migratory species (Table 1, Table 2 and Table 3).

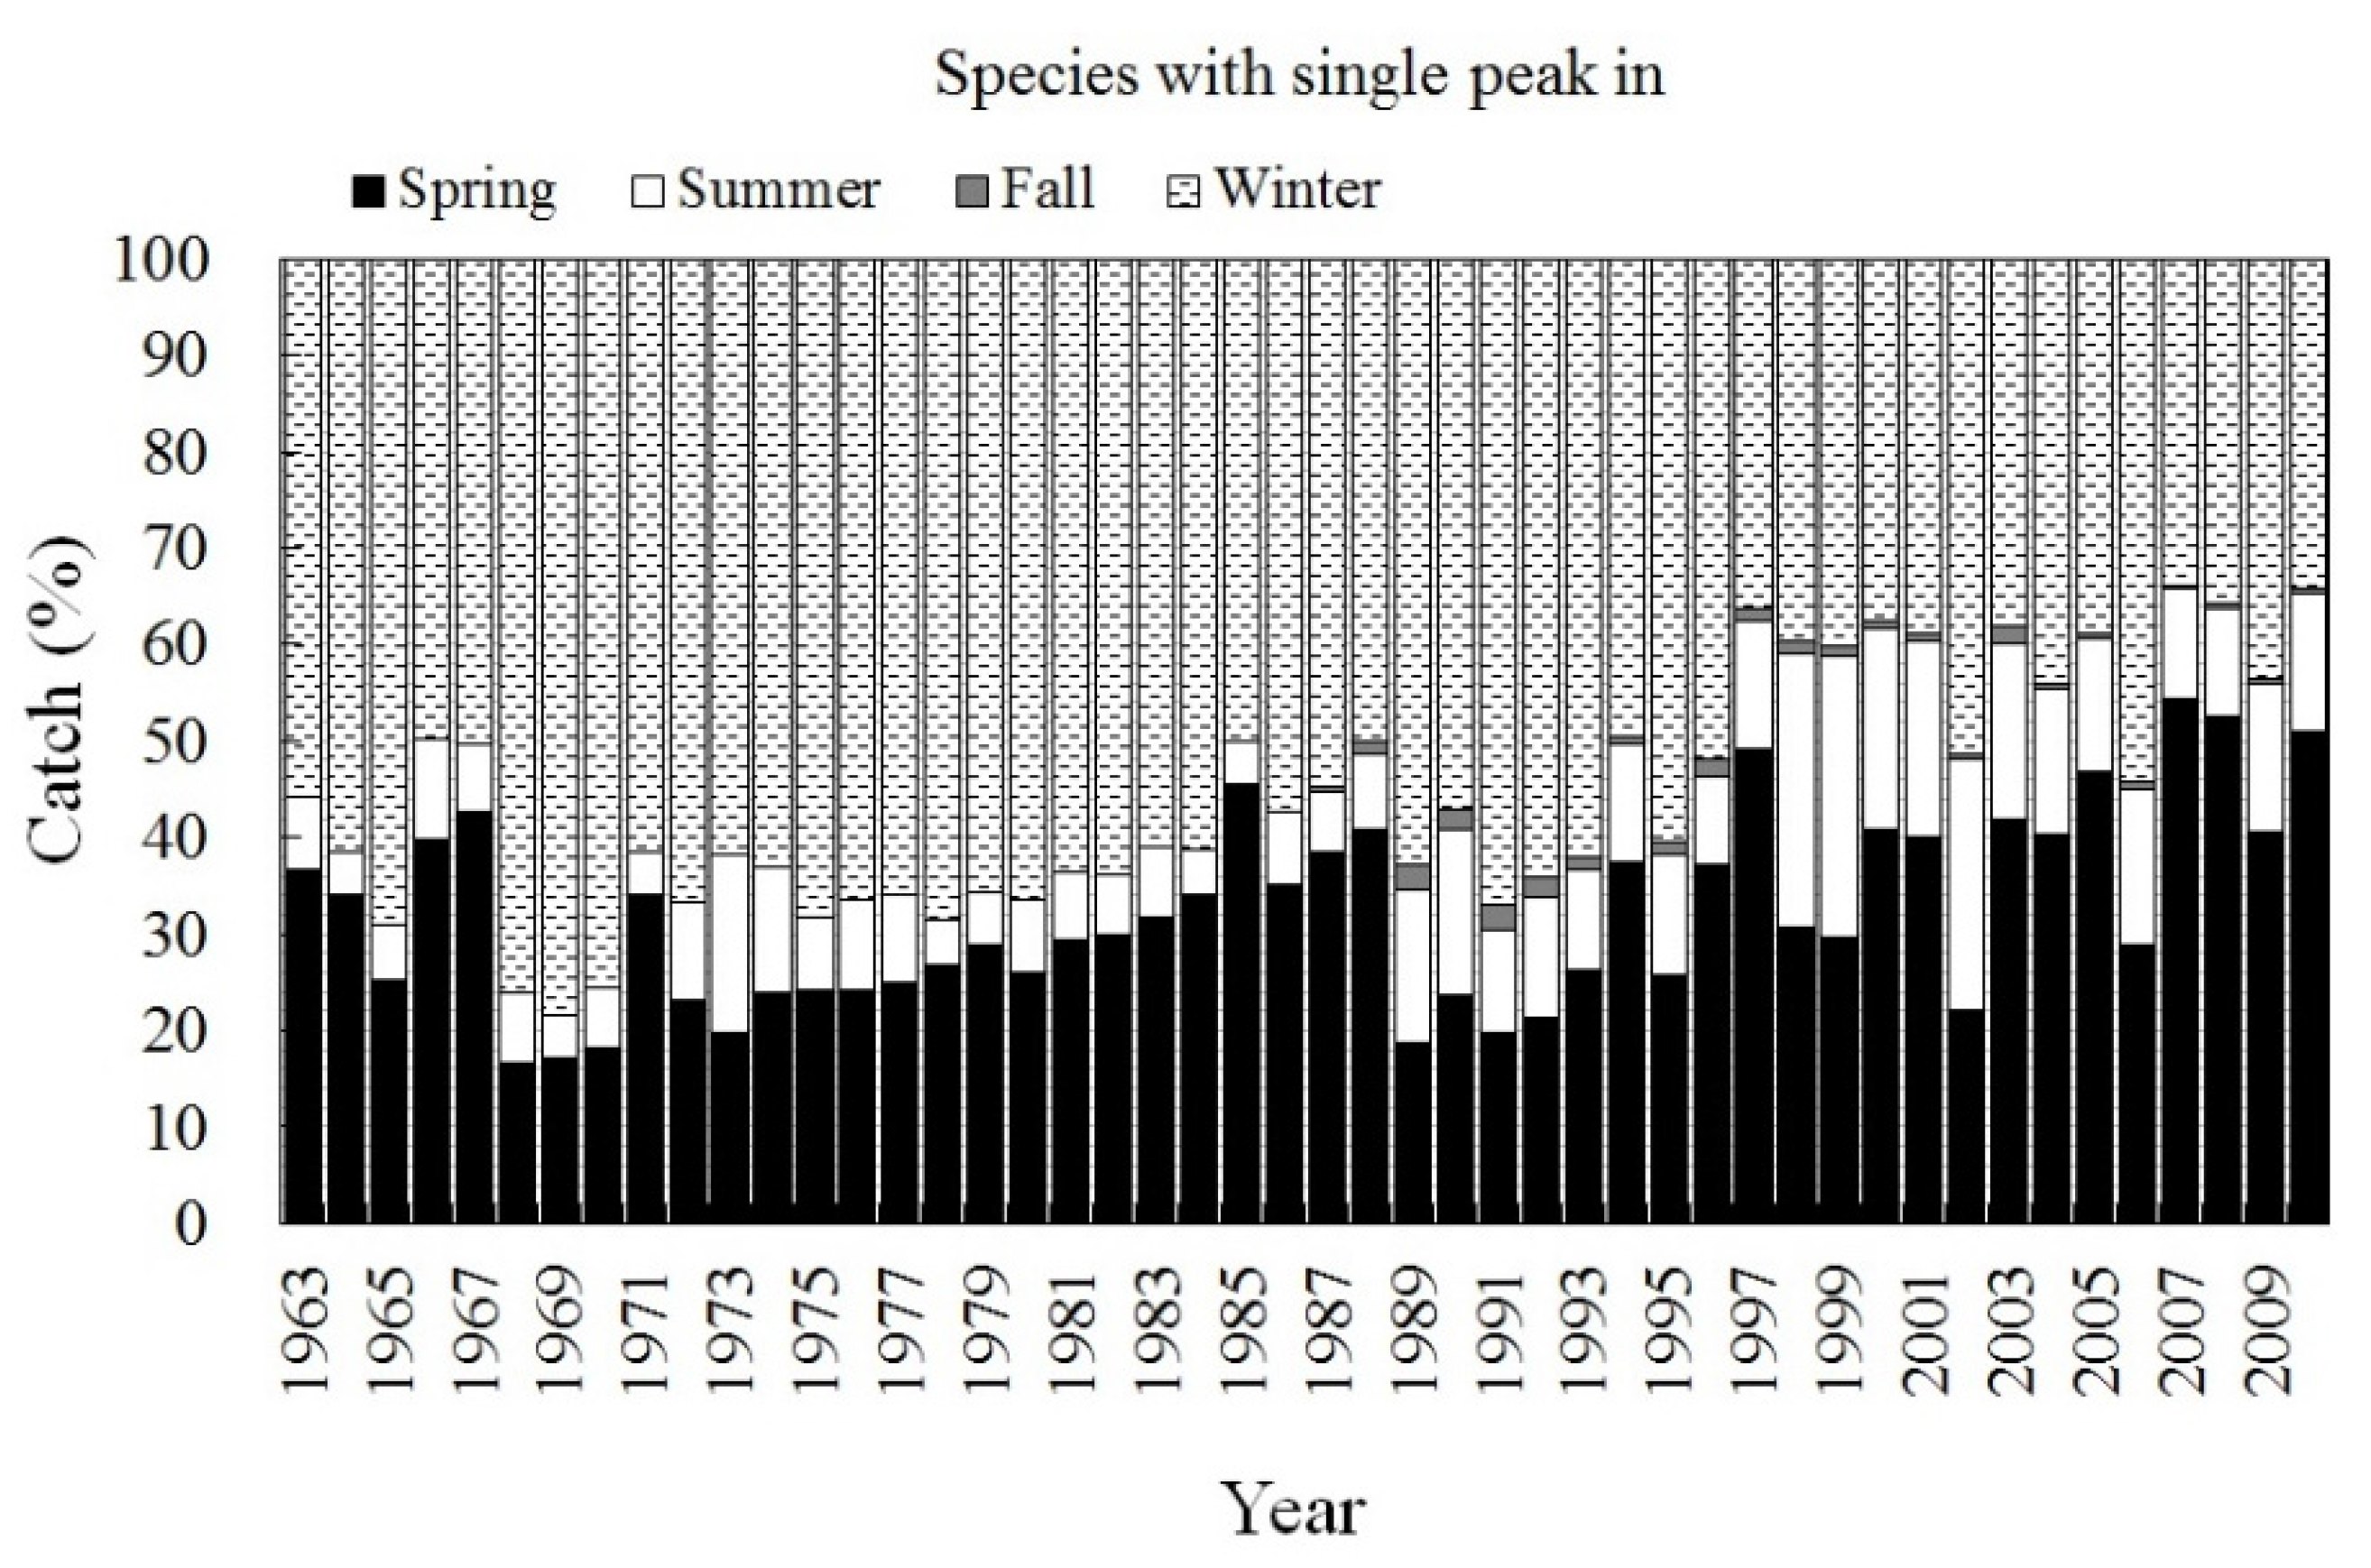
3.2. Trend of Catch Proportion for Single-Season Fish

The single-season catch proportion of winter fish species was approximately 60% before 1995. The proportion of spring species and summer species catches represented more than 50% of the total fish catch beginning in 1997. In 2009, the catch of spring species and summer species represented approximately 50% and 15% of all single-season catches, respectively. Conversely, the winter species proportions began to decline from 70% to 30–45% (Figure 2). For the single-season species, the results of this research suggest that winter and/or spring species were diminishing year after year and that summer and/or autumn species gradually began to dominate the catch.

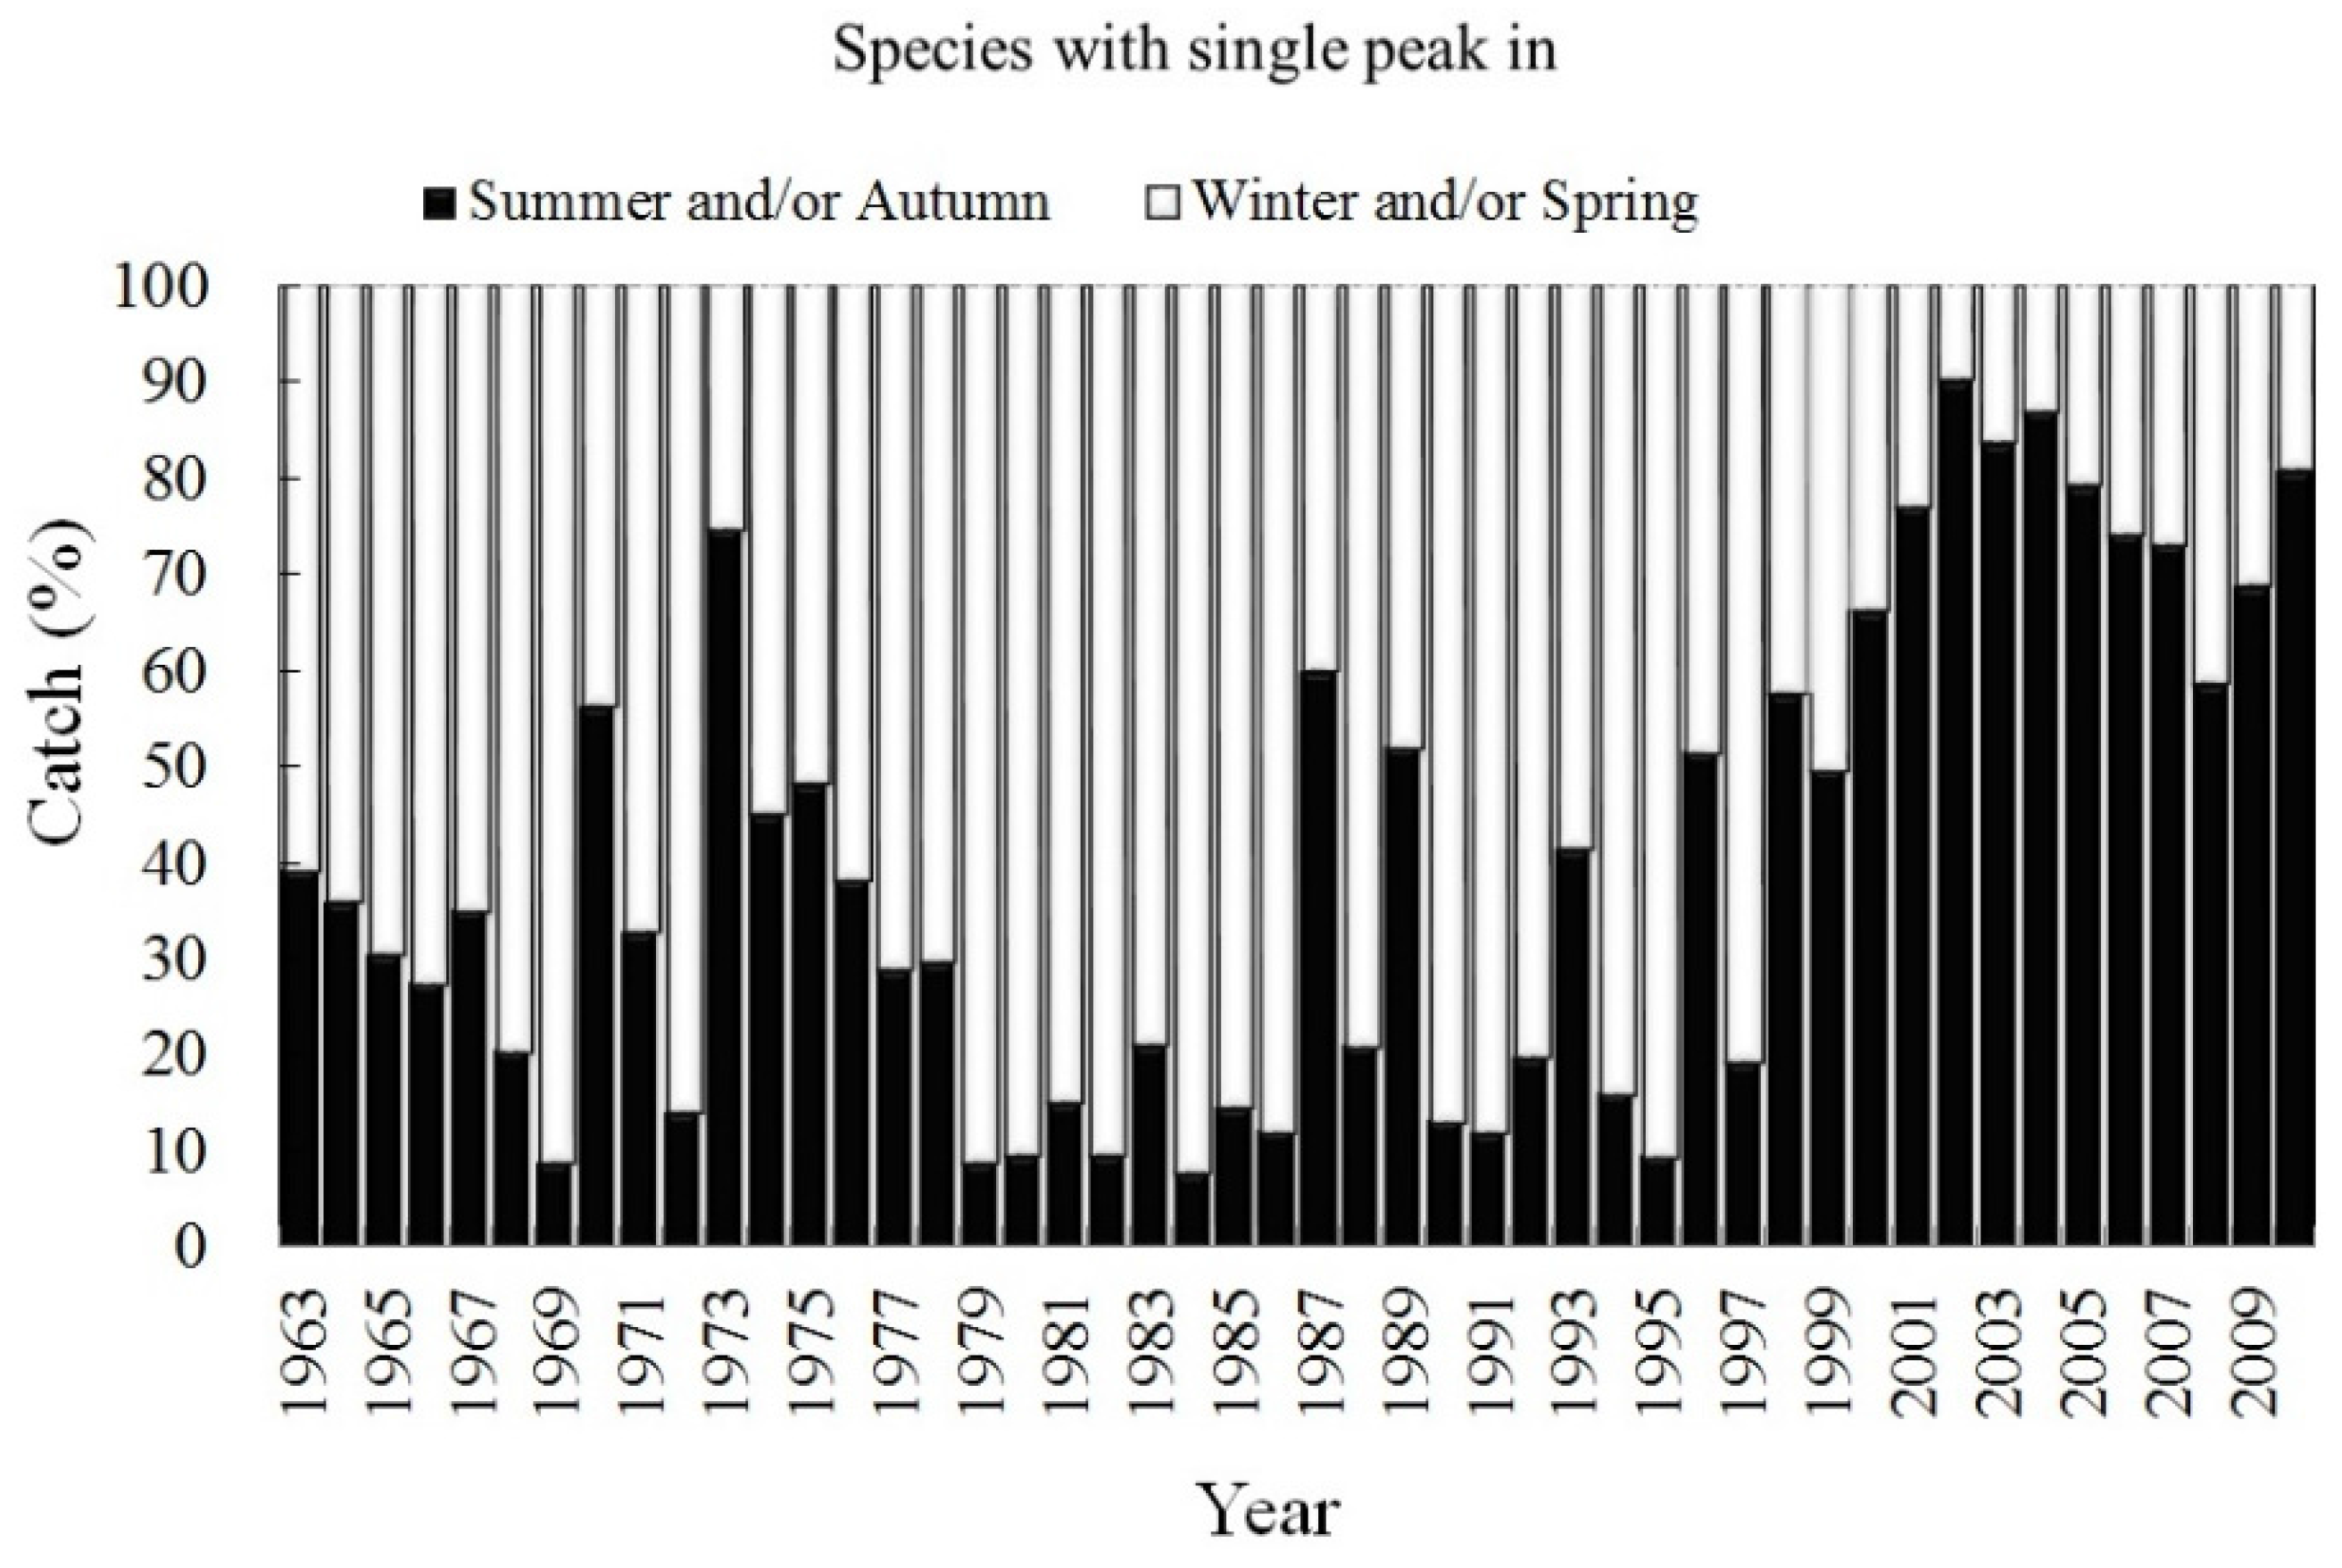
3.3. Trend of Catch Proportion for All Seasonally Migratory Species

Figure 3 illustrates the fish catch data, including all seasonally migratory species (including single-season and two-season migratory species) during the period from 1963 to 2010. The proportion of winter and spring species in total catch during the period 1979–1986 was approximately 90%, and has declined since 1998. Before 1998, approximately 10% to 20% of the catch proportion represented the summer and fall species; however, after 1998, these species proportions began to increase (Figure 3).

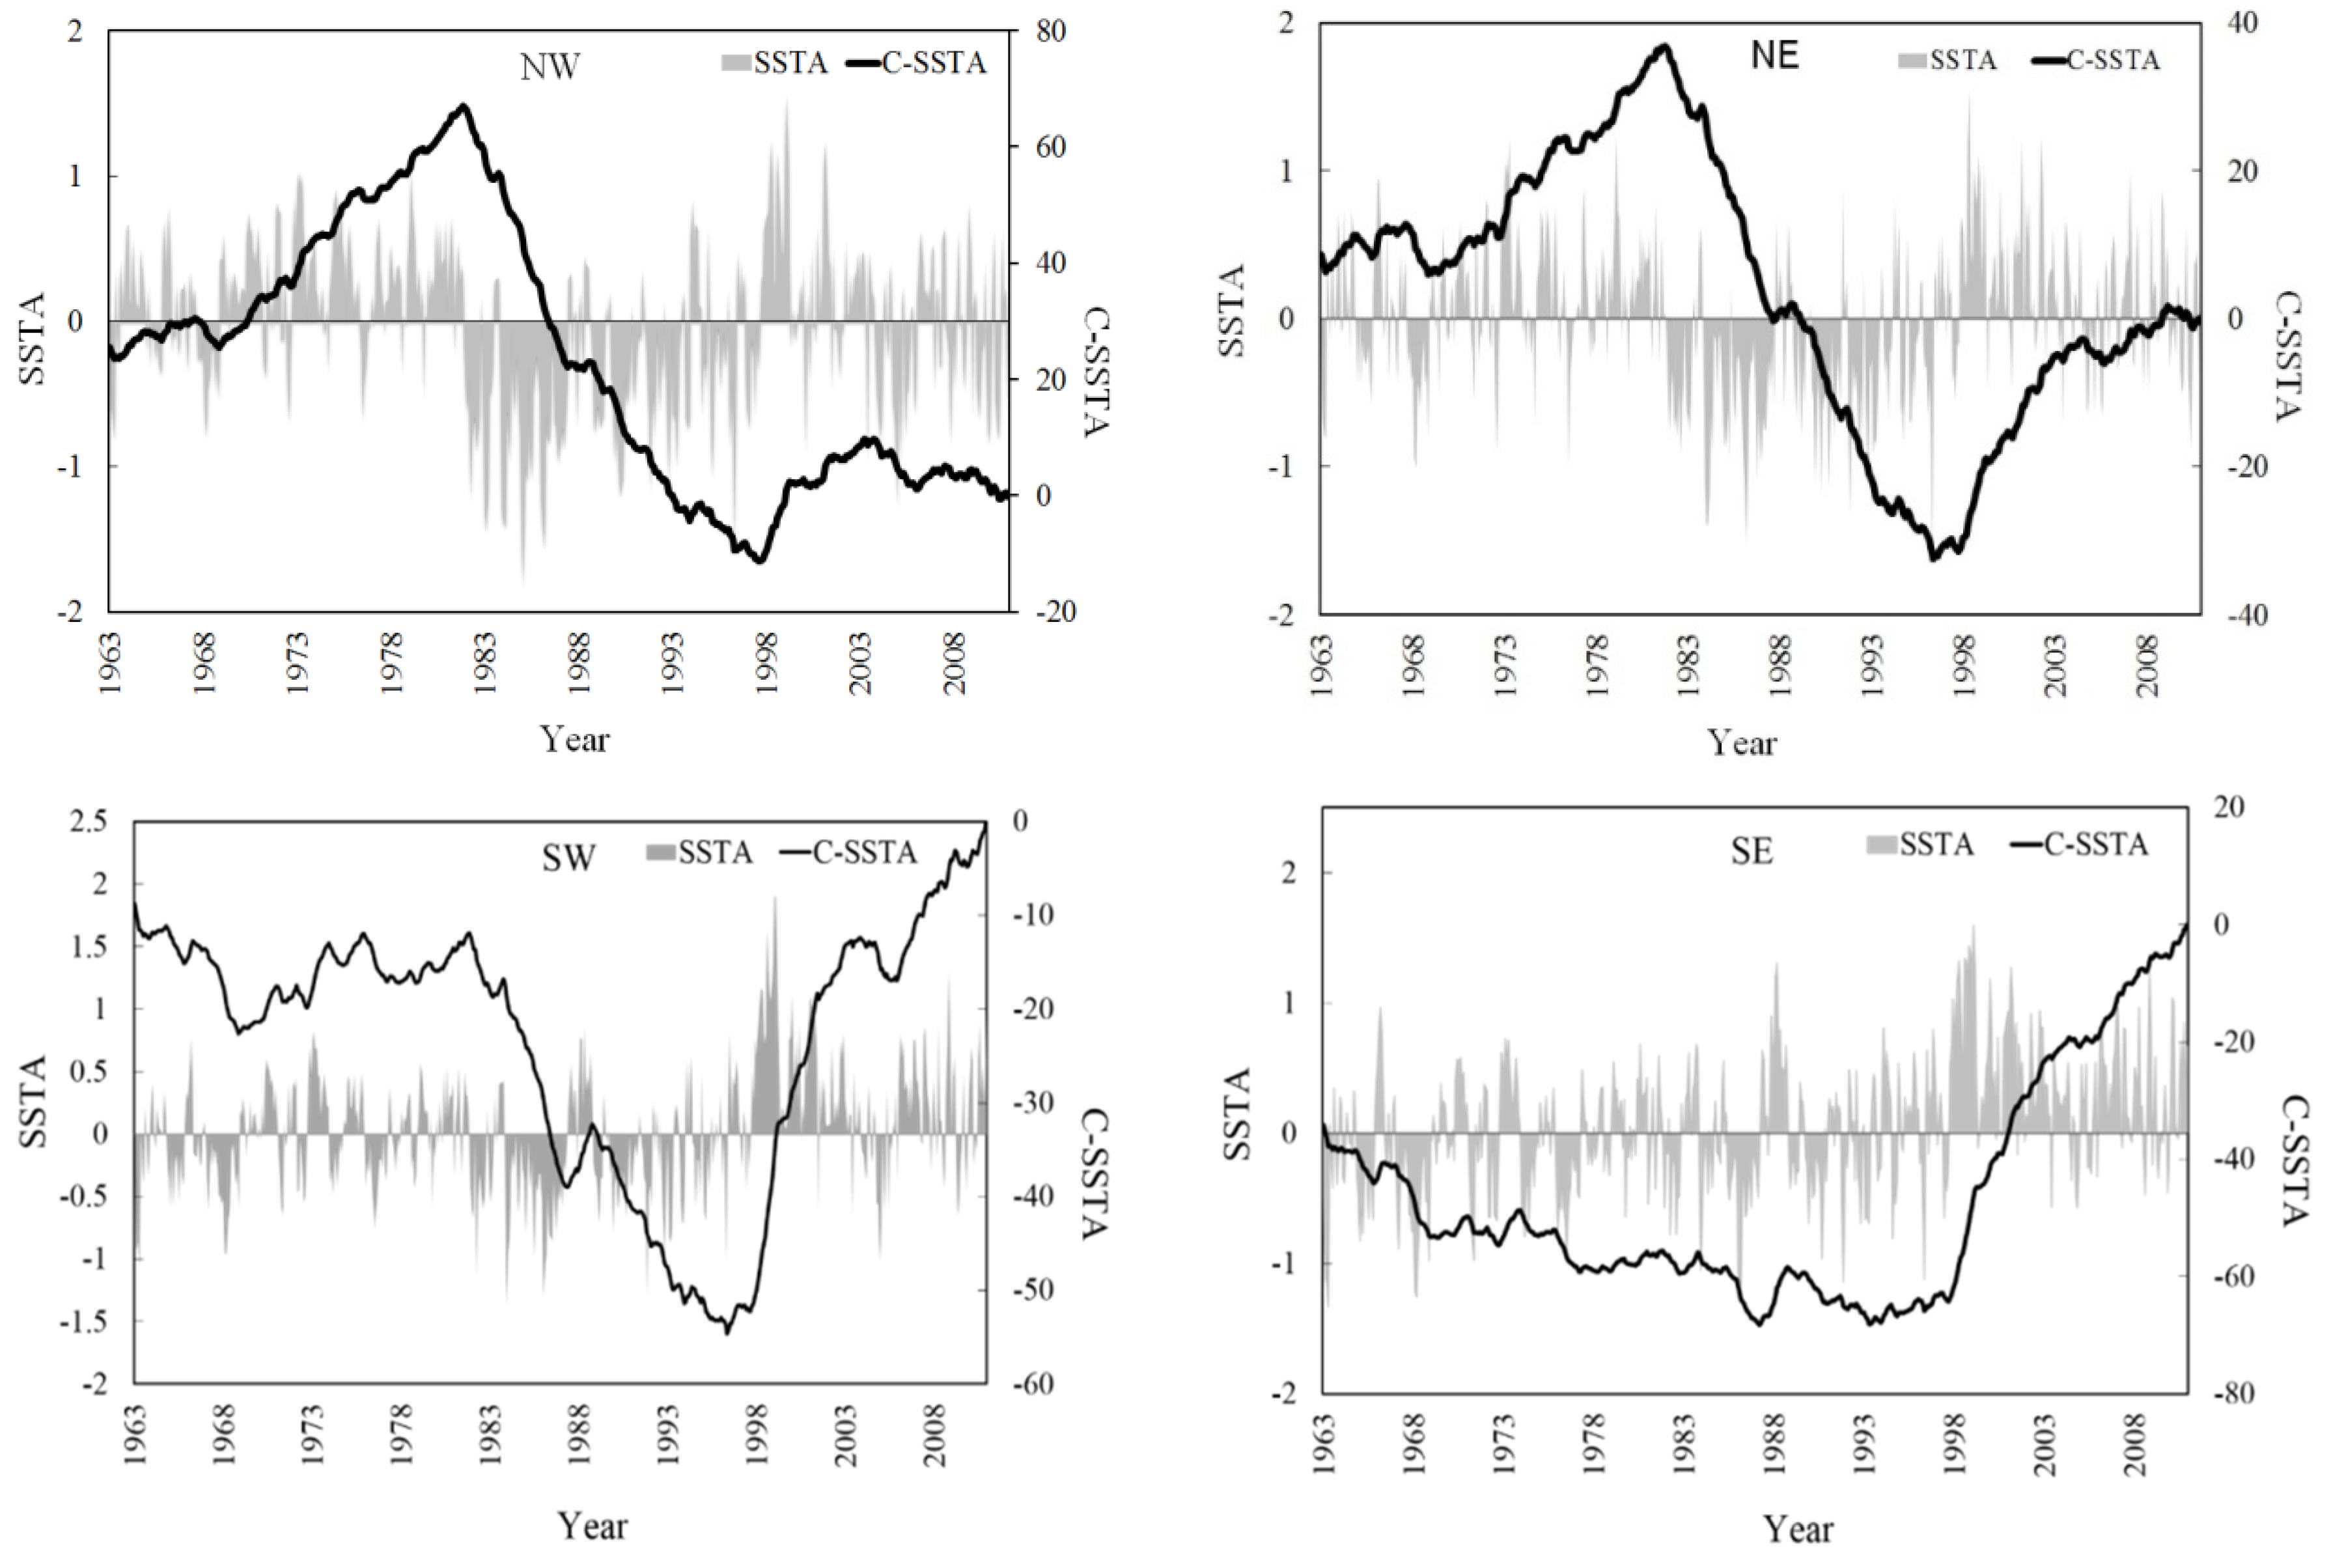
3.4. SST Change Trends in the Surrounding Waters of Taiwan

As shown in Figure 4, areas with negative SST variability (< −1 sd) decreased over time, whereas areas with positive SST variability significantly increased (February: r = 0.305, p = 0.034; August: r = 0.326, p = 0.023). The highest increased amplitude of the SST in the past decade was in the continental shelf areas of the eastern and southern strait (Figure 5). Since 1997, the rate of increase of SST in Taiwanese waters has accelerated, and the variability has also increased. The increase in SST was characterized by a shift in ocean currents. These changes were directly related to the diminishing CCC and the enhancement of the KC (Figure 5).
Figure 6 shows the SST variability in the four areas from 1963 to 2010. As observed in the figure, the variation trends of accumulative anomalies of the SST (C-SSTA) differed between the northern and southern areas before 1997. In the northern areas (NW, NE), C-SSTA had increasing trends before 1982; however, the southern areas (SW, SE) indicated the opposite trend. From 1983 to 1997, the C-SSTA of the areas decreased, particularly rapidly in the northeast regions. After 1998, all areas experienced warming trends. There was a change in the NW region with the SST declining rapidly between 1980 and 1996. The declining C-SSTA trend was greater in the NW region compared with other regions, despite the slight SST increase after 1998. According to the long-term trend in the C-SSTA, the warming of the SST in the NW was slower and lower than it had been previously.

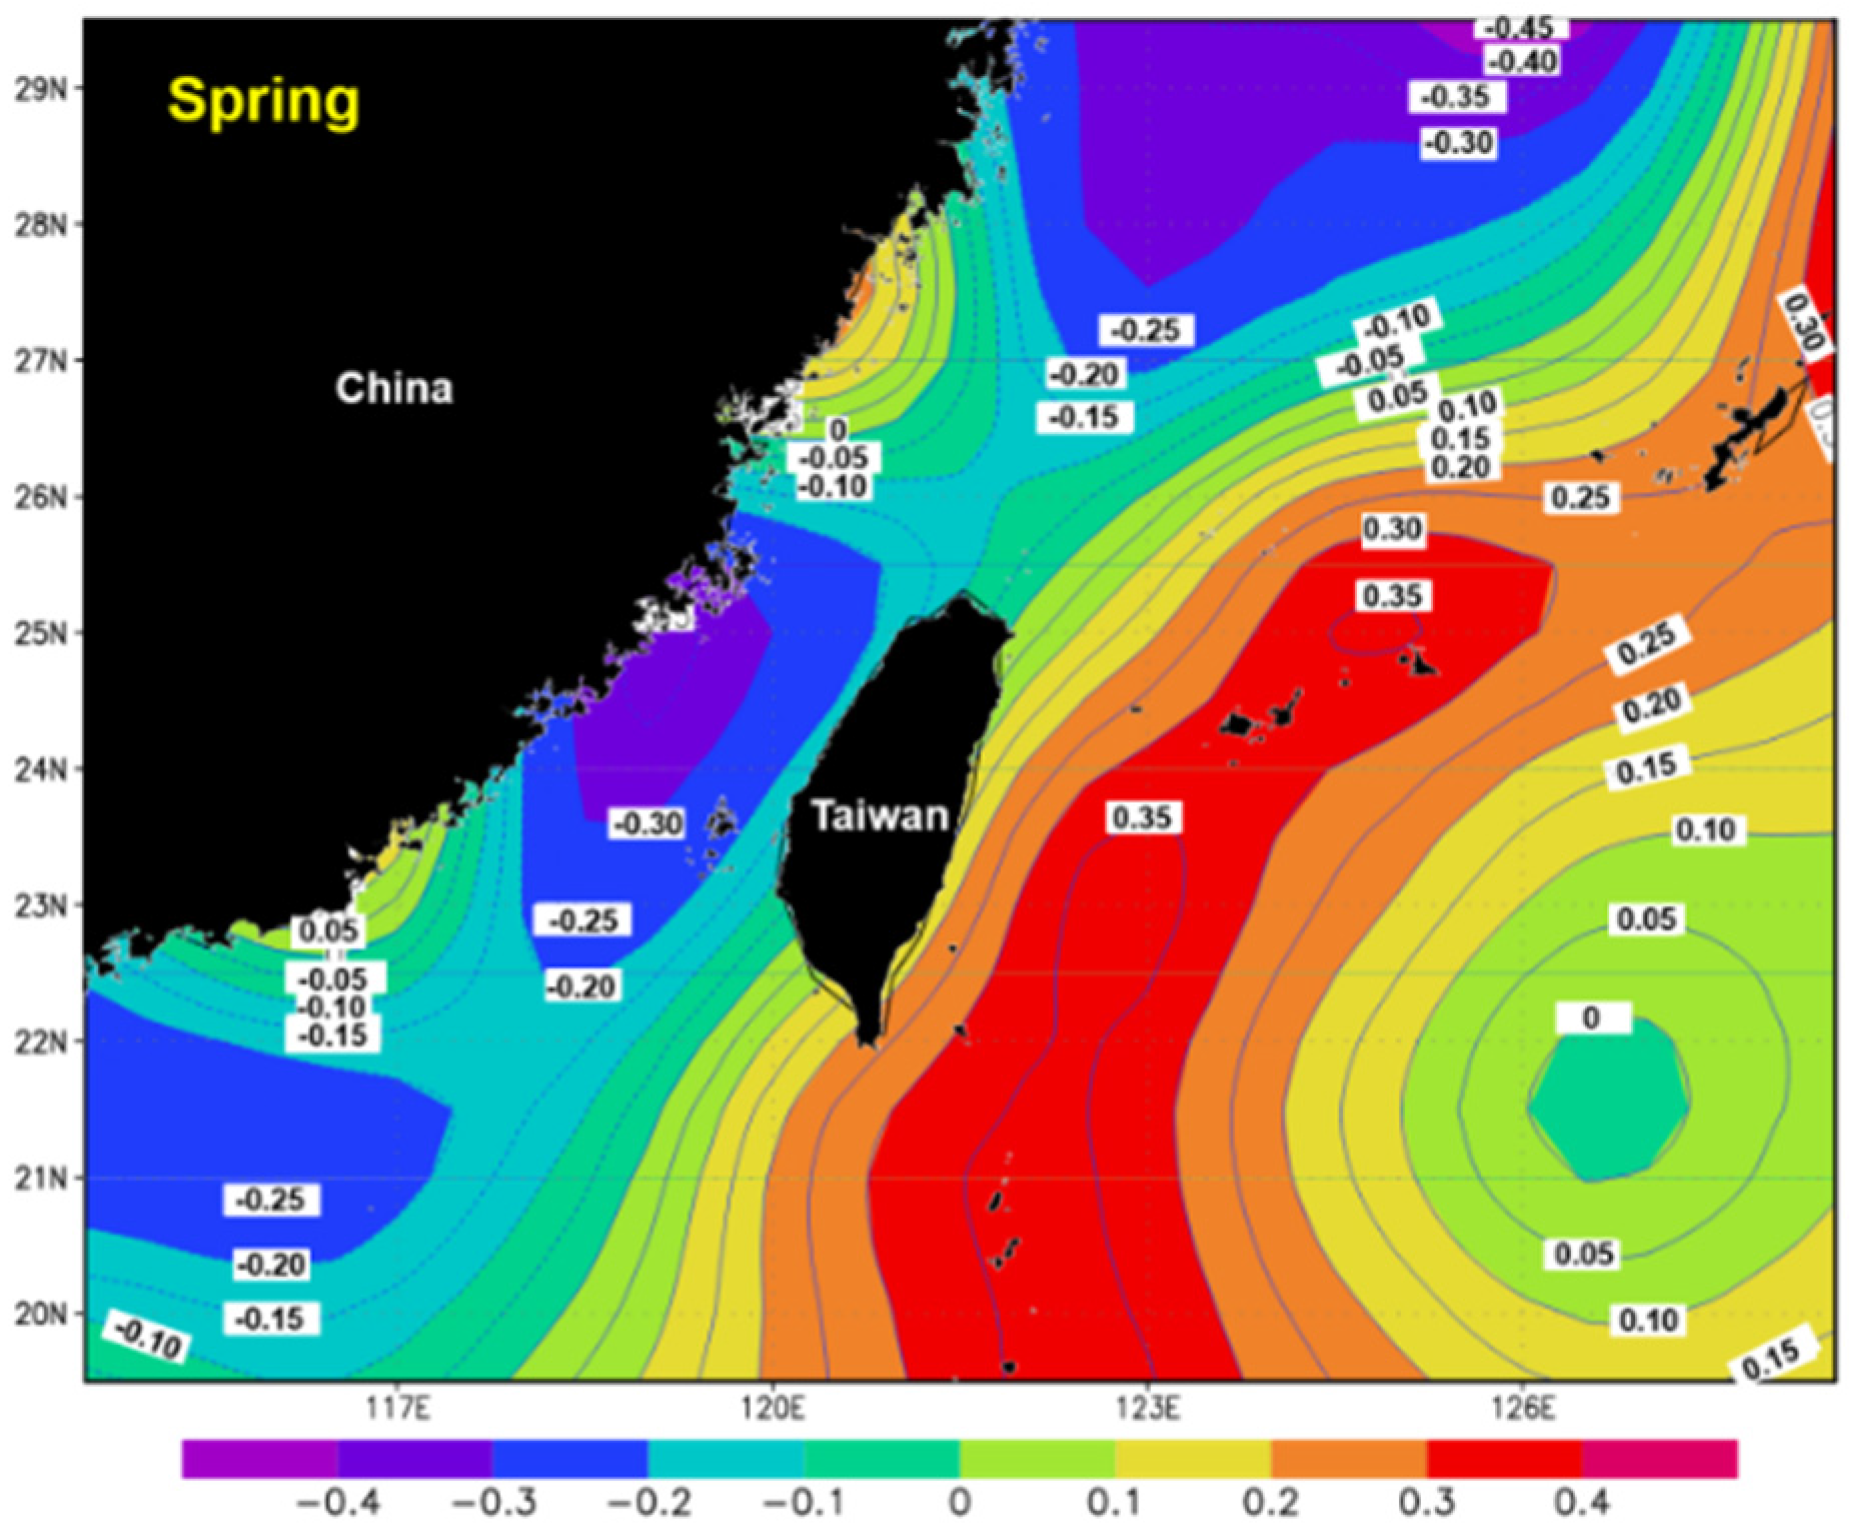
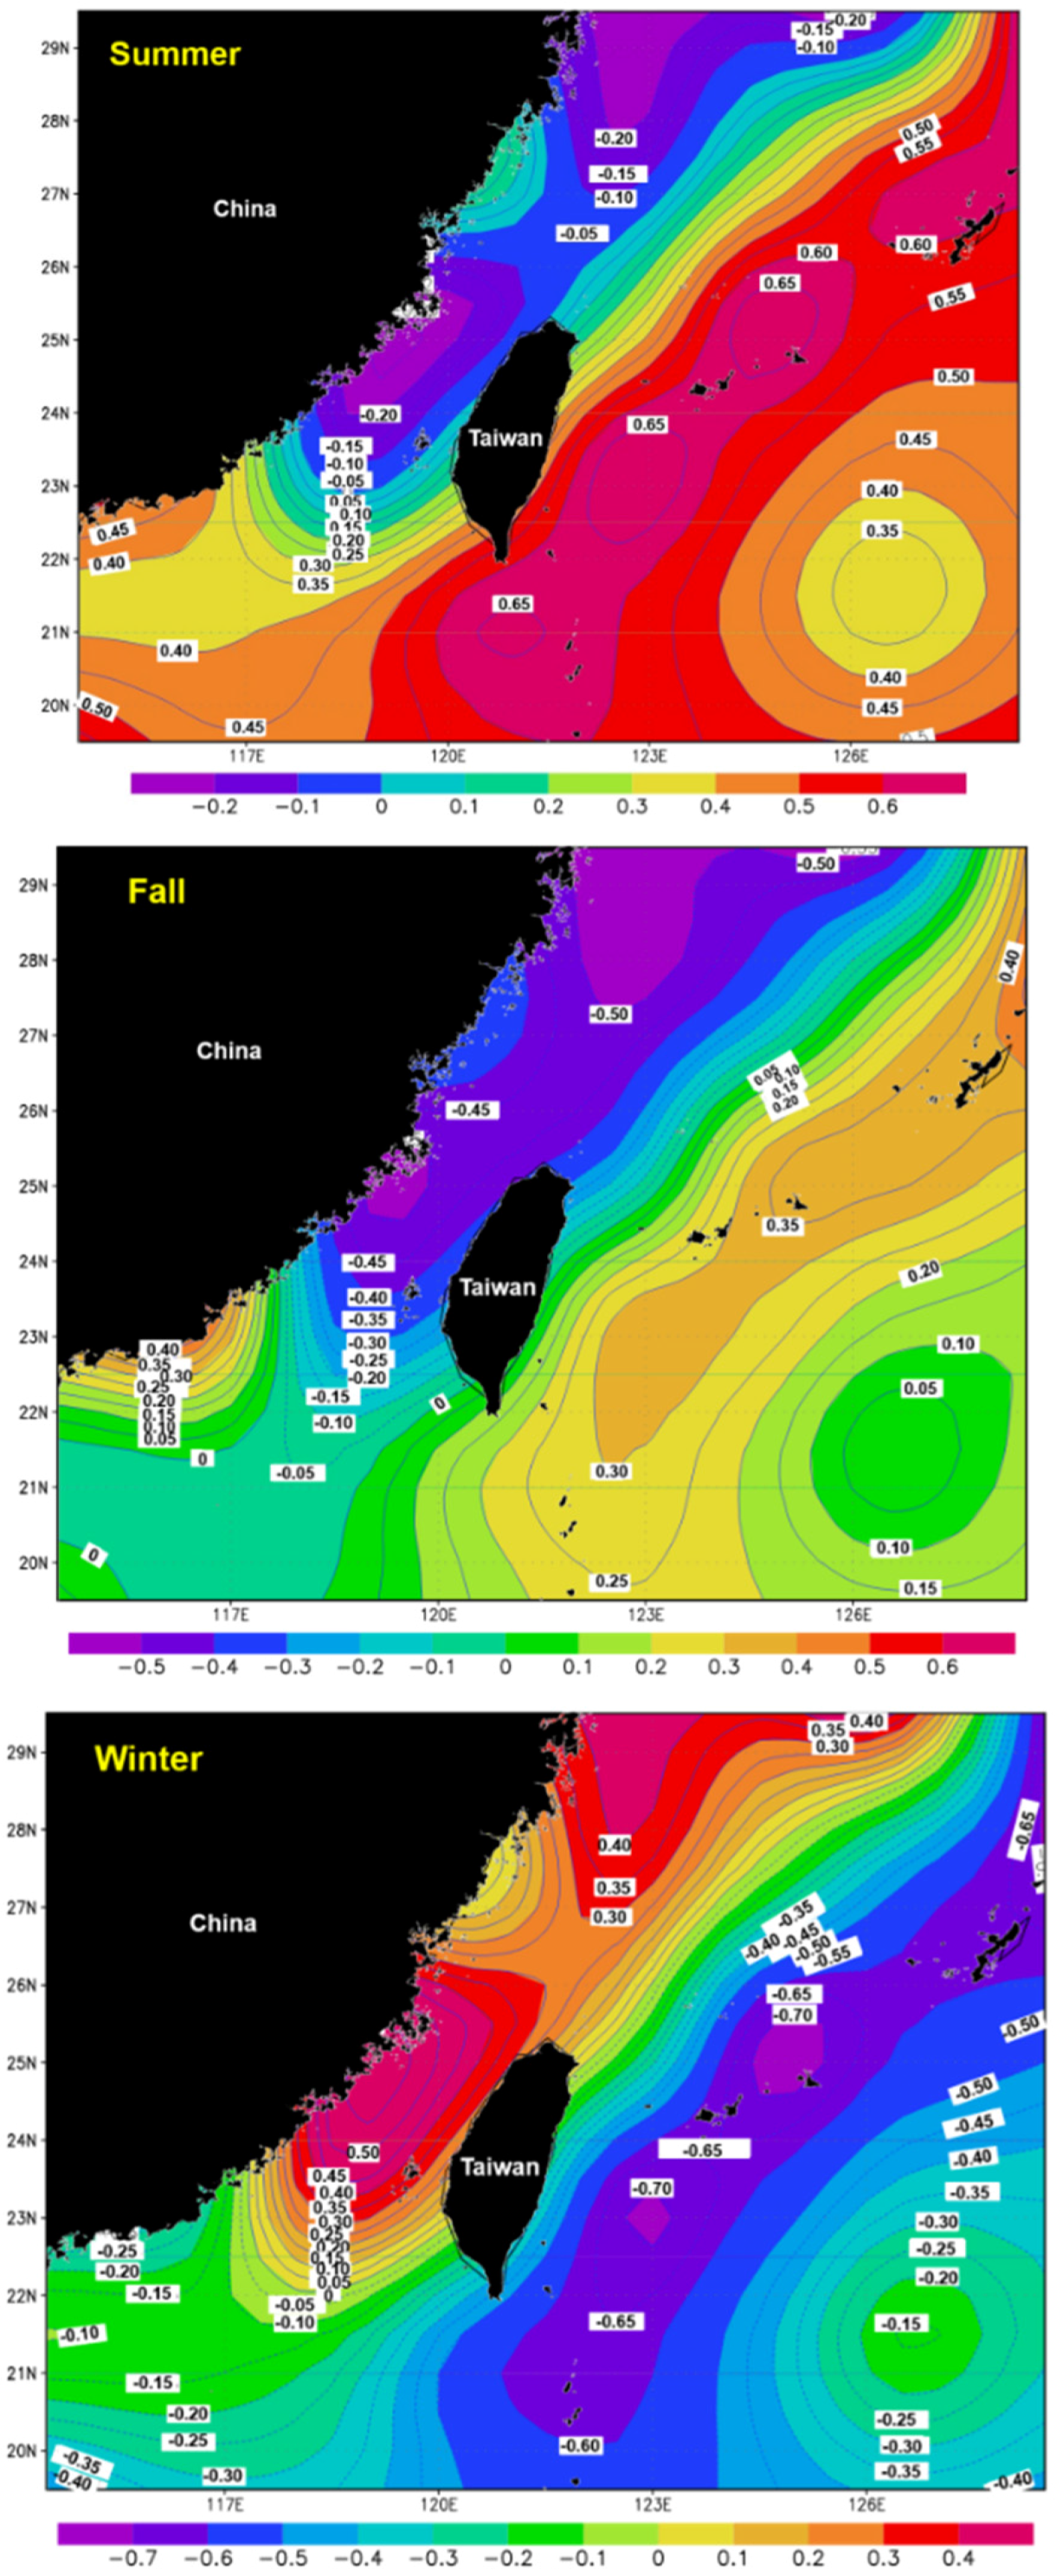
3.5. Spatial Distribution of the Correlation Coefficients between Catch and SST

The spatial distribution of the correlation coefficients between the catch proportion and SST shows that areas with statistically significant r values were primarily located in the continental shelf region in the west and the deep ocean in the east. Areas covered by KC had the highest negative and positive correlation values in the spring, summer, and winter (Figure 7).
The spring and summer catch proportions were significantly positively correlated with the SST in the east (spring: r = 0.35, * p < 0.05; summer: r = 0.60–0.65, ** p < 0.01). This finding indicated that SST increases produced an increase in the catch proportion in the spring and summer months, such as southern mackerel, slender snoek, and bullet tuna. In the fall, the catch proportion and the SST in the west were negatively correlated (r = −0.45, ** p < 0.01). In the winter, the eastern SST and catch proportion had a significant negative correlation (r = −0.60–−0.70, ** p < 0.01). This indicated that a SST increase caused a decrease in the catch proportion, including black pomfret and red stingray. However, according to the C-SSTA of the NW area in Figure 6, the SST warming was not significant in the west and was even lower than the warming that occurred in the 1990s. The catch proportion in the winter and the SST reduction in the west were positively correlated (r = 0.30, * p < 0.05).

4. Discussion

The 1963–2010 SST in the waters surrounding Taiwan showed increasingly positive variability after 1988 (February: r = 0.305, p = 0.034; August: r = 0.326 p = 0.023). In contrast, the negative variability proportion gradually declined (Figure 4). The reasons for this trend are related to the weakening of the CCC and the strengthening of the KC (Figure 5). The weakening of the winter high pressure caused the CCC to extend to the coastal waters of western Taiwan. The KC strengthened gradually (Figure 5). As observed in Figure 6, although the variation trends were different between the north and south regions before 1997, all four regions experienced increases in SST after 1997. The upward trend is significant. A significant intrusion of the KC onto the East China Sea shelf occurred from fall through winter, and the intrusion was associated with monsoon events [7,8,9]. The frequencies of the KC intrusions have steadily increased in recent decades, consistent with the theory of a more efficient spreading of heat from the KC, as evidenced by the observed coastal warming [24].
The results of the Pearson correlation analysis revealed that the SST in the KC influence areas has a more decisive effect on the tendency for the catch proportions to fluctuate in spring, summer, and winter than the areas dominated by the CCC (Figure 7). The SST increase in the KC enhanced the catch proportion of fish showing spring and summer seasonality (Table 1). In contrast, the catch proportions with winter seasonality were inhibited. Such increases in the catch proportion with spring and summer seasonality were particularly rapid after 1997, when warming accelerated (Figure 2). A similar phenomenon was also discovered in the catch composition from sea-net fisheries in northeastern Taiwan during the period 1993 to 2011 [6]. The proportion of fish associated with the KC gradually dominated the catch after 1997.
In this study, we changed the original fisheries catch data to reflect the long-time trend of Taiwan’s coastal fisheries and to enhance the reliability and accuracy of our analysis.
The seasonality analysis of 48 time-series data sets of fishery catches suggested that summer and/or autumn species, such as southern mackerel, slender snoek, red sea bream, and bullet tuna, have gradually replaced winter and/or spring species, such as chub mackerel and jack mackerel (Figure 2 and Figure 3; Table 1 and Table 2). Even in the summer, south-to-north migratory species, e.g., the bullet tuna, were more dominant than the north-to-south migratory species, e.g., the sword tip squid (Table 2). In addition to the population changes in the winter and/or spring and summer and/or autumn species (Figure 2 and Figure 3), with the northerly retreat of the CCC (Figure 5 and Figure 7), certain fishing grounds have gradually moved northwards. For example, mullet in the coastal waters of Mainland China have migrated with the CCC to the coastal waters of southwestern Taiwan to spawn during December and January [18,20]. Before 1997, the production of mullet was as much as 300 tons in the coastal waters of Taiwan. Because of the weakening of winter high pressures, however, the CCC does not reach the southern waters of western Taiwan and the mullet catch has decreased [20].
The catch level and the structure of the fish community have been affected by climate change and oceanic regime shifts. The catch proportion of the summer and/or autumn species, mainly consisting of fish with spring and summer seasonality, increased greatly (Figure 2 and Figure 3). Under the warming trend, however, in association with SST variability, species gradually decreased after 2005 (Figure 4, Figure 5 and Figure 6). The catch proportion of the winter and/or spring species also gradually increased as the SST gradually decreased (Figure 2 and Figure 3). For example, the red sea bream (a summer species) catch proportion was approximately 9% to 47% before 1990, but the population gradually increased after 2005. Similar phenomena can be found for mullet [6,19,20]. Similar regime shifts of fishing communities have been observed in neighboring countries.
Japan is also located near the fastest warming marine waters; the 1976/1977 and 1987/1988 regime shifts significantly influenced the ecosystem of the Tsushima Warm Current (TWC) in the Japan/East Sea [11,12,13]. Warm-water large predatory fish and cold-water demersal species showed opposite responses to the changes in water temperature in the TWC region, indicating the significant impact of oceanic conditions on fishery production [13]. Regime shifts also occurred in Korean waters in 1976 and 1988 [25,26], as well as in the Kuroshio waters in 1987/1988 [11]. Moreover, Jung et al. (2014) [27] used a circulation model to project that the temperature stratification in the Korea Strait will disappear by 2030. They also used empirical relationships to predict that the ranges of five fish species will shift poleward by 19–71 km from the 2000s to the 2030s. Therefore, environmental variation caused by climate change was conspicuous and already severely affects global fishery resources and future fishery yields.
The catch ratio for species with a single peak in the spring increased steadily over time; however, those species with a single peak in the winter decreased (Figure 2 and Figure 3). The catch ratio for those species with dual peaks in both summer and fall varied greatly before 1978 (Figure 2 and Figure 3). Increasing trends began in the 1980s and accelerated until 1998 (Figure 2 and Figure 3). As a result of this increase, the previous concentration of the fishing season in the winter months became highly diffuse (Figure 2 and Figure 3). Such a brief recovery of the winter and/or spring species in reaction to the brief SST decrease cannot sustain the fish catch during the long-term warming trend.

5. Conclusions

In summary, the accelerated SST warming trends in Taiwanese waters occurring since the 1980s have caused changes in the catch proportions of seasonal migratory fish. The winter and/or spring species decreased over time, whereas the summer and/or autumn species gradually dominated the catch. The local marine ecosystems and fisheries face reduction in catches caused by the expansion of fish stocks from the south and withdrawal of fish stocks from the north. Frequent extreme weather and climatic variability during the warming process also influence stock supply. The findings of this study further indicate the distinct vulnerability of fisheries in countries with short coastlines.
The factors that affect changes in fish assemblages are complex [6,17]. Marine capture is a major factor in fishery resources alterations. Climate change may make fishery resources more vulnerable, which is a critical issue for sustaining fisheries across the globe in the future [3,4,6,12,17,19,20]. Because climate change is difficult to predict with high certainty, traditional fisheries management cannot mitigate its impacts on fisheries resources. Therefore, we must arrange mitigation measures to reduce the risks to fisheries and adapt to climate impacts. Such measures include policy making, conserving aquatic resources, implementing precautionary ecosystem-based and integration adaptation management measures, adjusting the scale of fisheries, and adjusting the fishing operations as well as avoidance, transfer, and reduction to establish a resilient fisheries sector [6,17,19,20]. Moreover, to better understand the impacts of climate change on fishery resources, we suggest that future research should adopt statistical methods (e.g., multiple regression) to determine the critical climatic factors and evaluate the composite impact of climate change [17].

Acknowledgments

This study was supported by a research grant awarded by the Council of Agriculture (102 AST-11.1.2-F1(1)) and the National Science Council (NSC100-2621-M-002-037 and MOST104-2611-M-019-001) of the Republic of China (Taiwan).

Author Contributions

Ching-Hsien Ho designed the study and drafted the manuscript; Hsueh-Jung Lu participated in the study and interpreted some of the results and supervised the whole progress of this study; Jia-Sin He participated in the study and collected the data; Kuo-Wei Lan and Jyun-Long Chen participated in the study design and interpreted some of the results.

Conflicts of Interest

The authors declare no conflict of interest.

References

  1. Brander, K.; Neuheimer, A.; Andersen, K.H.; Hartvig, M. Overconfidence in model projections. ICES J. Mar. Sci. 2013, 70, 1065–1068. [Google Scholar] [CrossRef]
  2. Brander, K. Improving the Reliability of Fishery Predictions Under Climate Change. Curr. Clim. Chang. Rep. 2015. [Google Scholar] [CrossRef]
  3. Cheung, W.W.L.; Lam, V.W.Y.; Sarmiento, J.L.; Kearney, K.; Watson, R.; Pauly, D. Projecting global marine biodiversity impacts under climate change scenarios. Fish Fish. 2009, 10, 235–251. [Google Scholar] [CrossRef]
  4. Cheung, W.W.L.; Lam, V.W.; Sarmiento, K.K.; Watson, R.; Zeller, D.; Pauly, D. Large-scale redistribution of maximum fisheries catch potential in the global ocean under climate change. Glob. Chang. Biol. 2010, 16, 24–35. [Google Scholar] [CrossRef]
  5. Hobday, A.J.; Pecl, G.T. Identification of global marine hotspots: Sentinels for change and vanguards for adaptation action. Rev. Fish Biol. Fish. 2014, 24, 415–425. [Google Scholar] [CrossRef]
  6. Lu, J.H.; Lee, S.L. Observations of changes in the fish species composition in the coastal zone at the Kuroshio Current and China Coastal Current front during climate change using set-net fishery (1993–2011). Fish. Res. 2014, 155, 103–113. [Google Scholar] [CrossRef]
  7. Tang, T.Y.; Yang, Y.J. Low frequency current variability on the shelf breaknortheast of Taiwan. J. Oceanogr. 1993, 49, 193–210. [Google Scholar] [CrossRef]
  8. Chuang, W.S.; Liang, W.D. Seasonal variability of intrusion of the KuroshioWater across the continental shelf northeast of Taiwan. J. Oceanogr. 1994, 50, 531–542. [Google Scholar] [CrossRef]
  9. Liu, Z.; Gan, J. Variability of the Kuroshio in the East China Sea derived fromsatellite altimetry data. Deep Sea Res. I Oceanogr. Res. Pap. 2012, 59, 25–36. [Google Scholar] [CrossRef]
  10. Igor, M.B.; Lee, M.A. Long-term variability of sea surface temperature in Taiwan Strait. Clim. Chang. 2014, 124, 821–834. [Google Scholar]
  11. Tian, Y.; Ueno, Y.; Suda, M.; Akamine, T. Decadal variability in the abundance of Pacific saury and its response to climatic/oceanic regime shifts in the northwestern subtropical Pacific during the last half century. J. Mar. Syst. 2004, 52, 235–257. [Google Scholar] [CrossRef]
  12. Tian, Y.J.; Kidokoro, H.; Watanabe, T. Long-term changes in the fish community structure from the Tsushima warm current region of the Japan/East Sea with an emphasis on the impacts of fishing and climate regime shift over the last four decades. Prog. Oceanogr. 2006, 68, 217–237. [Google Scholar] [CrossRef]
  13. Tian, Y.; Kidokoro, H.; Fujino, T. Interannual-decadal variability of demersal fish community in the Japan Sea: Impacts of climate regime shifts and trawl fishing with implications for ecosystem-based management. Fish. Res. 2011, 112, 140–153. [Google Scholar] [CrossRef]
  14. Poloczanska, E.S.; Babcock, R.C.; Butler, A.; Hobday, A.J.; HoeghGuldberg, O.; Kunz, T.J.; Matear, R.; Milton, D.; Okey, T.A.; Richardson, A.J. Climate change and Australian marine life. Oceanogr. Mar. Biol. Annu. Rev. 2007, 45, 409–480. [Google Scholar]
  15. Brierley, A.S.; Kingsford, M.J. Impacts of climate change on marine organisms and ecosystems. Curr. Biol. 2009, 19, R602–R614. [Google Scholar] [CrossRef] [PubMed]
  16. Brown, C.J.; Fulton, E.A.; Hobday, A.J.; Matear, R.J.; Possingham, H.; Bulman, C.; Christensen, V.; Forrest, R.; Gehrke, P.; Gribble, N.; et al. Effects of climate-driven primary production change on marine food webs: Implications for fisheries and conservation. Glob. Chang. Biol. 2009, 16, 1194–1212. [Google Scholar] [CrossRef]
  17. Intergovernmental Panel on Climate Change (IPCC). Climate Change 2014: Synthesis Report. Contribution of Working Groups I, II and III to the Fifth Assessment Report of the Intergovernmental Panel on Climate Change; Core Writing Team, Pachauri, R.K., Meyer, L.A., Eds.; IPCC: Geneva, Switzerland, 2014; p. 151. [Google Scholar]
  18. Ke, H.M.; Lin, W.W.; Kao, H.W. Genetic diversity and differentiation of grey mullet (Mugil cephalus) in the coastal waters of Taiwan. Zool. Sci. 2009, 26, 421–428. [Google Scholar] [CrossRef] [PubMed]
  19. Chang, Y.; Lee, M.A.; Lee, K.T.; Shao, K.S. Adaptation of fisheries and mariculture management to extreme oceanic environmental changes and climate variability in Taiwan. Mar. Pol. 2013, 38, 476–482. [Google Scholar] [CrossRef]
  20. Lan, K.W.; Lee, M.A.; Zhang, C.I.; Wang, P.Y.; Wu, L.J.; Lee, K.T. Effects of climate variability and climate change on the fishing conditions for grey mullet (Mugil cephalus L.) in the Taiwan Strait. Clim. Change 2014. [Google Scholar] [CrossRef]
  21. Shao, K.T.; Chen, J.Y. Coastal Fishes of Taiwan. 2004. Available online: http://fishdb.sinica.edu.tw/chi/home.php (accessed on 15 March 2016).
  22. Froese, R.; Pauly, D. FishBase. 2012. Available online: http://www.fishbase.org (accessed on 15 March 2016).
  23. Sea Around Us. 2012. Available online: http://www.seaaroundus.org (accessed on 15 March 2016).
  24. Oey, L.Y.; Chang, M.C.; Chang, Y.L.; Lin, Y.C.; Xu, F.H. Decadal warming of coastal China Seas and coupling with winter monsoon and currents. Geophys. Res. Lett. 2013, 40, 6288–6292. [Google Scholar] [CrossRef]
  25. Zhang, C.I.; Lee, J.B.; Kim, S.; Oh, J.H. Climatic regime shifts and their impacts on marine ecosystems and fisheries resources in Korean waters. Progr. Oceanogr. 2000, 47, 171–190. [Google Scholar] [CrossRef]
  26. Zhang, C.I.; Lee, J.B.; Seo, Y.I.; Yoon, S.C.; Kim, S. Variations in the abundance of fisheries resources and ecosystem structure in the Japan/East Sea. Prog. Oceanogr. 2004, 61, 245–265. [Google Scholar] [CrossRef]
  27. Jung, S.; Pang, I.C.; Lee, J.H.; Choi, I.; Cha, H.K. Latitudinal shifts in the distribution of exploited fishes in Korean waters during the last 30 years: A consequence of climate change. Rev. Fish Biol. Fish. 2014, 24, 443–462. [Google Scholar] [CrossRef]
Figure 1. The grids selected for observing the long-term changes of SST from 1963 to 2010: NE, NW, SE and SW. (NE: North East, Grids: C1, C2, D1, D2; NW: North West, Grids: A1, A2, B1, B2; SE: South East, Grids: C3, C4, D3, D4; SW: South West, Grids: A3, A4, B3, B4).
Sustainability 08 00273 g001
Figure 2. Trend of the catch proportion for single-season species from 1963 to 2010.
Sustainability 08 00273 g002
Figure 3. Trend of the catch proportion for all seasonal catches from 1963 to 2010.
Sustainability 08 00273 g003
Figure 4. Trend of the proportion of the SST variability during the period from 1963 to 2010 in (a) February and (b) August. Each bar shows the proportion of grids with normal, positive (> 1 sd), and negative (< −1 sd) variability. The positive SST variability increased significantly (February: r = 0.305, p = 0.034; August: r = 0.326, p = 0.023).
Sustainability 08 00273 g004
Figure 5. Trend of the accumulated values of the SST variability during the three periods: positive (> 1 sd) and negative (< −1 sd) variability in February and August.
Sustainability 08 00273 g005
Figure 6. The SSTA and C-SSTA variation trend in Taiwanese waters from 1963 to 2010 (baseline = 1963–2010).
Sustainability 08 00273 g006
Figure 7. Contours of the correlation coefficient relations between fish catch and the SSTA for the period from 1963 to 2010. Areas with r-values greater than 0.30 or less than −0.30 are significantly correlated (p < 0.05).
Sustainability 08 00273 g007aSustainability 08 00273 g007b
Table 1. Single-season migratory species in the coastal capture fisheries of Taiwan.
Common NameSpecies NameAssociated Currentp1p2Seasonality
Black pomfretParastromateus nigerCCC0.010.01Winter
Black sea breamAcanthopagrus schlegelii-0.010.02Winter
East Asian four-finger threadfinEleutheronema rhadinumKC0.010.01Winter
Giant black marlinMakaira indicaKC0.010.01Winter
Japanese butterfishPsenopsis anomalaCCC0.010.01Winter
Largehead hairtailTrichiurus lepturusCCC0.010.01Winter
MulletMugil cephalusCCC0.010.01Winter
Red stingrayDasyatis akajeiCCC0.010.01Winter
CattlefishSepia pharaonis-0.010.02Spring
Jack mackerelTrachurus japonicusCCC0.010.01Spring
Sea barbelArius maculatusKC0.010.04Spring
Slender snoekThyrsitoides marleyiKC0.010.04Spring
Southern mackerelScomber australasicusCCC0.010.02Spring
Black croakerAtrobucca nibeKC0.010.01Summer
OctopusOctopus vulgare-0.010.04Summer
Oval grouperTriso dermopterusCCC0.010.01Summer
Pacific sailfishIstiophorus platypterusKC0.010.01Summer
Pike congerMuraenesox cinereusKC0.010.02Summer
Red sea breamDentex hypselosomusKC0.010.01Summer
Silver sillagoSillago sihama-0.010.01Fall
Sources: Shao and Chen [21]; FishBase [22]; Sea Around Us [23]; Lu and Lee [6].
Table 2. Two-season migratory species in the coastal capture fisheries of Taiwan.
Common NameSpecies NameAssociated Currentp1p2Seasonality
Bullet tunaAuxis rochei rocheiKC0.030.14Spring & Winter
Pacific blue marlinMakaira nigricansKC0.010.07Spring & Winter
Silver pomfretPampus argenteusKC0.010.06Spring & Winter
Slender lizard fishSaurida elongataKC0.010.49Spring & Winter
SpaniardScomberomorus niphoniusCCC0.010.37Spring & Winter
Yellowfin tunaThunnus albacaresKC0.010.4Spring & Winter
DolphinfishCoryphaena hippurusKC0.010.40Summer & Winter
Silver sea meagrePennahia argentata-0.010.37Summer & Winter
Mi-iuy croakerMiichthys miiuyKC0.020.30Spring & Summer
Sword tip squidLoligo edulis-0.010.20Summer & Fall
TilefishBranchiostegus albus-0.040.08Summer & Fall
Sources: Shao and Chen [21]; FishBase (2012) [22]; Sea Around Us [23]; Lu and Lee [6].
Table 3. Species with no seasonal pattern in the coastal capture fisheries of Taiwan.
Common NameSpecies NameAssociated Currentp1p2Seasonality
Bullet mackerelAuxis thazard thazardKC0.340.14NS
Croceine croakerLarimichthys crocea-0.230.34NS
Golden threadfin breamNemipterus virgatus-0.510.43NS
Large yellow croakerLarimichthys crocea-0.950.4NS
MoonfishMene maculata-0.070.22NS
Pacific striped marlinKajikia audaxKC0.170.21NS
Rainbow sardineDussumieria elapsoides-0.230.4NS
Red bigeye fishPriacanthus macracanthus-0.960.34NS
Red bokakoArgyrops spinifer-0.430.34NS
Red seabreamPagrus major-0.250.06NS
Redgill emperorLethrinus rubrioperculatus-0.10.4NS
Skipjack tunaKatsuwonus pelamisCCC0.550.44NS
Small-mouthed nannygaiLutjanus erythropterus-0.690.31NS
Spotted sardineKonosirus punctatus-0.430.24NS
SwordfishXiphias gladiusKC0.160.38NS
White lady carpCirrhinus Molitorella-0.110.13NS
Yellow band goatfishParupeneus chrysopleuron-0.240.31NS
Sources: Shao and Chen [21]; FishBase (2012) [22]; Sea Around Us [23]; Lu and Lee [6].

