
GIS-Based Risk Assessment of Hail Disasters Affecting Cotton and Its Spatiotemporal Evolution in China

 , ,
, ,
Abstract
:1. Introduction
2. Methodology
2.1. Data Sources
2.2. Method for Assessing Risk of Hail Disaster Affecting Cotton
2.2.1. Theoretical Framework
2.2.2. Hail Hazard Index (H)
2.2.3. Exposure (E) and Vulnerability (V) of Cotton
2.2.4. Calculation of Hail Disaster Risk for Cotton
2.2.5. Ranking and Mapping of Hail Disaster Risk for Cotton
2.3. Spatiotemporal Analysis Method
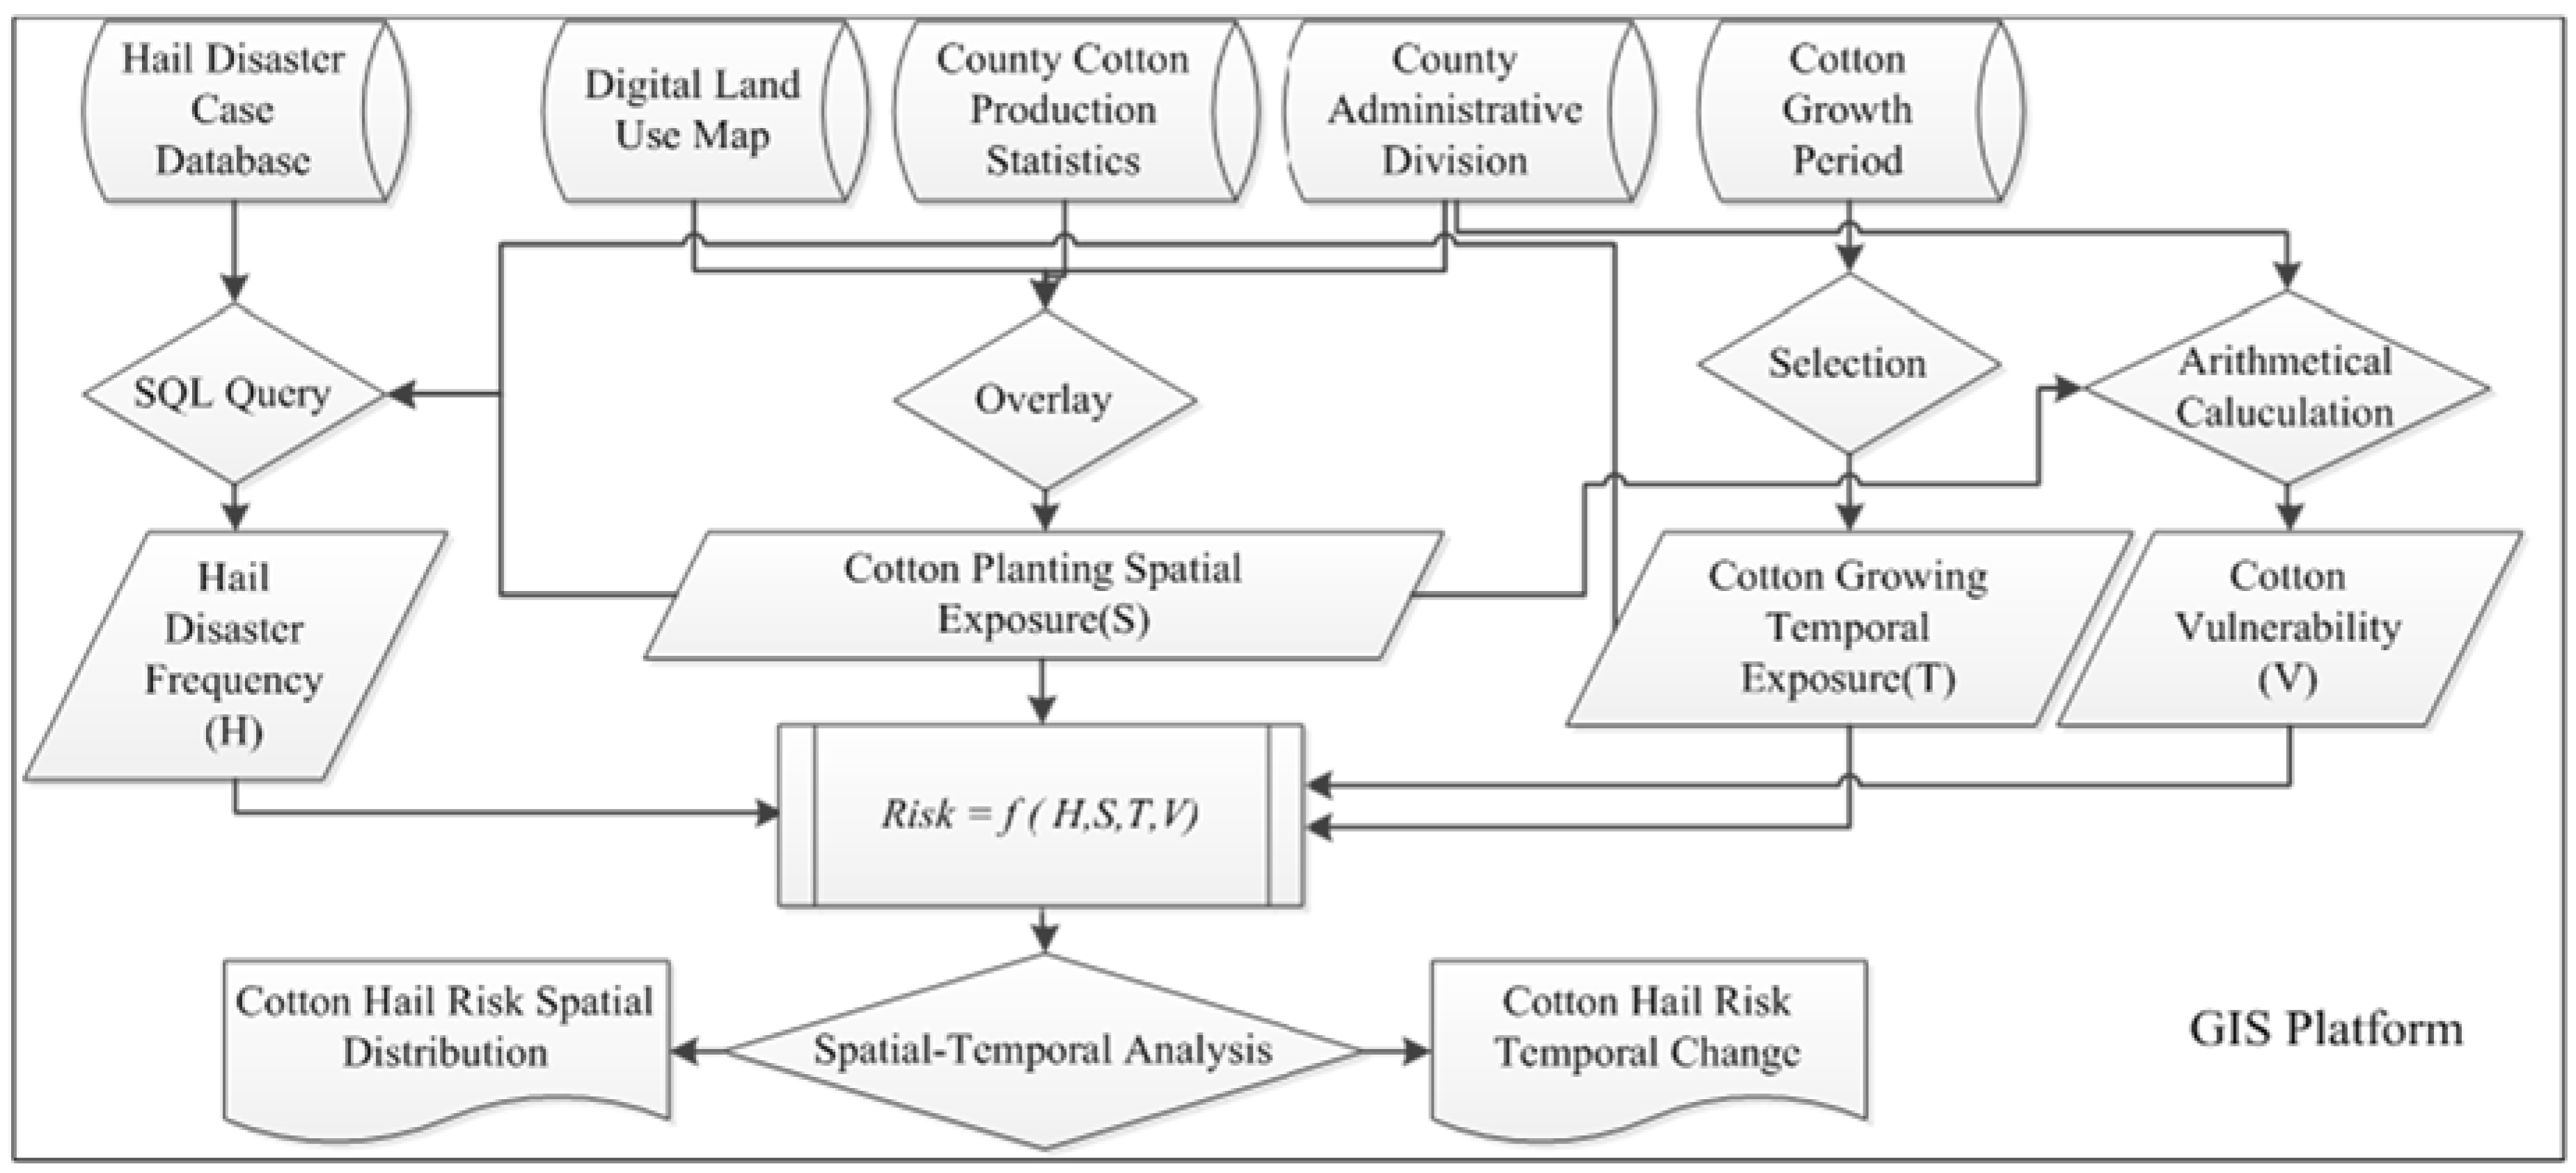
2.4. Technological Flow and Application of GIS
3. Results
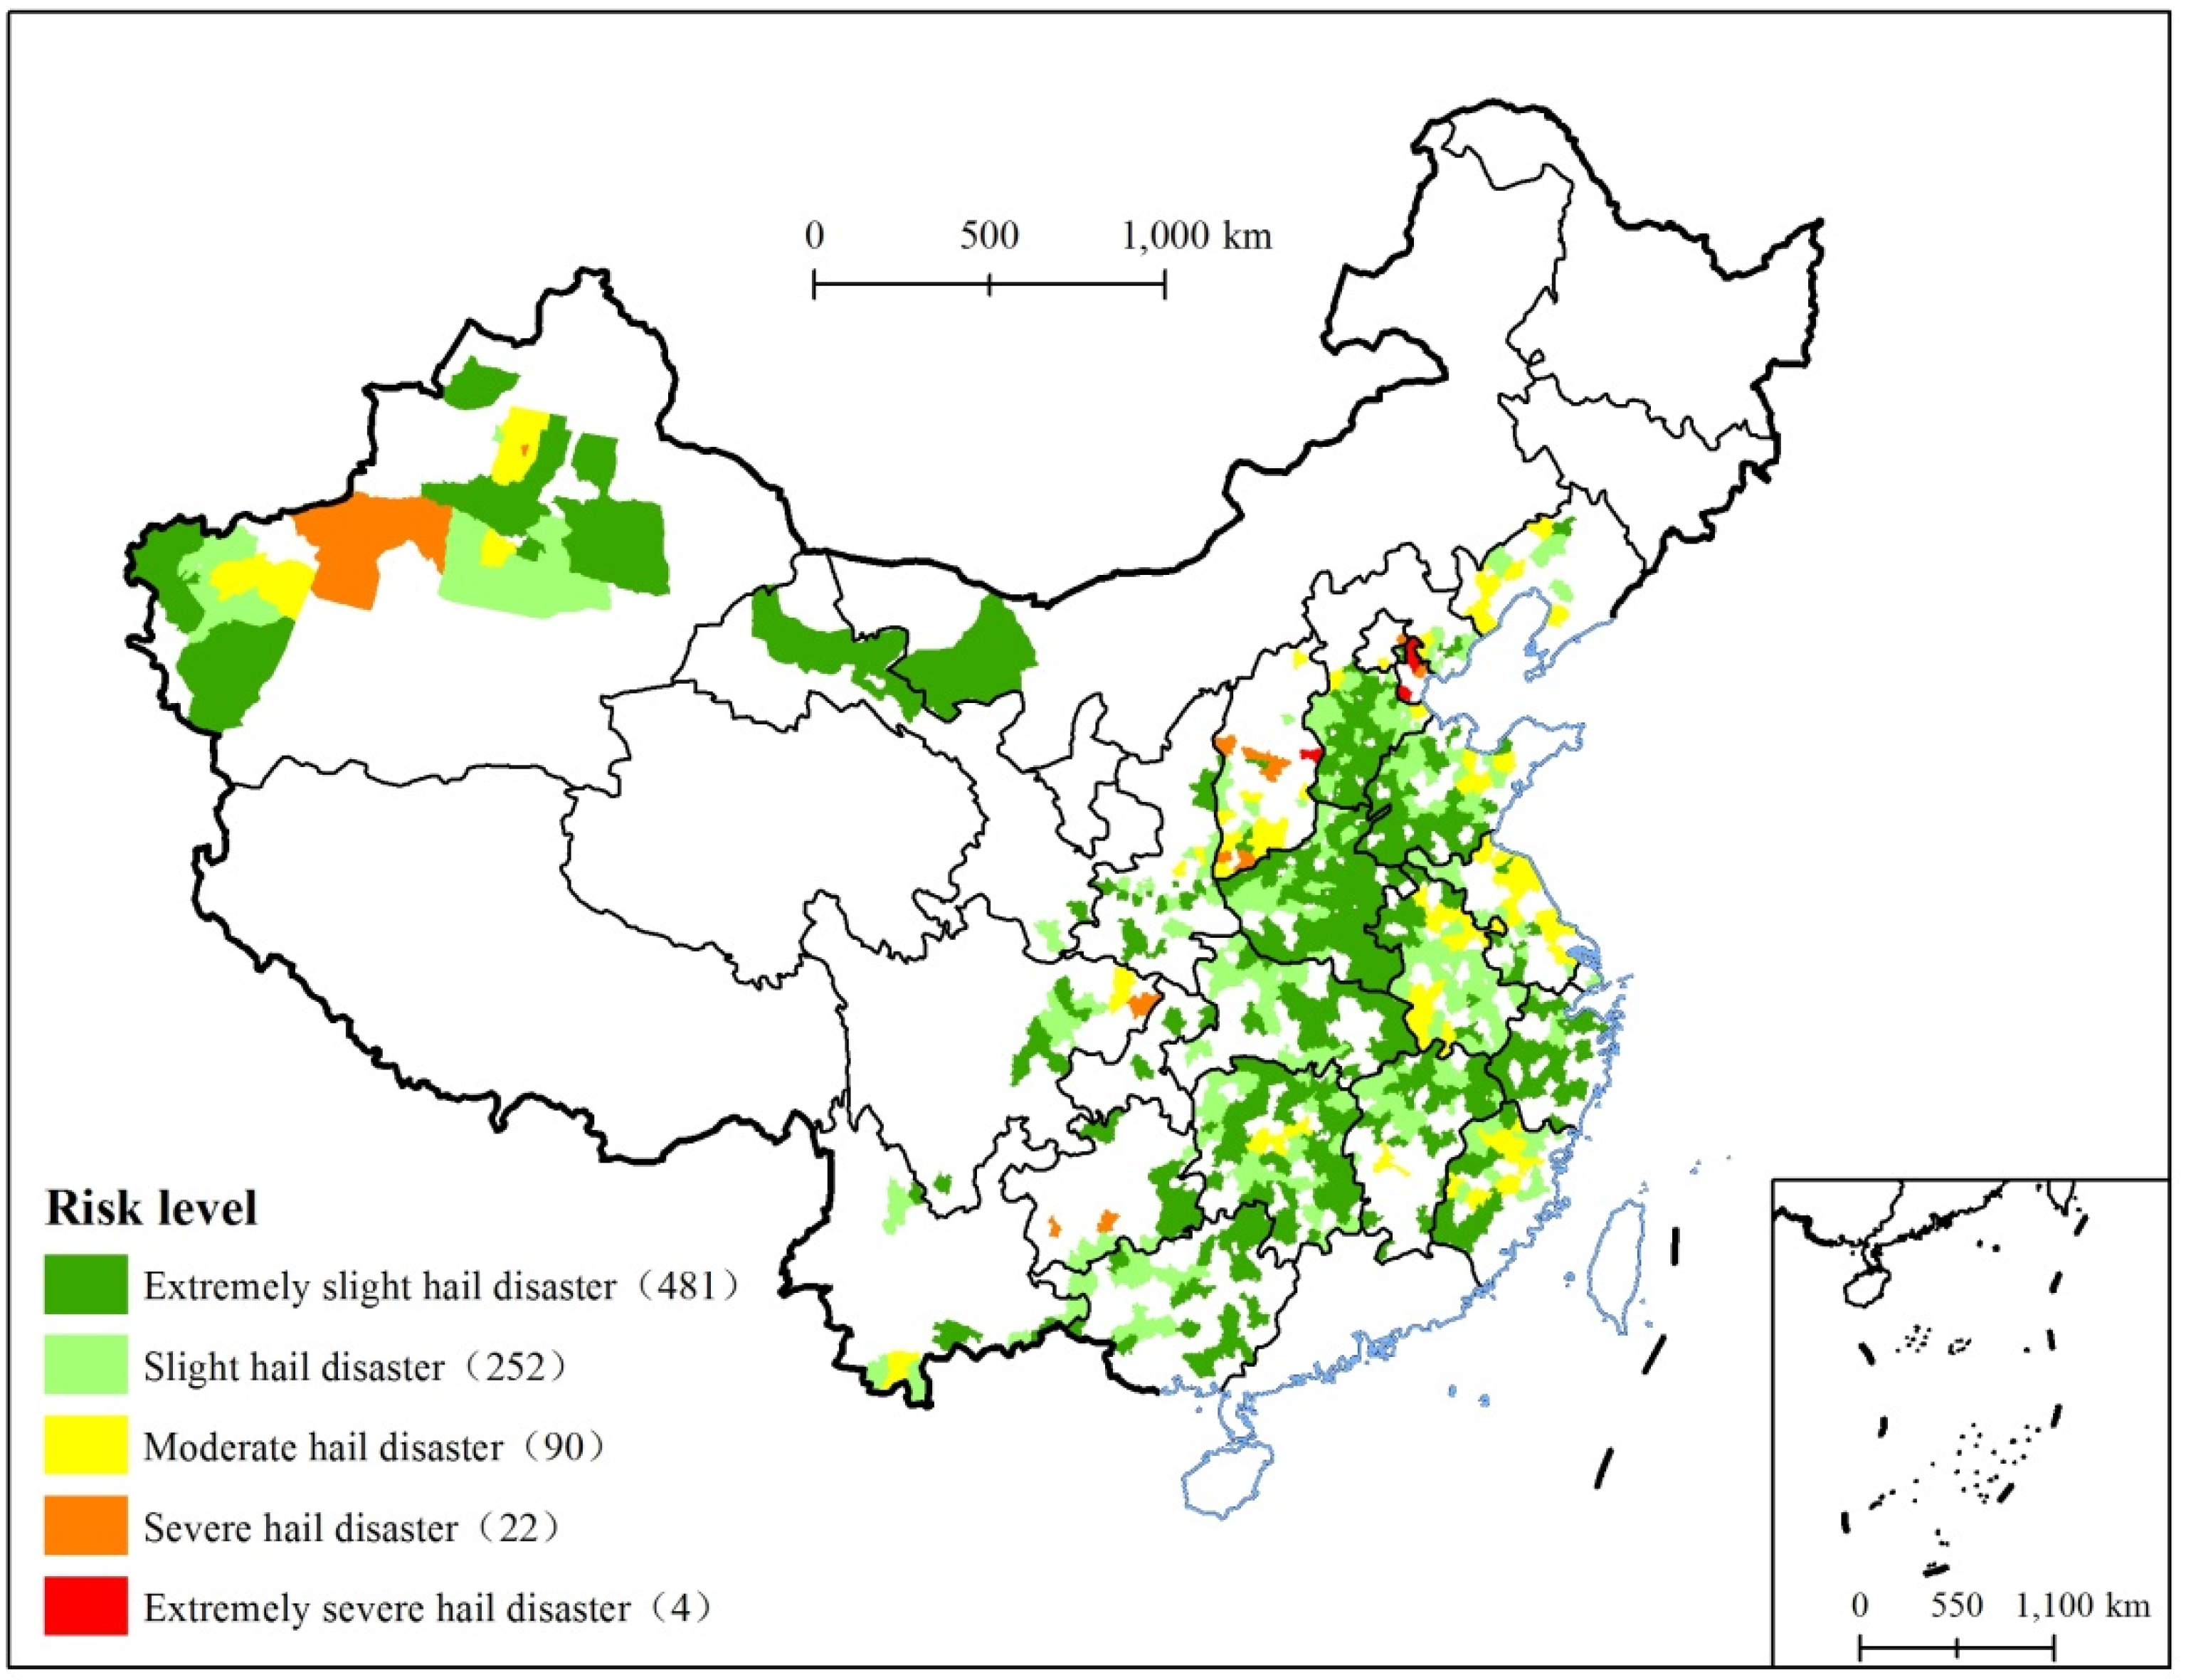
3.1. Spatial Distribution of Hail Disaster Risk for Cotton in China
3.1.1. Regional Distribution Characteristics
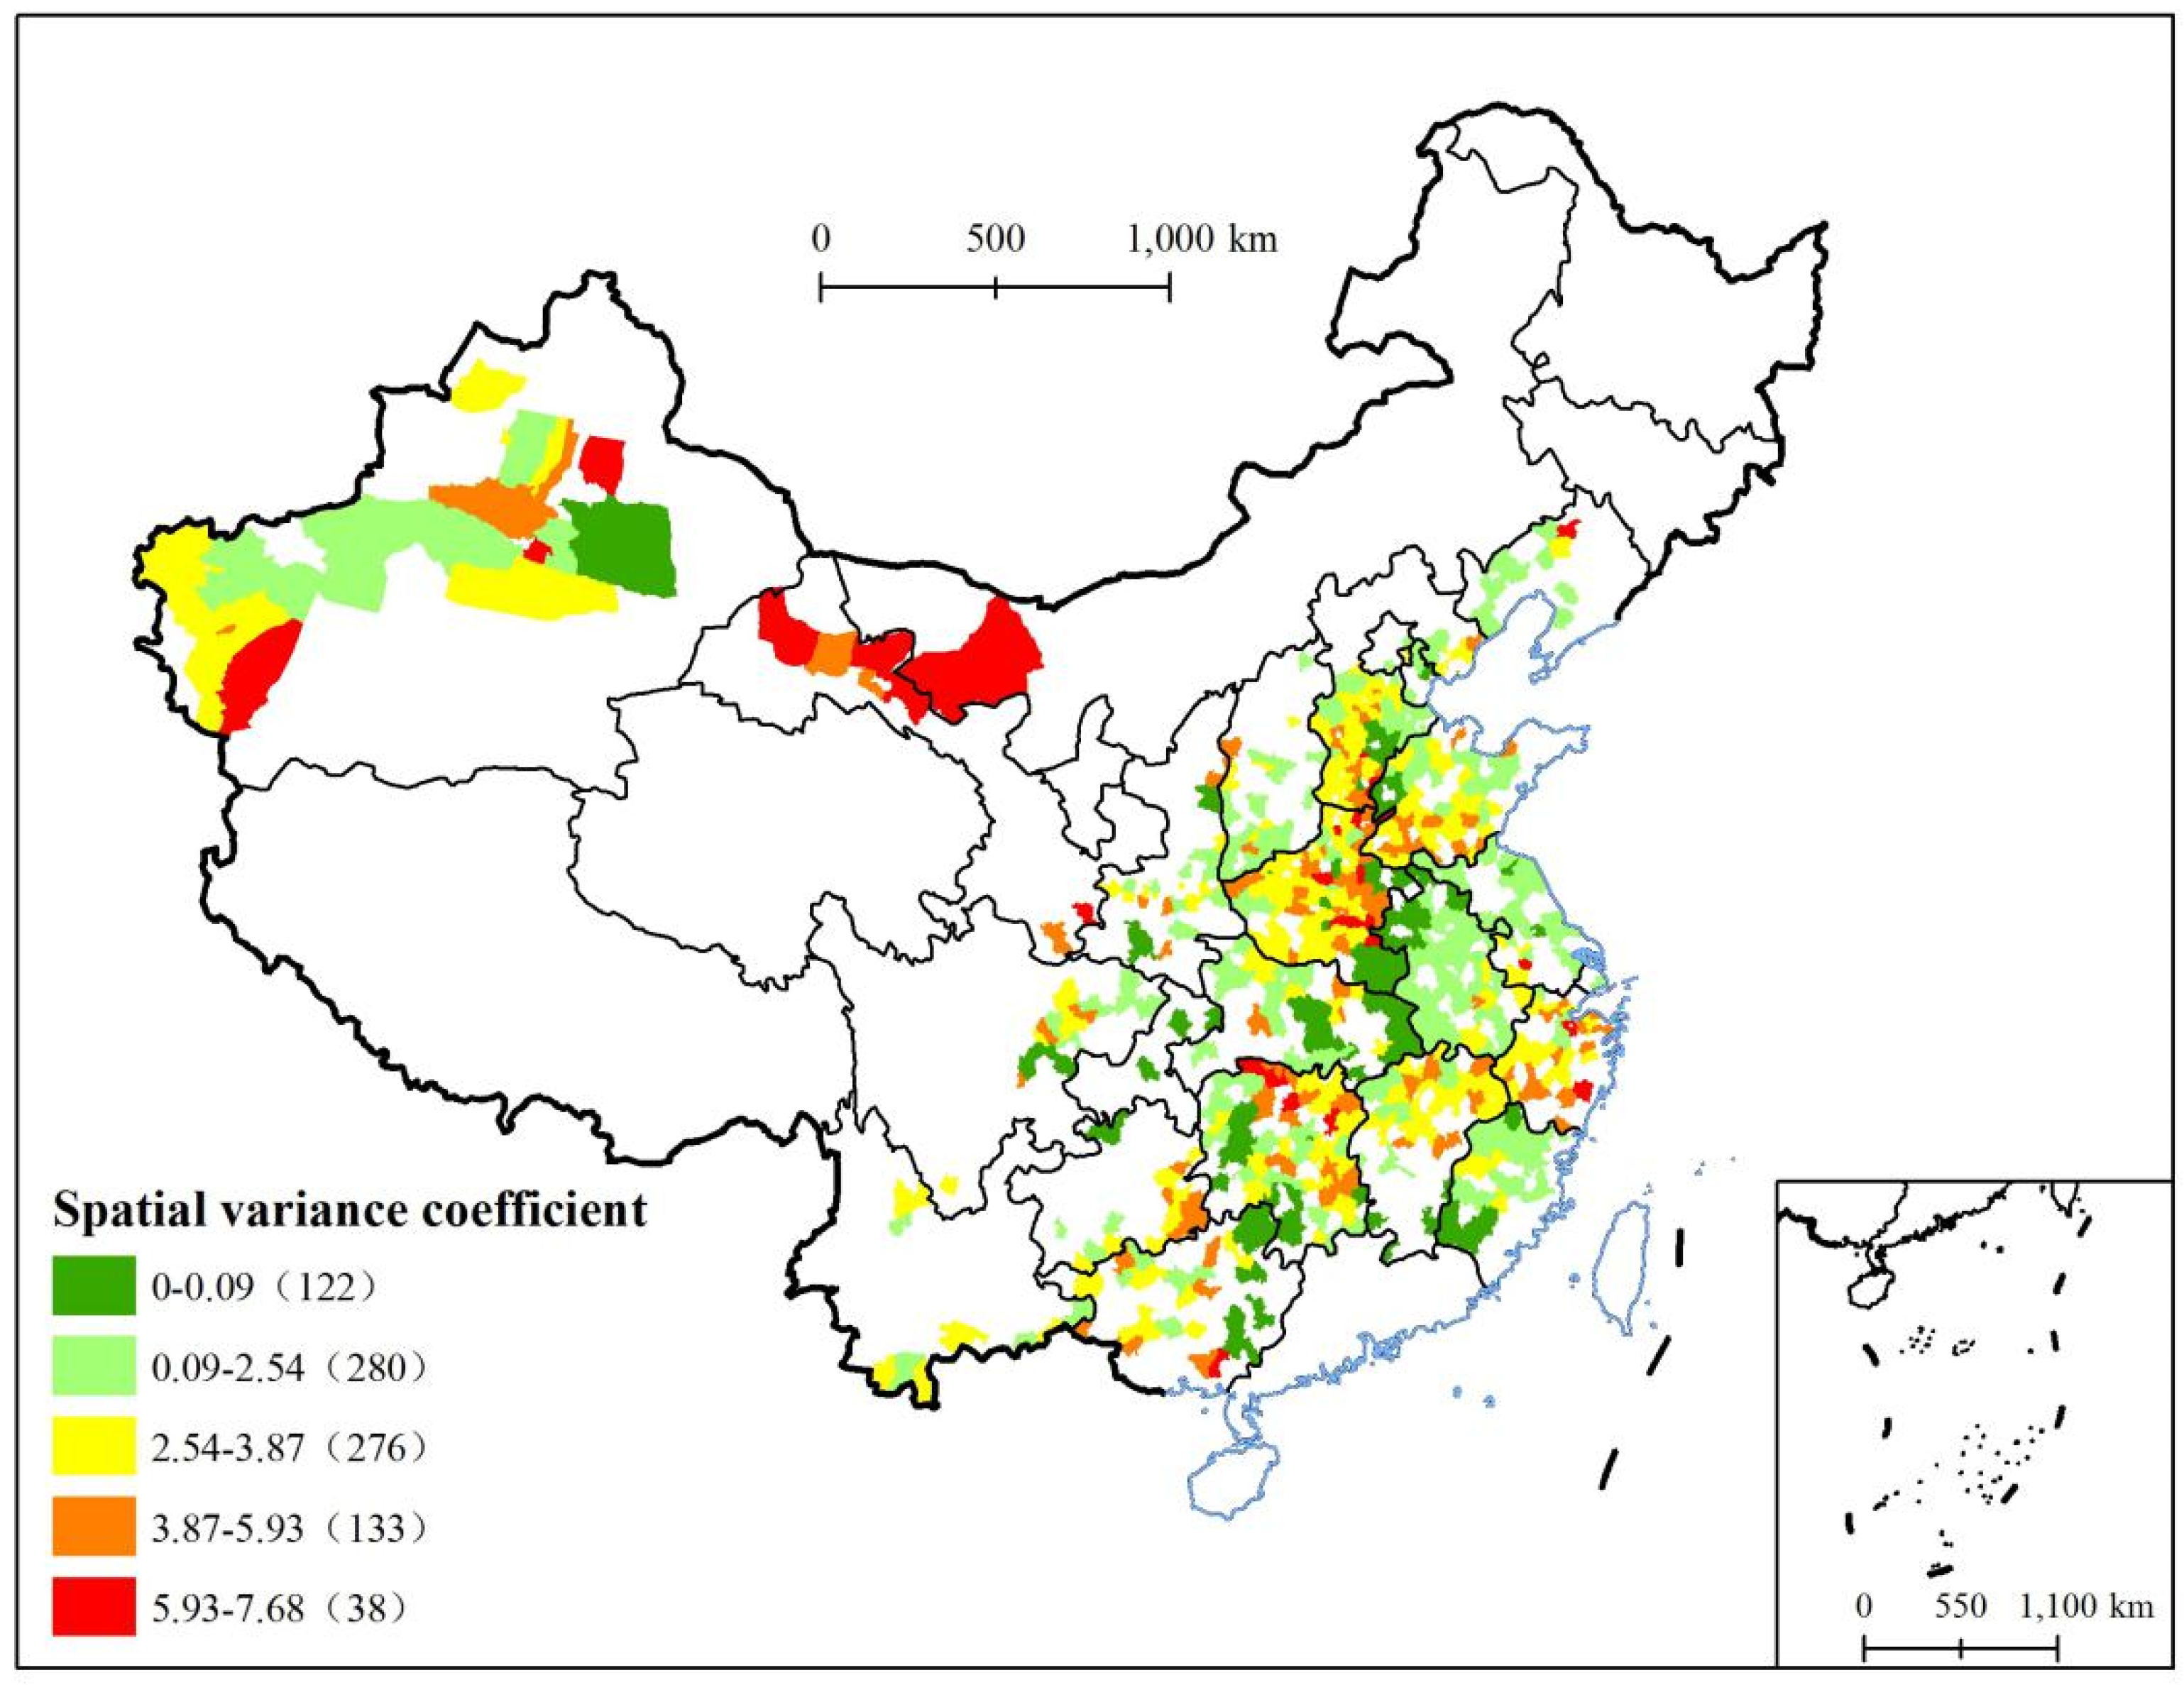
3.1.2. Spatial Variance Characteristics
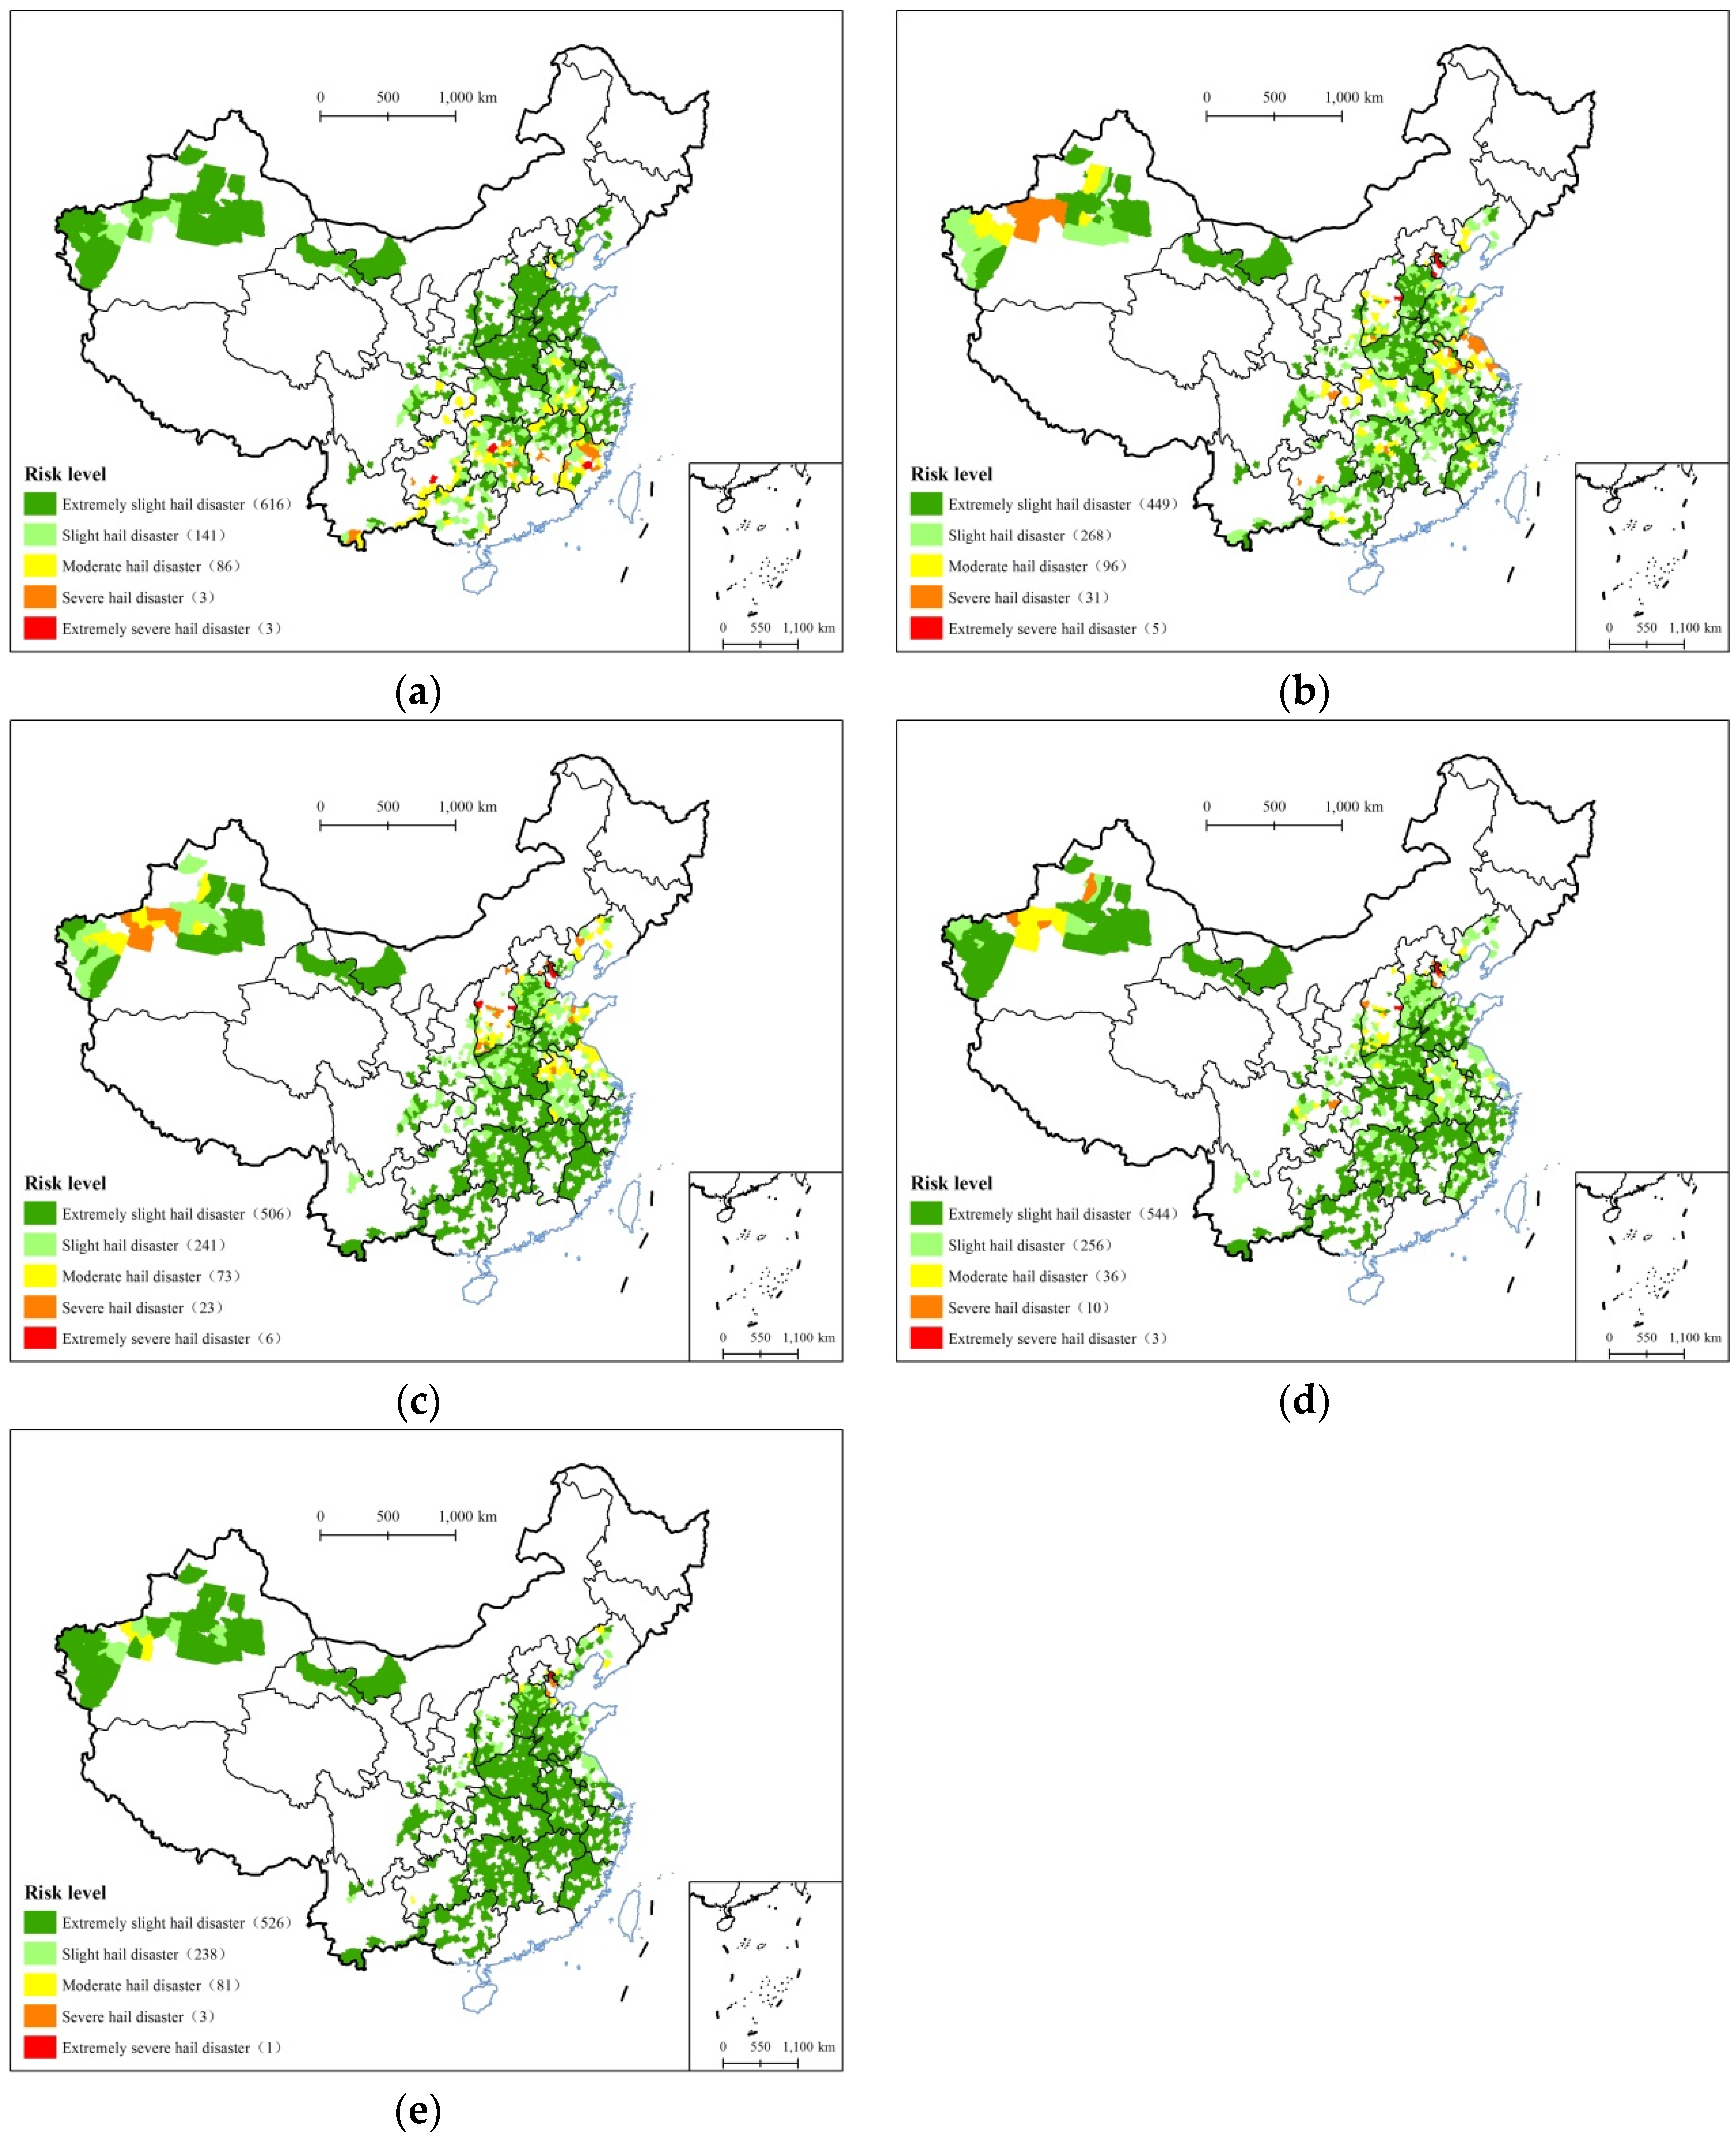
3.1.3. Distribution Characteristics in Different Growth Periods
3.2. Temporal Variation of the Hail Disaster Risk for Cotton in China
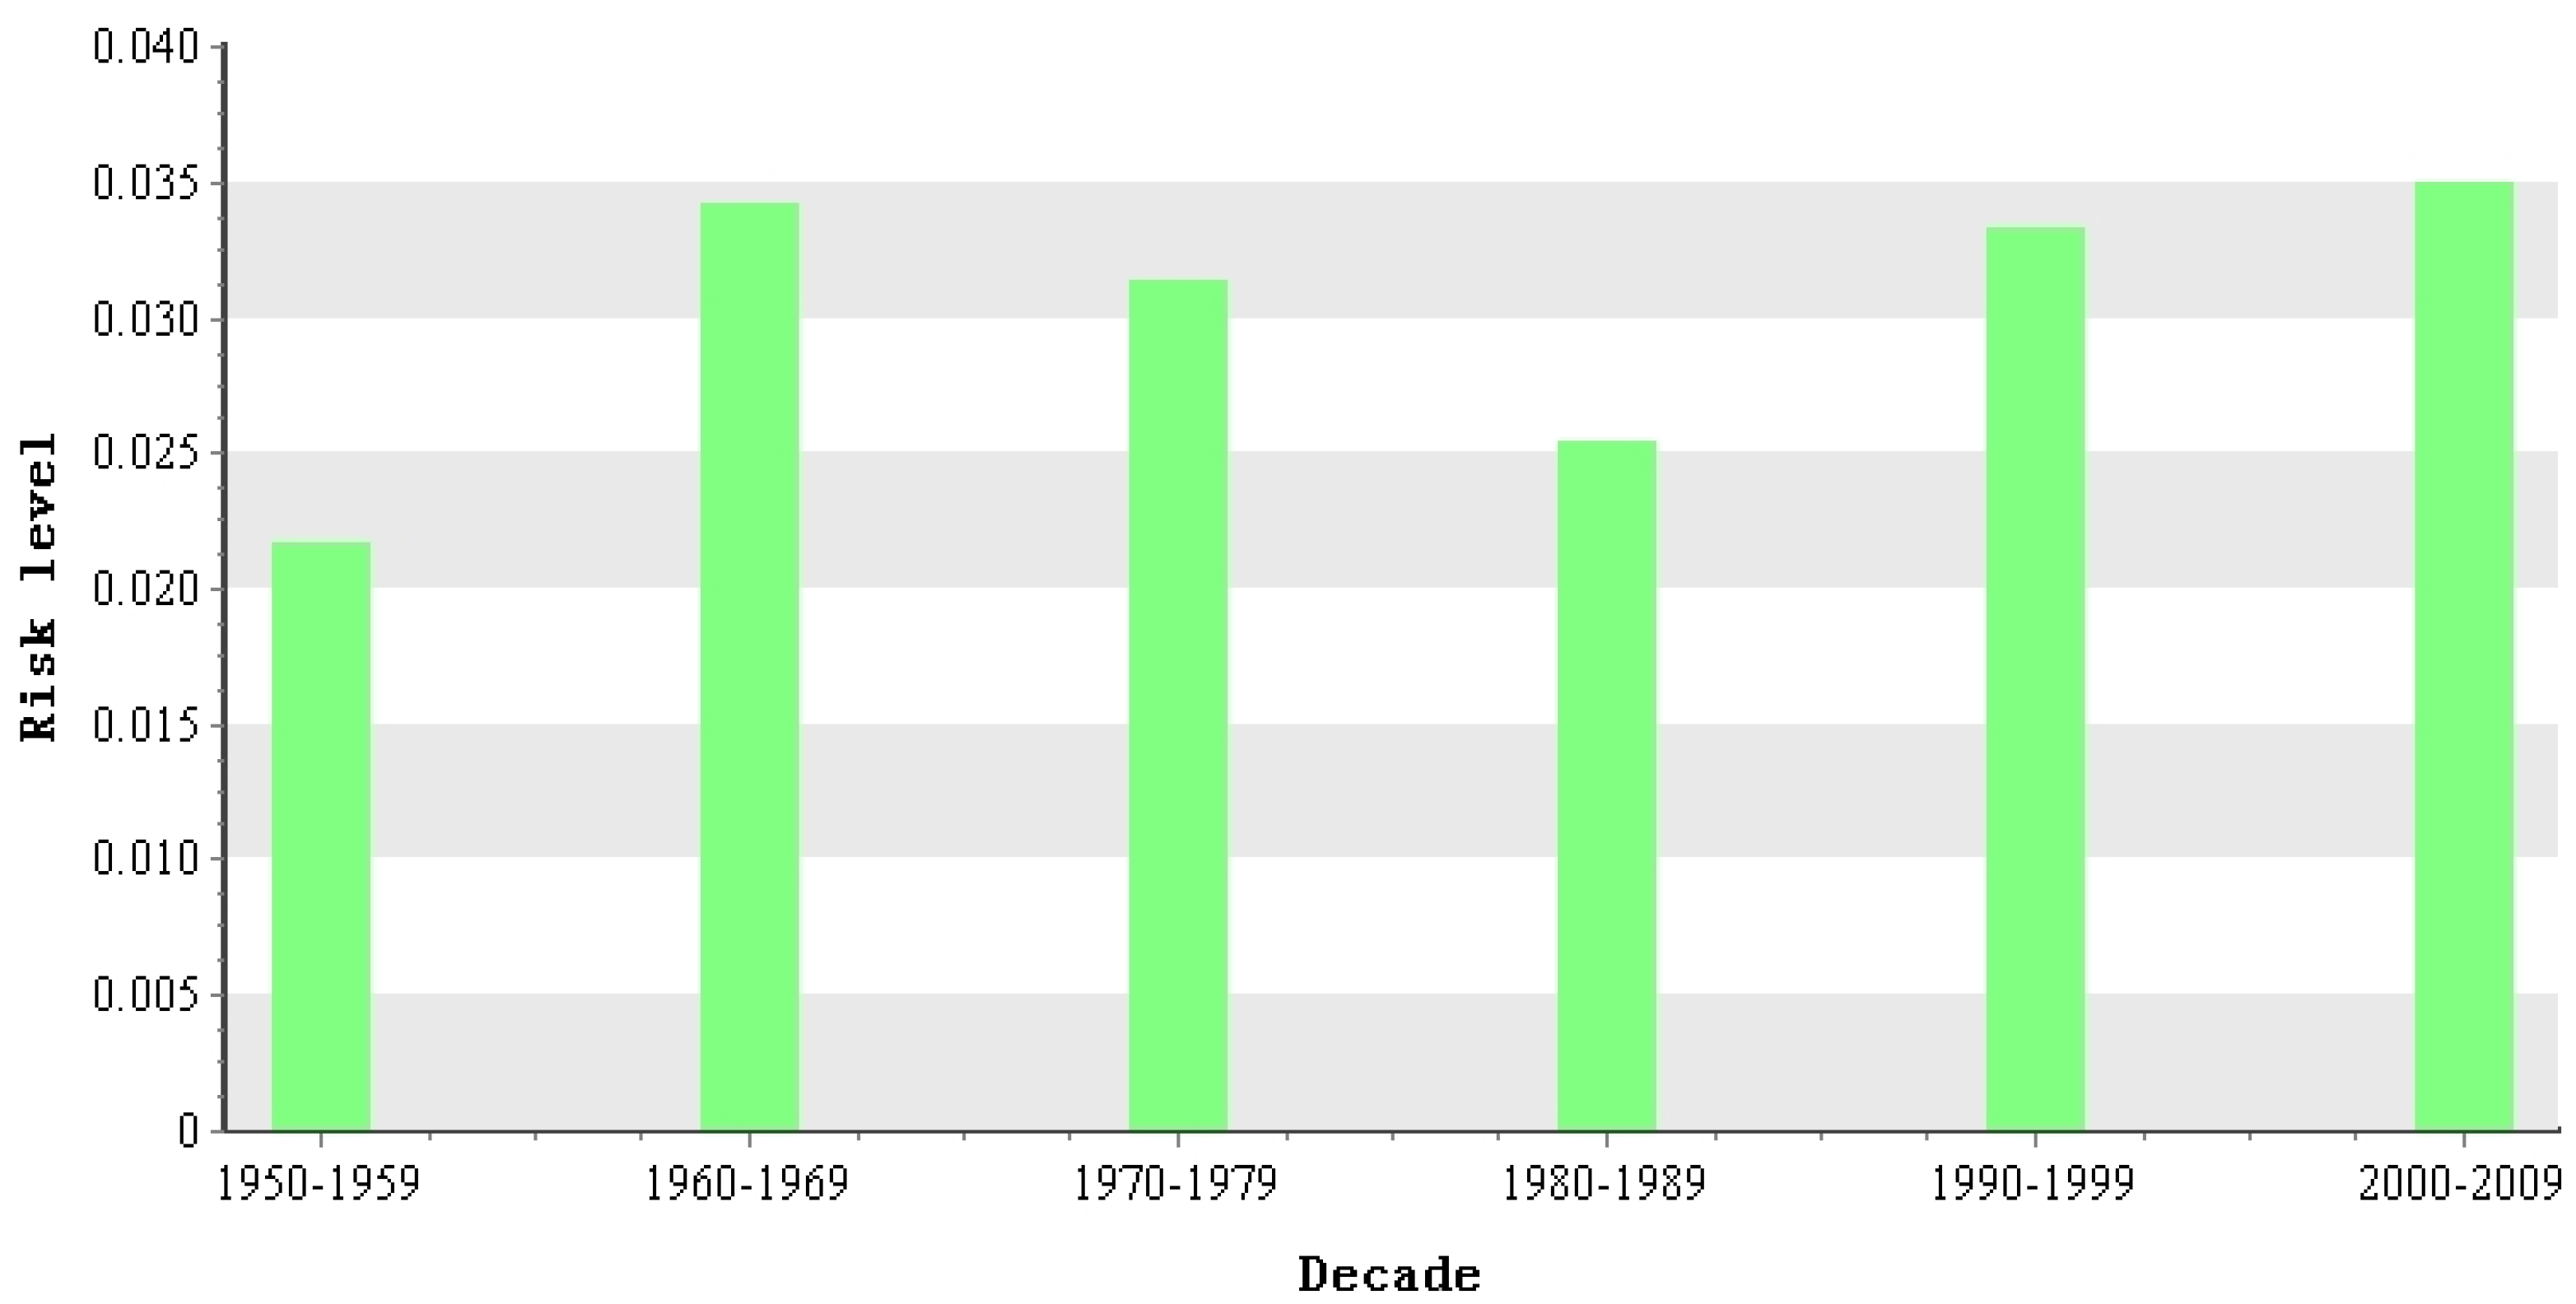
3.2.1. Interdecadal Variation
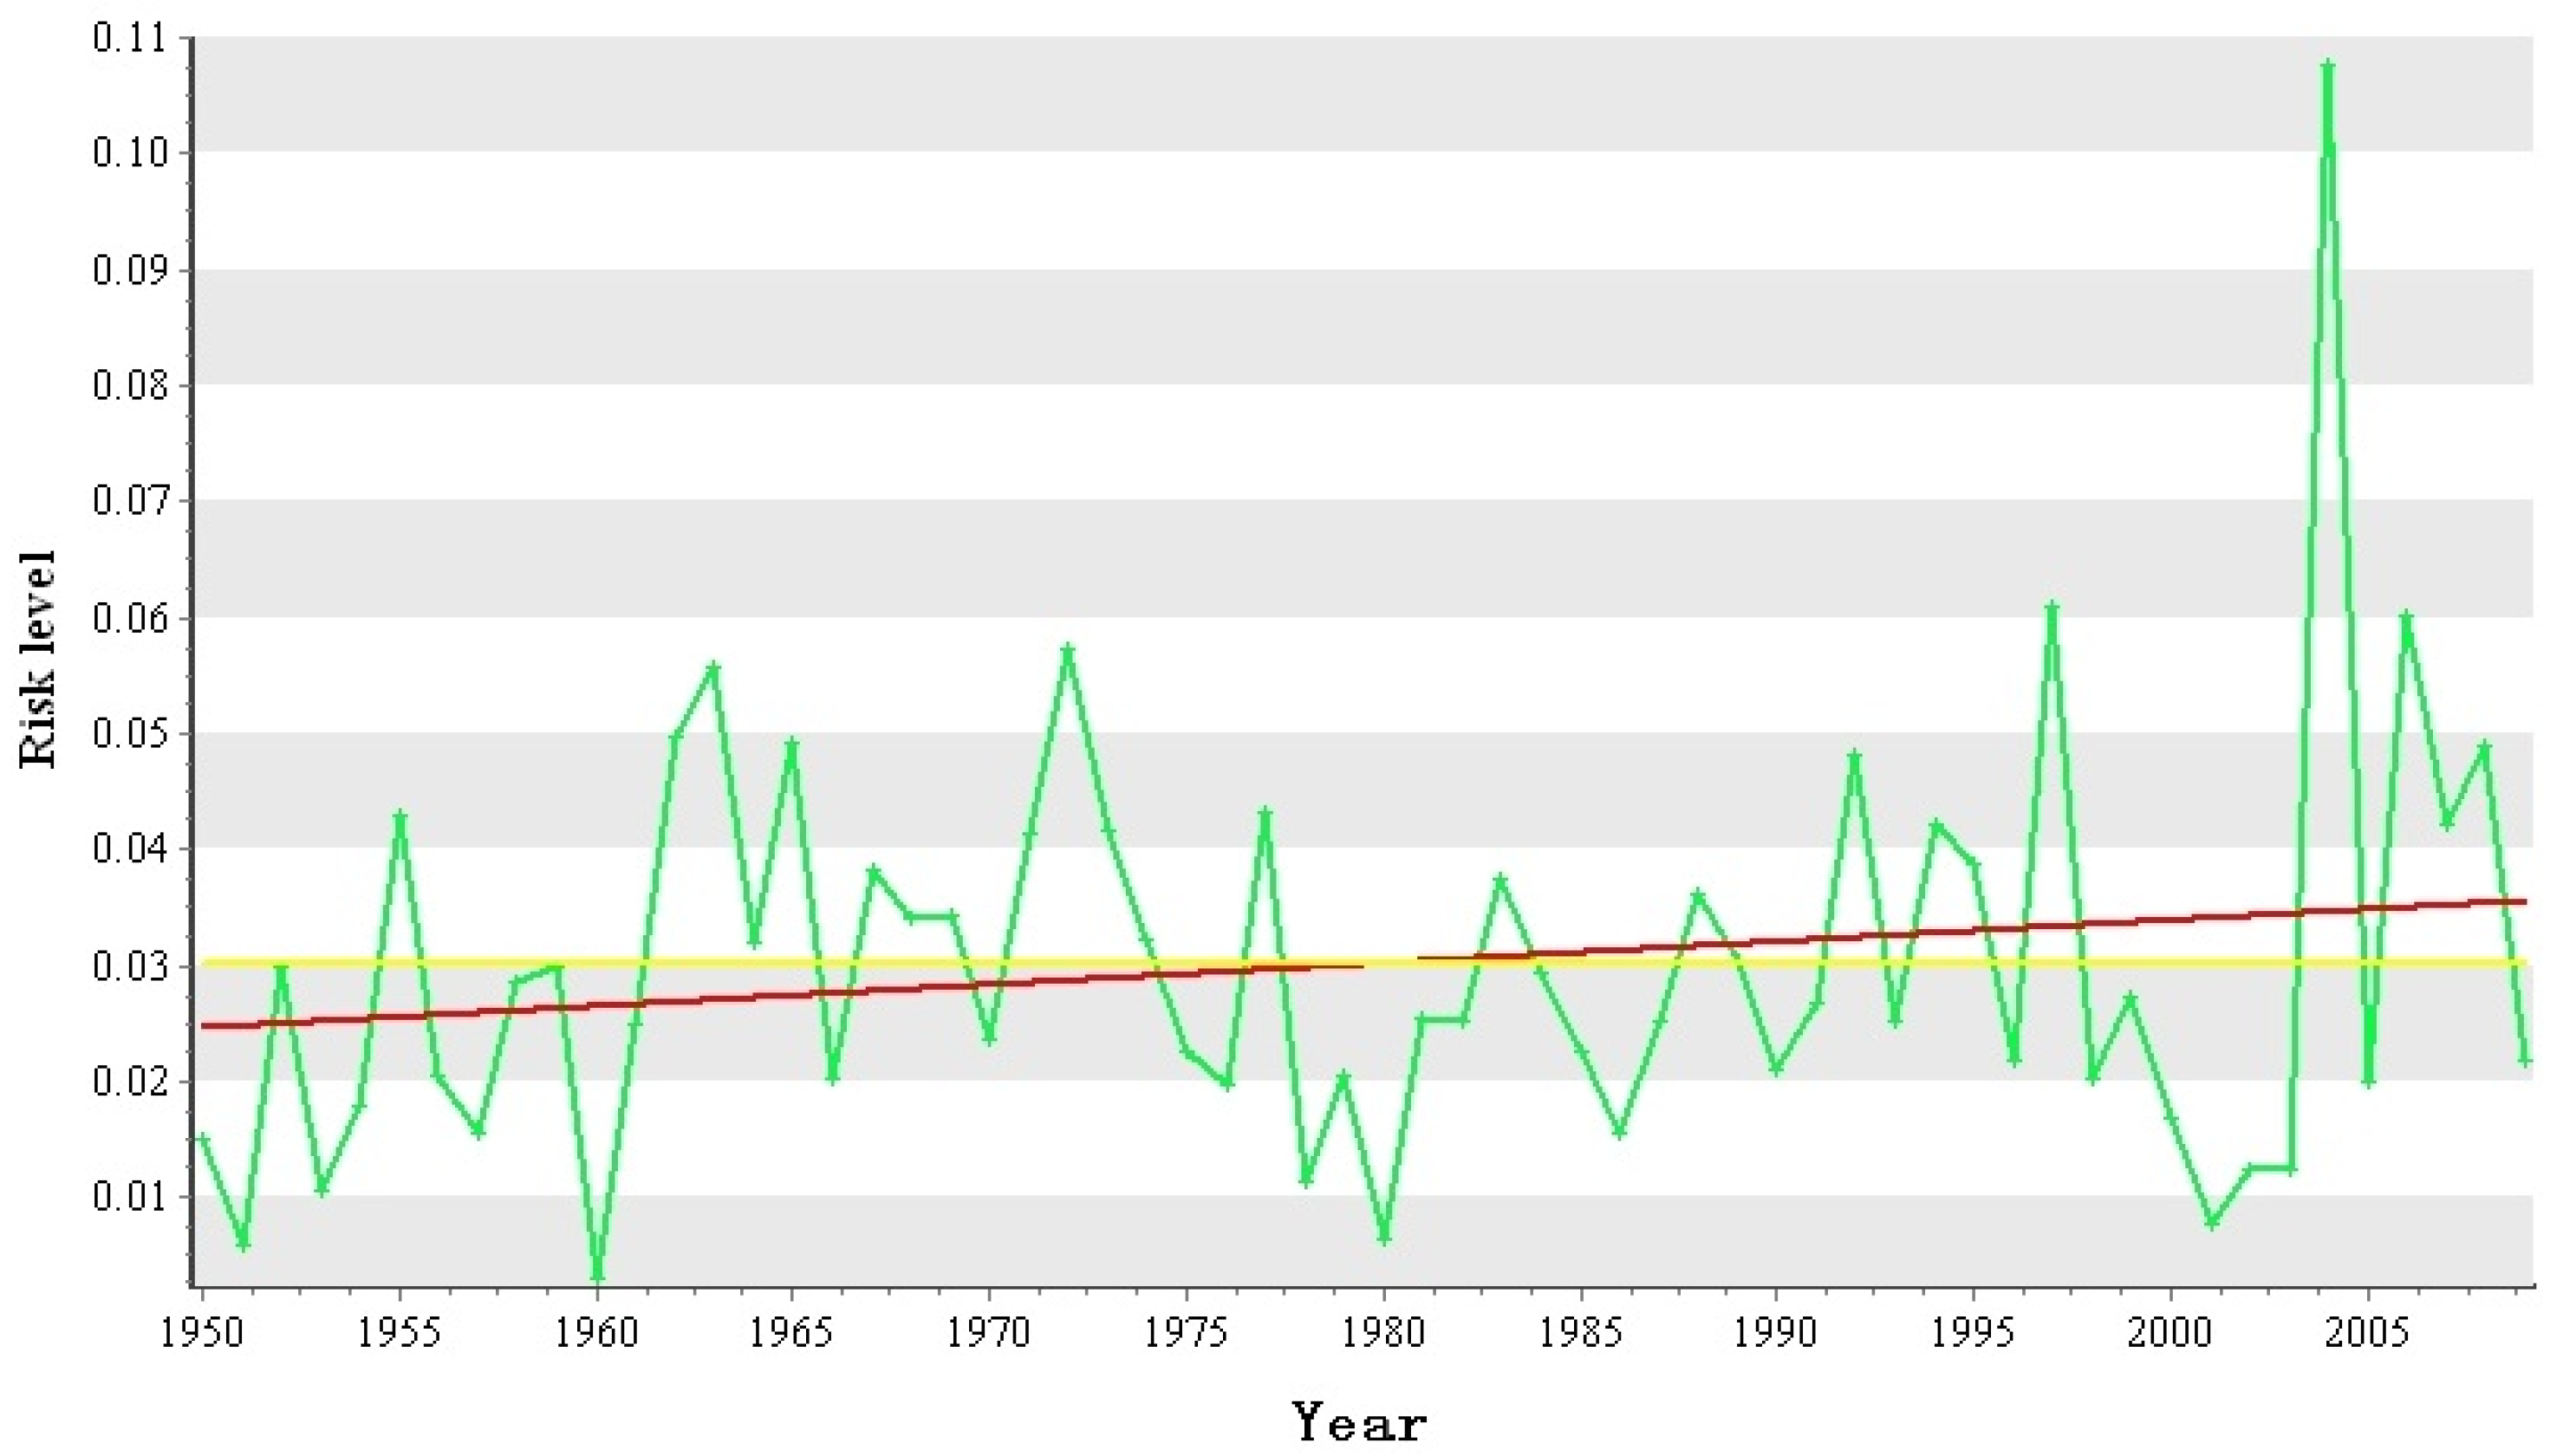
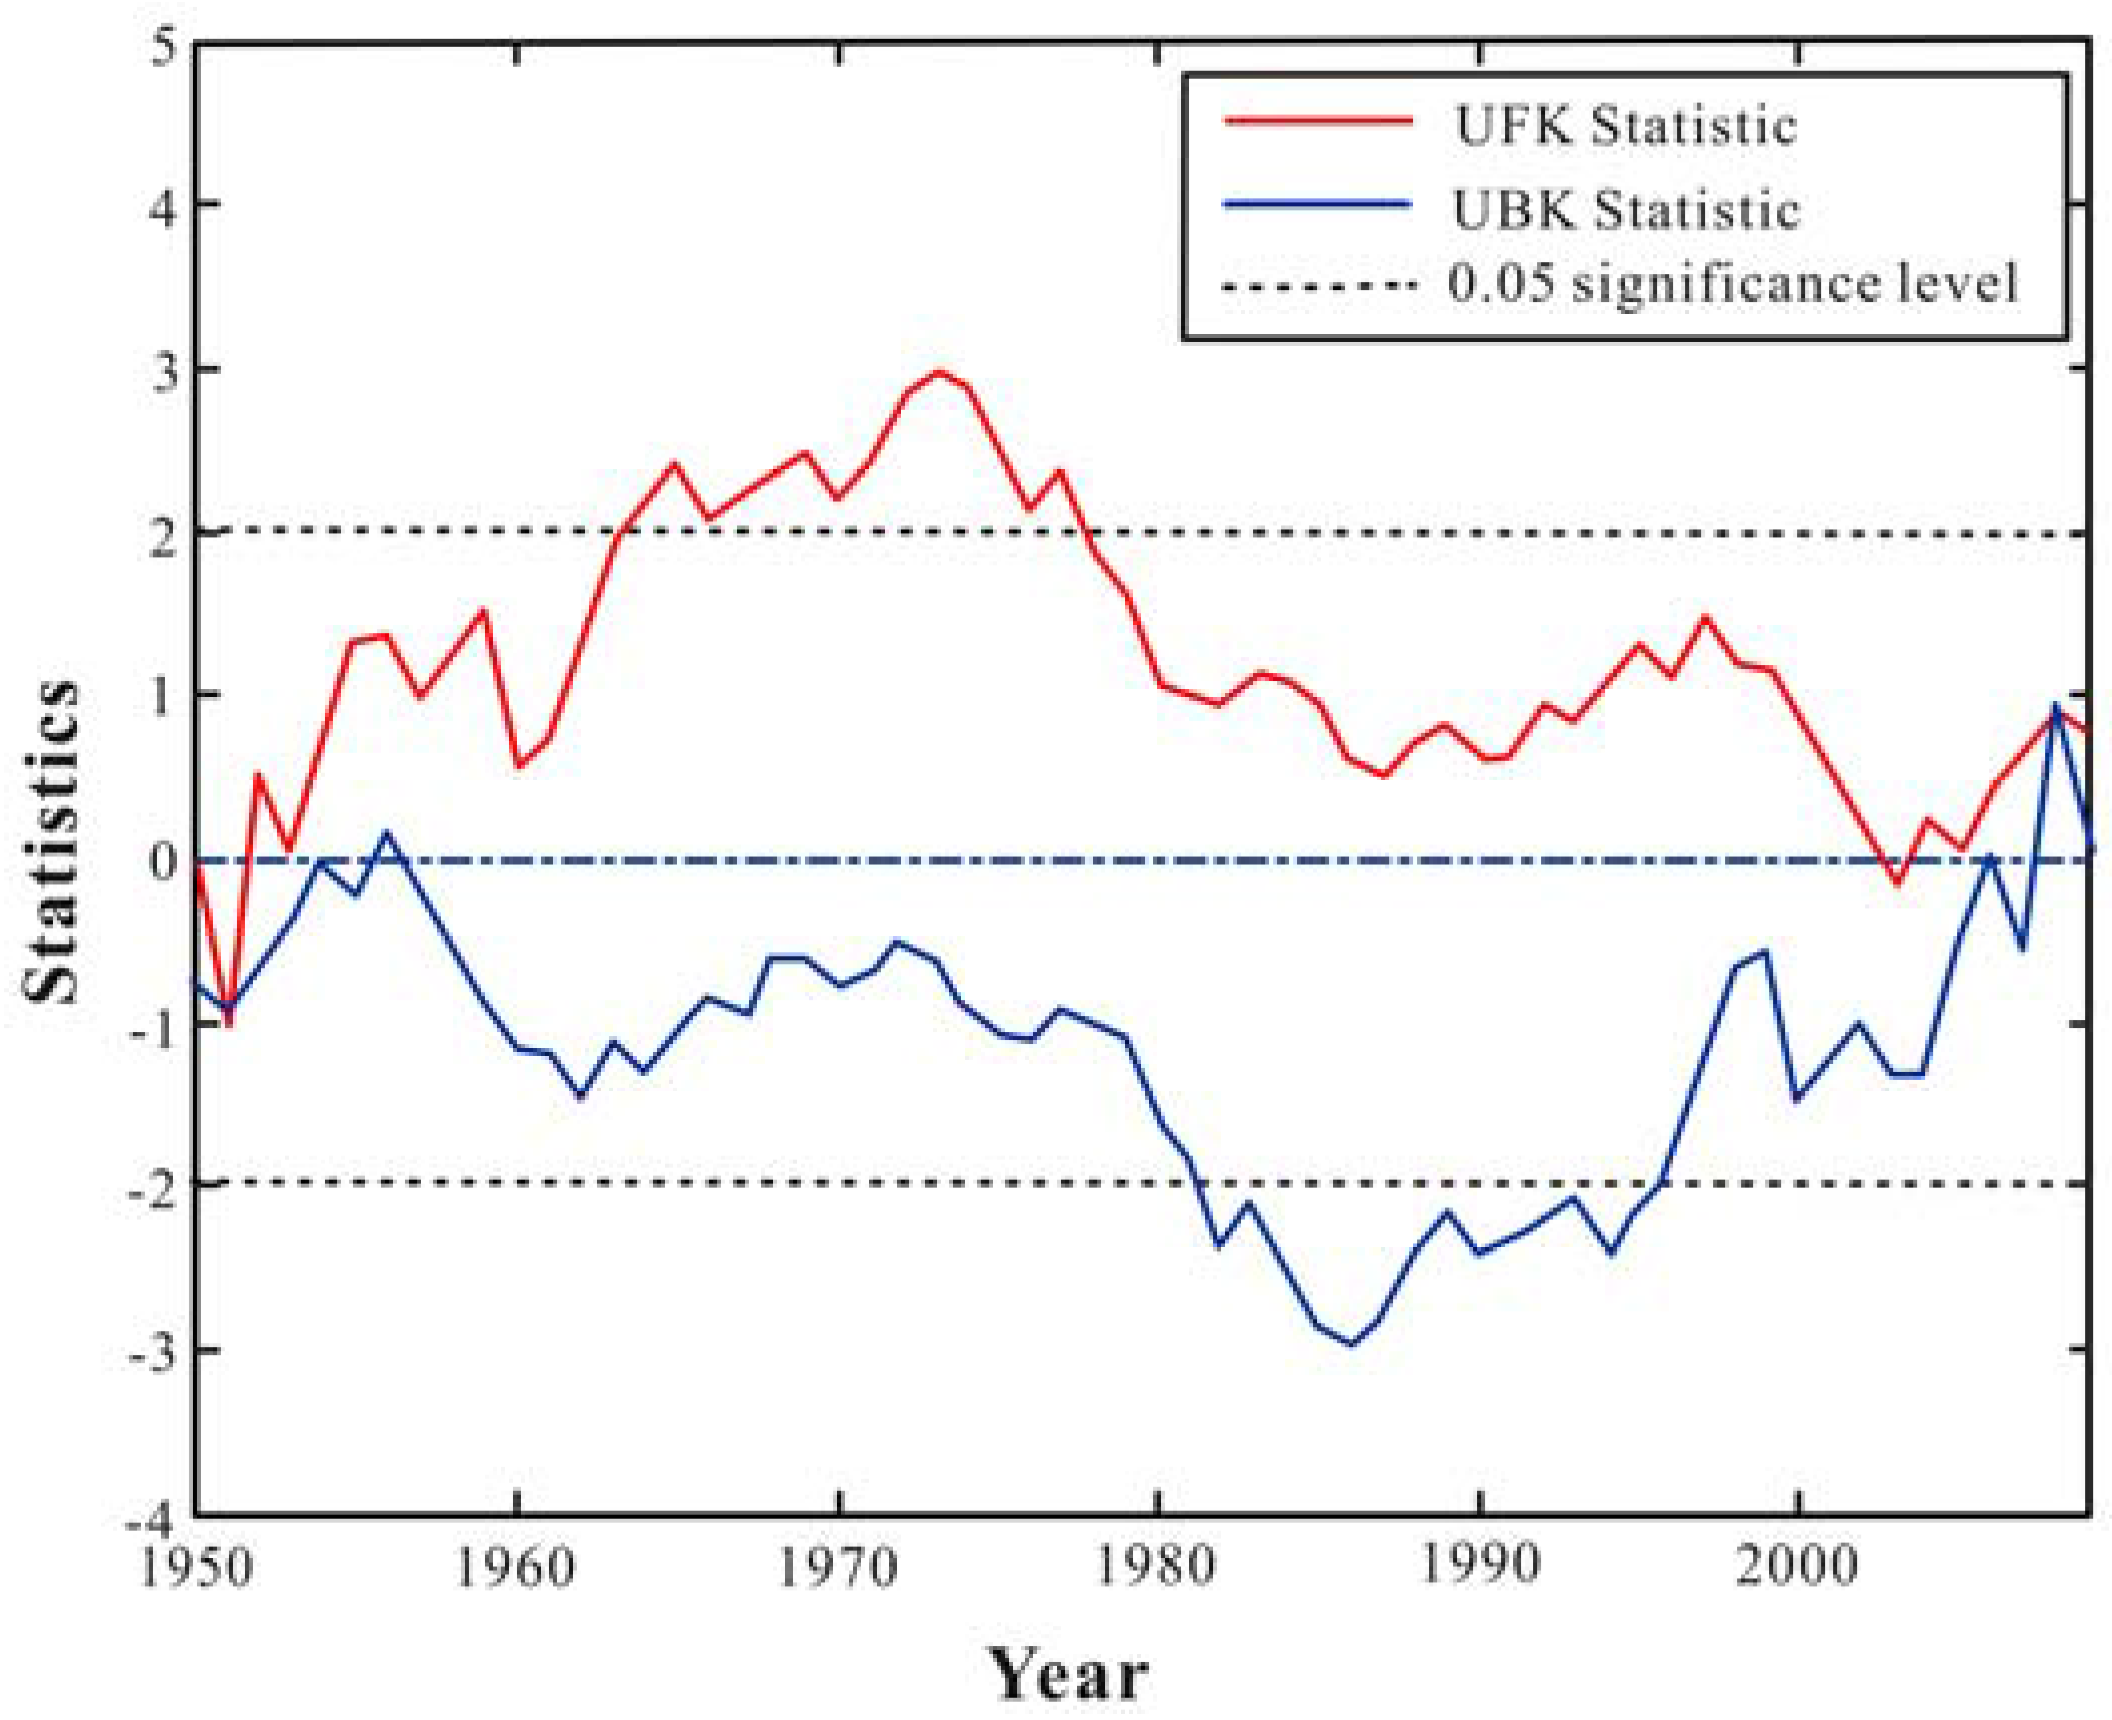
3.2.2. Interannual Variation
3.2.3. Variation in the Growth Periods
4. Discussion
4.1. Hail Disaster Risk for Cotton Assessment Method
4.2. Hail Disaster Risk for Cotton in China and Its Policy Application
4.3. Limitations and Future Studies
5. Conclusions
Acknowledgments
Author Contributions
Conflicts of Interest
References
- Duan, Y. Hail Disaster; China Meteorological Press: Beijing, China, 2009. (In Chinese)
- Baldi, M.; Ciardini, V.; Dalu, J.D.; Filippis, T.D.; Maracchi, G.; Dalu, G. Hail occurrence in Italy: Towards a national database and climatology. Atmos. Res. 2014, 138, 268–277. [Google Scholar] [CrossRef]
- Lemons, H. Hail in American Agriculture. Econ. Geogr. 1942, 18, 363–378. [Google Scholar] [CrossRef]
- Gall, M.; Borden, K.A.; Emrich, C.T.; Cutter, S.L. The Unsustainable Trend of Natural Hazard Losses in the United States. Sustainability 2011, 3, 2157–2181. [Google Scholar] [CrossRef]
- Changnon, S.A., Jr.; Farhar, B.C.; Swanson, E.R. Hail Suppression and Society: Assessment of future hail suppression technology reveals its development should be sizable or ignored. Science 1978, 200, 387–394. [Google Scholar] [CrossRef] [PubMed]
- Changnon, S.A. Increasing major hail losses in the U.S. Clim. Chang. 2009, 96, 161–166. [Google Scholar] [CrossRef]
- Qin, D.H. Major meteorological disasters impacting on China and their development situation. J. Nat. Dis. 2007, 16, 46–48. (In Chinese) [Google Scholar]
- Velten, S.; Leventon, J.; Jager, N.; Newig, J. What Is Sustainable Agriculture? A Systematic Review. Sustainability 2015, 7, 7833–7865. [Google Scholar] [CrossRef]
- Zhao, J.T.; Yue, Y.J.; Wang, J.A.; Yin, Y.Y.; Feng, H.Y. Study on Spatio-temporal Pattern of Hail Disaster in China Mainland from 1950 to 2009. Chin. J. Agrometeorol. 2015, 36, 83–92. (In Chinese) [Google Scholar]
- Berz, G.; Kron, W.; Loster, T.; Rauch, E.; Schimetschek, J.; Schmieder, J.; Siebert, A.; Smolka, A.; Wirtz, A. World map of natural hazards—A global view of the distribution, intensity of significant exposures. Nat. Hazards 2001, 23, 443–465. [Google Scholar] [CrossRef]
- Lee, T.L.; Chen, C.H.; Pai, T.Y.; Wu, R.S. Development of a Meteorological Risk Map for Disaster Mitigation and Management in the Chishan Basin, Taiwan. Sustainability 2015, 7, 962–987. [Google Scholar] [CrossRef]
- Giaiotti, D.; Nordio, S.; Stel, F. The climatology of hail in the plain of Friuli Venezia Giulia. Atmos. Res. 2003, 67–68, 247–259. [Google Scholar] [CrossRef]
- Leslie, L.M.; Leplastrier, M.; Uckley, B.W. Estimating future trends in severe hailstorms over the Sydney Basin: A climate modelling study. Atmos. Res. 2008, 87, 37–51. [Google Scholar] [CrossRef]
- Počakal, D.; Večenaj, Ž.; Štalec, J. Hail characteristics of different regions in continental part of Croatia based on influence of orography. Atmos. Res. 2009, 93, 516–525. [Google Scholar] [CrossRef]
- Mezher, R.N.; Doyle, M.; Barros, V. Climatology of hail in Argentina. Atmos. Res. 2012, 114, 70–82. [Google Scholar] [CrossRef]
- Zhang, F.H.; Gao, H. Temproal and spatial features of hail days in China. J. Nanjing Inst. Meteorol. 2008, 31, 687–693. (In Chinese) [Google Scholar]
- Zhang, C.; Zhang, Q.; Wang, Y. Climatology of hail in China: 1961–2005. J. Appl. Meteor. Climatol. 2008, 47, 795–804. [Google Scholar] [CrossRef]
- Xie, B.; Zhang, Q.; Wang, Y. Trends in hail in China during 1960–2005, Geophys. Res. Lett. 2008, 35, 195–209. [Google Scholar] [CrossRef]
- Zhao, H.Y.; Ning, H.F.; Xu, J.F.; Dong, A.X.; Li, Q.Y. Temporal and spatial distribution characteristics of hail in northwest China. Arid Meteorol. 2005, 23, 37–40. (In Chinese) [Google Scholar]
- Ye, C.H.; Jiang, H.F.; Li, N.; Zhai, Z.H.; Ding, Y.; Guo, W.L. Temporal and spatial characteristics of hail distribution in Beijing area. J. China Agric. Univ. 2007, 12, 34–40. (In Chinese) [Google Scholar]
- Bao, Y.X.; Qin, W.N.; Gao, P.; Shen, S.H.; Jiang, Y.P. Spatiotemporal change patterns of hail disaster in Jiangsu Province during recent 30 years. J. Nat. Dis. 2012, 21, 197–205. (In Chinese) [Google Scholar]
- Cai, Y.Y.; Wang, H.; Yu, Y.J. Spatiotemporal distribution and weather characteristics of hail in Fujian Province. J. Nat. Dis. 2009, 18, 43–48. (In Chinese) [Google Scholar]
- Zhang, Z.; Lin, L.; Feng, R.P.; Yang, K. Characteristics of temporal and spatial distribution of hails in Ningxia. Meterol. Sci. Technol. 2008, 36, 567–569. (In Chinese) [Google Scholar]
- Wang, X.M.; Ni, H.; Zhou, S.X. Analysis on distribution law character in time and space of hail disasters in Jilin Province. J. Catastrophol. 1999, 14, 51–55. (In Chinese) [Google Scholar]
- Yang, J.K.; Qi, M.H. Temporal and spatial characteristics of hail distribution in Yunnan Province. Meteorol. Sci. Technol. 2005, 33, 41–44. (In Chinese) [Google Scholar]
- Zhou, Y.S.; Wang, C. Characteristics of temporal and spatial distribution of hail in Guizhou Province. J. Guizhou Meterol. 2009, 33, 9–11. (In Chinese) [Google Scholar]
- Zhang, D.M.; Zhang, X.; Zhao, Z.Y. Temporal-spatial distribution of hail in Fuxin City during 1977 to 2009. J. Anhui Agric. 2010, 38, 17587–17589. (In Chinese) [Google Scholar]
- Xu, Y.X.; Wang, H.B.; Tan, Z.M. Temporal and spatial distribution characteristics and defensive countermeasures of hail in Yaozhou Tongchuan. J. Shaanxi Agric. Sci. 2008, 2, 165–167. (In Chinese) [Google Scholar]
- Gu, X.; Zhang, Y.M. The inhomogeneity characteristics of hail events in the year in southeast Guizhou. Chin. J. Agro-Meteorol. 2010, 31, 627–632. (In Chinese) [Google Scholar]
- Cao, L.X.; Liu, X.Q.; Zhang, L.; Wamg, Z.L.; Zhang, J.D. Temporal and spatial distribution characteristics and defensive countermeasures of hail from 1998 to 2008 in Akesu. Desert Oasis Meteorol. 2009, 3, 21–24. (In Chinese) [Google Scholar]
- Vinet, F. Climatology of hail in France. Atmos. Res. 2001, 56, 309–323. [Google Scholar] [CrossRef]
- Changnon, S.A. Temporal, spatial distributions of damaging hail in the continental United States. Phys. Geogr. 2008, 29, 341–350. [Google Scholar] [CrossRef]
- Webb, J.D.C.; Elsoma, D.M.; Meadena, G.T. Severe hailstorms in Britain and Ireland, a climatological survey and hazard assessment. Atmos. Res. 2009, 93, 587–606. [Google Scholar] [CrossRef]
- Sioutas, M.; Meaden, T.; Webb, J.D.C. Hail frequency, distribution, intensity in Northern Greece. Atmos. Res. 2009, 93, 526–533. [Google Scholar] [CrossRef]
- Wang, J.A.; Shi, P.J.; Liu, Y.H.; Fang, W.H. Hail disaster in China during 1990–1996 and its dynamic spatial and temporal analysis. J. Nat. Dis. 1999, 8, 46–53. (In Chinese) [Google Scholar]
- Wang, Q.X.; Ren, Y.Y. Temporal and spatial distribution features of hail disasters in Xinjiang in recent 51 years. Arid Land Geogr. 2006, 29, 65–69. (In Chinese) [Google Scholar]
- Resul, A.; Wahit, E.; Melike, S.; Wang, M.Y. Analysis of space-temporal distribution of hail Disaster and its statistics character in Kuitun-Manas River Basin. Desert Oasis Meteorol. 2007, 1, 37–40. (In Chinese) [Google Scholar]
- Mansur, S. Analyzing the spatio-temporal variations of hail disasters in Southern Xinjiang region during recent 60 years. J. Glaciol. Geocryol. 2012, 34, 795–801. (In Chinese) [Google Scholar]
- Resuli, A.; Niu, S.J.; Wang, H.Y. Spatial temporal distribution characteristics of hail in Xinjiang. J. Nat. Dis. 2013, 22, 158–163. (In Chinese) [Google Scholar]
- Liu, X.M.; Li, J.; Dai, P.; Liu, M.; Wei, N.; Liu, F.H.; Huang, X.P.; Guo, Y.J. Temporal-spatial distribution of hail disaster from 1951 to 2008 in Liaoning province. J. Meteorol. Environ. 2009, 25, 24–26. (In Chinese) [Google Scholar]
- Yao, J.Y.; Sun, S.; Liu, Y.X.; Wang, C.L.; Zhu, H.R. Analysis on temporal and spatial distribution characteristics of hail disasters in Heilongjiang Province. Heilongjiang Agric. Sci. 2012, 4, 45–49. (In Chinese) [Google Scholar]
- He, T.R.; Ji, T.; Yang, H. Temporal and spatial distribution characteristics of hail disasters in the past 110 years in Chongqing. J. Chongqing Norm. Univ. Nat. Sci. 2013, 30, 22–25. (In Chinese) [Google Scholar]
- Zhang, H.Z.; Jia, L. Temporal-spatial characteristics and hazard regionalization of hail events in Tibet. Meteorol. Sci. Technol. 2007, 35, 53–56. (In Chinese) [Google Scholar]
- Zhou, L.; Yue, Y.J.; Li, J.; Qiu, M.M.; Shang, Y.R. Review of research on vulnerability assessment of hail hazard bearing body. Chin. J. Agrometerol. 2014, 35, 330–337. (In Chinese) [Google Scholar]
- Yu, S.X.; Wang, Z.S. On the future Chinese cotton technological development strategy. J. Shenyang Agric. Univ. Soc. Sci. Ed. 2012, 14, 3–10. (In Chinese) [Google Scholar]
- Wang, Y.; Wang, J.A.; Wu, W.B.; Li, W.H. Agricultural hail disaster and its seasonal regionalization in China. J. Nat. Dis. 2002, 11, 30–36. (In Chinese) [Google Scholar]
- Wan, Y.X.; Jin, W.P.; Wang, G.E.; Li, H.H.; Cui, S.F.; Li, J.L. Study on growing of different type of cotton destroyed by hail-stones during Cotyledon Period. China Cotton 2004, 31, 12–13. (In Chinese) [Google Scholar]
- Wen, K.G. Encyclopedia of Meteorological Disasters in China; China Meteorological Press: Beijing, China, 2006.
- China Meterological Administration. China Meteorological Disasters Yearbook 2006; China Meteorological Press: Beijing, China, 2006. (In Chinese)
- China Meterological Administration. China Meteorological Disasters Yearbook 2007; China Meteorological Press: Beijing, China, 2007. (In Chinese)
- China Meterological Administration. China Meteorological Disasters Yearbook 2008; China Meteorological Press: Beijing, China, 2008. (In Chinese)
- China Meterological Administration. China Meteorological Disasters Yearbook 2009; China Meteorological Press: Beijing, China, 2009. (In Chinese)
- China Meterological Administration. China Meteorological Disasters Yearbook 2010; China Meteorological Press: Beijing, China, 2010. (In Chinese)
- National Disaster Reduction Center of the Ministry of Civil Affairs of China (NDRC-MCA). Disaster Reduction in China; NDRC-MCA: Beijing, China, 2001.
- National Disaster Reduction Center of the Ministry of Civil Affairs of China (NDRC-MCA). Disaster Reduction in China; NDRC-MCA: Beijing, China, 2002. (In Chinese)
- National Disaster Reduction Center of the Ministry of Civil Affairs of China (NDRC-MCA). Disaster Reduction in China; NDRC-MCA: Beijing, China, 2003. (In Chinese)
- National Disaster Reduction Center of the Ministry of Civil Affairs of China (NDRC-MCA). Disaster Reduction in China; NDRC-MCA: Beijing, China, 2004. (In Chinese)
- Zhou, L.S.; Zhang, L.S.; Zhou, S.Y. The Agriculture Atlas of People’s Republic of China; Sino Maps Press: Beijing, China, 1989. (In Chinese)
- Institute of Cotton Research of Chinese Academy of Agricultural Sciences. China Cotton Cultivation Science; Shanghai Scientifi & Technical Publishers: Shanghai, China, 2013. (In Chinese) [Google Scholar]
- Data Center for Resources and Environmental Sciences (RESDC) of Chinese Academy of Sciences. Land Use of China. 2005. Available online: http://www.resdc.cn/data.aspx?DATAID=98 (assessed on 1 January 2016).
- Birkmann, J. Risk. In Encyclopedia of Natural Hazards; Bobrowsky, P.T., Ed.; Springer: Heidelberg, Germany, 2013. [Google Scholar]
- United Nations Office for Disaster Risk Reduction. Living with Risk: A Global Review of Disaster Reduction Initiatives; United Nations: Geneva, Switzerland, 2004. [Google Scholar]
- Dilley, M.; Chen, R.S.; Deichmann, U.; Lerner-Lam, A.L.; Arnold, M.; Agwe, J.; Buys, P.; Kjekstad, O.; Lyon, B.; Yetman, G. Natural Disaster Hotspots: A Global Risk Analysis; Disaster Risk Management Series No. 5; The World Bank: Washington, DC, USA, 2005. [Google Scholar]
- Webb, J.D.C.; Elsom, D.M.; Meaden, G.T. The TORRO hailstorm intensity scale. J. Meteorol. 1986, 11, 337–339. [Google Scholar]
- Wen, H.Y.; Tian, H.; Tang, W.A.; Lu, Y.Y.; Wu, R. Climatic characteristics of hail disaster and its risk zoning in Anhui Province. Chin. J. Agrometeorol. 2013, 34, 88–93. (In Chinese) [Google Scholar]
- Dong, P.J.; Wang, J.J. Risk assessment model and regionalization of hail disaster in Beijing area. Torrential Rain Dis. 2012, 31, 29–34. (In Chinese) [Google Scholar]
- Mcmaster, H. Hailstorm risk assessment in rural New South Wales. Nat. Hazards 2001, 24, 87–196. [Google Scholar] [CrossRef]
- Leigh, R.; Kuhnel, I. Hailstorm Loss Modelling and Risk Assessment in the Sydney Region, Australia. Nat. Hazards 2001, 24, 171–185. [Google Scholar] [CrossRef]
- Li, M.; Zhu, Y.; Ji, W.J. Risk evaluation of hail disaster in Yunnan tobacco planting areas based on GIS. Chin. J. Agrometeorol. 2012, 33, 129–133. (In Chinese) [Google Scholar]
- Hu, H.B.; Dong, P.J.; Xiong, Y.J.; Xuan, C.Y. Hail risk evaluation of meteorological disaster during Beijing olympic games. Meteorol. Mon. 2008, 34, 84–89. (In Chinese) [Google Scholar]
- Dong, P.J.; Wu, Z.H. Risk evaluation model on hail disaster during the Beijing olympic games. Torrential Rain Dis. 2008, 27, 104–108. (In Chinese) [Google Scholar]
- Luo, P. GIS-based risk evaluation model of meteorological disaster: A case study on hail disaster in Chongqing administrative region. J. Nat. Dis. 2007, 16, 38–44. (In Chinese) [Google Scholar]
- Li, L.H.; Chen, H.W.; Mao, W.Y.; Zuo, M.; Liu, W.J. GIS-based hail risk zonation and assessment in Aksu prefecture. Arid Zone Res. 2010, 27, 224–229. (In Chinese) [Google Scholar] [CrossRef]
- Zhou, Y.; Liu, Y.S.; Wu, W.X.; Li, N. Integrated risk assessment of multi-hazards in China. Nat. Hazards 2015, 78, 257–280. [Google Scholar] [CrossRef]
- Jenks, G.F. The Data Model Concept in Statistical Mapping. Int. Yearb. Cartogr. 1967, 7, 186–190. [Google Scholar]
- Wei, F.Y. Modern Climate Statistical Diagnosis and Prediction Technology; China Meteorological Press: Beijing, China, 1999. (In Chinese)
- Fu, C.B.; Wang, Q. The definition and detection of the abrupt climatic change. Sci. Atmos. Sin. 1992, 16, 482–493. (In Chinese) [Google Scholar]
- Ren, G.Y. Climate Change and Chinese Water Resources; China Meteorological Press: Beijing, China, 2007. (In Chinese)
- Zhang, X.R.; Wang, Z.B.; Lin, J. GIS based measurement and regulatory zoning of urban ecological vulnerability. Sustainability 2015, 7, 9924–9942. [Google Scholar] [CrossRef]
- Li, M.Z.; Zhao, F.X. The influence of cotton growth and yield under different hail disaster. Anhui Agric. Sci. 2006, 34, 649–673. (In Chinese) [Google Scholar]
- Hu, G.F.; Qiu, M.M.; Zhou, L.; Li, J.L.; Shen, Y.N.; Yue, Y.J. Experimental study on cotton vulnerability to hail hazard: The effect of simulated hailfall on cotton damages. J. Nat. Dis. 2015, 24, 139–148. (In Chinese) [Google Scholar]
- Yue, Y.J.; Li, J.; Hu, G.F.; Zhou, L.; Zhang, F.; Zhang, H.; Zhao, J.T. Equipment and methodology for experimental research of cotton vulnerability to hail hazard. J. Catastrophol. 2015, 30, 102–107. (In Chinese) [Google Scholar]
- Vitale, J.; Ouattarra, M.; Vognan, G. Enhancing Sustainability of Cotton Production Systems in West Africa: A Summary of Empirical Evidence from Burkina Faso. Sustainability 2011, 3, 1136–1169. [Google Scholar] [CrossRef]


| Data name | Contents | Source |
|---|---|---|
| Encyclopedia of Meteorological Disasters in China [48] | Data on hail disaster cases in the counties all over China from 1950 to 2000 | China Meteorological Press |
| China Meteorological Disasters Yearbook [49,50,51,52,53] | Data on hail disaster cases in the counties all over China from 2005 to 2009 | China Meteorological Press |
| Disaster Reduction in China [54,55,56,57] | Data on hail disaster cases in the counties all over China from 2001 to 2004 | National Disaster Reduction Center of the Ministry of Civil Affairs of China |
| Newspaper-based Disaster Database of China | Data on hail disaster cases in the counties all over China from 1950 to 2005 | Newspapers |
| Web Retrieved Data | Data on hail disaster cases in the counties all over China from 2008 to 2009 | Internet media |
| Cotton planting area | Sowing and seeding stage (s1) | Seedling stage (s2) | Bud stage (s3) | Boll stage (s4) | Boll opening stage (s5) |
|---|---|---|---|---|---|
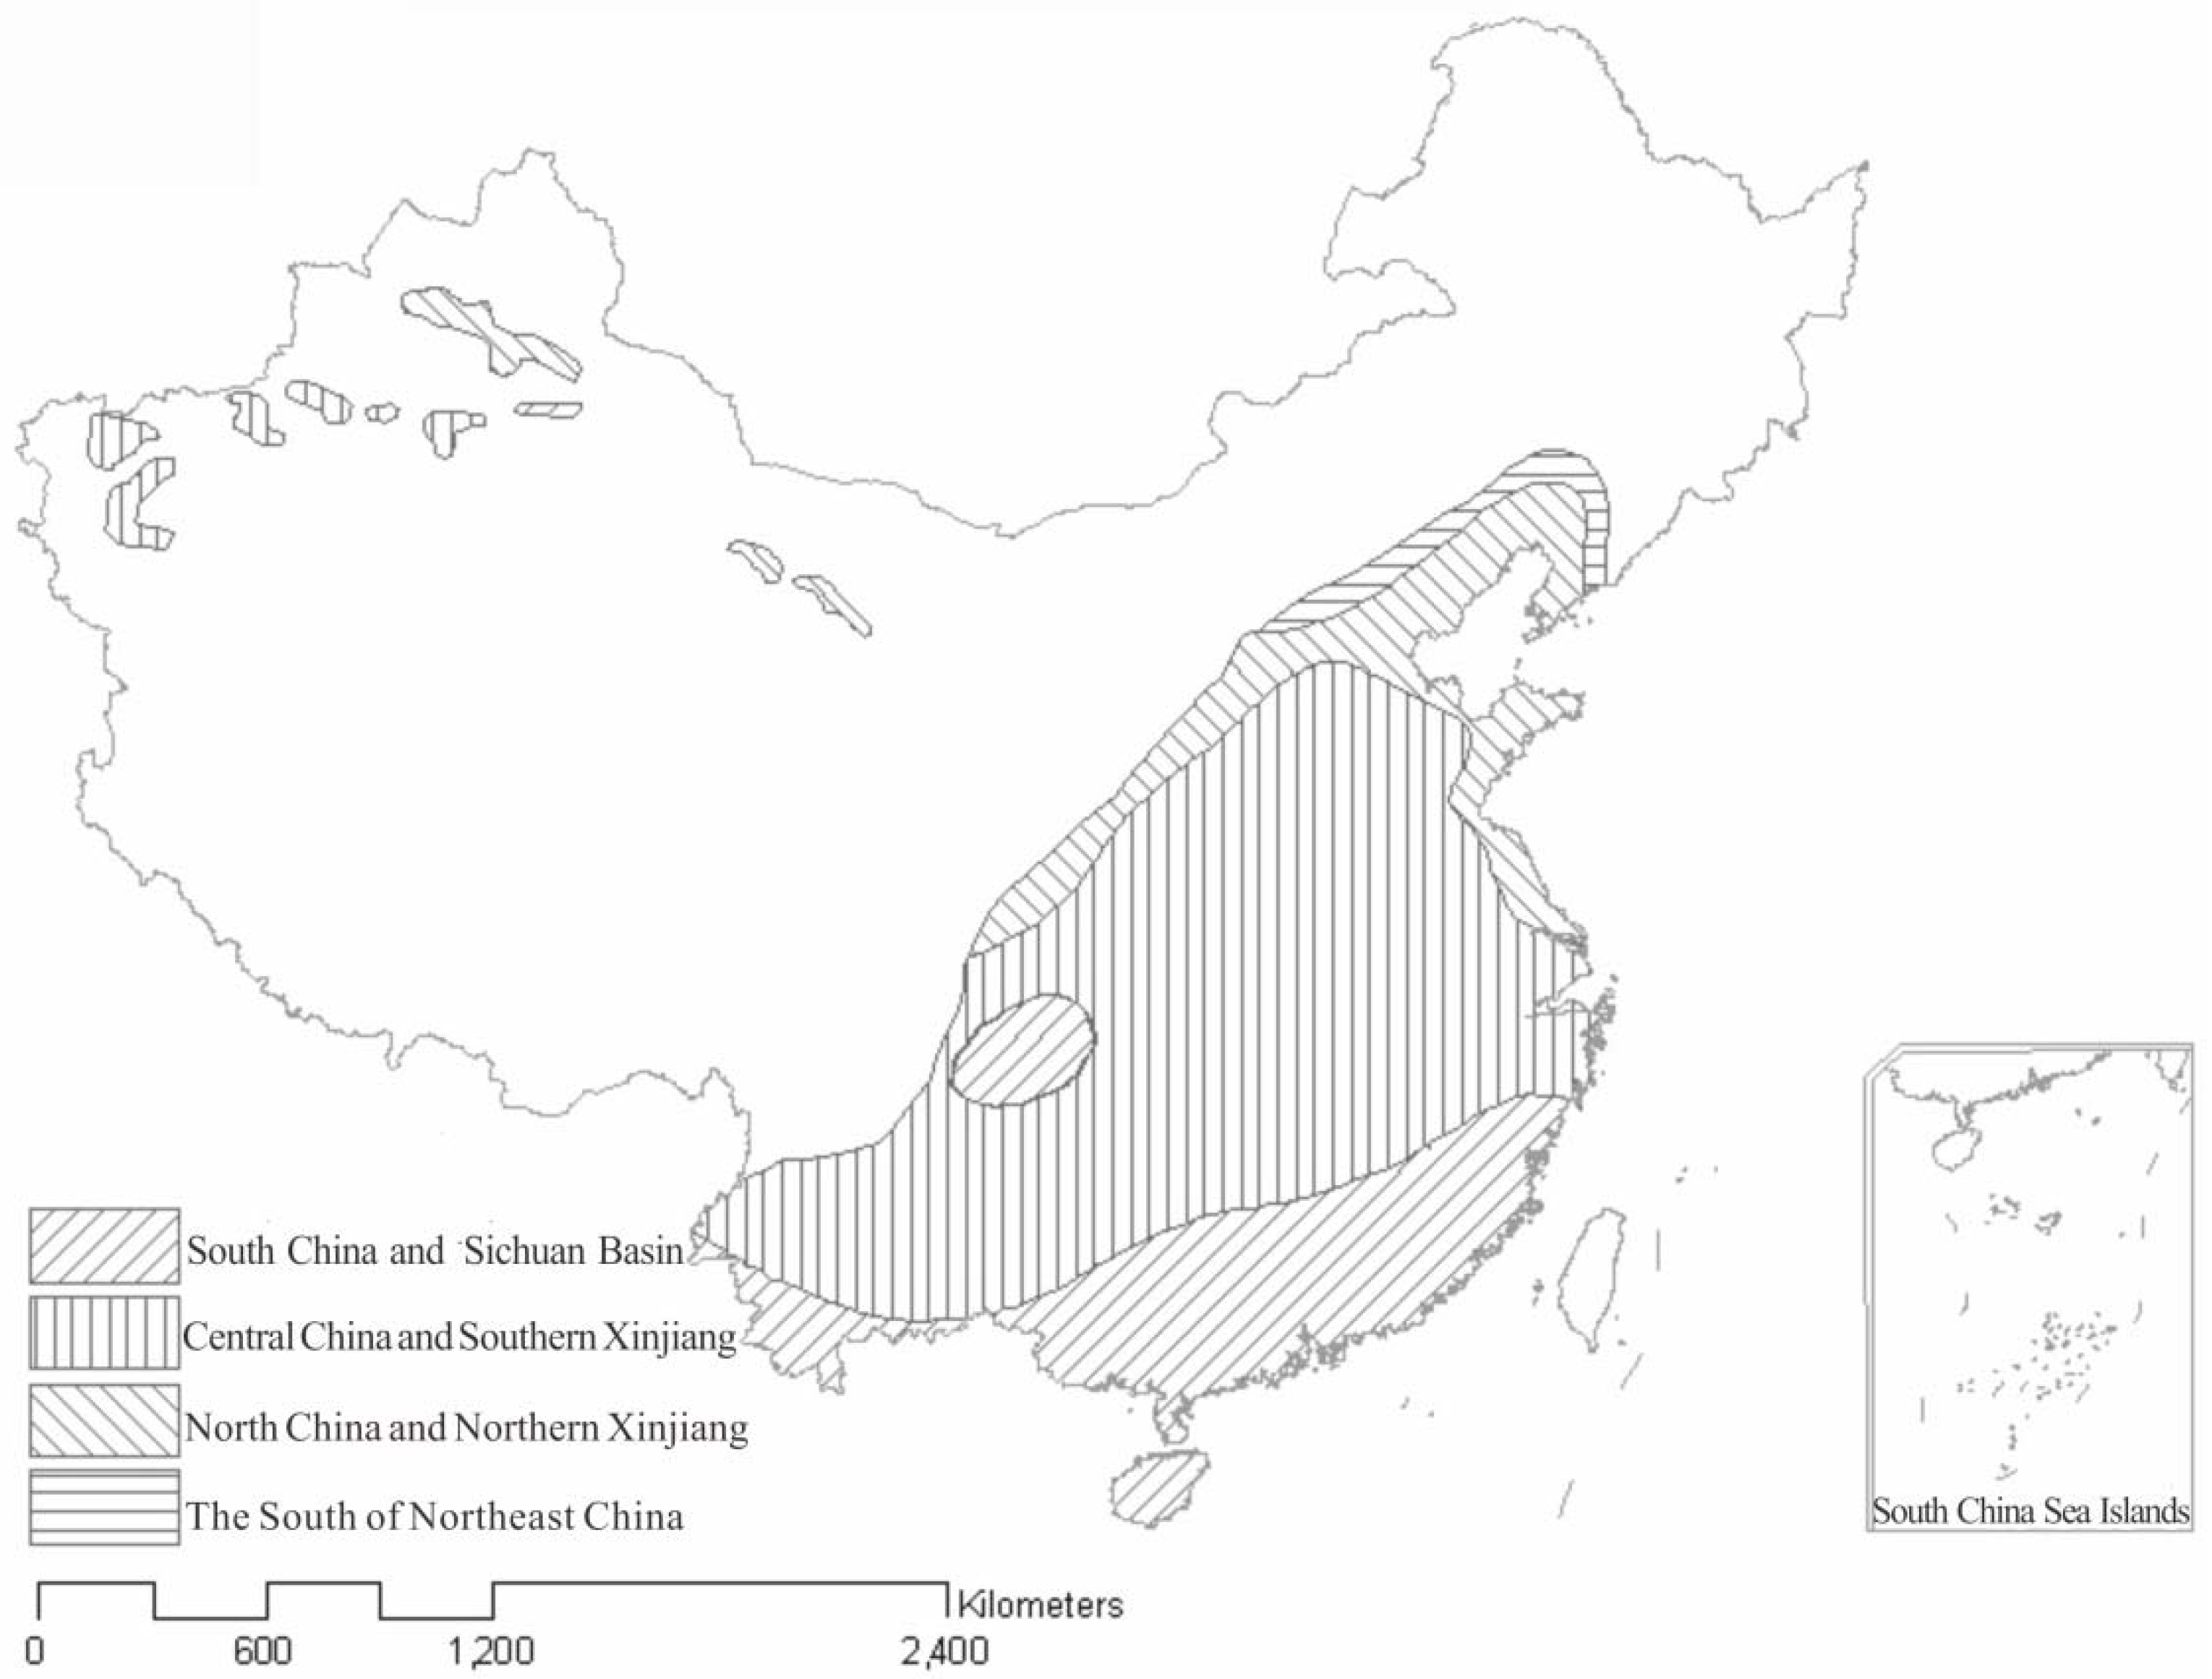
| Southern China and Sichuan Basin | 1–20 April | 21 April –10 June | 11 June–5 July | 6 July–25 August | 26 August–15 October |
| Central China and Southern Xinjiang | 5–25 April | 26 April–15 June | 16 June–10 July | 11 July–30 August | 1 September–20 October |
| Northern China and northern Xinjiang | 10–30 April | 1 May–20 June | 21 June–15 July | 16 July–5 September | 6 September–1 November |
| Northeastern China | 15 April–5 May | 6 May–25 June | 26 June–20 July | 26 July–5 September | 6 September–1 November |
| Duration (days) | 20 | 50 | 25 | 50 | 50 |
© 2016 by the authors; licensee MDPI, Basel, Switzerland. This article is an open access article distributed under the terms and conditions of the Creative Commons by Attribution (CC-BY) license (http://creativecommons.org/licenses/by/4.0/).
Share and Cite
Wang, L.; Hu, G.; Yue, Y.; Ye, X.; Li, M.; Zhao, J.; Wan, J. GIS-Based Risk Assessment of Hail Disasters Affecting Cotton and Its Spatiotemporal Evolution in China. Sustainability 2016, 8, 218. https://doi.org/10.3390/su8030218
Wang L, Hu G, Yue Y, Ye X, Li M, Zhao J, Wan J. GIS-Based Risk Assessment of Hail Disasters Affecting Cotton and Its Spatiotemporal Evolution in China. Sustainability. 2016; 8(3):218. https://doi.org/10.3390/su8030218
Chicago/Turabian StyleWang, Lin, Guofang Hu, Yaojie Yue, Xinyue Ye, Min Li, Jintao Zhao, and Jinhong Wan. 2016. "GIS-Based Risk Assessment of Hail Disasters Affecting Cotton and Its Spatiotemporal Evolution in China" Sustainability 8, no. 3: 218. https://doi.org/10.3390/su8030218