Article

A Rethinking of the Production Approach in IPCC: Its Objectiveness in China

by
Hongqiang Yang
1,2,3,* and
Xiaobiao Zhang
1,3
1
College of Economics and Management, Nanjing Forestry University, Nanjing 210037, China
2
Center for the Yangtze River Delta’s Socioeconomic Development, Nanjing University, Nanjing 210093, China
3
Research Center for Economics and Trade in Forest Products of the State Forestry Administration, Nanjing 210037, China
*
Author to whom correspondence should be addressed.
Sustainability 2016, 8(3), 216; https://doi.org/10.3390/su8030216
Submission received: 4 January 2016 / Revised: 22 February 2016 / Accepted: 24 February 2016 / Published: 27 February 2016
(This article belongs to the Section Environmental Sustainability and Applications)

Abstract

:
The trade of harvested wood products (HWPs) and their feedstock increasingly affects the dynamics of the complete national HWP carbon pool ignored by the Production Approach (PA), the current universal method, proposed by the Intergovernmental Panel on Climate Change. Existing research also overlooks the inherent factors that lead to the non-objectiveness of PA that affects the potential carbon trade and the sustainable use of forestry resources. This study aimed to investigate such inherent factors through a deductive derivation of PA and the Stock-Change Approach (SCA), based on which an empirical study on China was conducted to rethink the objectiveness of PA in the complete national HWP carbon pool. The deductive derivation indicated that the inherent factors rely on the balance between coefficients that describe the relationship between HWP trade and production and the relationship between the corresponding feedstock trade and production. The empirical study further illustrated that the dynamics of balance between coefficients negatively influence the objectiveness of PA. The absolute objectiveness of this approach was constantly weakened in the past 55 years and may potentially occur yet again in the future despite an improvement in its annual relative objectiveness.

1. Introduction

Harvested wood products (HWPs) play an important role in climate mitigation [1,2] whose carbon emission by source or carbon removal by sink should be included in the national greenhouse gas inventories after the second commitment period of the Kyoto Protocol [3].
The Intergovernmental Panel on Climate Change (IPCC) has proposed three approaches for HWP carbon accounting in the 2006 IPCC Guidelines for National Greenhouse Gas Inventories (referred to as 2006 Guidelines hereafter), including the Atmospheric Flow Approach (AFA), the Production Approach (PA), and the Stock-Change Approach (SCA) [4]. PA and SCA focus on stock changes both in forest and in HWPs [5] and are the most applied approaches by scholars. Nonetheless, these methods differ in terms of their treatment of the HWP trade [6]. In particular, SCA regards the exported HWPs as carbon loss but considers the imported HWPs as carbon gain in the national carbon pool, thereby conforming to the theory of property rights in economics. However, PA does not consider the HWP trade in the accounting scope but only focuses on the HWPs produced from domestic harvests [4]. The PA elaborated in the 2013 Revised Supplementary Methods and Good Practice Guidance Arising from the Kyoto Protocol (referred to as 2013 Supplementary hereafter) excludes the HWPs made from exported feedstock, which is part of the domestic harvests [3].
Although PA is the universal approach used by countries to report their greenhouse gas (GHG) inventories of HWPs, especially under the context of sustainable forest management [3], its treatment of HWP trade blocks the contributions of the market to mitigate climate change [7,8]. In particular, the potential carbon value in HWP trade can help developing countries reduce their deforestation and forest degradation [8] because they can gain capital from the carbon trade to form sustainable forest management. These contributions of the HWP trade agree with the fundamental nature of the Kyoto Protocol; that is, the efforts to mitigate climate change should be correctly evaluated [9], and the potential benefits of HWP trade can help implement REDD+ [10].
Compared with SCA, PA has limitations in evaluating the complete national carbon pool of HWPs that may assist in the sustainable use of forestry resources and climate mitigations. Such limitations would lead to its non-objectiveness in reflecting the complete national carbon pool of HWPs in the countries with vast HWP trade, i.e., China, which is the largest producer and exporter of HWPs and the largest importer of corresponding feedstock [11,12]. The 17th Conference of Party (COP17) and the 2013 Supplementary did not deny any other approaches although they selected PA as the universal approach. Hence, this study aims to rethink PA by investigating its inherent difference from SCA, taking China as a case. This particular matter has not been addressed by any previous studies. The current study also acts as a theoretical support for future research on the social and economic effects of the international trade of HWPs.

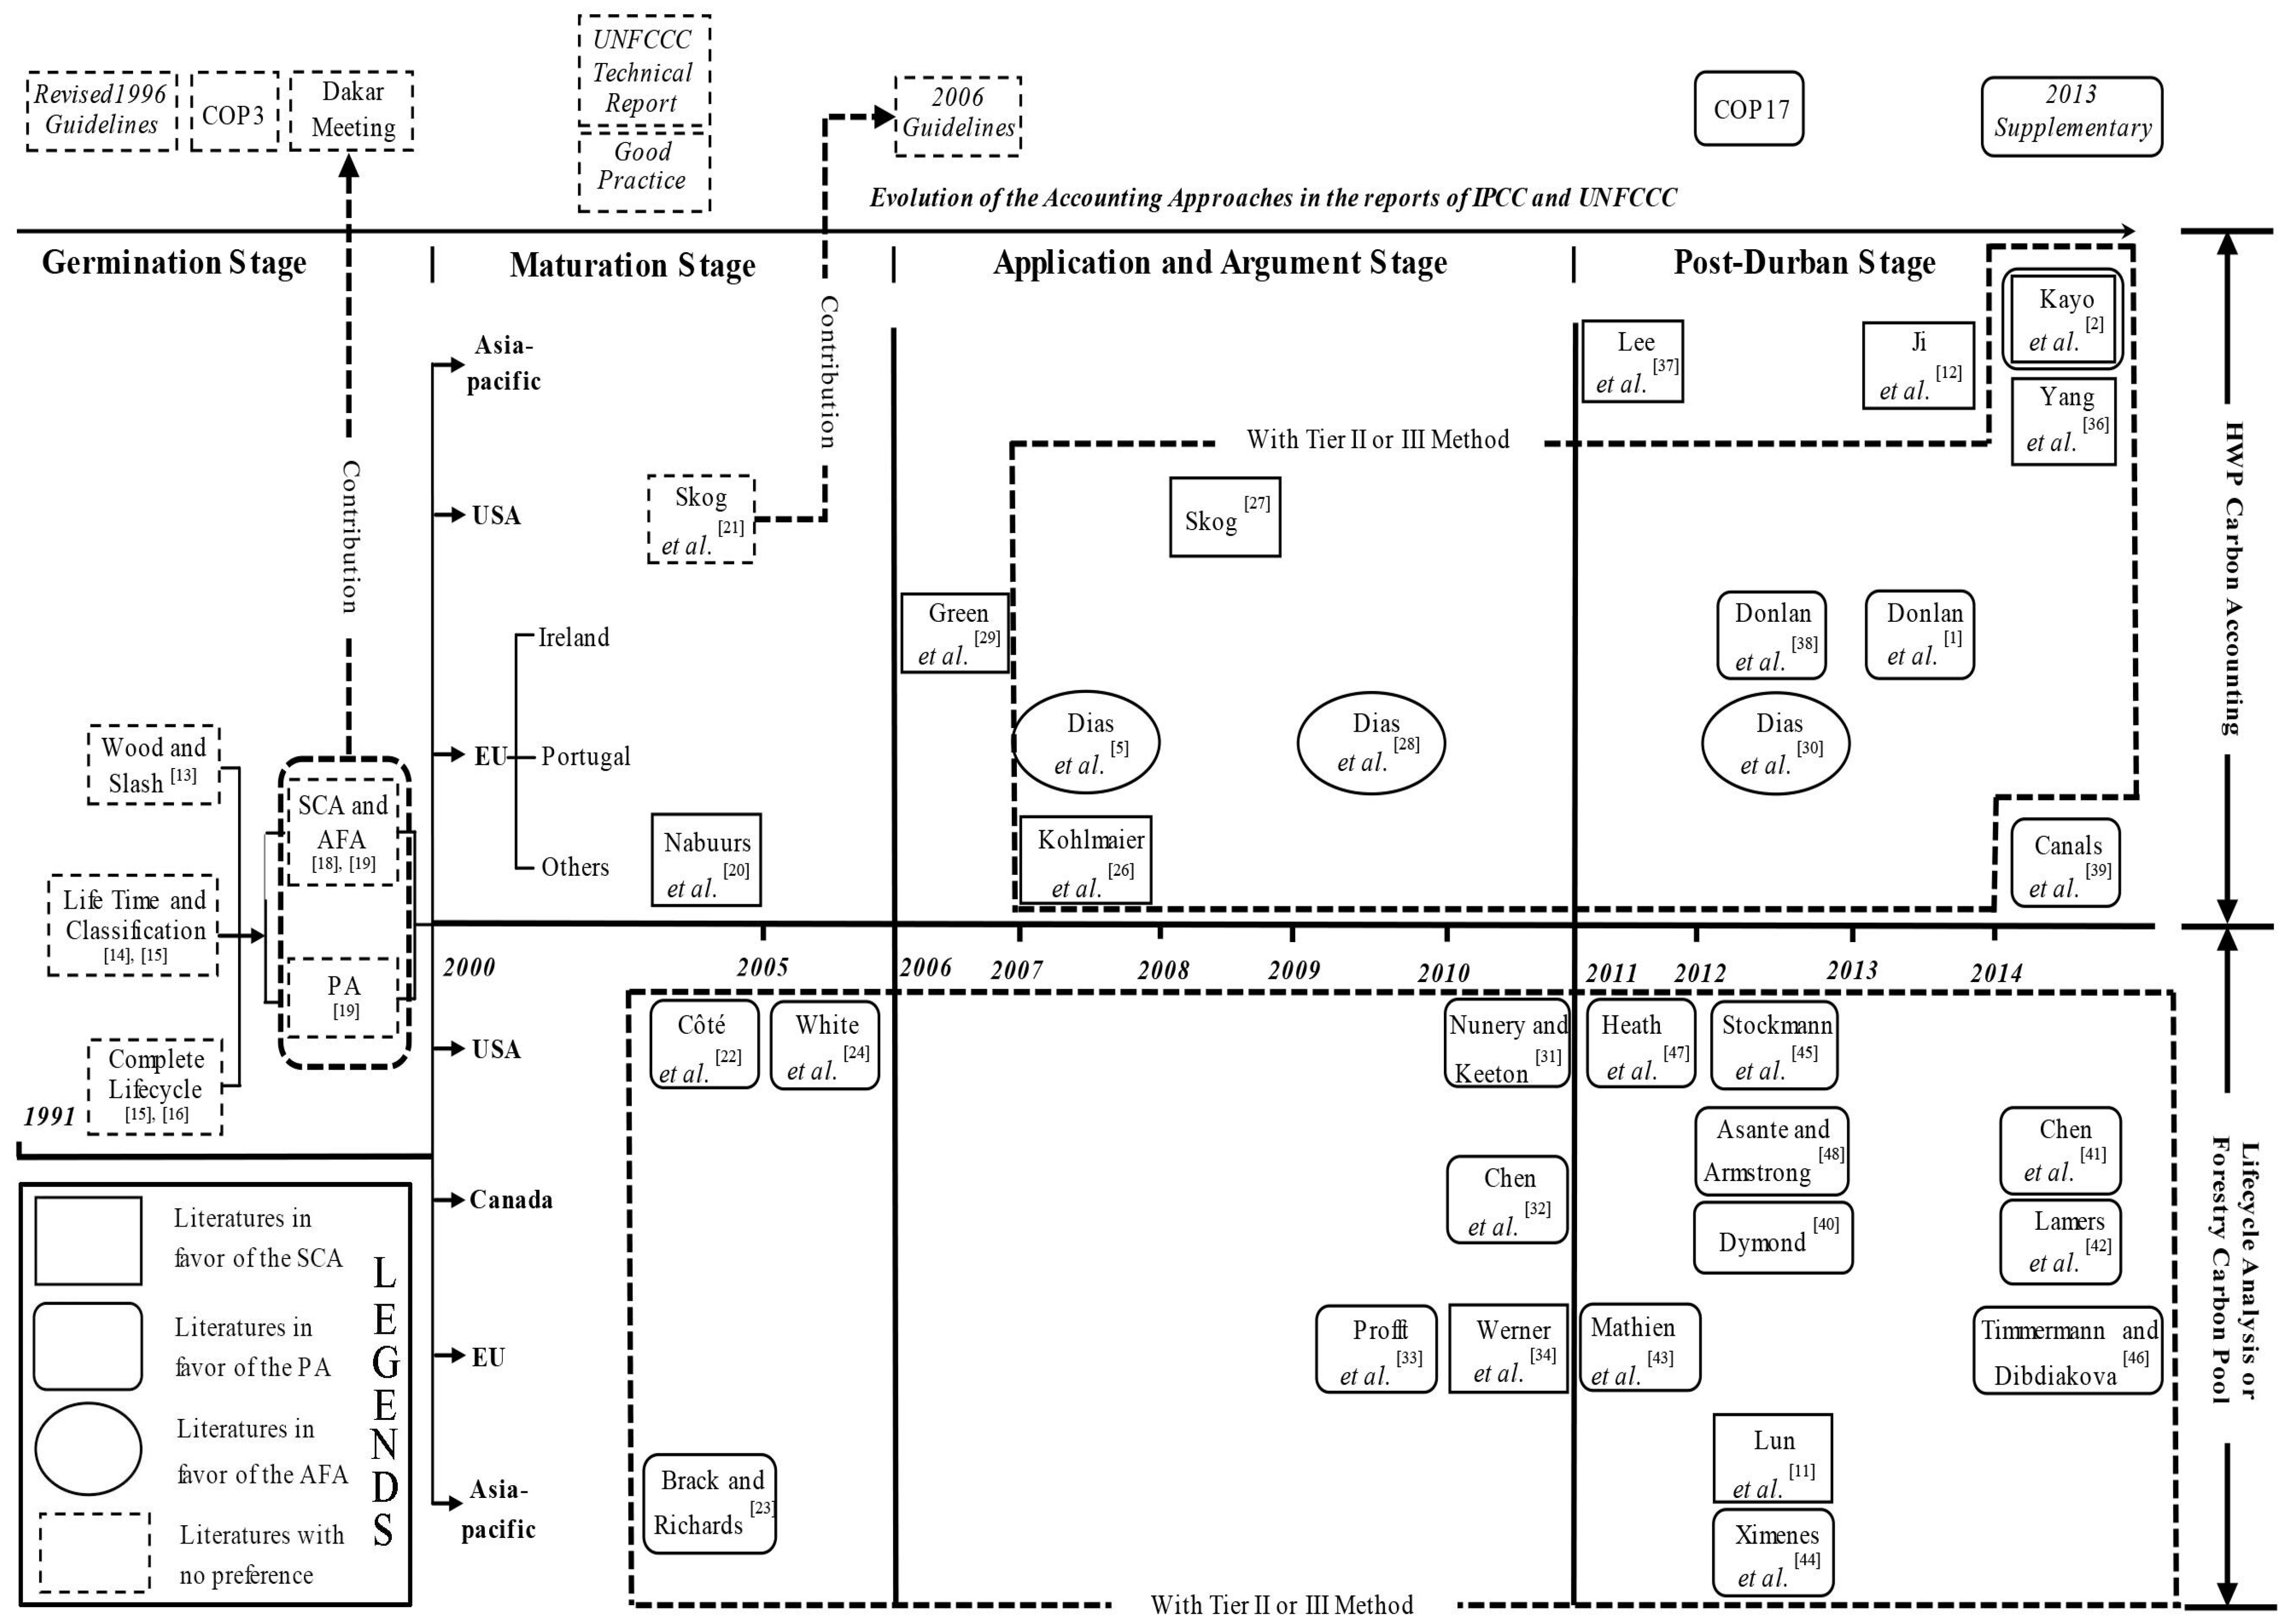
2. Revolution of Methods

Almost all methods used by countries to account their HWP carbon are based on the approaches elaborated by IPCC reports. This study reviews previous research and IPCC/UNFCCC reports from 1991, during which the HWP carbon was first investigated [13], to 2014 (Figure 1) to outline the evolution of the approaches and their applications. The evolution is divided into four stages based on the dynamics of the corresponding IPCC reports, namely, the germination, maturation, application and argument, and post-Durban stages.

2.1. Germination Stage

The germination stage, 1991–2000, refers to the period when the accounting approaches germinated and were conceptually established. HWP carbon accounting originated from an investigation of the carbon flux in managed forests in which harvests are regarded as part of forest management [13,14,15]. The studies conducted in the first seven years have discussed the decomposition patterns of different types of wood [13] and the various classifications of HWPs [14,15] within their service lives. The early lifecycle analysis of HWPs from harvest to disposal was also investigated [15,16]. These fundamental studies generally correspond to the concept of the current approaches and research.
The Revised 1996 IPCC Guidelines for National Greenhouse Gas Inventories (referred to as Revised 1996 Guidelines hereafter) incorporated the carbon of forestry sector into the national GHG inventories [17] and was adopted by the Third Conference of Parties (COP3) held in 1997. However, the Revised 1996 Guidelines assumed that the carbon stock of HWPs can be emitted immediately in the harvest year; this method is called the Default Approach (DA). Based on previous studies, Winjum et al. [18] and Lim et al. [19] summarized and proposed AFA, PA, and SCA, which were further discussed in the Dakar meeting [8] and were adopted by the Good Practice Guidance for Land Use, Land-use Change, and Forestry (referred to as Good Practice hereafter) [6].

2.2. Maturation Stage

Although AFA, PA, and SCA are more theoretically objective than DA in reflecting dynamics and stock in the carbon pool of HWPs, they are far from maturity. The socioeconomic and environmental effects of these approaches need further discussion [7]. Hence, the Good Practice still considered DA as the main approach and regarded AFA, PA, and SCA as alternatives [6]. The second stage of evolution, 2001–2005, pertains to the maturation stage.
During this stage, two categories of studies were conducted. One category compared the accounting approaches based on their application to the carbon accounting of HWPs, whereas the other focused on either the lifecycle analysis of HWPs or the dynamics of forestry carbon pool, which is an integrated carbon pool of forests and HWPs. These study categories objectively helped AFA, PA, and SCA evolve through the years, and the debate during the investigations helped the IPCC choose the universal approach that can be used by countries to report their GHG inventories of HWPs.
The representative study areas in this stage are the EU countries [20], the USA [21,22], and Australia [23]. Studies on the carbon accounting of HWPs indicated that SCA is more suitable than other approaches owing to its accuracy, incentives for the use of long-life HWPs, and sustainable forest management [20]. Nevertheless, scholars only adopted PA to investigate the carbon fluxes in the lifecycle of HWPs and the forestry carbon pool [22,23,24]. Among all scholars involved in this stage, Skog et al. [21] and Pingoud et al. [25] incurred the largest contributions to the accounting approach by further developing SCA and the First-order Decay (FOD) method, respectively. The works of these researchers improved the objectiveness of the accounting approaches and were adopted by the 2006 Guidelines [4].

2.3. Application and Argument Stage

The IPCC proposed the 2006 Guidelines as the theory basis for the second commitment of the Kyoto Protocol. In this guideline, AFA, PA, and SCA became the main approaches adopted by countries to report their carbon emission/removal of HWPs. However, the 2006 Guidelines did not have any preference toward any of these approaches; instead, it encouraged the architecture and use of high-tiered methods on the basis of such approaches, which led to the booming of country-specific methods in carbon accounting [26,27,28].
In the application and argument stage (2006–2010), scholars debated on which approach should be the universal approach to be used by countries to report their GHG inventories. Figure 1 shows that in this stage, the choice of approaches varied across countries and studies unlike in the maturity stage during which all studies favored SCA for the carbon accounting of HWPs. Nonetheless, the studies in the USA [27] and EU countries [26,29] favored SCA during this stage because this approach leads to the largest carbon stock. Scholars have also discussed the uncertainty and socioeconomic effects of each approach and asserted that SCA is the most appropriate in terms of socioeconomics [8,28] but generally has the largest uncertainty [27,29,30].
Most studies on carbon fluxes in the lifecycle of HWPs and forest sector still adopted PA as the only method. In these studies, the models for carbon fluxes of the national forest sector were developed on the basis of country-specific data and methods [31,32,33,34], including the FORCARB2/FORCARB-ON (Forest Carbon Budget/Forest Carbon Budget-Ontario) [32] and CO2FIX (Carbon Dioxide Fixed in the Forest Ecosystem) models [33], which were widely applied in North American and EU countries, respectively. Werner et al. [34] attempted to analyze the carbon fluxes on the basis of SCA, providing another framework for such research area.

2.4. Post-Durban Stage

The COP17 held in Durban in 2011 concluded that only HWPs made from domestic harvests can be included in the national GHG inventories, implying that PA as the universal approach [35]. The IPCC published the 2013 Supplementary in 2014, which requires countries to report the carbon emission/removal of HWPs under their forest management reference level [3]. Thus, the period that begins from 2011 is defined as the post-Durban stage.
In this period, scholars continuously debated on the choice of approaches for HWP carbon accounting, mainly focusing on PA and SCA [36,37,38]. Some Asia-pacific countries/regions with large-scale HWP trade, such as China [11,12,39], Japan [2], and Taiwan [36], joined the application and debate of approaches. Japan designed a combined method of SCA and PA to investigate the interregional carbon flows and balance; such method is an innovation of the application of approaches [2].
The carbon fluxes in the forestry carbon pool and the lifecycle of HWPs were further investigated and occupied the mainstream of the studies in this stage. Additional country-specific models were developed, such as the BC-HWPv1 (British Colombia Harvested Wood Products, Version 1) [40], HWP-CASE (Comprehensive Assessment of Carbon Stock and Emission for Canadian Harvested Wood Products) [41], and CBM-CFS3 v.1.2 (Carbon Budget Model of the Canadian Forest Sector, Version 1.2) models [42], which focus on the carbon fluxes [43,44,45,46] in detailed socioeconomic activities [47,48].

3. Methodology and Derivation

Among all approaches, PA was the most applied by scholars, especially in terms of studies related to forest management and lifecycle analysis. AFA was the least applied because of the flaws in its theory basis [8,11,19], whereas SCA was favored by Asia-Pacific countries for its objectiveness in the complete national carbon pool. This study further explains the inherent mathematical difference between PA and SCA based on deductive derivation to determine the causes and condition in which PA lacks objectiveness in reflecting the complete national carbon pool of HWPs.

3.1. Mathematical Explanations of SCA and PA

The latest mathematical explanation of SCA is elaborated in the 2006 Guidelines. The PAs elaborated in the 2006 Guidelines (referred to as PA2006 hereafter) and the 2013 Supplementary (referred to as PA2013 hereafter) have been used by scholars. These approaches share the same equations (FOD method) for calculating the accumulated changes in the carbon pool as follows:
C ( i + 1 ) = e k C ( i ) + [ ( 1 e k ) k ] I n f l o w ( i )
Δ C ( i ) = C ( i + 1 ) C ( i )
where C(i), with C(1900) = 0, is the carbon stock in inventory year i; ΔC(i) is the annual increment of the carbon pool of HWPs in use; k = ln(2)/HL is the first-order decay rate, and HL is the half-life of the HWPs in use; and Inflow(i) is the carbon that flows into the carbon pool in inventory year i.
The mathematical description of Inflow(i) in Equation (1) is the key difference between SCA and PAs. SCA (Inflow(i)SCA) is described as follows:
I n f l o w ( i ) S C A = P + P I M P E X
where P is the carbon contained in the domestically produced HWPs in inventory year i; and PIM and PEX are the carbon contained in the imported and exported HWPs, respectively, in the inventory year. Equation (3) indicates that the accounting scope of SCA is the domestically consumed HWPs, and the imported and exported HWPs are the increase and decrease of the national carbon pool of HWPs, respectively.
The Inflow(i) for PA2006 (Inflow(i)PA−2006) is described as follows:
I n f l o w ( i ) P A 2006 = P [ I R W H I R W H + I R W I M I R W E X + W C H I M W C H E X + W R I M W R E X ]
where IRWH, IRWIM, and IRWEX are the carbon contained in the industrial round wood from domestic harvest, import, and export, respectively, in inventory year i; WCHIM and WCHEX are the carbon contained in the imported and exported wood chips, respectively, in the inventory year; and WRIM and WREX are the carbon contained in the imported and exported wood residues, respectively, in inventory year i. Equation (4) implies that only the HWPs made from domestically harvested feedstock can be included in the accounting scope of the PA. Therefore, the carbon contained in the domestically produced HWPs should be multiplied with a coefficient described in the bracket: the proportion of the domestically harvested feedstock to the total consumed feedstock.
Equations (5) to (8) show the Inflow(i) for PA2013 (Inflow(i)PA−2013). To simplify the study, the variables that describe forest management are removed because this study does not look into the effects of such variables.
I n f l o w ( i ) P A 2013 = P f D P ( i )
f D P ( i ) = { f I R W ( i ) f P U L P ( i ) ,   f o r   p a p e r   a n d   p a p e r b o a r d f I R W ( i ) ,   f o r   s a w n w o o d   a n d   w o o d b a s e d   p a n e l s
f I R W ( i ) = I R W P ( i ) I R W E X ( i ) I R W P ( i ) + I R W I M ( i ) I R W E X ( i )
f P U L P ( i ) = P U L P P ( i ) P U L P E X ( i ) P U L P P ( i ) + P U L P I M ( i ) P U L P E X ( i )
where fDP(i) is the share of domestic feedstock for HWP production that originates from domestic forests in inventory year i; fIRW(i) is the share of industrial roundwood for the domestic production of HWPs that originates from domestic forests in inventory year i; fPULP(i) is the share of domestically produced pulp for the domestic production of paper and paperboard in inventory year i; IRWP, IRWIM, and IRWEX are the carbon contained in the domestically produced, imported, and exported industrial roundwoods, respectively, in inventory year i; and PULPP, PULPIM, and PULPEX are the carbon contained in the domestically produced, imported, and exported wood pulps, respectively, in inventory year i. In the 2013 Supplementary, PA was revised such that it provides a detailed classification of feedstock and the excluding exported feedstock used to produce HWPs in other countries.

3.2. Mathematical Explanation of the Non-Objectiveness of PA

The non-objectiveness of PA2006 and PA2013 results from the balance between Inflow(i)SCA and Inflow(i)PA−2006 and the balance between Inflow(i)SCA and Inflow(i)PA−2013, respectively. The common part of the approaches, Equations (1) and (2), would lead to delays in the value of non-objectiveness. The balance (B1) between Inflow(i)SCA and Inflow(i)PA−2006 is expressed as follows:
B 1 = P ( 1 f 1 ) + P I M P E X = P [ a I R W H + a ] ( P E X P I M )
where
1 f 1 = I R W I M I R W E X + W C H I M W C H E X + W R I M W R E X I R W H + I R W I M I R W E X + W C H I M W C H E X + W R I M W R E X
and a is the numerator in Equation (10). The solution of equation B1 > 0 is P E X P I M P < a I R W H + a , which states that the proportion of the net exported HWP carbon to the carbon of domestically produced HWPs should not exceed the proportion of the net imported carbon of feedstock to the domestically consumed feedstock.
The balance (B2) between Inflow(i)SCA and Inflow(i)PA−2013 is as follows:
B 2 = { P [ 1 f I R W ( i ) f P U L P ( i ) ] ( P E X P I M ) ,   f o r   p a p e r   a n d   p a p e r b o a r d P [ 1 f I R W ( i ) ] ( P E X P I M ) , f o r   s a w n w o o d   a n d   w o o d b a s e d   p a n e l s
Given that paper and wooden products are accounted separately and carbon sequestration is mainly contributed by wooden products [12], the equation B2 > 0 is solved separately for paper and paperboard and for sawnwood and wood-based panels. The solution is shown in Equations (12) and (13).
P E X P I M P < 1 f I R W ( i ) f P U L P ( i ) ,   f o r   p a p e r   p r o d u c t s
P E X P I M P < 1 f I R W ( i ) ,   f o r   w o o d e n   p r o d u c t s
Given that 0 < fIRW, fPULP < 1, the right part of Equations (12) and (13) is identically positive, whereas the left part varies among countries. These equations are identically right if PEXPIM < 0, which signifies that the country is a net importer of the HWP carbon.

3.3. Economic Meanings of the Solutions

The overall factors that lead to the insufficient objectiveness of PA in the national complete carbon pool (Table 1) are determined based on the deductive derivation explained in the preceding paragraph. Deep economic meanings can be indicated subject to these identified factors. This study also summarizes the related conclusions drawn by existing studies.
The objectiveness of PA is not simply determined by whether a country is a net importer of HWPs; it is decided by the relationship of the trade and the production of HWPs and feedstock. Current studies qualitatively indicate that SCA is favorable for the net importers of HWPs, whereas PA is favorable for net exporters [19,29,40]. The derivation indicates that as long as the proportion of the net exported HWP carbon to the carbon of domestically produced HWPs is lower than the proportion of the net imported carbon of feedstock to domestically consumed feedstock (referred to as SCA–PA2006 coefficient hereafter), PA2006 will lack objectiveness in accounting the complete national carbon pool of HWPs. Such principle is considerably obvious under PA2013. Non-objectiveness only results from the balance between the proportion of the net exported HWP carbon to domestically produced HWP carbon and the proportion of feedstock consumed by other countries (referred to as the SCA–PA2013 coefficient hereafter).

4. Results

This study uses the data from the FAOSTAT database and the obligated factors provided by the 2006 Guidelines and 2013 Supplementary, which are the universal data sources for HWP carbon accounting. This study also further conducts an empirical investigation to identify the long-term dynamics (1961–2015) and future potential of the objectiveness of PA in terms of the complete national carbon pool of China’s HWPs.

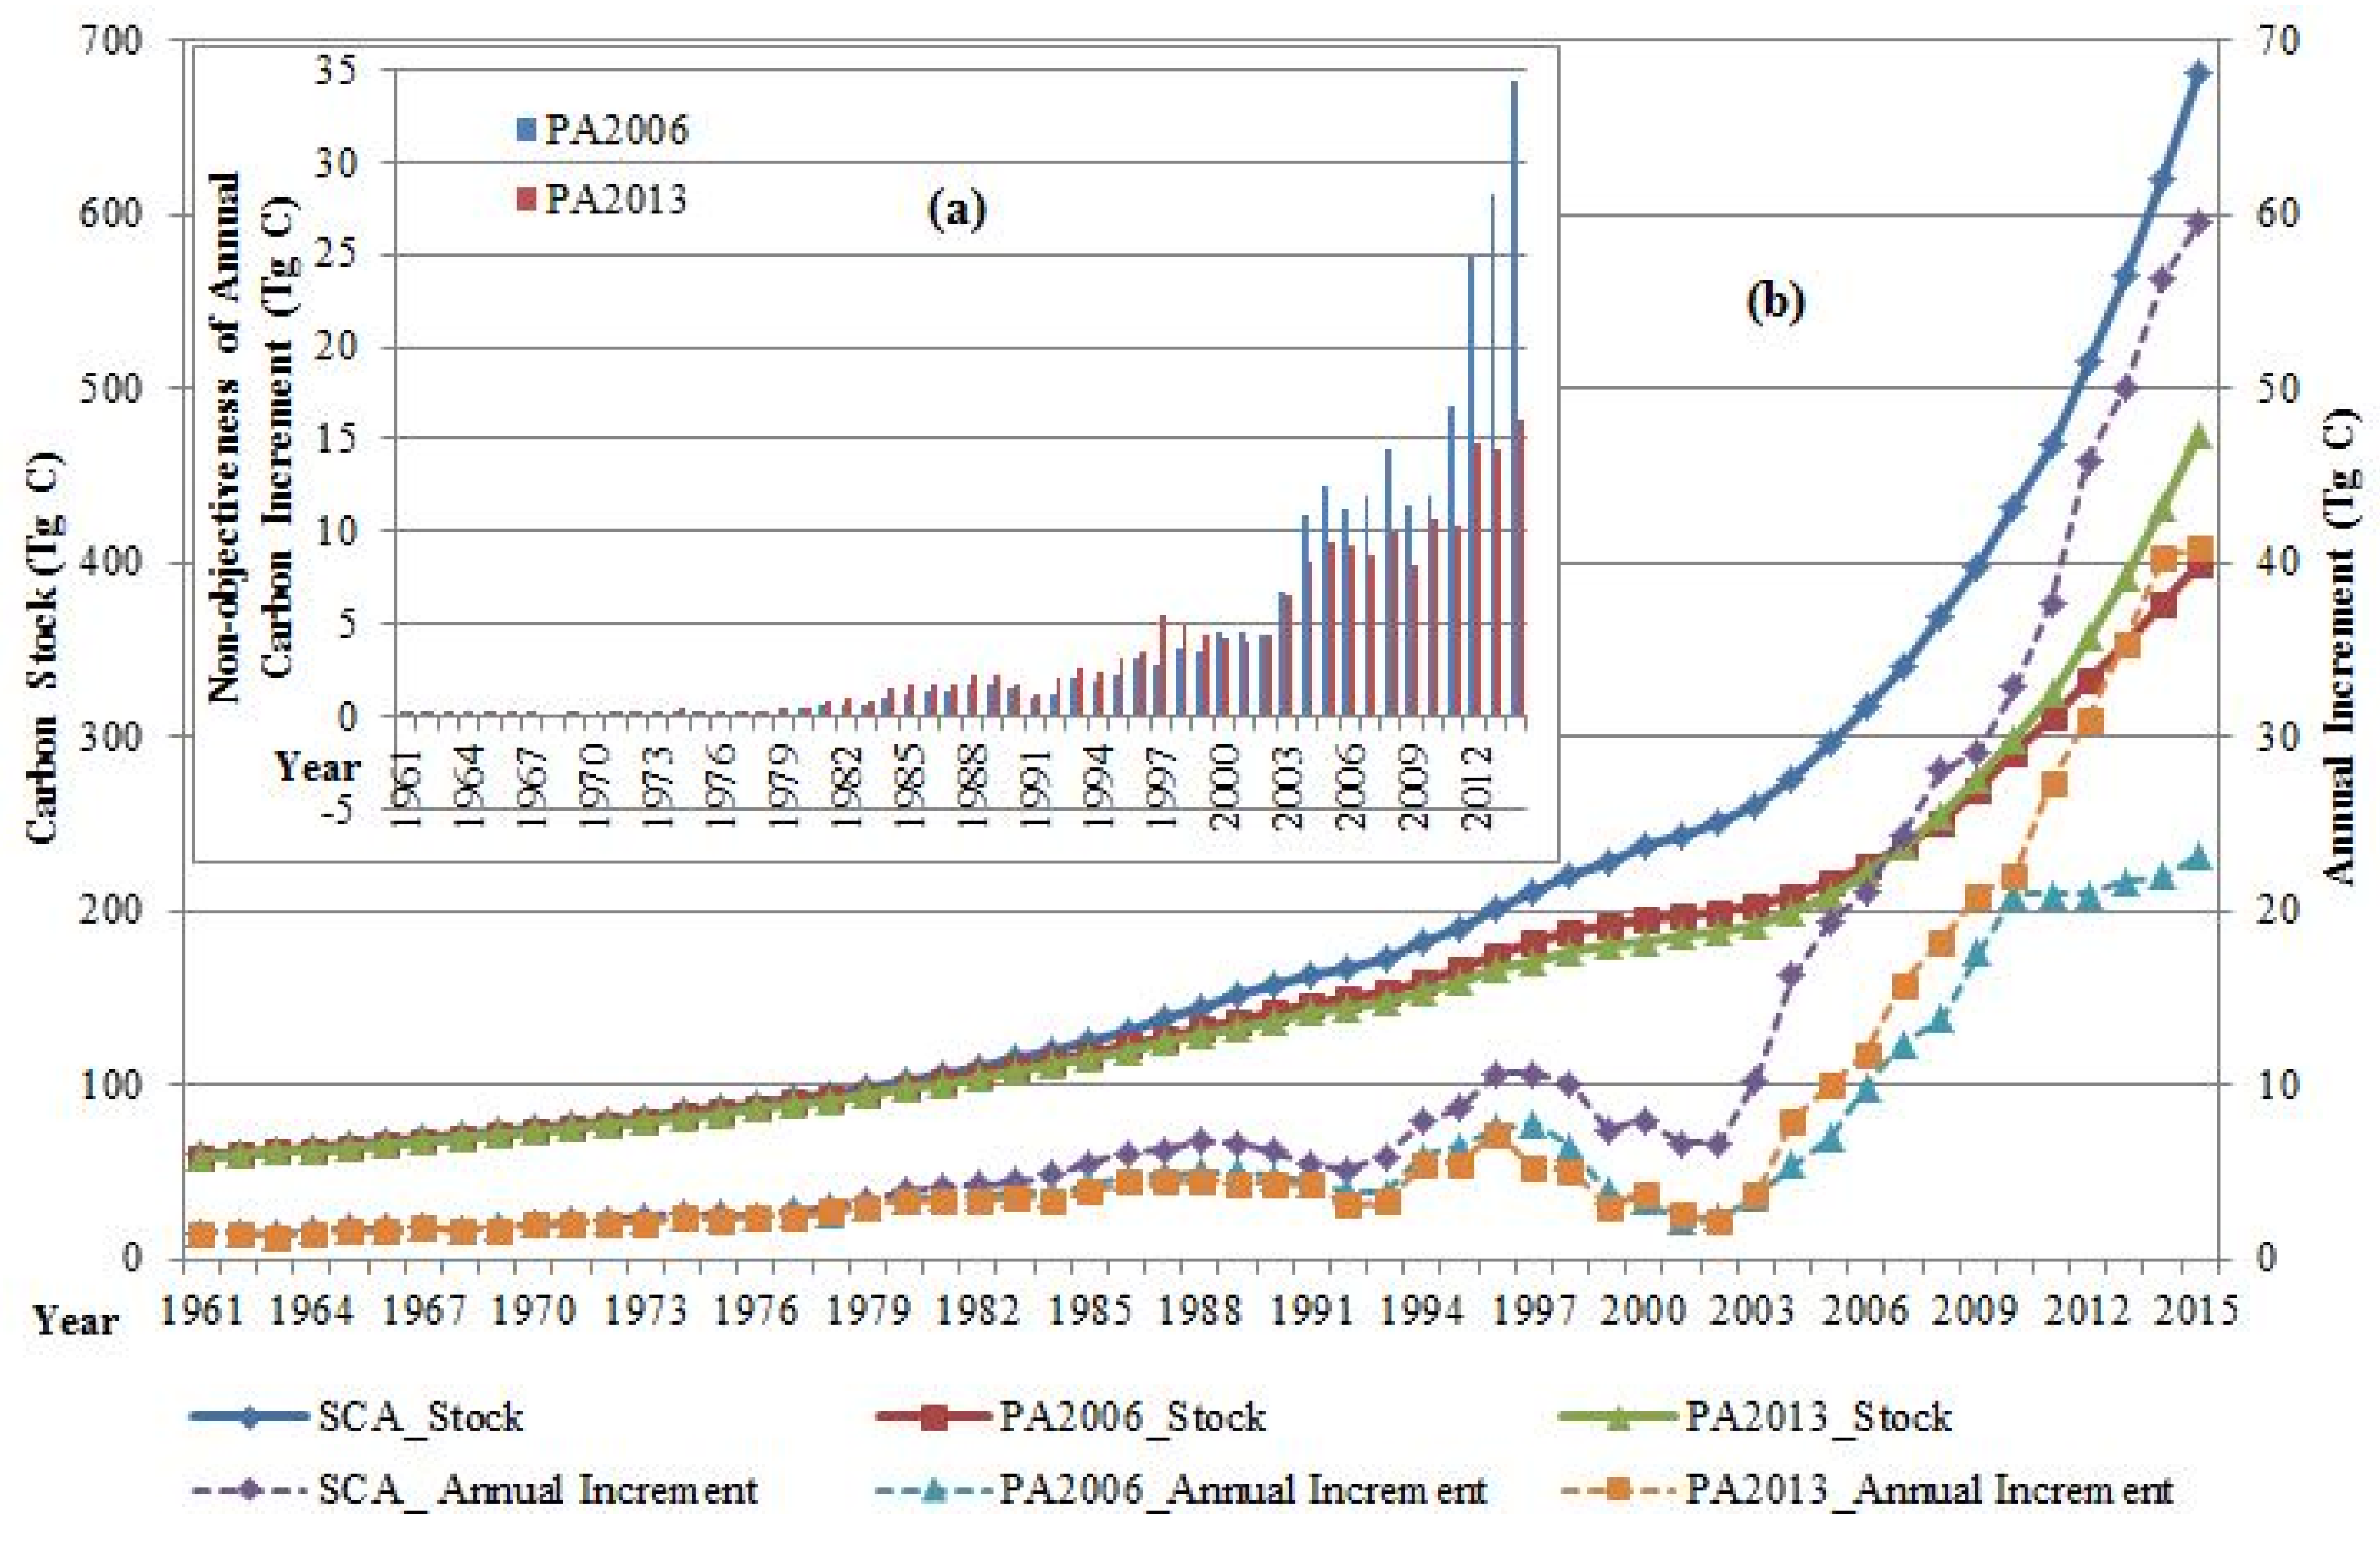
4.1. Overall of the Carbon Stock and the Non-Objectiveness

Regardless of the approach used, the carbon stock and annual increment of the carbon pool of China’s HWPs featured net stock (Figure 2a) steadily grew from 1961 to 2000 and sharply increased since 2001. However, the level of carbon stock calculated by the three approaches varied from one another, especially after 1980 when China implemented the economic reform, which sharply increased the country’s HWP trade. In 2015, the accumulation and annual increment of the carbon stock of China’s HWPs reached 680.63 and 59.63 teregrams (Tg C), respectively, using SCA, 398.87 and 23.21 Tg C, respectively, using PA2006, and 473.31 and 40.88 Tg C, respectively, using PA2013.
The objectiveness of PA was weakened with the boom of China’s HWP trade (Figure 2b). The non-objectiveness of PA2006 continuously increased in the past 55 years, particularly after 2000 when China’s HWP trade began to boom. The non-objectiveness of PA2013 experienced a similar trend although its general increasing rate was relatively low. In 2015, the scale of non-objective parts of the annual carbon stock using PA2006 and PA2013 reached 34.42 and 16.01 Tg C, respectively, which accounted for 61% and 28% of the annual carbon increment calculated by SCA, respectively.

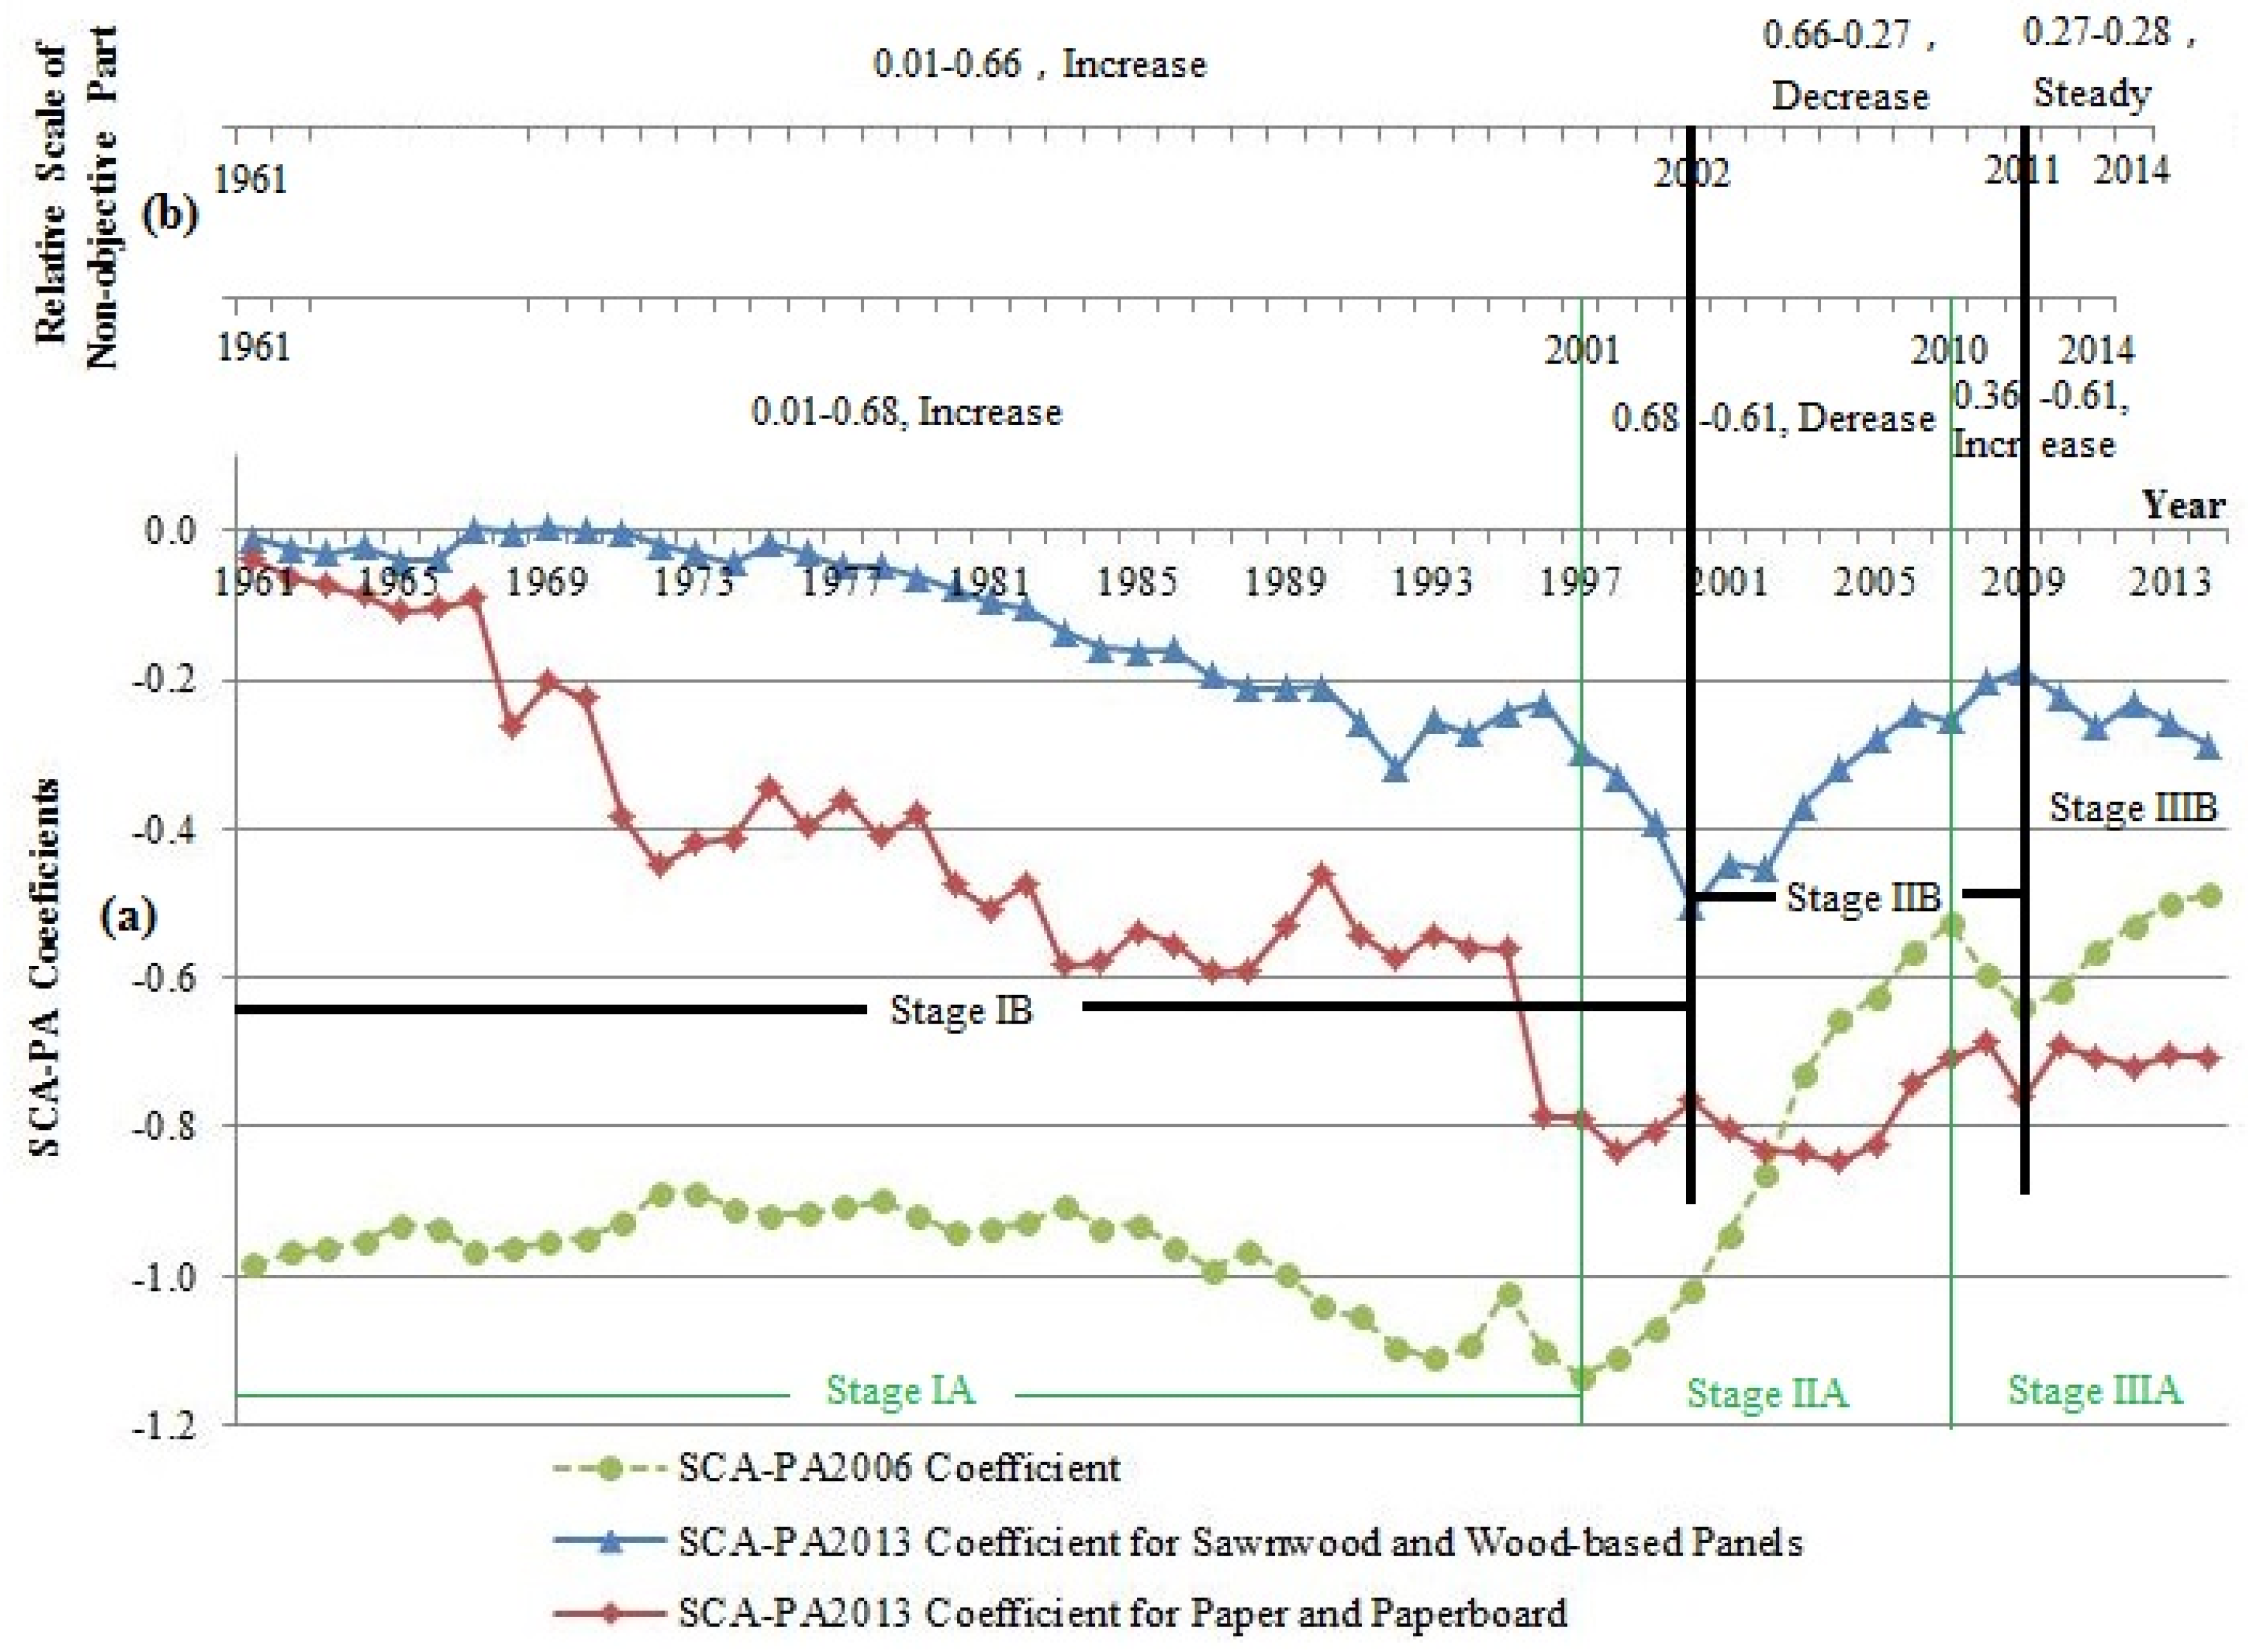
4.2. Long-Term Dynamics of the Non-Objectiveness

Using PA, the absolute scale of non-objective parts of the annual carbon stock continuously increased in the past 55 years. However, the scale in the absolute value was greatly affected by the level of stock of the HWP carbon pool. In this section, the scale in the relative value, which is the proportion of the non-objective part to the annual carbon stock calculated with SCA, is analyzed to provide an outlook of the long-term dynamics of non-objectiveness, and future potentials of PA.
As shown in Figure 3, the scale in relative value was positive (Figure 3b) and reached its peak at the beginning of the 21st century. The SCA–PA2006 and SCA–PA2013 coefficients were almost always negative in the past 54 years (Figure 3a). In addition, these coefficients determined negatively the changes in their corresponding relative scale. Figure 3 indicates that the absolute scale of the non-objective part of the annual carbon stock was maintained, although the relative scale varied throughout the years.
The entire 55-year dynamics of the non-objectiveness of PAs can be divided into three stages according to the trend of the coefficients in Figure 3a. Nevertheless, owing to the disturbance of the FOD method, a delay of several years existed when the corresponding stages cited in Figure 3b occurred (i.e., two years for PA2013, and while three to four years for PA2006). In the first stage, the coefficients generally decreased, resulting in almost a four-decade growth of the relative scales from approximately 0 to over 0.6. This case implies that most of the annual carbon increments of the complete national carbon pool of China’s HWPs cannot be objectively reflected by the PAs. In the second stage, the SCA–PA2006 coefficient sharply grew from 1997 to 2007 (Figure 3a), and the relative scale dropped to 0.36 in 2010 (Figure 3b). The SCA–PA2013 coefficient experienced similar changes, but the corresponding relative scale dropped to 0.27, which was a low point in 2011. In the third stage, the coefficients featured a different trend. The SCA–PA2013 coefficient showed a nearly horizontal trend that led to a constant relative scale of nearly 0.3 from 2011 to 2014. Contrarily, the SCA–PA2013 coefficient showed an inverted U-shape with a turning point in 2008. However, Figure 3b can only reflect the period 2006–2010 of the curve in Figure 3a because of the delay. Thus, the potential non-objective part of the annual carbon stock using PA2006 decreased from 0.61 in 2014, but it is expected to maintain a relatively steady trend at approximately 0.3 in the future using PA2013.

5. Discussion

The carbon stock of China’s HWPs calculated by the current studies are 676 Tg C in 2011 [12] and 888 Tg C [39] in 2012 using SCA and 519.9 Tg C in 2011 using PA2006 [12]. The annual carbon stock is 50.78 Tg C in 2012 using SCA [39]. In this study, the corresponding carbon stock is 468.82 Tg C in 2011 and 514.70 Tg C in 2012 using SCA and 311.07 Tg C in 2011 using PA2006. The annual carbon stock is 45.89 Tg C in 2012 using SCA. The results of this study are lower than those of the existing research because the latest conversion factors to dry weight, carbon content and half-lives and HWP categories in 2013 Supplementary, are applied in this study. The curves of the carbon stock and the annual carbon increment share the same shape and trend with those in existing studies [12,39].
Figure 2 and Figure 3 indicate that the objectiveness of PAs in reflecting the complete national carbon pool of China’s HWPs is weakened because the country’s HWPs trade took off since the beginning of the 21st century with the development of the HWP industry. Moreover, the Natural Forest Protection Project was implemented at the end of 1990s that sharply increased of the net importation of HWPs and feedstock, especially sawnwood and industrial roundwood [49]. The curves in Figure 3 fluctuated around 2009 probably because of the disturbance of the global economic crisis.
Despite its relevant findings, this study has certain limitations and needs further improvement. First, the delay in the response of the relative scale of non-objectiveness to the changes varies between PA2006 and PA2013, whose mechanisms are yet to be uncovered. Second, the uncertainty of the results is excluded in this investigation because of space limitation, and it is irrelevant to the ideas investigated. Further studies should implement uncertainty analysis. Last, the data from the FAOSTAT database are not as accurate as those from the China Forestry Statistical Yearbook although the former’s HWP classification matches with that of the UNFCCC. Future studies should apply data from the China Forestry Yearbook as long as its HWP classification has been improved.

6. Conclusions

This study investigated the inherent factors that led to the non-objectiveness of PA in reflecting the complete national carbon pool of HWPs. The study particularly aimed to rethink PA based on an empirical study in China and can therefore support future investigations on the social effects of various accounting approaches.
The major findings of this study are threefold. First, the inherent difference between PA and SCA that leads to the different result of carbon accounting is not decided by whether a country is a net importer of HWPs but by the balance between the relationship of the trade and the production of HWPs and feedstock. Second, the dynamics of the coefficients can inversely affect the objectiveness of PA. Third, the objectiveness of PA will constantly weaken in absolute value but may be improved in relative value. PA can only reflect 39% to 72% of its objectiveness at the level of complete national carbon pool of China’s HWPs in 2014.

Acknowledgments

This study was supported by the Key Program of the National Social Science Foundation of China (Grant No. 14AJY014), the China Ministry of Education (MOE) Project of Humanities and Social Sciences (Project No. 13YJAZH114), the China Post-doctoral Science Foundation (Grant No. 2012M521058), and the Jiangsu Province Qinglan Project of China (Grant No. 2012JSQLP).

Author Contributions

The paper represents the efforts of both authors. Hongqiang Yang drafted this manuscript, established the research paper design and paper methodology, and prepared Figure 1 and Table 1. Xiaobiao Zhang collected and processed the data, and prepared Figure 2 and Figure 3. Both authors have read and approved the final manuscript.

Conflicts of Interest

The authors declare no conflict of interest.

Abbreviations

The following abbreviations are used in this manuscript:
IPCC
Intergovernmental Panel on Climate Change
HWP
Harvested Wood Proaduct
PA
Production Approach
SCA
Stock-change Approach
AFA
Atmospheric Flow Approach
GHG
Greenhouse Gas
COP17
17th Conference of Parties
COP3
Third Conference of Parties
UNFCCC
United Nations Framework Convention on Climate Change
DA
Default Approach
Tg C
Teregrams Carbon

References

  1. Dolan, J.; Black, K.; Hendrick, E.; O’Driscoll, E.; Byrne, K.A. Future change in carbon in harvested wood products from Irish forests established prior to 1990. Carbon Manag. 2013, 4, 377–386. [Google Scholar] [CrossRef]
  2. Kayo, C.; Tsunetsugu, Y.; Noda, H.; Tonosaki, M. Carbon balance assessments of harvested wood products in Japan taking account of inter-regional flows. Environ. Sci. Policy 2014, 37, 251–226. [Google Scholar] [CrossRef]
  3. Intergovernmental Panel on Climate Change. 2013 Revised Supplementary Methods and Good Practice Guidance Arising from the Kyoto Protocol; Intergovernmental Panel on Climate Change: Geneva, Switzerland, 2014; Available online: http://www.ipcc-nggip.iges.or.jp/public/kpsg/index.html (accessed on 4 January 2016).
  4. Intergovernmental Panel on Climate Change. Volume 4 Agriculture, Forestry, and Other Land Use, Chapter 12 Harvest Wood Products. In 2006 IPCC Guidelines for National Greenhouse Gas Inventories; Cambridge University Press: Cambridge, UK, 2006. [Google Scholar]
  5. Dias, A.C.; Arroja, L.; Capela, I. Carbon Storage in harvested wood products: Implications of different methodological procedure and input data—A case study for Portugal. Eur. J. For. Res. 2012, 131, 109–117. [Google Scholar] [CrossRef]
  6. Intergovernmental Panel on Climate Change. Good Practice Guidance and Uncertainty Management in National Greenhouse Gas Inventories; Institute for Global Environmental Strategies: Kanagawa, Japan, 2003; Available online: http://www.ipcc-nggip.iges.or.jp/public/gpglulucf/gpglulucf_contents.html (accessed on 4 January 2016).
  7. United Nations Framework Convention on Climate Change. Estimation, Reporting and Accounting of Harvested Wood Products; The secretariat of the United Nations Framework Convention on Climate Change: Bonn, Germany, 2003; Available online: http://unfccc.int/resource/docs/tp/tp0307.pdf (accessed on 4 January 2016).
  8. Tonosaki, M. Harvested wood products accounting in the post Kyoto commitment period. J. Wood Sci. 2009, 55, 390–394. [Google Scholar] [CrossRef]
  9. United Nations. Kyoto Protocol to the United Nations Framework Convention on Climate Change; United Nations: Kyoto, Japan, 1998; Available online: http://unfccc.int/resource/docs/convkp/kpeng.pdf (accessed on 4 January 2016).
  10. Sukhdev, P.; Prabhu, R.; Kumar, P.; Bassi, A.; Patwa-Shah, W.; Enters, T.; Labbate, G.; Greenwalt, J. REDD+ and a Green Economy: Opportunities for a mutually supportive relationship. Available online: http://www.unredd.net/index.php?option=com_docman&Itemid=134&view=download&alias=6345-unep-policy-brief-en-6345&category_slug=policy-brief-series-3154 (accessed on 4 January 2016).
  11. Lun, F.; Li, W.; Liu, Y. Complete forest carbon cycle and budget in China, 1999–2008. For. Ecol. Manag. 2012, 264, 81–89. [Google Scholar] [CrossRef]
  12. Ji, C.; Yang, H.; Nie, Y.; Hong, Y. Carbon sequestration and carbon flow in harvested wood products for China. Int. For. Rev. 2013, 15, 160–168. [Google Scholar] [CrossRef]
  13. Dewar, R.C. Analytical model of carbon storage in the trees, soils, and wood products of managed forests. Tree Physiol. 1991, 8, 239–258. [Google Scholar] [CrossRef] [PubMed]
  14. Dewar, R.C.; Cannell, M.G.R. Carbon sequestration in the trees, products and soils of forest plantations—An analysis using UK examples. Tree Physiol. 1992, 11, 49–71. [Google Scholar] [CrossRef] [PubMed]
  15. Plantinga, A.J.; Birdsey, R.A. Carbon fluxes resulting from US private timberland management. Clim. Change 1993, 23, 37–53. [Google Scholar] [CrossRef]
  16. Karjalainen, T. Model computations on sequestration of carbon in managed forests and wood products under changing climatic conditions in Finland. J. Environ. Manag. 1996, 47, 311–328. [Google Scholar] [CrossRef]
  17. Intergovernmental Panel on Climate Change. Revised 1996 IPCC Guidelines for National Greenhouse Gas inventories; Intergovernmental Panel on Climate Change: Bracknell, UK, 1996; Available online: http://www.ipcc-nggip.iges.or.jp/public/gl/invs1.html (accessed on 4 January 2016).
  18. Winjum, J.K.; Brown, S.; Schlamdinger, B. Forest harvests and wood products: Sources and sinks of atmospheric carbon dioxide. For. Sci. 1998, 44, 272–284. [Google Scholar]
  19. Lim, B.; Brown, S.; Schlamadinger, B. Evaluating approaches for estimating net emission of carbon dioxide from harvesting and wood products. Environ. Sci. Policy 1999, 2, 207–216. [Google Scholar] [CrossRef]
  20. Nabuurs, G.J.; Sikkema, R. International trade in wood products: Its role in land use change and forestry carbon cycle. Clim. Change 2001, 49, 377–395. [Google Scholar] [CrossRef]
  21. Skog, K.E.; Pingoud, K.; Smith, J.E. A method countries can use to estimate changes in carbon stored in harvested wood products and the uncertainty of such estimates. Environ. Manag. 2004, 33, S65–S73. [Google Scholar] [CrossRef]
  22. Côté, W.A.; Young, R.J.; Risse, K.B.; Costanza, A.F.; Tonelli, J.P.; Lenocker, C. A carbon balance method for paper and wood products. Environ. Pollut. 2002, 116, S1–S6. [Google Scholar] [CrossRef]
  23. Brack, C.L.; Richard, G.P. Carbon accounting model for forests in Australia. Environ. Pollut. 2002, 116, S187–S194. [Google Scholar] [CrossRef]
  24. White, M.K.; Gower, S.T.; Ahl, D.E. Life cycle inventories of roundwood production in northern Wisconsin: Inputs into an industrial forest carbon budget. For. Ecol. Manage. 2005, 219, 13–28. [Google Scholar] [CrossRef]
  25. Pingoud, K.; Wagner, F. Methane emissions from landfills and carbon dynamics of harvested wood products: The first-order decay revisited. Mitig. Adapt. Strateg. Glob. Change 2006, 11, 961–978. [Google Scholar] [CrossRef]
  26. Kohlmaier, G.; Kohlmaier, L.; Fries, E.; Jaeschke, W. Application of the stock change and the production approach to Harvested Wood Products in the EU-15 countries: A comparative analysis. Eur. J. For. Res. 2007, 126, 209–223. [Google Scholar] [CrossRef]
  27. Skog, K.E. Sequestration of carbon in harvested wood products for the United States. For. Prod. J. 2008, 58, 56–72. [Google Scholar]
  28. Dias, A.C.; Louro, M.; Arroja, L.; Capela, I. Comparison of methods for estimating carbon in harvested wood products. Biomass Bioenergy 2009, 33, 213–222. [Google Scholar] [CrossRef]
  29. Green, C.; Avitabile, V.; Farrell, E.P.; Byrne, K.A. Reporting harvested wood products in national greenhouse gas inventories: Implications for Ireland. Biomass Bioenergy 2006, 30, 105–114. [Google Scholar] [CrossRef]
  30. Dias, A.C.; Louro, M.; Arroja, L.; Capela, I. Carbon estimation in harvested wood products using a country-specific method: Portugal as a case study. Environ. Sci. Policy 2007, 10, 250–259. [Google Scholar] [CrossRef]
  31. Nunery, J.S.; Keeton, W.S. Forest carbon storage in the northeastern United States: Net effects of harvesting frequency, post-harvest retention, and wood products. For. Ecol. Manag. 2010, 259, 1363–1375. [Google Scholar] [CrossRef]
  32. Chen, J.; Colombo, S.J.; Ter-Mikaelian, M.T. Carbon budget of Ontario’s managed forests and harvested wood products, 2001–2100. For. Ecol. Manag. 2010, 259, 1385–1398. [Google Scholar] [CrossRef]
  33. Profft, I.; Mund, M.; Weber, G. Forest management and carbon sequestration in wood products. Eur. J. For. Res. 2009, 128, 399–413. [Google Scholar] [CrossRef]
  34. Werner, F.; Taverna, R.; Hofer, P.; Thürig, E.; Kaufmann, E. National and global greenhouse gas dynamics of different forests. Environ. Sci. Policy 2010, 13, 72–85. [Google Scholar] [CrossRef]
  35. United Nations Framework Convention on Climate Change. Report of the Conference of the Parties Serving As the Meeting of the Parties to the Kyoto Protocol on its Seventh Session, Held in Durban from 28 November to 11 December 2011; United Nations Framework Convention on Climate Change: Durban, South Africa, 2012; Available online: http://unfccc.int/resource/docs/2011/cmp7/eng/10a01.pdf (accessed on 4 January 2016).
  36. Lee, J.; Lin, C.; Han, Y. Carbon sequestration in Taiwan harvested wood products. Int. J. Sustain. Dev. World Ecol. 2011, 18, 154–163. [Google Scholar] [CrossRef]
  37. Dolan, J.; Skog, K.; Byrne, K.A. Carbon storage in harvested wood products for Ireland. Biomass Bioenergy 2012, 46, S731–S738. [Google Scholar] [CrossRef]
  38. Canals, G.G.; Valero, E.; Picosi, J. Carbon storage in HWP. Accounting for Spanish particleboard and fiberboard. For. Syst. 2014, 23, 225–235. [Google Scholar]
  39. Yang, H.; Zhang, X.; Hong, Y. Classification, production, and carbon stock of harvested wood products in China from 1961 to 2012. BioResources 2014, 9, 4311–4322. [Google Scholar] [CrossRef]
  40. Dymond, C.C. Forest carbon in North America: Annual storage and emission from British Columbia’s harvest, 1965–2065. Carbon Balance Manag. 2012, 7, 8–27. [Google Scholar] [CrossRef] [PubMed]
  41. Chen, J.; Colombo, S.; Ter-Mikaelian, M.; Heath, L. Carbon profile or the managed forests in Canada in the 20th century: Sink or source. Environ. Sci. Technol. 2014, 48, 9859–9866. [Google Scholar] [CrossRef] [PubMed]
  42. Lamers, P.; Junginger, M.; Dymond, C.C.; Faaij, A. Damaged forests provide an opportunity to mitigate climate change. Glob. Change Biol. Bioenergy 2014, 6, 44–60. [Google Scholar] [CrossRef]
  43. Mathieu, F.; Francois, N.; Nicolas, R.; Frédéric, M. Quantifying the impact of forest management on the carbon balance of the forest-wood product chain: A case study applied to even-aged oak stands in France. For. Ecol. Manag. 2011, 279, 176–188. [Google Scholar]
  44. Ximenes, F.A.; George, B.H.; Cowie, A.; Williams, J.; Kelly, G. Greenhouse gas balance of native forests in New South Wales, Australia. Forests 2012, 3, 653–683. [Google Scholar] [CrossRef]
  45. Stockmann, K.D.; Anderson, N.M.; Skog, K.E.; Healey, S.; Loeffler, D.R.; Jones, G.; Morrison, J.F. Estimates of carbon stored in harvested wood products from the United States forest service northern region, 1906–2010. Carbon Balance Manag. 2012, 7, 1–16. [Google Scholar] [CrossRef] [PubMed]
  46. Timmermann, V.; Dibdiakova, J. Greenhouse gas emissions from forestry in East Norway. Int. J. Life Cycle Assess. 2014, 19, 1593–1606. [Google Scholar] [CrossRef]
  47. Heath, L.S.; Smith, J.E.; Skog, K.E.; Nowak, D.J.; Woodall, C.W. Managed forest carbon estimates for the US greenhouse gas inventory, 1990–2008. J. For. 2012, 109, 167–173. [Google Scholar]
  48. Asante, P.; Armstrong, G.W. Optimal forest harvest age considering carbon sequestration in multiple carbon pools: A comparative statics analysis. J. For. Econ. 2012, 18, 145–156. [Google Scholar] [CrossRef]
  49. Yang, H.; Nie, Y.; Ji, C. Study on China’s timber resource shortage and import structure: Natural Forest Protection Program outlook, 1998 to 2008. For. Prod. J. 2010, 60, 408–414. [Google Scholar] [CrossRef] [Green Version]
Figure 1. Evolution of the carbon accounting methods for HWPs (Harvested Wood Products). The expression that in favor of any approach refers to the approach lead to largest carbon stock of HWPs, the approach that is more appropriate in corresponding studies, or the universal approach within any region.
Sustainability 08 00216 g001
Figure 2. (a) Long-term dynamics of China’s HWP carbon pool calculated by SCA and PA. (b) Changes in the non-objectiveness of the annual carbon stock using the PAs.
Sustainability 08 00216 g002
Figure 3. (a) Long-term changes of the SCA–PA2006 and SCA–PA2013 coefficients. (b) Relative scales of the non-objective part of the annual carbon stock using PA2006 and PA2013. Note: Stages IA, IIA, and IIIA are for PA2006 that represent the years 1961–1997, 1998–2007, and 2008–2014, respectively; Stages IB, IIB, and IIIB are for PA2013, indicating the years 1961–2000, 2001–2009, and 2010–2014, respectively.
Sustainability 08 00216 g003
Table 1. Summary of the economic meanings of the solutions.
Conditions that SCA is FavorableConditions that PA is FavorableBalance
Current StudiesNet importer of HWPsNet exporter of HWPs
This Study2006 Guidelines P E X P I M P < a I R W H + a P E X P I M P > a I R W H + a B1
2013 SupplementaryFor paper and paperboard: P E X P I M P < 1 f I R W ( i ) f P U L P ( i )
For sawnwood and wood-based panels: P E X P I M P < 1 f I R W ( i )
For paper products: P E X P I M P > 1 f I R W ( i ) f P U L P ( i )
For sawnwood and wood-based panels: P E X P I M P > 1 f I R W ( i )
B2
Note: The accumulated and annual increments of the non-objective part are the result calculated with FOD method, which sets B1 and B2 as the Inflow(i).

