1. Introduction
Food security, a necessary foundation for economic and social stability and sustainable development, is the focus of current works of several international organizations and national governments. However, implementation of relevant programs and construction of responsive policies cannot be carried out without an accurate understanding of the food security status of specific nations. Hence, assessment of food security status is an important research topic in this field [
1,
2,
3].
Evaluation of food security is usually conducted based on the concept of food security and the evolution of its meaning. Approximately 200 definitions of food security that evolved over the course of several decades can be extracted from published writings [
4,
5]. The concept of “food security” was first defined in 1974 at the World Food Summit held by the United Nations as existing “availability at all times of adequate world food supplies of basic foodstuffs to sustain a steady expansion of food consumption and to offset fluctuations in production and prices” [
6]. In 1983, Food and Agriculture Organization(FAO) of the United Nations updated its definition to ensure that all people at all times have both physical and economic access to the basic food they need [
7]. The World Food Summit further improved the definition of food security in 1996 and described it as “all people, at all times, have physical and economic access to sufficient, safe and nutritious food to meet their dietary needs and food preferences for an active and healthy life,” and divided food security into five levels: individual, household, national, regional and global [
8]. Although a large number of food security studies have focused on the entitlements of individuals and households [
9,
10], food security at the national level is vitally interrelated to the interests of a country because food security covers such aspects as trade imports and exports and national industry protection policies. At the same time, the food aids provided by state organizations have become increasingly targeted towards specific countries. Thus, the level of security at the national level has always received additional attention from the governments and international organizations [
11].
Differences in research scale and perspective have resulted in variations in the food security assessment index system. Many studies have created index systems from such dimensions as availability, access, utilization, and stability [
12,
13], including grain yield, grain consumption, per capita grain consumption or possession, poverty and malnutrition rate, individual property and income, and other result indicators [
14,
15]. Moreover, a number of scholars have conducted evaluations by investigating the countermeasures and behavioral patterns adopted by specific population groups [
16,
17].
China, a large country with a population of 1.3 billion, pays particular attention to its food security status [
15,
18]. In the recent ten years, many valuable insights have been gained regarding the food security status of China. Global research contributing to these insights can be divided into several sectors. First, scholars in the natural science field have selected indicators for food security evaluation from the perspective of grain production and its influencing factors. These scholars have given particular attention to the impacts of climate change [
19], natural disasters [
20], land resources [
21], and water resources [
22] on the food supply capacity. Second, studies in the agricultural economy field have focused on multidimensional index systems, mainly focusing on indicators such as fluctuation of grain output, grain reserves, grain self-sufficiency rate, quantity of grain per capita, amount of imported food, and proportion of the population classified as poor [
23,
24]. Road intensity [
25], proportion of added value agriculture yields to gross domestic product [
26], trade policy [
27], grain production risks [
28], and the outlook on food security they provide are also included in the research.
At the early stage of social and economic development, food security mainly referred to the problem of ensuring adequate food supply, and grain production was at the core of food security. However, food security is no longer just focused on grain output but also considers the matching of grain output to consumption [
29]. In 2014, total grain output in China increased for the 11th consecutive year, which largely ensured food security for the nation. At the same time, fast-developing urbanization, industrialization, and population growth gave rise to newer problems related to food security. Supply-demand structural problems such as variety, quality, and region of grains became increasingly prominent, which eventually inflated the cost of grain storage and transportation, led to conflicts of interest between the production and sale regions, and even resulted in regional and structural food shortages, thereby producing adverse effects on social stability and economic development. As mentioned previously, selection of the appropriate assessment index must consider the relevant meaning of food security and change across different development stages. Results of evaluation conducted in this manner can be used in policy-making and implementation. Certain elements such as “spatial distribution within countries” must be considered at the country level because food security is a multidimensional issue [
5]. Previous studies usually treated the whole country or the whole grain production system as an object, and only a few studies have considered space matching and variety balance in China. Furthermore, the indexes in the current assessment systems mostly apply to the grain production system and rarely include grain production and consumption coordination.
This study aims to establish a multidimensional assessment index system as well as an index coupling and assessment model in view of the need to evaluate grain production and consumption coordination and matching. Food security in China between 1995 and 2012 was assessed systematically to generate new ideas regarding food security assessment, shed light on the situation of Chinese grain in a highly detailed manner, provide support for efforts to improve the management of food supply and demand in China, and aid in the development of relevant policies that can address new situations.
2. Assessment Index System and Methodology
2.1. Grain Production-Consumption Coordination Assessment System
“Coordination,” a concept widely used in recent years, is derived from Synergetics, which was created in the 1970s by Haken, a German scientist. Later, Malone, an American scholar, came up with a relatively complete coordination theory, which describes a group of collaborative work and activities as well as their relevance and consistency. If food security is compared to a system, then it includes two subsystems: food production and food consumption. We can use coordination theory to advance and extend the assessment of food security.
Food production and consumption coordination signifies that the two are in an equilibrium state, in which the food supply formed by physical motion almost equals the food consumption formed by value movement. This article sets up an assessment index system for food production and consumption coordination in China (
Table 1) based on three dimensions: quantity coordination, structural coordination, and regional coordination.
C
1 refers to the proportion of the difference between grain output and consumption in grain output. C
2 and C
3 are calculated with Valdez coefficient of variation. C
4 can be calculated as follows:
where
and
represent the retail price indexes of food and social commodity in the year
t, respectively.
Meanwhile, C
5 refers to the ratio of net food import to domestic food consumption. C
6 can be calculated as follows:
where
is the first-order inverse difference of the rate of food output and consumption difference in the
t year.
C
7 can be calculated using the following function:
where a
i is the rate of domestic output-consumption difference of major varieties, and b
i is the consumption proportion of corresponding varieties to total grain consumption (
I = 1, 2, 3, representing wheat, rice and corn, respectively).
The basic function of C
8 is given as follows:
where
IDt refers to the annual import of soybean, and
PDt stands for the domestic industrial consumption of soybean.
C
9 can be calculated using the spatial gravity center model for food consumption and production [
30]. C
10 can be obtained by solving the Gini coefficient via integration, using provincial food consumption throughout the nation as matching preimage and production as matching object.
We determined the initial weight using an analytic hierarchy process and then confirmed the final weight by correcting for the information entropy (
Table 1). After data standardization, the overall coordination level and the respective coordination levels of each item were obtained based on the determined weight and basic data.
2.2. Methods for Evaluating Food Security
The evaluation results further clarify the relative level of food security and the variation trends among different years. The warning limit of indexes should be defined to identify the objective state of food security for each year.
2.2.1. Determination of the Single-Index Warning Limit
In this study, the single-index warning limit was determined by two methods. The first one was applied to the six indexes, whose warning limits were discussed in previous studies. The six indexes were rate of output and consumption difference (C
1), price fluctuation index (C
2), production fluctuation index (C
3), consumption fluctuation index (C
4), degree of dependence on foreign trade (C
6), and provincial balance index (C
10). For these indexes, the warning limits were directly determined according to previous research results or through statistical approaches, such as the rule of the mean and the rule of the few. For example, previous studies have generally postulated that the rate of output and consumption difference (C
1) should be above 95% to ensure food security [
27], whereas some studies have optimistically proposed that a rate above 92% is sufficient [
31]. Considering grain production conditions in China, the likelihood of cooperation in international grain trade, as well as the strategic target of “self-sufficiency in grains and absolute security in rations,“ the food output and consumption coordination standard were set at 90%. In addition, some studies have argued that the rate of change of food price should be maintained between ±4% [
31] and ±5% [
23]. However, with gradual development of the grain market in China, the range of −6% to −8% can be viewed as the coordination limit. By adopting the law of the mean, the limit between coordination and relative coordination was determined as −3% and −4%.
A second approach was applied to indexes that had never or only seldom been covered by previous studies or those indexes in which relevant results were slightly unclear. For these indexes, we determined the warning limit according to the rule of majority or mode. These four indexes were tendency coordination index (C
5), structural matching index of major varieties (C
7), index of dependence on typical varieties on foreign trade (C
8), and deviation index of gravity center (C
9) (see
Table 2 for specific warning limits).
2.2.2. Determination of Warning Limit for Comprehensive Coordination
In evaluating comprehensive production-consumption coordination, we can obtain comparable indexes through weight setting and standardization. After a comprehensive evaluation in which each item was evaluated, we adopted the Dempster-Shafer evidence theory (D-S evidence theory) to determine the overall warning limit. First introduced by Dempster [
32], the D-S evidence theory can better handle unknown problems and uncertainties compared with the traditional probability theory. In addition, it can also integrate evidence from multiple sources. Therefore, the D-S evidence theory enjoys a wide range of applications in the fields of data fusion and target recognition.
2.2.2.1. Method and Principle of D-S Evidence Theory
According to the research of Dempster [
32], the domain of discourse covered by D-S evidence theory is called the recognition framework (denoted as Θ), which includes a finite number of elementary propositions (denoted as
). These elementary propositions, corresponding to the elementary events in probability theory, are called units. The events in Θ are mutually exclusive.
Setting U as the recognition framework, the propositional set 2
U is thus constituted by the power set of 2
U. If the function m: 2
U→[0,1] meets
then we call “m” the basic probability assignment (BPA) on the framework U. BPA reflects the supporting degree of evidence to proposition A in the recognition framework, that is, m (A). If
and m (A) > 0, then we call A the focal element. The set of all focal elements is called the core. The value of A’s belief function shows the trust of A itself, which refers to the belief functional value exactly assigned to A. When multiple focal elements exist, we can typically use the universal combination rule in the D-S evidence theory, which is as follows:
where k =
, which reflects the degree of evidence conflicts. Coefficient 1/(1–k) is called the normalizing factor, which is used to avoid assigning non-zero probability to the null set
during combination.
Set
q (Λ), the combination rule is
where k=
.
2.2.2.2. Application of the D-S Evidence Theory
Combining the three regions divided by the warning limit, this paper divided the generation method of BPA function into two steps.
(1) Correspondence of Warning Limit and Focal Elements
The warning degree was divided into three grades: security, slight warning, and serious warning. To express the three warning grades, a BPA function required two focal elements; hence, we set the two elements as a and b. Then, the BPA functions corresponding to security, slight warning and serious warning were set as m (a), m (b) and m (c), respectively. Based on the index data and the index warning limit of different years, we obtained the focal elements of the BPA function corresponding to each specific index in each year. We subsequently attached different weights to each index according to their contributions and then performed the weighted calculation to obtain the BPA function combined by all indexes.
(2) Integration of the BPA Function
The warning system covers 10 different indexes that have different influences on food security. Dempster’s rule of combination was used to fuse the BPA function that was obtained through weighted combination. When the system included n indexes, the BPA function obtained was combined n-1 times.
Table 3 presents the results of using the generated BPA function nine times according to Dempster’s rule of combination.
2.3. Data
The basic data were obtained mainly from the China Statistical Yearbook (1996–2013) [
33] and the National Agricultural Products’ Cost-Benefit Compilation (1996–2013) [
34].
The grain production data were directly obtained from the relevant statistical yearbooks, whereas the grain consumption data were collected from our evaluation of domestic grain consumption based on statistical data. Grain consumption consists of five parts: ration, feed, industrial uses, seed, and grain losses. The total ration consumption was calculated by multiplying the per capita ration by the population, in which the away-from-home consumption was also included. To obtain the total feed consumption, we determined the consumption for “per unit of main products” according to the basic data stated in the National Agricultural Products’ Cost-Benefit Compilation and multiplied it by the output of livestock products. At the same time, food consumption was offset by bran and other residues derived from rationing, and grain for industrial uses was also considered. Consumption of grain for industrial use mainly involved production of alcohol, wine, beer, monosodium glutamate, and so on. The consumption of grain as seed was calculated by multiplying the average demanded seeds per mu (≈0.165 acres) of farmland by the planting area. Total grain loss was calculated by multiplying grain production by the fixed loss coefficient.
3. Results and Analysis
3.1. Analysis on Food Production-Consumption Coordination
3.1.1. Overall Coordination
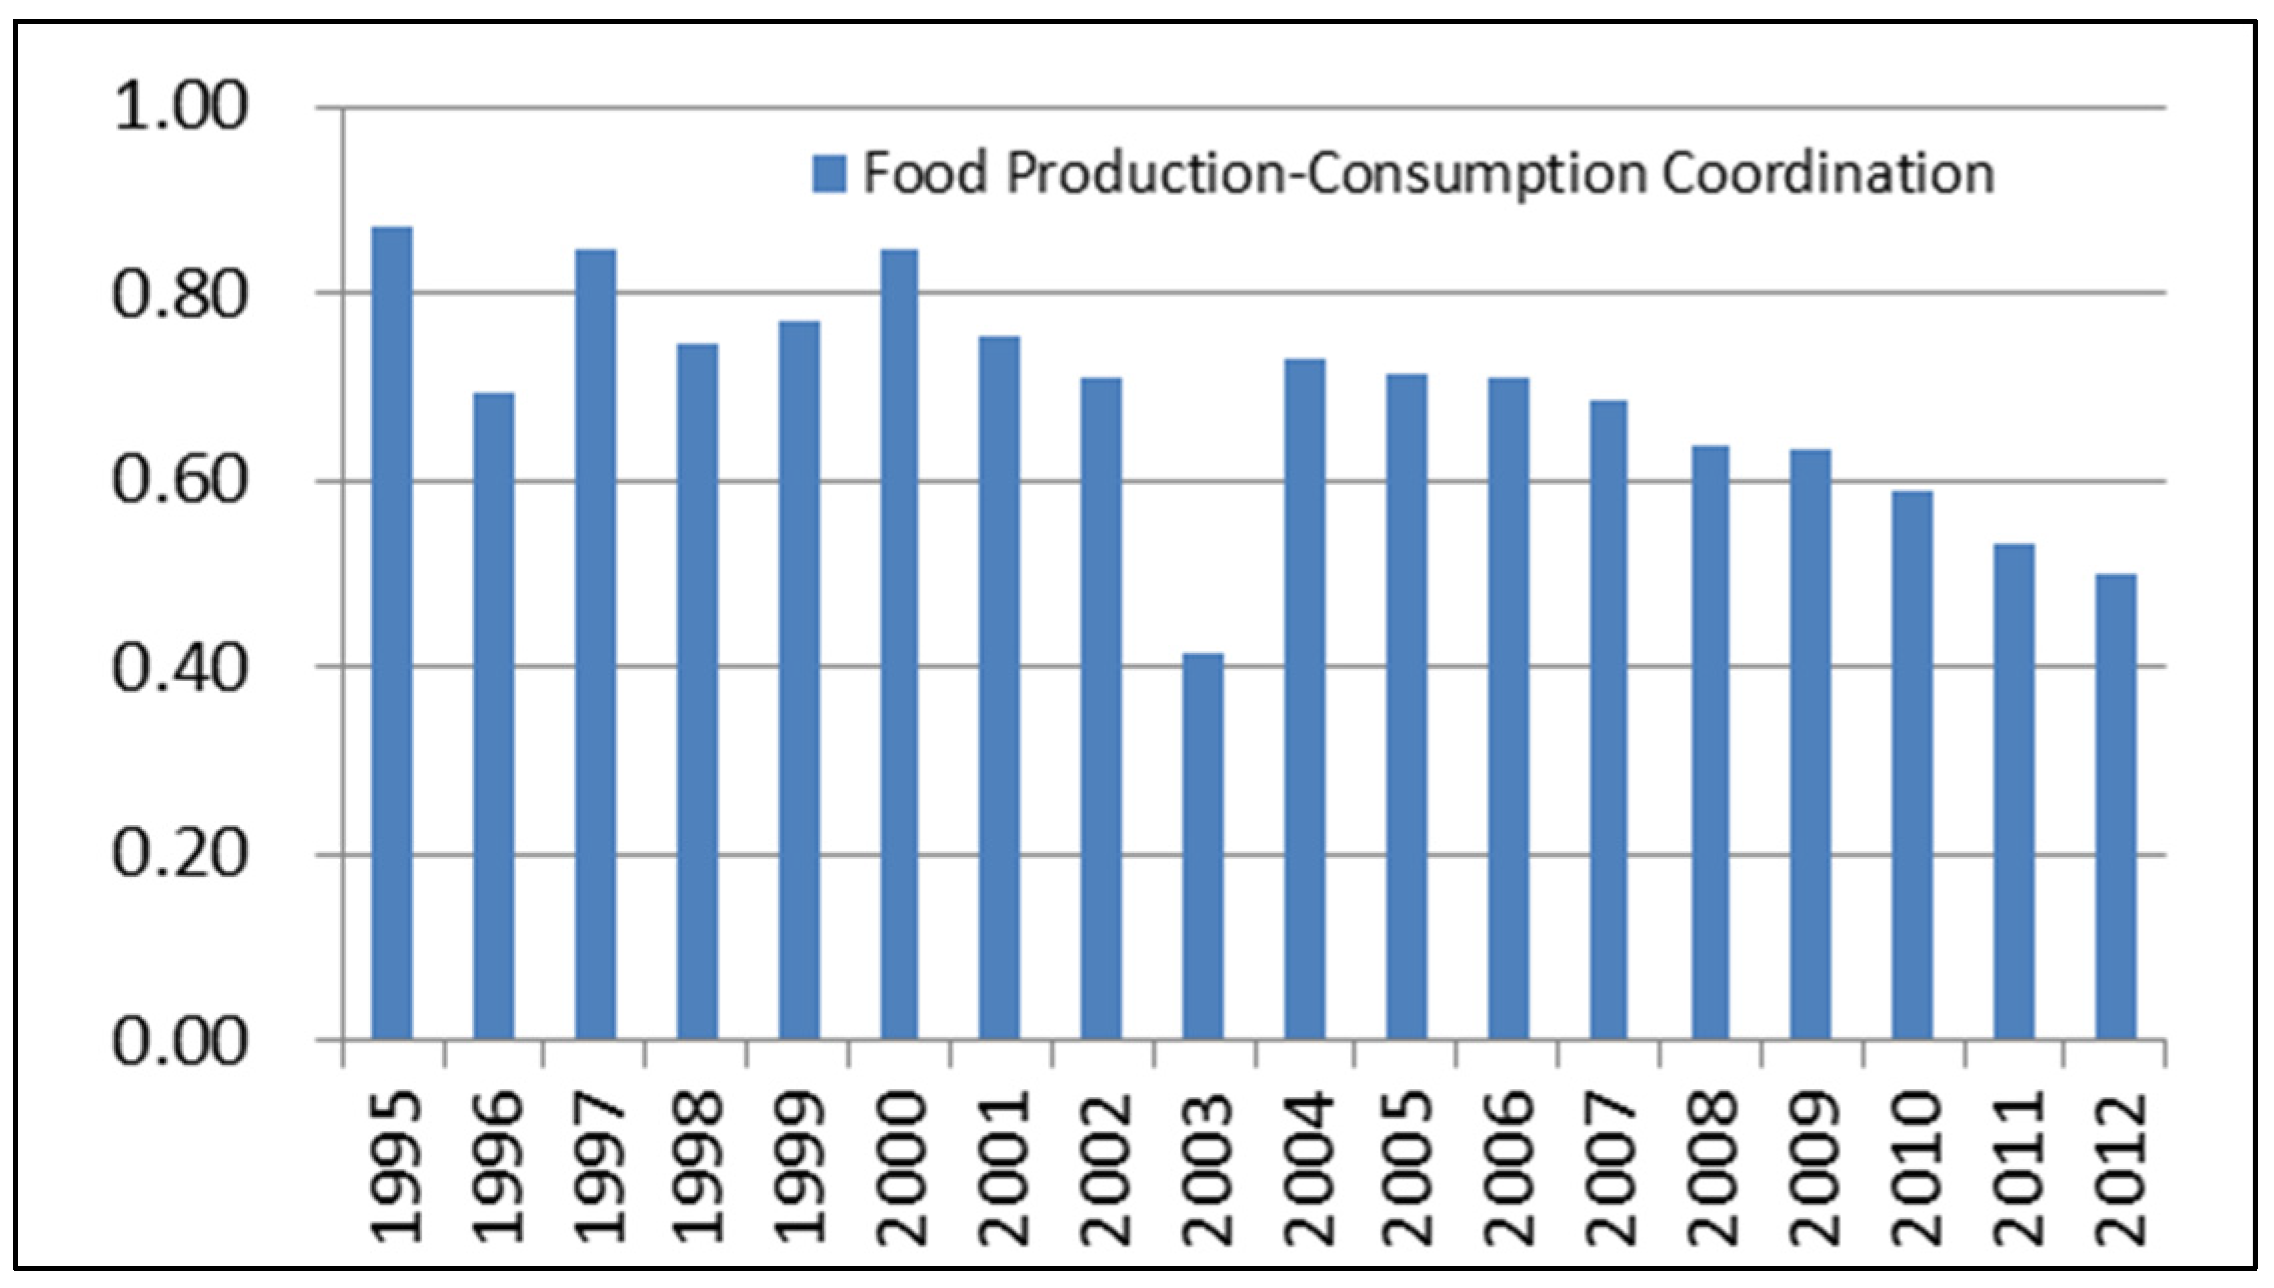
The results showed that the grain production-consumption coordination index in China between 1995 and 2012 can be divided into three periods. The first period was from 1995 to 2001, when the coordination remained at a high level of above 0.6 despite the slight fluctuation. The second period was from 2002 to 2007, when the coordination level was relatively stable except for 2003. The third period was from 2008 to 2012, when the coordination index decreased markedly from 0.5373 to 0.3996(see
Figure 1).
The data we used to obtain the coordination index had been standardized. Hence, our results should be interpreted from the perspective of relative variation. The variations indicate that grain production–consumption coordination in China remained at a high level during the initial stage of the research period except for a few years, but it markedly decreased at the later stage. Both “structural coordination” and “regional coordination” declined significantly at the same time, which is the principal factor that caused grain production–consumption coordination in China to decrease during the research period.
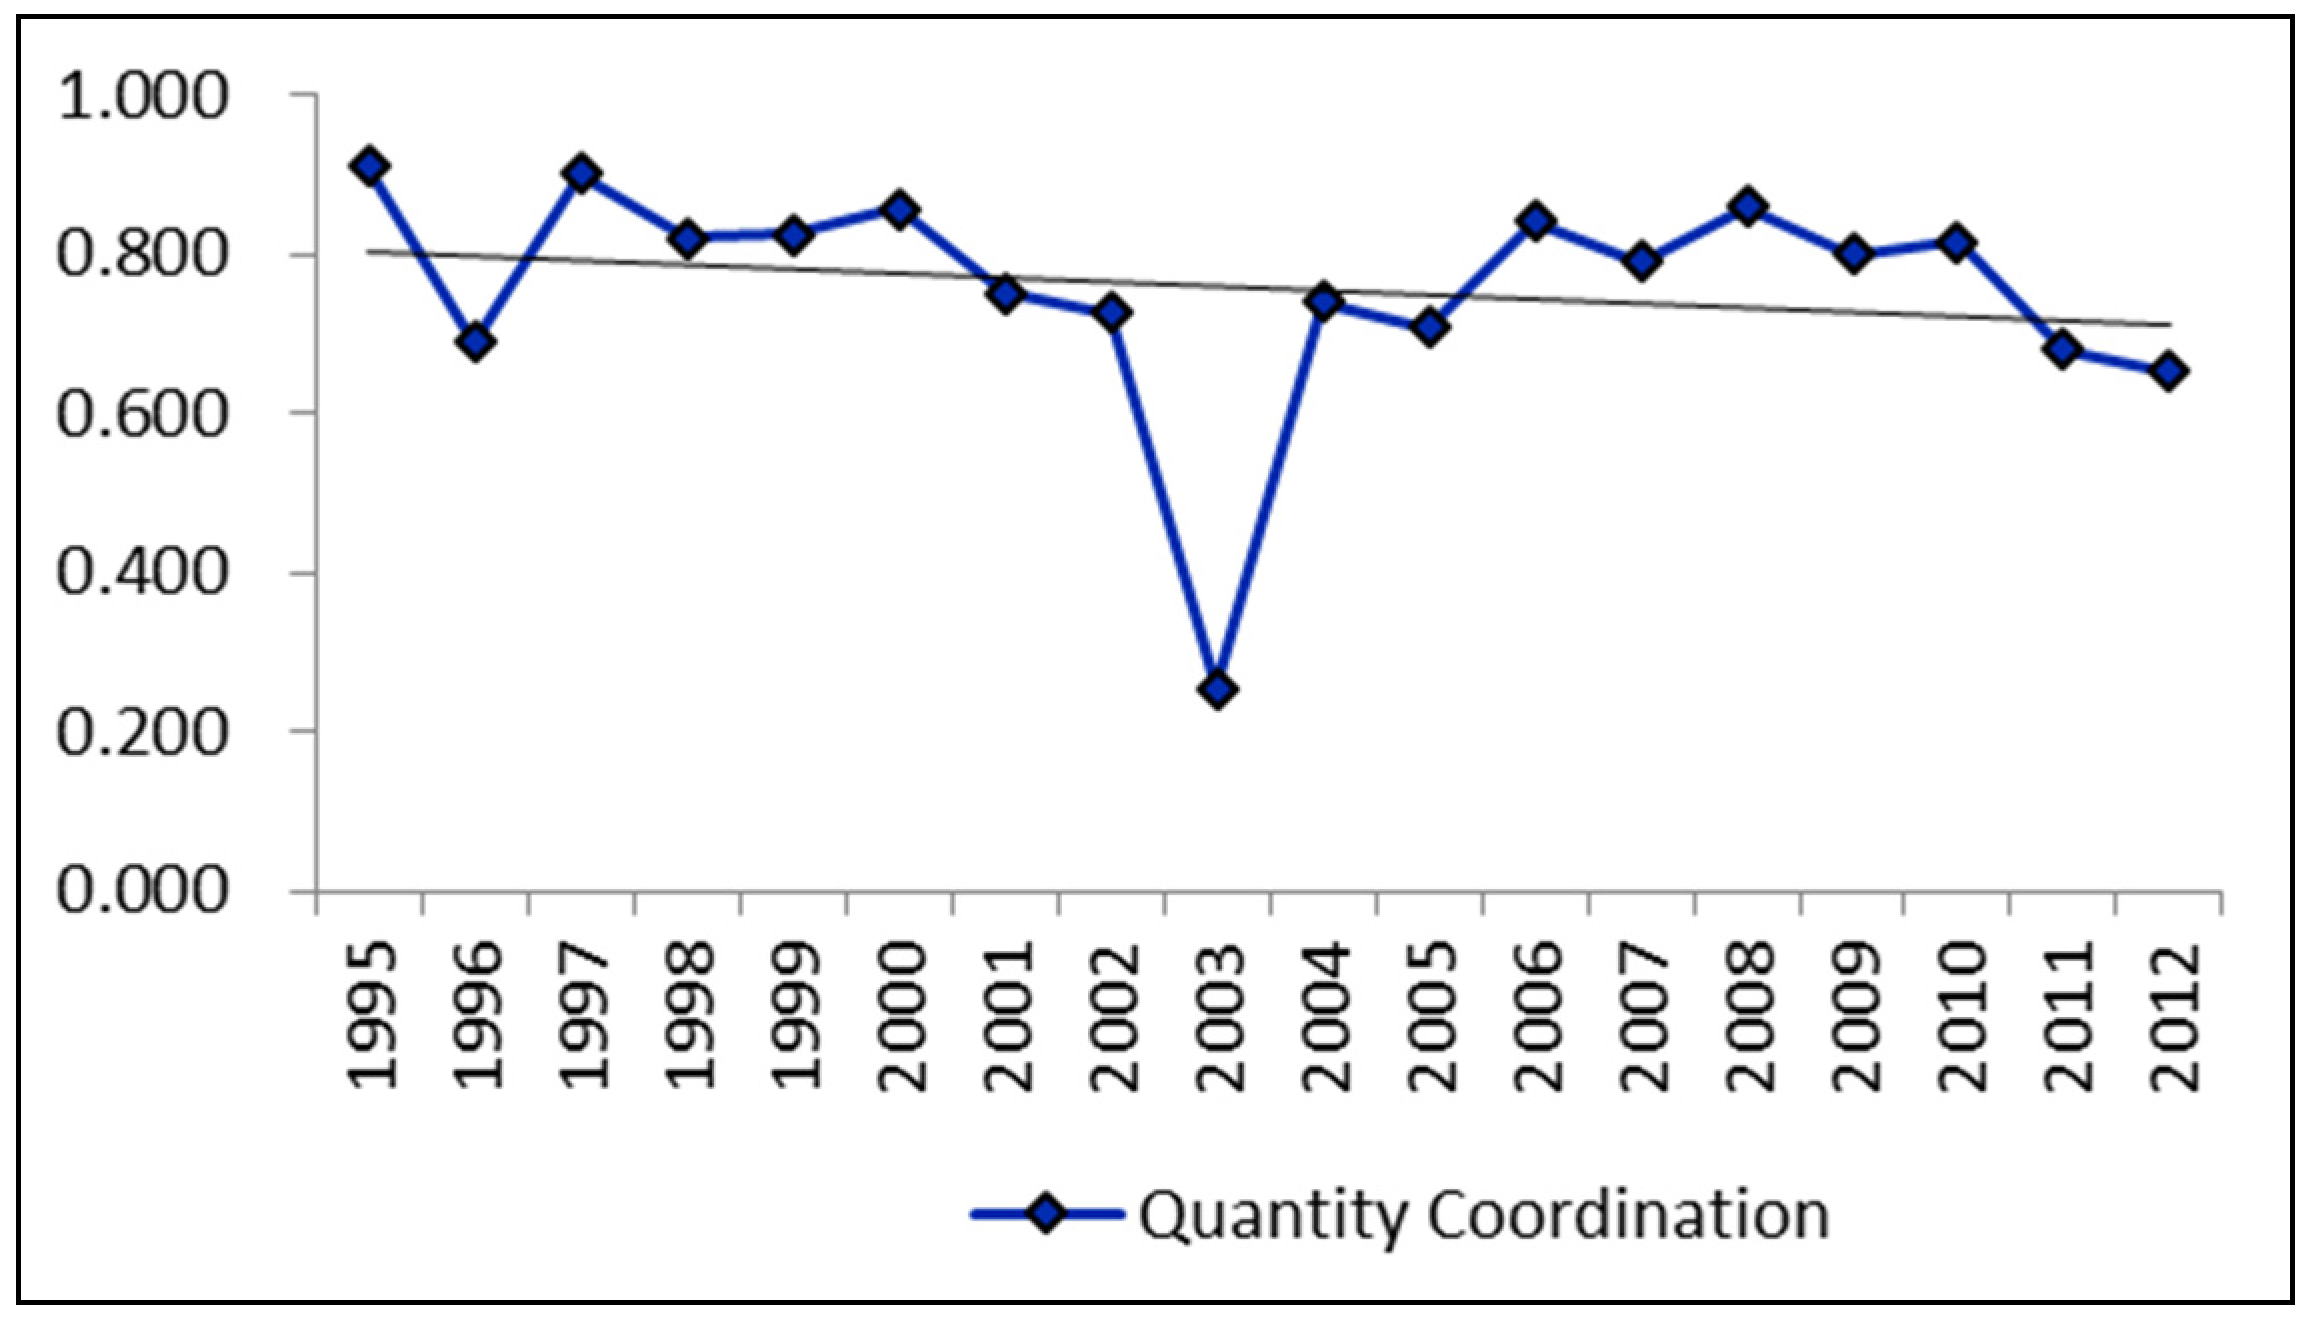
3.1.2. Quantity Coordination
From 1995 to 2012, the grain quantity coordination index in China was above 0.5 except in 2003. The peak (0.809) occurred in 1995, whereas the lowest point (0.155) occurred in 2003. Between 1995 and 2000, the index remained at a high level despite the fluctuations. Between 2001 and 2008, the index increased after an initial decrease, displaying a “V”-shaped variation feature. The index immediately increased again after reaching its lowest point in 2003. Between 2009 and 2012, the index began to decline, especially in the last two years when it decreased significantly. The index dropped to 0.553 in 2012, signifying the second lowest point during the whole research period (see
Figure 2).
Generally, during the research period, the index maintained a relatively high level during two time periods, which were from 1995 to 2000 and from 2006 to 2010. This high level in the first period was mainly the result of structural reforms in the grain market in China and implementation of price protection measures for grain purchases from the early to middle and late 1990s. The two campaigns also stimulated the enthusiasm of farmers for grain growing. In the second period, the government emphasized grain production again, thereby increasing grain production input. The policy effect started to spread. In the interval between the two periods, farmers did not work as hard to grow grains because of high yield at the earlier stage, and the policy of “Conversion of Farmland to Forest” was also introduced, which naturally resulted in decrease in grain quantity coordination index during the later stage. In the last two years, the index decreased significantly because of rapid growth and structure improvement in food consumption.
In terms of specific indexes, grain price fluctuation index and grain production fluctuation index exhibited trends that were most similar to that of quantity coordination. The rate of output-consumption difference exhibited “V”-shaped variation, whereas the consumption coordination index had “M”-shaped change. The index of dependence of typical varieties on foreign trade displayed a general downward trend. The tendency coordination index increased slightly overall and showed the widest fluctuation.
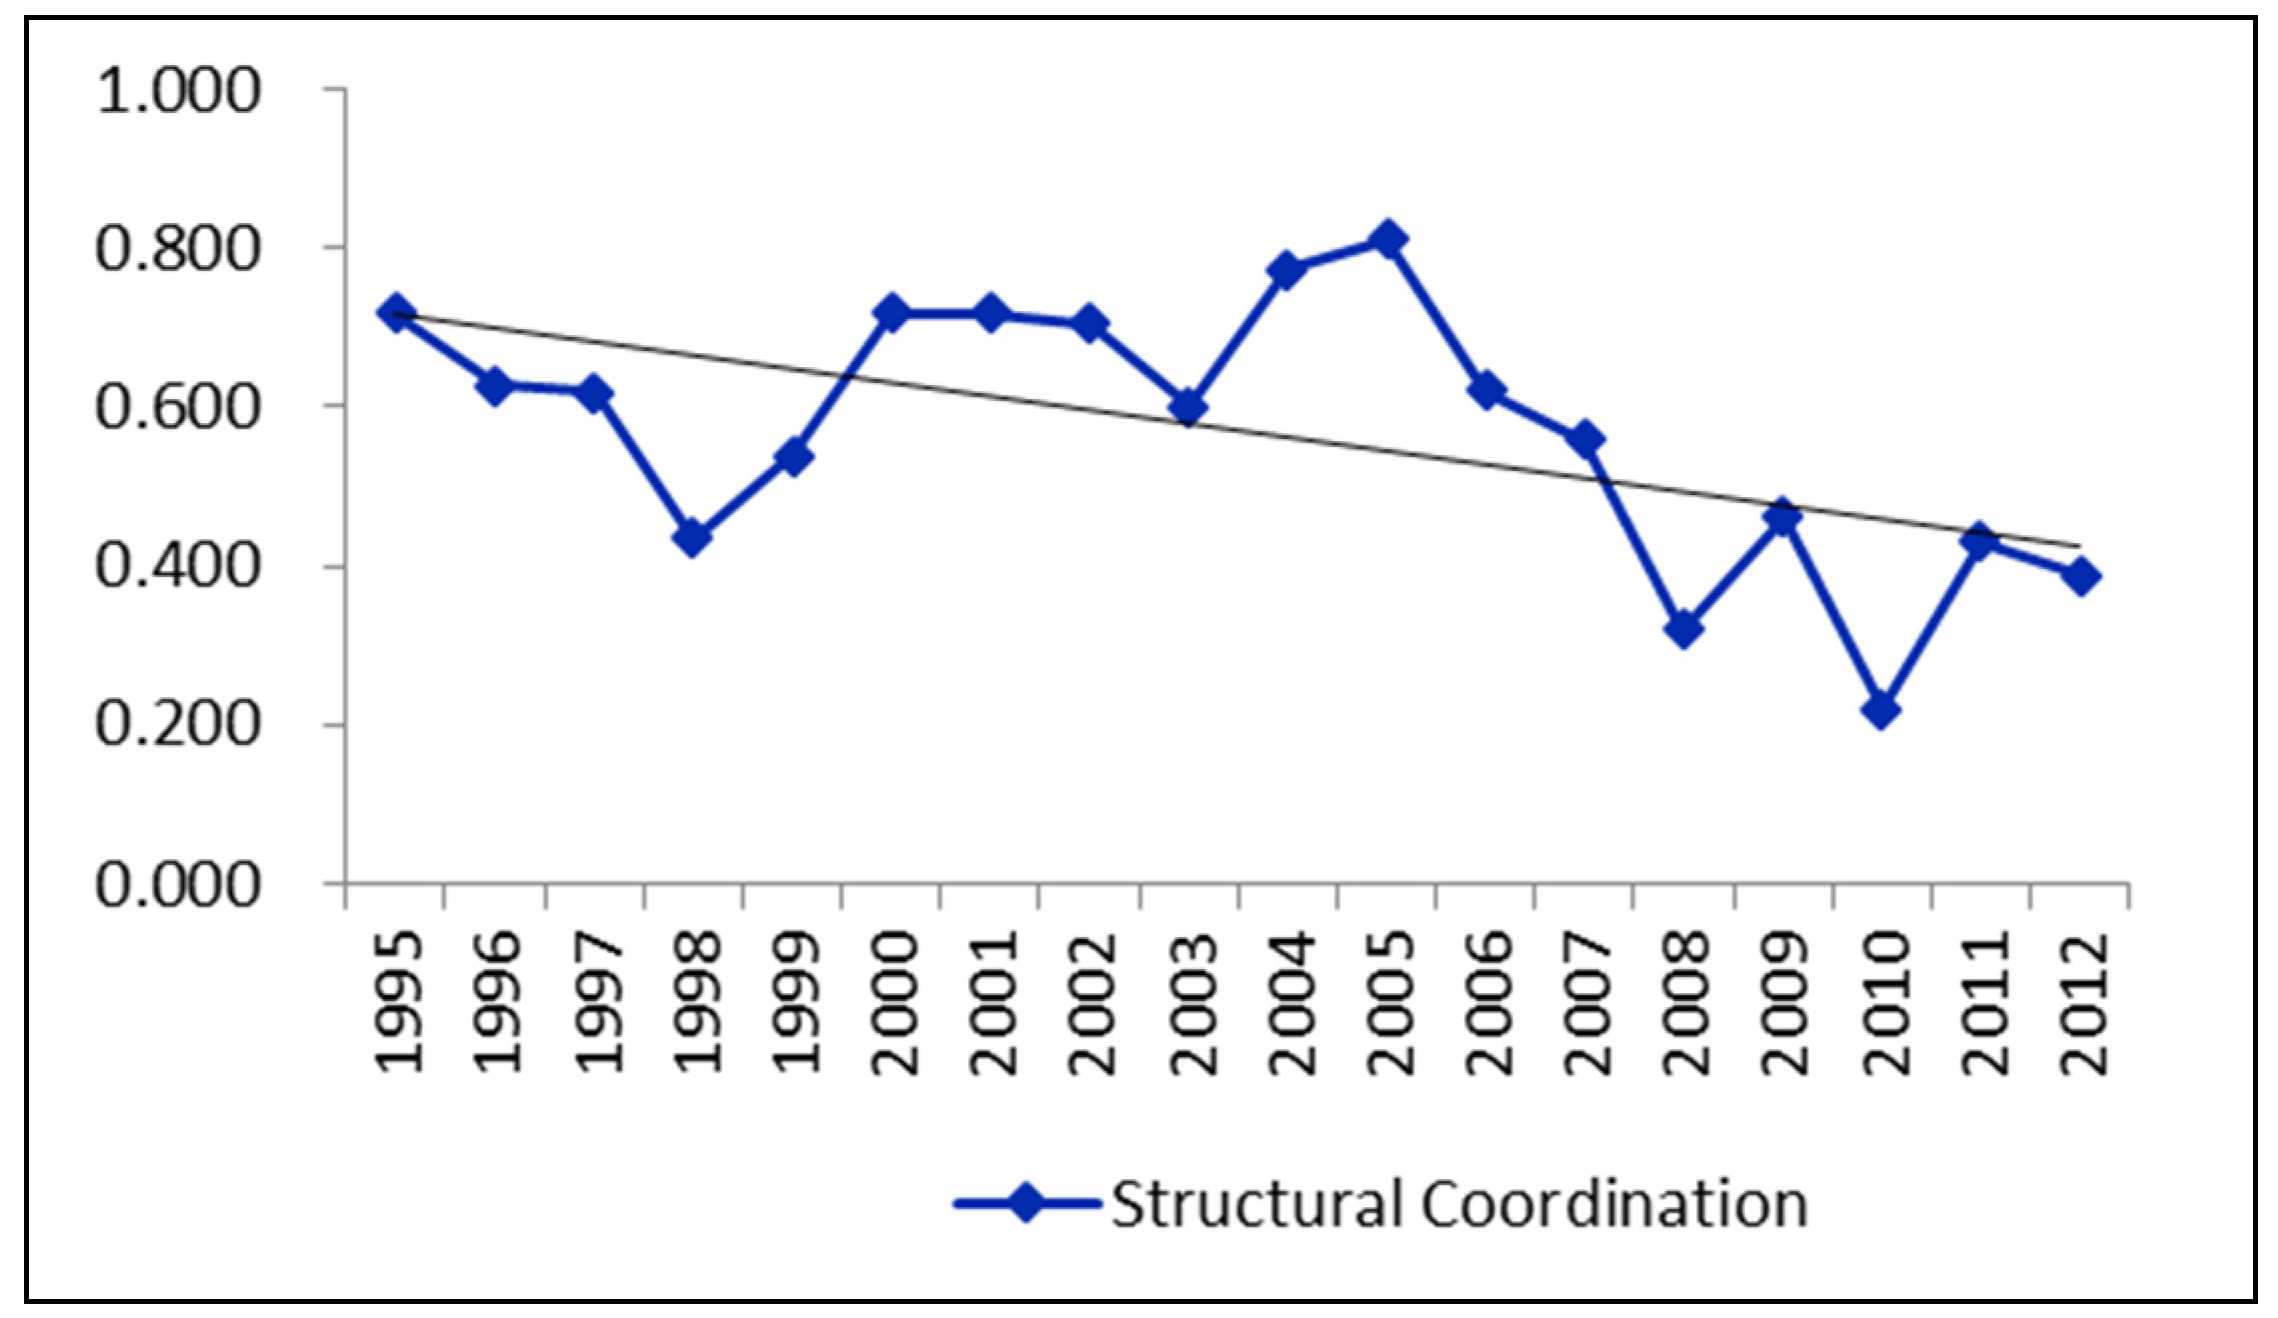
3.1.3. Structural Coordination
From 1995 to 2012, the structural coordination index of grain in China exhibited wide fluctuation and an obvious downward trend, with the highest point at 0.811 in 2005 and the lowest one at 0.220 in 2010. We separated the whole period into three stages. From 1995 to 1998, the structural coordination index presented a downward trend; from 1999 to 2005, the index showed a fluctuating rising tendency; and from 2006 onward, the fluctuation became wider and the index fell significantly (see
Figure 3).
At the initial stage of the study period, grain overproduction in China mainly covered three major varieties (i.e., wheat, rice, and corn), which led to a high rate of output-consumption difference and low coordination level. However, the increase in domestic demand and price difference between those at home and abroad promoted rapid increase in import of several agricultural products, especially soybean. In addition, concerns over natural resources and production costs encouraged the structural adjustment of food supply by importing, thereby increasing dependence on foreign trade. The rapidly increasing import of certain commodities such as soybean and maize pushed structural coordination into a downward trend overall, with the downward trend being more significant in the second half of the research period.
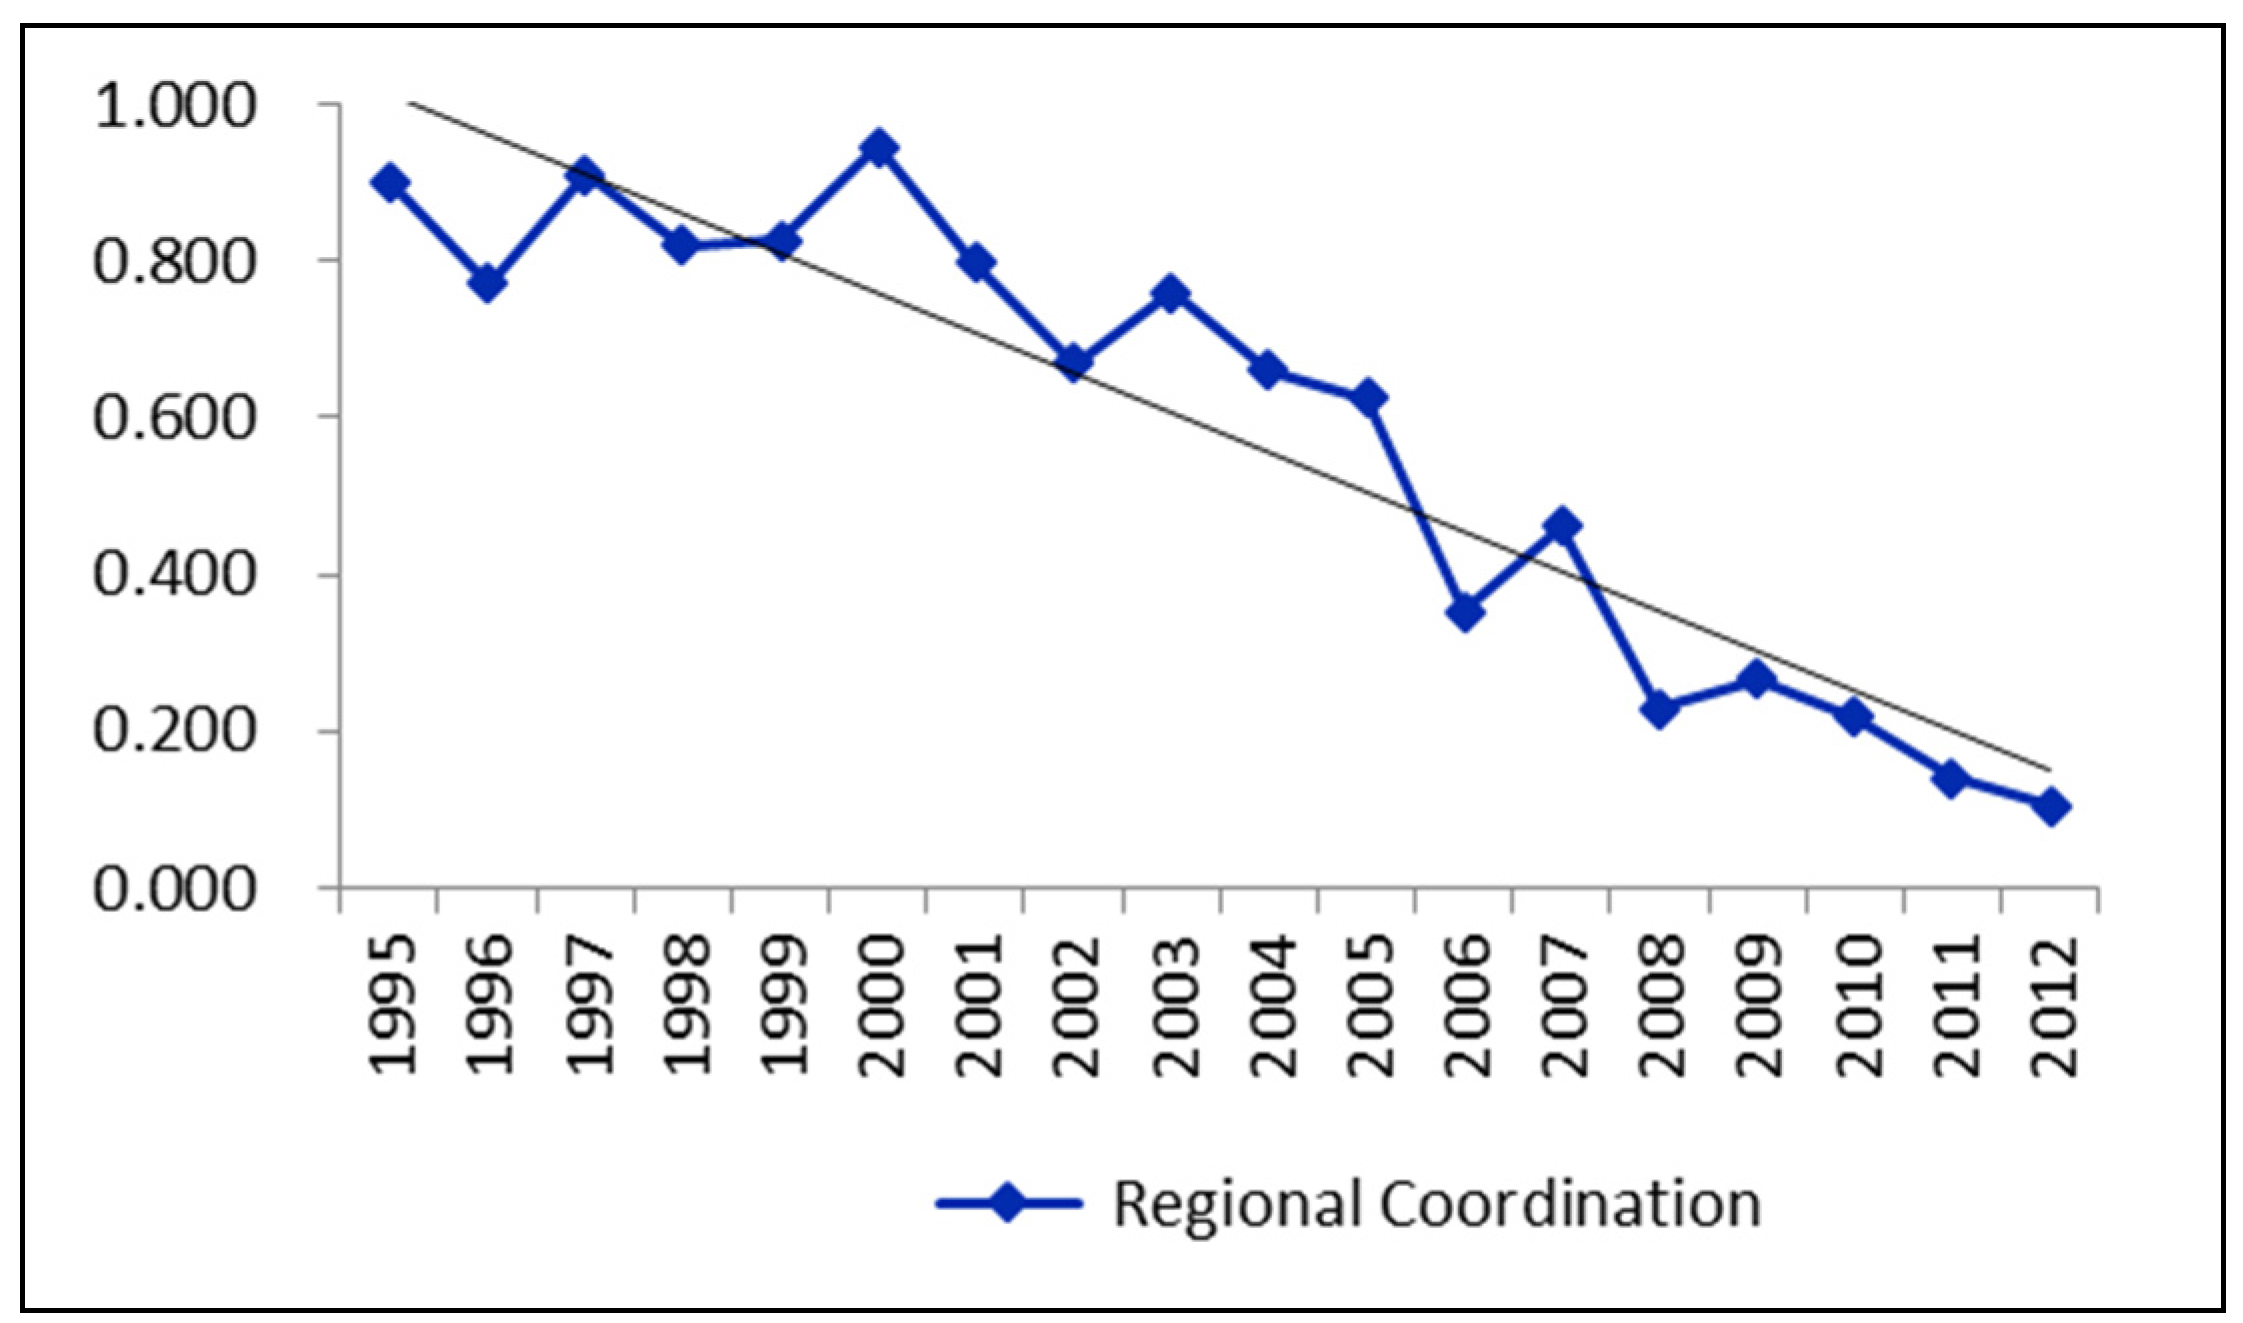
3.1.4. Regional Coordination
The evaluation results indicated that the variation in the regional coordination index of grain production and consumption can be divided into two stages. The first one was from 1995 to 2000 when the index fluctuated widely, but remained at a relatively high level and reached its peak (0.946) in 2000. The second one was from 2001 to 2012 when the index demonstrated an obvious downturn with the gravity center deviation index and provincial matching index showing similar characteristics of variation as the regional coordination index. The regional coordination index decreased all the way down to 0.104 in 2012 (see
Figure 4).
The issue of regional matching of food supply and demand has been raised in China since as early as the 1990s. Since 2000, regional structure regulation has been an important factor influencing the balance between food supply and demand. Under this scheme, grain production was transferred to the central and western regions, while grain consumption was transferred to the eastern and northern regions. After 2000, spatial matching of food supply and demand continued to decrease. In terms of grain varieties, the spatial deviation of the supply and demand for rice and wheat rose continuously. The deviation in corn production and consumption matching increased during the earlier stage but decreased during the later stage of the study period.
3.2. Determination of Warning Limit for Food Production–Consumption Coordination
Using D-S evidence theory, the warning degrees from 1995 to 2012 were determined by analyzing the basic data and combining the corresponding relations between warning limits and focal elements of the BPA function (
Table 3).
Out of 18 years, 14 are secure years, including 1995, 1996, 1997, 1998, 1999, 2000, 2001, and 2002. The slight-warning years were 2005, 2010, and 2012, and the serious-warning year was 2003.
The grain production–consumption coordination system consisted of a grain production subsystem and a grain consumption subsystem, and its coordination level was co-determined by the two subsystems. Changes to major variables, such as population and per capita consumption, were relatively stable and predictable, and food consumption in China was also relatively stable. The grain consumption structure and the requirements for quality were particularly stable before 2000. At the same time, the grain output remained high despite fluctuations in different years, and a surplus of grain occurred in many years. The domestic grain output could easily meet the consumption demand, indicating strong grain production–consumption coordination. From 2000 onward, the grain output decreased for four consecutive years, making it difficult to meet the consumption demands. The “historical trough” of grain output placed the grain production-consumption coordination level in a serious warning state in 2003. Owing to a series of agricultural support policies, the grain output rose rapidly in 2004 and 2005, but the output in 2005 was only equivalent to that in 1995. Therefore, the grain production–consumption coordination level remained in the slight warning state. After 2005, the grain consumption structure of China changed considerably. Although grain output increased continuously, the consumption demands became increasingly difficult to meet. The wide distance between main grain-producing areas and the main grain sales areas gradually disrupted the balance between regional supply and demand, thereby lowering production–consumption coordination. As a result, in 2011 and 2012, the food production–consumption coordination level fell to the slight warning state.
Storage pressure became substantial and grain price entered a slump because of high output from 1995 to 1999. Many problems occurred, including “stale rice in stock” and “difficulty of selling”, as well as decrease in grain planting area (by 4.3%) and occurrence of serious natural disasters in 2003, all of which contributed to an overall decline in farming enthusiasm. Grain output ultimately reached the lowest point of the low-output stage in 2003, and 2003 became the only year China was in a serious warning state. This was the year during which the outbreak of problems in grain supply caused by releasing grain production during the preceding years emerged. The variation trend in grain production–consumption coordination level in the early period could be assumed to be a primary indicator of the variation features of grain production, whereas the decrease in coordination level and occurrence of warning situation in the late period were issues generated by food consumption.
4. Discussion
Although varied views about food crisis in China have been proposed, China has long maintained a high level of self-sufficiency in food security because effective measures have been carried out and the basic need for food is usually satisfied. Our analysis indicated that the country was in a warning state for four out of 18 years and in a serious warning state for only one year. Thus, China has retained a high level of food security overall.
In the past decades, regional differences in natural resource endowment and economic development pattern affected the drive mode of the spatial pattern of food production, transforming the mode from natural comparative advantage domination to overall consideration of comparative advantage. This situation shifted the production center to the mid-west [
35], whereas the population distribution, which mainly dominated food consumption spatial allocation, moved to the north [
36]. These adjustments subsequently caused spatial differentiation between grain production and consumption. Furthermore, the rapid increase in income changed resident food consumption pattern, which was characterized by both decrease in cereal consumption and increase in high-valued food, such as animal-source foods, edible oils, and snacks, which have high prices and exhibit income elasticity [
37,
38,
39]. The agriculture policies implemented in China always gave more attention to supply than market demand, which usually focused on quantity increase rather than change and guidance of consumption. Revolution of the food supply system in China has been lagging behind that of consumption. Therefore, the overall coordination level decreased after the decline of structural coordination and regional coordination in the last several years of the 1995–2012 period. The “triple increase” in grain production, stock, and import in 2015 appeared to be a result of price margins at home and abroad. However, such an increase can reflect unmatched grain supply and demand for several years.
With respect to demand, although the increase in population is expected to slow down in the future, increase in urbanization and income will continue. Hence, the food demand structure is also expected to change in the following years. The per capita consumption of cereals is projected to decline in China. However, the increase in demand for high quality diet, which consists of protein-rich and processed foods, can lead to increase in demand for feed such as corn [
40,
41], leading to a large food demand. At the same time, the loss of cultivated land because of rapid industrialization and urbanization [
42] and the policy of land fallow give limited space for grain production increase that is driven by increasing planting area. The lack of water resource, overuse of fertilizers, and non-point source pollution have become increasingly prominent issues as well [
43,
44]. Hence, the traditional mode of higher output driven by input increase is difficult to sustain. Moreover, potentially imperfect or absence of market factors including land, labor and productivity losses caused by land fragmentation can limit increase in food production [
45,
46].
Generally, the increasing rate of grain production is expected to slow down in the future [
47]. The domestic food policy in China is to ensure “absolute security of grain ration” (
i.e., rice and wheat), whereas security of other commodities may depend highly on market regulation. Thus, the overall self-sufficiency rate and structural matching may fall. The problem of population gathering in developed areas and food production distribution concentrating in underdeveloped areas will continue to exist, and further regional spatial differences will be more difficult to resolve. Therefore, these problems may worsen in the coming years.
In 2015, an agenda for structural reform of agricultural production was put forward by China, which constituted a strategic shift after recognizing the mismatch of grain supply and demand. Considering the results of this study, several suggestions are presented. First, relocation of production should be set to satisfy consumption. Furthermore, an interest coordination mechanism for grain production and sales regions should be established. The interest flow from main sales regions to major production areas should be realized through various measures to match the reversed material flow (grain). Second, a scientific diet plan should be proposed and modern food and nutrition development patterns should be implemented to stimulate food production based on consumption. Moreover, factor markets in rural areas should be continuously improved, mainly with regards to land rent and labor. Business entities should be supported so as to enable them to adapt to new market situations at home and abroad. Lastly, promotion of scientific innovations, protection of arable lands, and implementation of agricultural subsidy policies that have produced favorable results in the past should be continued.
5. Conclusions
Grain production–consumption coordination in China displayed some periodic characteristics: high during the early research period and low during the late period. The quantity coordination level, despite fluctuations, remained high overall, and the fluctuations were strongly influenced by national policies. The structural coordination level fell significantly and fluctuated wildly. The urbanization process and income increase helped improve the consumption structure and quality; however, they also aggravated the decline of structural coordination level in the second half of the research period. Meanwhile, the regional coordination index declined markedly. The gravity center deviation index and the provincial matching index showed consistent variation features, which were caused by differentiation in the spatial transference between resource-driven grain production and population-driven food consumption.
In the last 18 years, the food security status was “security” in 14 years, “slight warning” in three, and “serious warning” in one (in 2003). With the Chinese government paying close attention to this issue, food security was maintained at a relatively high level with a low warning situation overall, but an increased probability of a warning situation is evident in the second half of the research period. The good coordination state at the early stage is a reflection of the variation features of grain production, whereas the low coordination level and the occurrence of a warning situation at the late stage is reflective of the problems caused by changes in food consumption patterns.
Several studies indicate that food security in China in the future is basically ensured, but the regional and variety coordination problems that have emerged recently are likely to be exacerbated. To improve the level of overall coordination, additional efforts should be made to ensure food production and to improve the efficiency of food consumption and circulation. Considering the prospects of new challenges to food security in the future, we should focus on production of core grain varieties, gradually establish interest coordination mechanisms in grain production and sales regions, adopt modern food and nutrition development patterns that stimulate food production based on consumption, and intensify all efforts to save grains in the entire process from production to consumption. At the same time, we should remain committed to the promotion of scientific innovation, protection of arable land, and implementation of effective agricultural subsidy policies.


