Article

How Achieving the Millennium Development Goals Increases Subjective Well-Being in Developing Nations

1
Department of Civil Engineering, Faculty of Engineering, The University of Tokyo, 7-3-1 Hongo, Bunkyo, Tokyo 113-8656, Japan
2
Institute of Industrial Science, The University of Tokyo, 4-6-1 Komaba, Meguro, Tokyo 153-8505, Japan
3
Department of Health Risk Communication, School of Medicine, Fukushima Medical University, 1 Hikarigaoka, Fukushima City, Fukushima 960-1295, Japan
*
Author to whom correspondence should be addressed.
These authors contributed equally to this work.
Sustainability 2016, 8(2), 189; https://doi.org/10.3390/su8020189
Submission received: 31 December 2015 / Revised: 9 February 2016 / Accepted: 17 February 2016 / Published: 22 February 2016
(This article belongs to the Section Environmental Sustainability and Applications)

Abstract

:
The target date in 2015 for the United Nation’s Millennium Development Goals (MDGs) was reached, and a new period of global goals for the post-2015 is dawning. To assess whether and how regional progress towards achieving the MDGs has contributed to better quality of life in developing nations, we formulated a correlation between various aspects of human development, indicated by MDG indicators, and subjective well-being (SWB), a response to the question of how much people feel happy or satisfied. We demonstrated that national levels of SWB can be explained by the degree of development; poverty reduction is the strongest determinant, and achieving the MDGs is associated with higher SWB levels. Scenario assessment of SWB allowed which domain of development should be improved preferentially in each region to be determined, hence the SWB approach is expected to offer an innovative proxy of human development for the assessment of the Sustainable Development Goals (SDGs).

1. Introduction

The United Nation’s framework of eight Millennium Development Goals (MDGs), composed of 21 targets and 60 quantitative indicators of progress over a period of 25 years from 1990 [1], addresses multidimensional poverty problems by integrating a collection of specific targets set at many UN conferences in the 1990s [2], and has given governments an incentive to take concrete actions on human development [3]. As we reached the end of MDG period, it is urgent to evaluate the MDG framework and to consider if new development agenda beyond 2015 are designed to benefit all of humankind.
Here are some key questions we have to ask: by pursuing MDGs for the last 15 years, are all challenged people enjoying better quality of life than before? If so, how much does each MDG target contribute, and how should we set prioritized targets specific to national or regional contexts in the coming years? The first question is based on the concept that a common desire to remedy the circumstances which limit well-being underlies the global attention to human development. Even though the ultimate objective of pursuing MDGs has not been mentioned explicitly in official statements or the Millennium Declaration [2,4], “the end of development must be human well-being” [5] (p. 10).
A way to answer these questions uses the concept of subjective well-being (SWB). Although some aspects of human well-being can be captured by economic or social indicators, such as national income and life expectancy, SWB is considered to be another measure of human well-being in addition to these indicators [6]. SWB refers to people’s affective and cognitive evaluations of their own lives and can be assessed as a response to the question of how much they usually feel happy or satisfied [7]. The SWB approach has attracted attention not only in economics, but also in psychology, sociology, and political science [8], since the estimation of functional relations between SWB levels and its determinants through econometric analyses provides us much information on what makes people happier.
While the number of studies on happiness or SWB is increasing, a linkage between global development efforts like the MDGs and SWB is yet to be investigated. Most happiness studies have been devoted to developed nations [9], where economic growth does not increase happiness [10], since material needs are adequately satisfied, and non-material determinants, such as social capital or good relationships with family members and also with communities, contribute more to happiness [11,12]. This focus might lead to a misunderstanding that happiness is the norm throughout the world [13] and to the neglect of research on how financial and material aids influence the happiness of people in developing nations, where material factors also make a difference. Therefore, whether the improvements in multidimensional aspects of life, which can be represented by indicator values in the MDGs, really has contributed to the enhancement of happiness should be re-examined now, particularly in developing nations.
There has been much debate on the relationship between happiness and income. One of the considerable issues on it is a problem of “happy peasant” and “miserable millionaire”—the poor may report that they are happy because they have low expectations or are less ambitious and not aware of a better lifestyle, meanwhile people in lower-middle-income class tend to give lower scores due to high aspirations or comparison with others [9,14,15]. This phenomenon at the micro-level can be found especially in rapidly growing developing nations, whose MDG indicators and SWB scores we intend to address in this study. Some studies have made it clear, however, that respondents in poorer economies display stronger correlations between income and SWB scores compared to wealthy economies [16].
The objectives of our study were two-fold: firstly, we formulated the relation between the national average level of SWB and the degree of development within the nation derived from MDG indicators, based on an assumption that low- to middle-income nations were still making efforts to reach the MDG targets, and that an arithmetic mean level of SWB within a nation is not subject to the effects of “happiness peasant” paradox at the micro-level. This is based on a cross-sectional study, not a longitudinal one. Secondly, we estimated the past and present levels of SWB by region using a proposed equation in order to assess the effects of achieving MDGs and to consider which domain of development should be given the highest priority by each national government.
We demonstrated that national levels of SWB can be explained by four components of human development: poverty reduction, social welfare, spread of tuberculosis, and environment, of which the strongest determinant of SWB was poverty reduction. We also found, from the estimation of SWB levels by region in 1990 and 2010, that there was still room for development in poverty reduction in sub-Saharan Africa, while Oceania needs every component to be improved.
Since SWB comprehensively reflects what the citizens really demand and emphasize, the SWB approach has the potential to offer a new development index beyond the conventional measures based on a limited number of aspects of human well-being such as GDP per capita, the Human Development Index (HDI) [5], and the Better Life Index proposed by the Organisation for Economic Co-operation and Development (OECD) [17]. The estimation of SWB levels can also give a clue to Future Earth’s research priority B1-7: “Which measures and metrics of human well-being and progress should support the UN post-2015 development agenda? What scientific evidence and analysis is needed to monitor and evaluate sustainable development goals at different scales?” [18] (p. 19).

2. Materials and Methods

2.1. MDG Monitoring Indicators

The official data for all Millennium Development Goals (MDGs) indicators are available at the UN website [19]. The site compiles almost all data for more than 60 indicators reported by national statistical services or international agencies. We calculated the arithmetic mean of each indicator value in the 2000s (Table A1), because abundant data were collected in many nations during this period.
We selected 27 (29 if three sub-indicators of Target 6.9 are counted separately) out of 60 indicators (but no other sub-indicators) to encompass all eight goals and all quantitative targets clearly defined with a deadline for which national average values are available in as many low- to middle-income nations as possible. However, Target 7.D, a quantitative target, could not been covered owing to the lack of data on the proportion of urban population living in slums.

2.2. Measure of Subjective Well-Being

“Happiness” and subjective well-being (SWB) are both multifaceted concepts and are not identical. Happiness can be classified into three levels: positive/negative feelings or emotions, judgments about the balance of feelings over the long term, and quality of life, or Aristotle’s idea of eudaimonia [20]. The concept of SWB relates to the first and the second levels of happiness, and consists of two components: affective reactions and cognitive judgments of a person toward his/her whole life [21]. Affective reactions refer to how pleasant/unpleasant the person’s life usually feels, commonly assessed by such measures as Bradburn’s Affect Balance Scale [22]. Cognitive judgments, on the other hand, refer to the global self-evaluation of a person’s life or satisfaction with life as a whole, sometimes within specific areas of life (work, marriage, family etc.), which has been used in a lot of recent studies on happiness [23].
The validity of SWB measures is supported by many publications (see more comprehensive discussion in [7,24,25], and the choice of which measures to use in a study depends on what is to be analyzed, although there is variability in the adequacy and the strengths and limitations of each measure [26]. For example, measures of cognitive aspects of SWB are perceived as more appropriate than scales of instant positive/negative feelings when analyzing the influence of external factors on happiness, because instant feelings have a lower correlation with life circumstances [27].
There we have two types of SWB measures: Life Satisfaction (LS) surveyed by Gallup World Poll and Satisfaction With Life (SWL) adopted in many national and institutional surveys such as World Value Survey. Gallup surveys levels of LS in over 160 nations and regions by interviewing 1000 individuals aged 15 years or older per nation each year, and thus the data are valid within a 95% confidence interval [28]. Respondents in all nations answered the same question:
Please imagine a ladder/mountain with steps numbered from zero at the bottom to ten at the top. Suppose we say that the top of the ladder/mountain represents the best possible life for you, and the bottom of the ladder/mountain represents the worst possible life for you. On which step of the ladder/mountain do you feel you personally stand at the present time?
[29] (p. 44)
which refers to Cantril’s Self-Anchoring Ladder [30]. On the other hand, the SWL score is a response to the following question:
All things considered, how satisfied are you with your life as a whole these days? Using this card on which 1 means you are “completely dissatisfied” and 10 means you are “completely satisfied,” where would you put your satisfaction with your life as a whole?
(Completely dissatisfied) 1 2 3 4 5 6 7 8 9 10 (Completely satisfied)
Some studies have found that Gallup’s data on LS based on Cantril’s ladder have a stronger relation to income than the SWL data have, possibly owing to the anchored scale in Cantril’s question, which encourages respondents to rate their lives in more relative terms [29,31]. In this study, the LS score was adopted as a measure of SWB on the assumption that it reflects income-related indicators, some of which are employed in MDG framework. We used a dataset of LS available in the World Happiness Report 2013 (see Table A1), whose data are based on Gallup World Poll surveys and are averaged over 2005 to 2007 to reduce uncertainty [32].

2.3. Sample Nations

We selected 56 nations for which all arithmetic means of all 29 indicators in the 2000s and the national average level of LS were available (Table 1). All high-income nations were removed, but some advanced nations with middle incomes, such as Belarus and Moldova, were included. Regional classifications and grouping by national income level are based on UN designations.

2.4. Statistical Analyses

Some MDG indicators have a strong correlation with one another [33], which can lead to multicollinearity in subsequent multiple linear regression analyses of SWB. Therefore, we performed principal component analysis (PCA) with varimax rotation in order to make new independent variables reflecting different dimensions of human development:
Z i m = I i m I m ¯ S D m
X i j = ( Z i 1 Z i 2 Z i 29 ) ( w j 1 w j 29 ) ( i = 1 , 2 , , 56 , j = 1 , 2 , , P , m = 1 , 2 , , 29 )
where values were standardized using the average value ( I m ¯ ) and standard deviation ( S D m ) of the m t h indicator for the 56 nations, and the PC j score of the i t h nation ( X i j ) was obtained as the inner product of standardized scores ( Z i ) and the scoring coefficients matrix ( w j ). Some indicators which could better be approximated by log-normal distribution were log-transformed. PC scores of other nations (Japan, for instance) could be calculated in the same way. The appropriateness of this analysis was confirmed by the Kaiser–Meyer–Olkin Measure of Sampling Adequacy [34].
Most happiness studies assume that SWB can be regarded as cardinal and comparable among individuals in an econometric approach [9], and generally use regression analysis to determine the relative contributions of variables. In this way, an SWB score serves as a dependent variable, and observed external factors or social indices function as explanatory variables. While there seems to be little difference between a simple ordinary least-squares regression and an ordered logit or probit model [35], the ordered logit or probit model is more appropriate if the dependent variable has a discrete distribution (i.e., integer values of 0, 1, 2, …). We assumed that national average scores of SWB are continuously distributed, so we used the ordinary least-squares multiple linear regression analysis:
L S i = m + j = 1 P B j · X i j + k = 1 Q C k · Y i k , o r     L S i = m + A log ( G D P i   p e r   c a p i t a ) + k = 1 Q C k · Y i k
where A, B j , and C k indicate regression coefficients, X i j is the PC j score in the i t h nation, Y i k is the regional dummy variable, and m is the arithmetic mean value of LS for all 56 nations. We used the averaged value of GDP per capita (PPP, International $) in the 2000s available in the World Economic Outlook Database [36], which were log-transformed in order to reflect many empirical studies showing that the logarithm of income variable has a linear relationship with SWB [31]. In this study, we performed regression analyses for four models: (1) MDG-based PCs; (2) MDG-based PCs + regional dummy; (3) logGDP; and (4) logGDP + regional dummy. The distribution of LS score by each PC can be obtained from the following equation:
L S i = j = 1 P ( m · B j j B j + B j · X i j )
PCA and regression analysis were conducted in SPSS v. 22.0 (IBM Corp.).

2.5. Scenario Assessment

By assigning the regional dataset of 29 MDG indicators in 1990 and 2010 [19] into Equations (1)–(3), we estimated the average level of LS across each region. For missing values we substituted values estimated mainly by calculating the population-weighted average of nation-specific data (Table A2).
To assess the Full-MDG levels of LS when all quantitative targets were achieved within each region, we assessed a scenario shown in Table 2. In the scenario, numerically-defined targets (shaded cells) are accomplished as shown, and some targets without any quantitative criteria are achieved at the world average level in 2010, so that most developing regions can make moderate realistic progress. If some regions had already achieved any quantitative target, we assumed that they maintained the same level as in 2010. Values of Indicators 7.1 and 7.6 were kept at the same standards as in 2010 for every region because they involve geographical conditions. The amount of CO2 emissions (Indicator 7.2) and consumption of ozone-depleting substances (Indicator 7.3) are smaller in the developing world, and thus the values are assumed to maintain the level in 2010.

3. Results

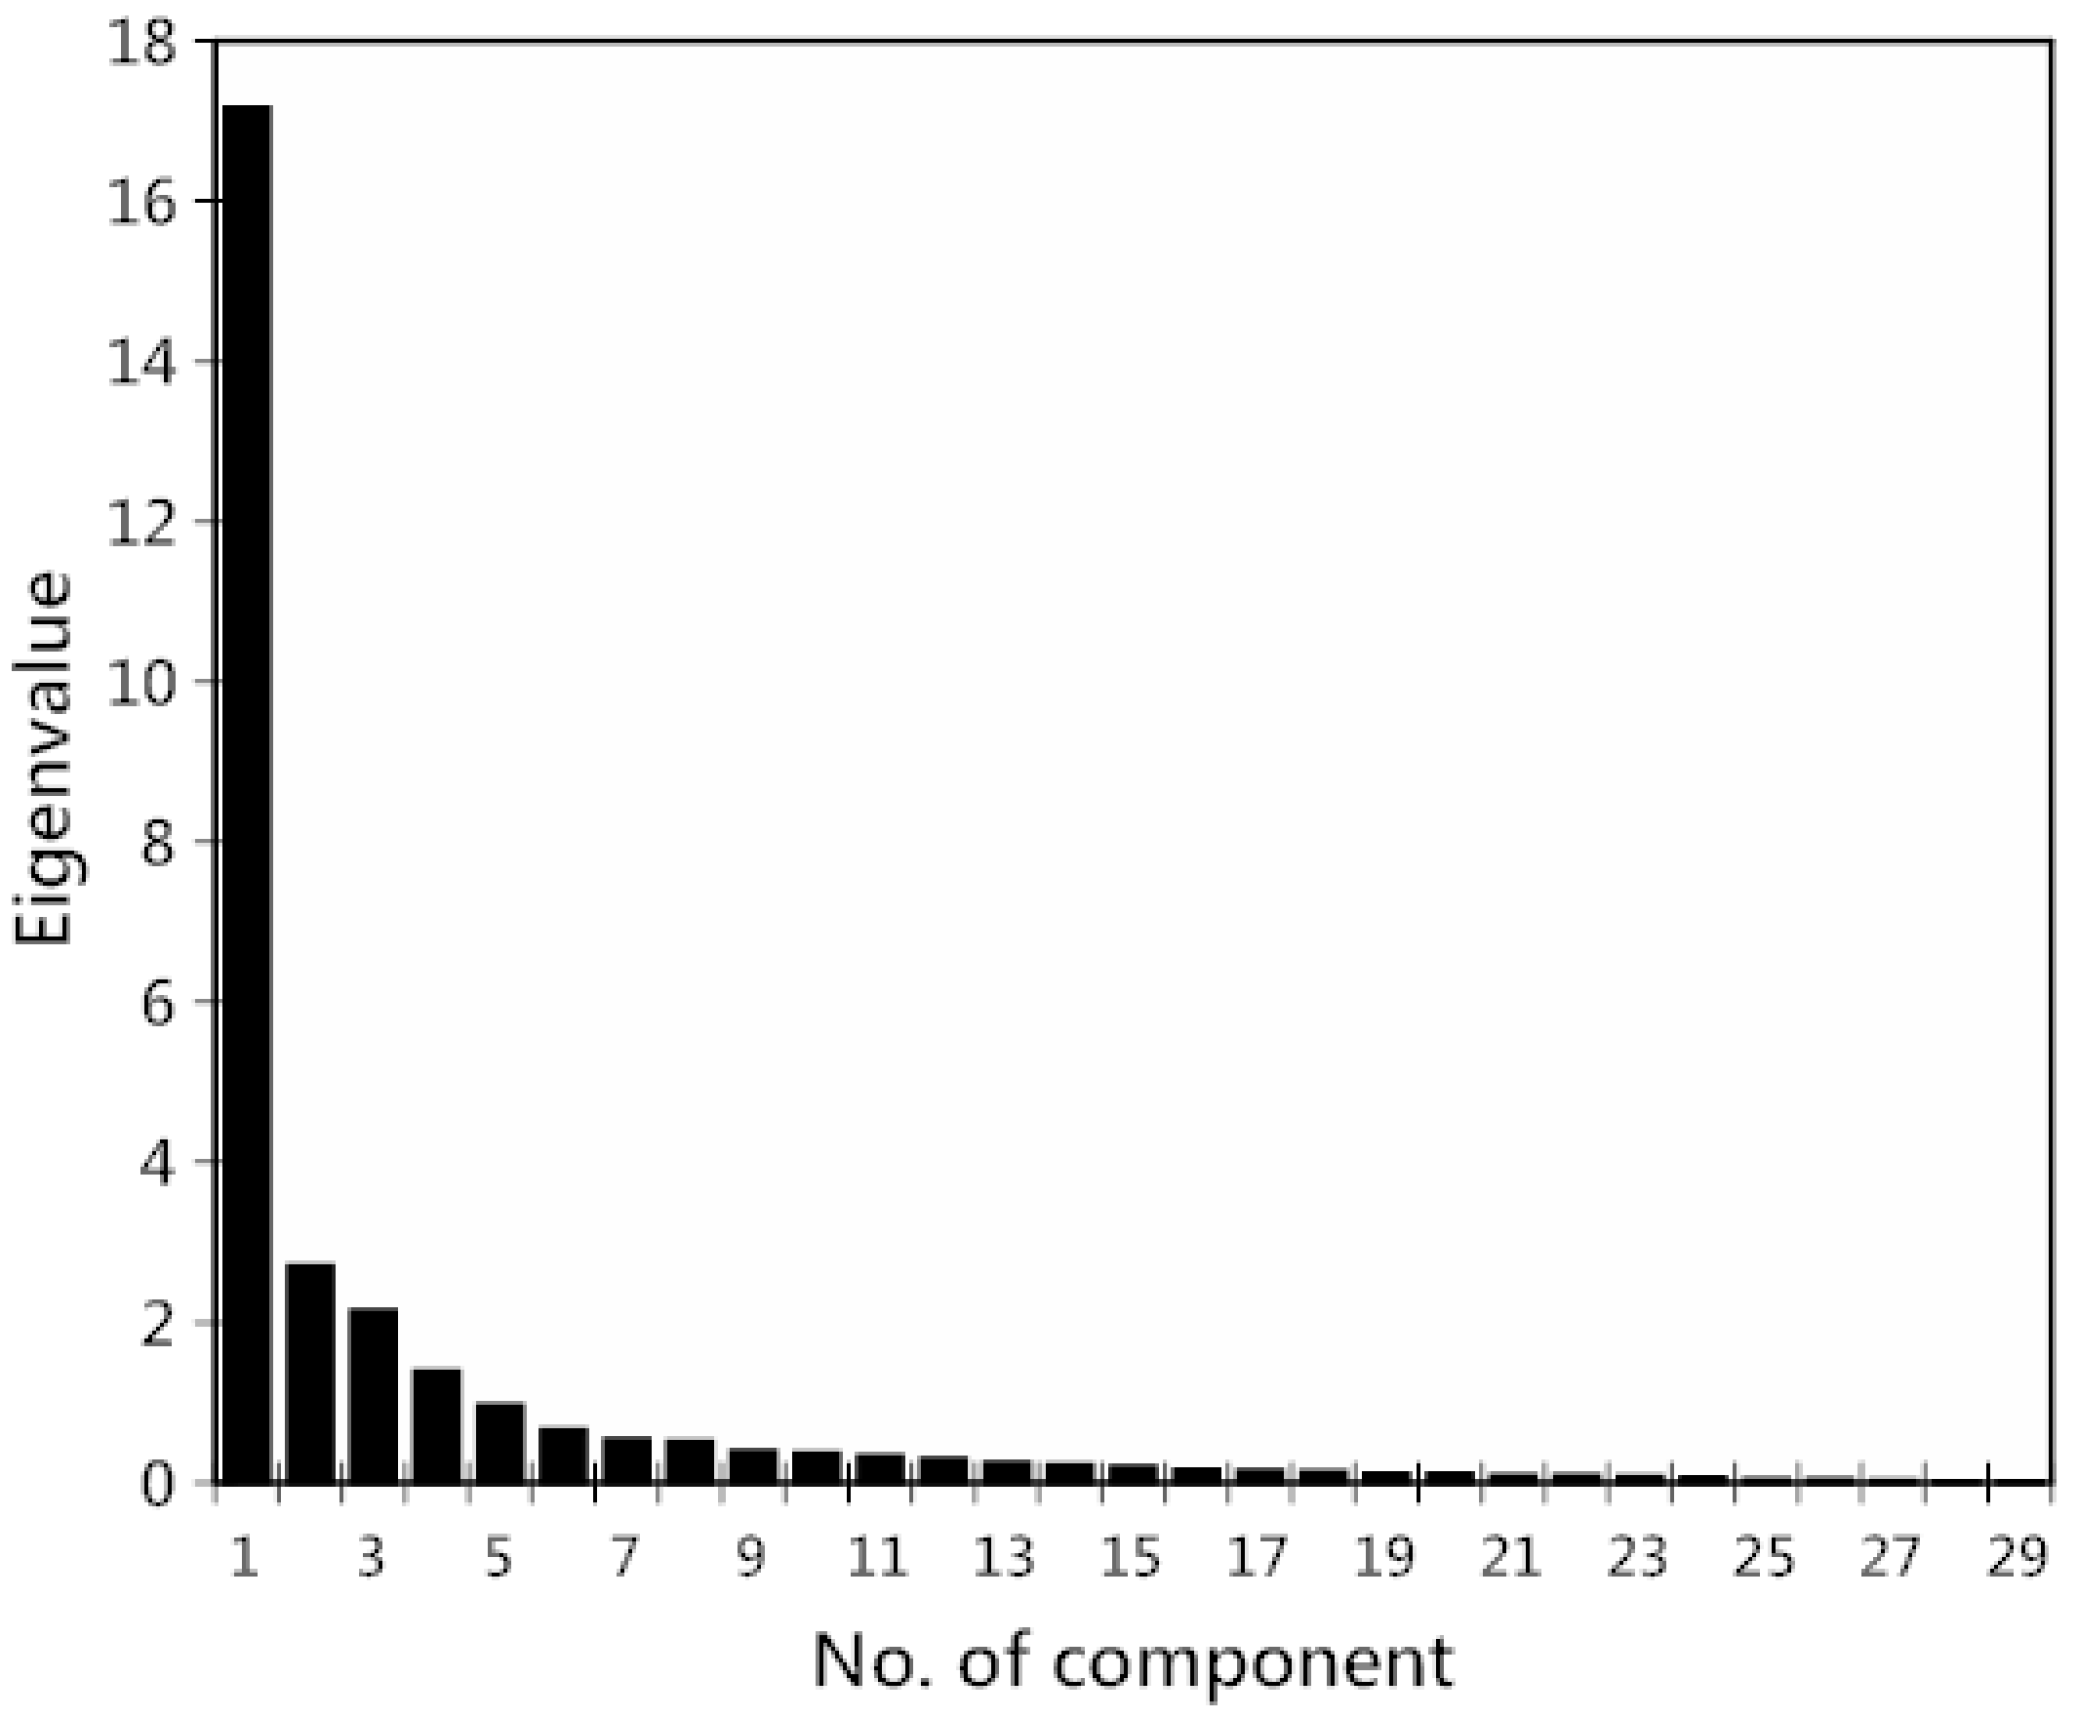
3.1. Extraction of Development Types

We performed principal component analysis (PCA) with varimax rotation in order to reduce a large number of indicators into a few independent variables representing different features of development. According to the component loadings matrix (Figure 1 and Table 3; see Table A1 for extended table), four principal components (PCs) with an eigenvalue of >1.00 were extracted, accounting for more than 80% of the total variance in MDG indicators.
PC1 had strong negative loadings of HIV prevalence, poverty ratio, and infant or under-five mortality rate; and positive loadings of CO2 emissions and prevalence of improved drinking water and sanitation facilities. We therefore labelled PC1 “poverty reduction”, representing the stage of industrialization and standard of living. PC2 had strong loadings of antenatal care coverage and ratio of girls to boys in primary school, and was therefore labelled “improvement of social welfare”. We labelled PC3 “spread of tuberculosis” and PC4 “proportion of environmentally protected areas”.

3.2. Contribution to SWB

To determine the relative contribution of each PC to SWB, we performed a multiple linear regression. As a measure of SWB we used life satisfaction (LS) with a scale from 0 (the worst possible life) to 10 (the best possible life), whose levels were surveyed by the Gallup World Poll during 2005 to 2007. Based on the results of the regression analysis for Model 1, national average levels of LS can be obtained from the following equation:
L S i = 4.845 + 0.499 · X i 1 + 0.224 · X i 2 0.230 · X i 3 + 0.153 · X i 4 ,   ( R 2 = 0.577 , p < 0.001 )
where X i j indicates the PC j score in the i t h nation (see also Table 4).
The results of regression model-3 showed that GDP per capita can predict the LS levels (R2 = 0.620), but the value of R2 was not much different compared to model-1. The value of R2 for Model 1 reveals that PCs 1 to 4 explain 57.7% of international differences in LS levels, indicating that national levels of LS can be reliably estimated from the degree of human development measured by PC scores. The relative size of the regression coefficients B (see Equation (3) and Table 4) tells us which component is more associated with a high level of satisfaction. The strongest determinant of LS was poverty reduction (B1 = 0.499), followed by social welfare (B2 = 0.224), tuberculosis (B3 = −0.230), and environmentally protected areas (B4 = 0.153).
Another regression analysis using a different measure of SWB, Satisfaction With Life [37], showed similar results (see Appendix B and Table A3), indicating that the findings are robust irrespective of the type of SWB measure.
Comparison between the Gallup survey data and estimated LS scores calculated by the proposed Equation (5), or the results of regression analyses for Model 2 and Model 4 in Table 4, suggests that Latin American and Caribbean nations enjoy higher levels of LS than expected from the high values in the MDG indicators (Figure 2a). Additional analysis revealed a significant difference in LS residual error between “Latin America” and “Others” (one-way analysis of variance [ANOVA], Tukey–Kramer post hoc test: p < 0.05) (Figure 2b). This result agrees well with past findings that Latin American nations had relatively high happiness levels, probably reflecting cultural factors or political and economic turmoil during the years of the survey [7].

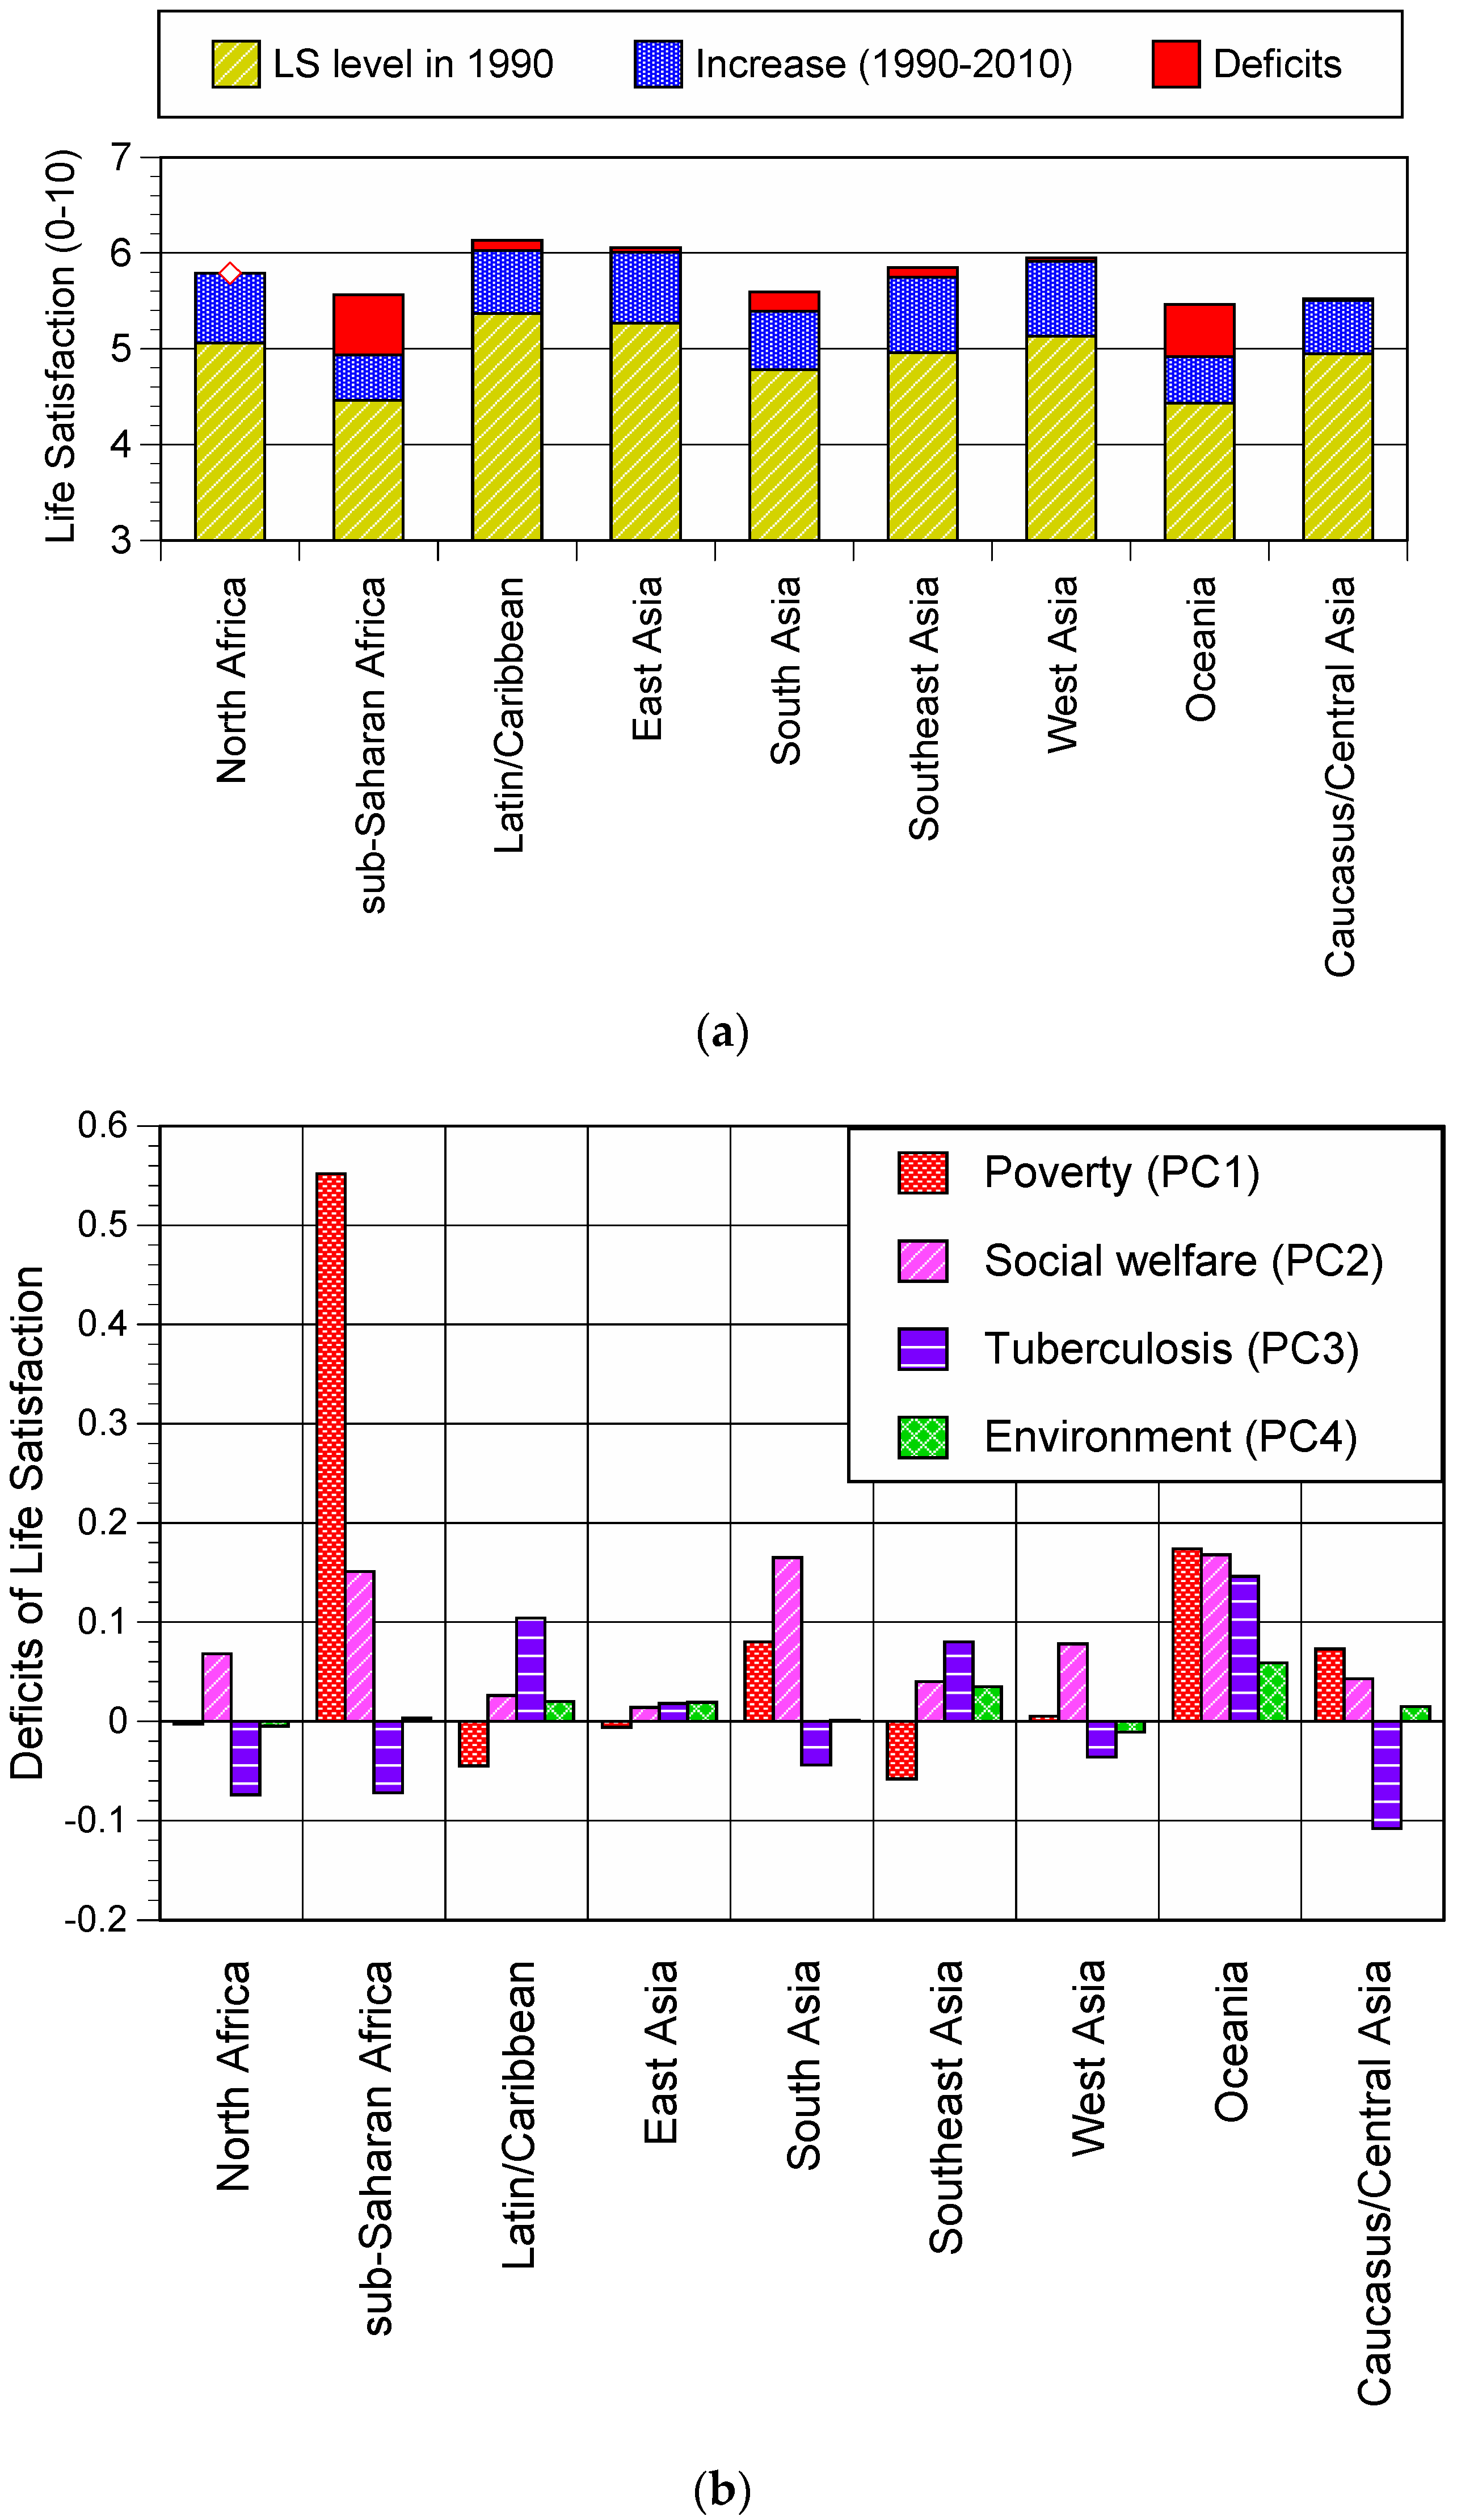
3.3. How Much Could LS Be Increased in Each Region?

To assess how much LS has increased over several decades or would increase from now in developing nations, we tested whether Equation (5) can estimate secular changes in LS in Japan during its period of rapid economic growth (1950s to 1970s) before applying it to developing nations. We found that Equation (5) can explain secular changes in average levels of LS until a nation’s standard of living has reached a certain level and material needs are met (see Appendix C, Table A4, and Figure A1). Based on the result, we estimated regional average levels of LS in 1990 and 2010 by Equation (5), and then determined how much progress each region had made over 20 years from a benchmark year for the MDGs. We also calculated Full-MDG levels of LS, which are the levels that would be obtained if all quantitative MDG targets were achieved within a region. It must be noted that the aim of this assessment is not to find out which region is the happiest or unhappiest, but to identify where they have room for further development and how much LS could be improved.
We found that deficits of LS, calculated as Full-MDG levels minus 2010 levels of LS, were greatest in sub-Saharan Africa; if every region accomplishes the MDGs, Oceania and sub-Saharan Africa will gain more than 0.5 points of LS score to reach their Full-MDG levels of 5.47 points and 5.57 points, respectively (Figure 3a and Table A5). Sub-Saharan Africa has room for development in poverty reduction (PC1), while Oceania requires almost every component to be improved (Figure 3b and Table A6). These results suggest how to set priorities of targets to enhance well-being.
Another finding was that there would be a difference in Full-MDG levels of LS among nine regions (Figure 3a), ranging from 5.47 points in Oceania to 6.13 points in Latin America and the Caribbean. This disparity of LS at Full-MDG level is caused by the global common targets set and the differences in conditions when all the targets are fully accomplished: The target of reducing the under-five mortality rate by 2/3, for instance, allows Region A, with a high initial mortality of 150 per 1000 live births (150‰), to achieve 50‰ at best in the Full-MDG scenario, whereas Region B, with a lower initial mortality of 30‰, is expected to achieve as low as 10‰; therefore, Region B would gain a higher level of LS than Region A.
Negative values of deficits do not always mean that no more effort is necessary to implement the MDG targets related to the component. PC scores are influenced by indicators with high PC loadings, but other indicators with lower loadings can also determine the relative significance of the score. For example, although tuberculosis death rate may need to be decreased, another problem which requires greater improvements, such as a high maternal mortality, can diminish the seriousness of high tuberculosis prevalence, resulting in negative values of deficits in PC3.

4. Discussion

The MDG framework is a list of quantitative targets proposed in the 1990s [2]. Given that the concept of human development refers to an enlargement of all human choices extending far beyond economic growth—to include social, cultural, and political well-being [38]—it is meaningful to assess the MDGs’ contributions to the subjective aspect of human well-being, which has not been fully clarified before; most previous publications have pointed out the strengths and weaknesses of the MDGs mainly by providing descriptive analyses or statistical data (reviewed in [3]).
We introduce the SWB approach as a useful assessment tool. Firstly, a measure of SWB serves as an alternative yardstick of several intangible conditions (e.g., poverty, illness, and environmental deterioration), making it possible to quantify multidimensional human development in a single value, which aggregates the various targets. Secondly, estimated levels of SWB represent the degree of human development at a given time and place. They are helpful for considering prioritized and effective lists of targets specific to regional contexts, as “the results gained from happiness research should be taken as inputs into the political process” [23] (pp. 168–169). In this regard, drawing policy lessons from this approach requires careful attention since national average data of SWB or MDG indicators often conceal micro-level diversity or disparities.
We conclude that achievement of the MDGs is accompanied by higher levels of SWB measured by LS in low- to middle-income nations. It should be noted that the SW approach is based on the cross-sectional study and cannot capture directions of causality: for example, what makes people happier may not be the attainment of the MDGs but a pre-existing positive attitude of people. This study showed, however, that there was at least a significant correlation between human development and LS. The relatively strong importance of “poverty reduction” (PC1) suggests that the MDGs’ emphasis on reducing extreme poverty matches subjective views and needs in less-developed nations.
It can be pointed out that national income levels have a latent contribution to high levels of LS and all PCs. Several studies, as well as the regression analysis for Model 3 in this study, have presented empirical evidence for a positive correlation between income and happiness across nations [39,40], and it should be true that a rise in monetary indicators eventually leads to the alleviation of some poverty problems. We can still argue, however, that economic prosperity cannot be realized without specific strategies for action. What is more, output-oriented targets for many aspects of human development are preferable to input-oriented targets, typically presented in such forms as extensive financial assistance, because output-oriented targets “help to clarify the vision of a higher quality of life for all people, and will provide guideposts against which progress toward that vision can be measured” [41] (p. 9).
In recognition of the limitation of income-based indices such as GDP and economic growth rate in measuring all dimensions of human well-being [42] composite development indices, like the HDI and the OECD’s Better Life Index, were formulated to incorporate what seemed to be essential for helping people’s lives to flourish. These composite indices are calculated as a geometric average or a sum of several values. For example, HDI is a geometric average of three normalized indices: life expectancy, education, and income index [43]. The components taken into account, however, are still limited in number, and are given equal weight, although they are often related to each other and not comparable. The MDG-based LS, proposed in this study, reflects a wider variety of dimensions of human development, and can be obtained as a sum of four values adjusted according to their relative contributions to wellbeing, being closer to subjective values and priorities of people in developing nations.
While we should make better use of both SWB measures and conventional indices in line with the current conditions or values and policies of each community, the MDG-based LS is expected to be a convenient tool to aggregate wide-ranging human development metrics and to assess the progress of development. Although the estimation of LS levels has a limitation since the linear regression equation could not be applied to the nations which have reached a certain level of development or life circumstances (see Appendix C), the estimation of LS levels will offer further information useful for decision-making in developing nations. For example, the regional disparity in SWB at the Full-MDG level, identified in this study, highlights the need for further discussion by the international community of whether to ensure equality of target settings or equality of SWB levels when all the targets are fully accomplished. The SWB approach can be applied to the evaluation of the Sustainable Development Goals (SDGs), which build upon the MDGs and consist of 17 goals and 169 targets [44,45] in terms of their contributions to our sense of happiness.

Supplementary Materials

The following are available online at www.mdpi.com/link, Table A1: National averages of MDG indicators and life satisfaction, Table A2: MDG indicators for which missing values were replaced, Table A3: Ordinary least-squares estimation of WVS-based SWL equation for low- to middle-income economies, Table A4: Representative indicators and sources (Japan, 1958–2010), Table A5: Regional averages of life satisfaction (in 1990, 2010 and scenario), Table A6: Regional deficits of life satisfaction by each PC, Figure A1: Secular change in life satisfaction (Japan, 1958–2010).

Acknowledgments

This research was supported by Japan Society for the Promotion of Science KAKENHI, Grant-in-Aid for Scientific Research (S) (23226012), and the Environment Research and Technology Development Fund (S-14) of the Ministry of the Environment, Japan. This Work was also supported by Research Grant Project from Mitsui & Co., Ltd. Environment Fund named "Sustainability and Well-Being—Four Concepts of Capitals and their Limitation ".

Author Contributions

Shizuki Fukuda conceived the reaserch, prepared the data and conducted the statistical analyses; Michio Murakami, Keigo Noda and Taikan Oki. supervised the research; all authors discussed and interpreted the results of analyses; Shizuki Fukuda. wrote the paper with contributions from all authors.

Conflicts of Interest

The authors declare no conflict of interest.

Abbreviations

The following abbreviations are used in this manuscript:
MDGs
Millennium Development Goals
SWB
subjective well-being
PCA
principal component analysis
LS
life satisfaction

Appendix A

Table A1. A matrix of varimax rotated principal component loadings.
MDG IndicatorsPrincipal Components
(Numbered in Order of Goals/Targets)1234h2
1.1 % Population below $1 (PPP) per day−0.80−0.380.210.150.84
1.2 Poverty gap ratio, log−0.72−0.310.200.220.70
1.8 % Underweight children under-5 years of age−0.29−0.820.330.010.87
1.9 % Population below min. level of dietary energy consumption−0.55−0.230.390.370.65
2.1 Total net enrolment ratio in primary education0.480.720.030.210.79
2.2 % Pupils starting grade 1who reach last grade of primary0.620.40−0.29−0.180.66
2.3 Literacy rates of 15–24 year-olds, both sexes0.600.700.050.080.86
3.1 Ratios of girls to boys in primary education0.280.850.090.050.80
4.1 Children under-five mortality rate per 1000−0.79−0.520.08−0.070.91
4.2 Infant mortality rate (0–1 year) per 1000−0.76−0.520.18−0.060.89
4.3 % Children 1 year-old immunized against measles0.470.73−0.190.030.79
5.1 Maternal mortality ratio per 100,000 live births−0.70−0.560.190.070.85
5.2 % Births attended by skilled health personnel0.460.75−0.30−0.110.88
5.3 % Current contraceptive use, women 15–49 years old0.670.55−0.240.130.84
5.4 Adolescent birth rate, per 1000 women−0.76−0.34−0.090.240.76
5.5 % Antenatal care coverage, at least one visit0.020.89−0.25−0.010.85
6.1 % HIV prevalence, 15–24 years, log−0.83−0.040.010.240.75
6.9.1 Tuberculosis prevalence rate per 100,000−0.06−0.160.950.080.93
6.9.2 Tuberculosis death rate per 100,000−0.19−0.230.85−0.070.82
6.9.3 Tuberculosis incidence rate per 100,000−0.37−0.020.820.180.85
7.1 % Land area covered by forest0.040.190.140.830.74
7.2 Metric tons of CO2 per capita, log0.760.45−0.23−0.010.83
7.3 Consumption of all Ozone-Depleting Substances [t], log0.65−0.07−0.280.220.55
7.6 % Terrestrial and marine areas protected−0.21−0.02−0.030.830.74
7.8 % Population using an improved drinking water source0.690.48−0.38−0.020.84
7.9 % Population using an improved sanitation facility0.670.57−0.21−0.080.83
8.14 % Fixed-telephone subscriptions, log0.760.49−0.35−0.050.94
8.15 % Mobile-cellular subscriptions0.600.54−0.390.120.82
8.16 % Internet users, log0.650.49−0.350.060.78
Eigenvalue9.9 7.7 3.8 2.0
Cumulative Proportion of Variance [%]34.3 60.7 73.9 80.6
Source. Official list of MDG Indicators [19] ; Note. h2 = communality estimates.
Table A2. MDG indicators for which missing values were replaced.
YearMDG Indicators
(Numbered in Order of Goals/Targets)
RegionsAlternative Value
19902.1 Total net enrolment ratio in primary education [%]Caucasus/Central Asia94.5 (estimated)
2.2 Pupils who reach last grade of primary [%]Caucasus/Central Asia96.6 (in 2000)
2.3 Literacy rates of 15-24 years old, both sexes [%]Oceania74.8 (in 2000)
4.3 Children 1 year old immunized against measles [%]Caucasus/Central Asia93.0 (in 2000)
5.2 Births attended by skilled health personnel [%]Oceania65.0 (estimated)
5.5 Antenatal care coverage, at least one visit [%]Oceania76.0 (estimated)
Caucasus/Central Asia93.0 (estimated)
6.1 People living with HIV [%]All regionsData in 2001
7.3 Consumption of all Ozone-Depleting Substances [t]Southern Asia20,000 (estimated)
8.14 Fixed telephone lines [%]All regionsData in 1995
8.15 Mobile cellular subscriptions [%]All regionsData in 1995
8.16 Internet users [%]All regionsData in 1995
20102.1 Total net enrolment ratio in primary education [%]Oceania90.0 (estimated)
2.2 Pupils who reach last grade of primary [%]Eastern Asia100.2 (in 2000)
Southern Asia68.3 (in 2000)
Oceania65.1 (in 2000)
3.1 Gender Parity Index in primary level enrolmentOceania0.90 (in 2000)
5.2 Births attended by skilled health personnel [%]Oceania65.0 (estimated)
5.5 Antenatal care coverage, at least one visit [%]Oceania81.0 (estimated)
Caucasus/Central Asia93.0 (estimated)
6.1 People living with HIV [%]South-Eastern Asia0.03 (in 2001)
Oceania0.03 (in 2001)
Note. For missing values, we substituted values estimated by calculating the population-weighted average of nation-specific data (indicated by “estimated”) or regional data gained in a different year.

Appendix B

Another measure of SWB is Satisfaction With Life (SWL), which is used by many national and institutional surveys such as the World Values Survey (WVS), which started in 1981 and has interviewed people in nearly 100 countries that hold almost 90% of the world’s population [37]. A dataset of national average scores of SWL in the 2000s was available in the World Database of Happiness (WDH) [46], most of which are based on responses to a question used in the Gallup World Poll and the WVS:
All things considered, how satisfied are you with your life as a whole these days? Using this card on which 1 means you are “completely dissatisfied” and 10 means you are “completely satisfied,” where would you put your satisfaction with your life as a whole?
(Completely dissatisfied) 1 2 3 4 5 6 7 8 9 10 (Completely satisfied)
The WVS’s scores on a scale of 1 to 10 were transformed linearly to a scale of 0 to 10.
We performed a regression analysis using the WDH SWL data instead of Gallup’s LS data to see whether the determinants of SWB and their relative contributions differ depending on how SWB is measured (Table A3). The national average level of SWL and a set of PC scores served as a dependent variable and explanatory variables, respectively, for the 56 nations.
Table A3. Ordinary least-squares estimation of WVS-based SWL equation for low- to middle-income economies.
Principal ComponentSatisfaction with Life (N = 56)
B95% CItp
Const.5.3365.085 to 5.58642.80 <0.001
Poverty reduction (PC1)0.7980.546 to 1.0516.35 <0.001
Social welfare (PC2)0.2580.005 to 0.5102.05 0.046
Tuberculosis (PC3)−0.385−0.637 to −0.132−3.06 0.004
Environment (PC4)0.240−0.013 to 0.4921.91 0.062
R-square0.530 (p < 0.001)
Note. B = regression coefficients; CI =confidence interval. Arithmetic mean scores of SWL (Const. = 5.336) were higher than that of Callup’s LS (Const. = 4.845, see Table 4), consistent with previous findings [29]. R2 indicates that 53.0% of international differences in SWL can be explained by PCs 1 to 4, and the strongest determinant of SWL was PC1 (Poverty reduction). Although the relative contributions of each PC differed slightly between the two measures, both measures were similarly correlated with each PC.

Appendix C

To verify whether the MDG-based formula can explain secular changes in life satisfaction (LS) within a nation, particularly among developing nations, we estimated average levels of LS in Japan during the period of rapid economic growth (1950s to 1970s). Since it is impossible to collect past data for indicators identical to the 29 MDG indicators, we used a single indicator ( I j ) representative of MDG indicators for which the principal component (PC j , j = 1 , 2 , 3 , 4 ) had high loadings to approximate the PC score:
Z k j = I k j I J ¯ S D j
X k j = a · Z k j + b = r j · Z k j
where values were standardized using the average value ( I J ¯ ) and standard deviation ( S D j ) for 56 sample nations, and approximate scores of PC j in nation k   ( X k j ) can be obtained by a regression equation. Since both Z j   and   X j are standardized with an average of 0 and a standard deviation of 1, the constant term ( b ) is 0, and regression coefficients ( a ) are consistent with correlation coefficients ( r j ) between Z j   and   X j for the 56 nations.
Table A4 displays detailed information on the representative indicators. Infant mortality and tuberculosis death rate came from the Ministry of Health, Labor and Welfare (MHLW) [47]. The gender parity index in primary-level enrolment was set to 1.0 on the assumption that every child aged 6 to 12 years entered primary school after the introduction of compulsory education in 1947. The proportion of forested areas was regarded to be constant (67%) over the long term.
Annual estimates of LS in Japan were calculated by using these approximate scores of PCs in Equation (5):
L S = 4.845 + 0.499 · X 1 + 0.224 · X 2 0.230 · X 3 + 0.153 · X 4 .
The estimated levels of LS were compared with survey data available in the WDH [46]. The data source is the Life in Nation surveys conducted by the Cabinet Office of Japan (former Economic Planning Agency), which started in 1958. Every year, 10,000 to 20,000 individuals aged 20 and older are selected at random, and around 6000 to 7000 of them respond to the questions face to face. Life satisfaction, which is measured on a scale of 1 to 4 using verbal response options such as “very happy”, was transformed into a scale of 0 to 10 by rating the verbal response on a numerical scale [48]; for example, 7.0 for “fairly happy” and 5.6 for “not too happy”.
The wording of the survey question and response options was changed in 1964. The previous question was:
  • What do you think about your circumstances of life?
  • 4: almost satisfied, although too much is never enough;
  • 3: not too bad if I can continue my current life, although not very satisfied;
  • 2: unsatisfied;
  • 1: I cannot stand it any longer,
prompting the respondents who felt unsatisfied to answer “almost satisfied (=4)” or “not too bad (=3)”. That is why the national average levels during a period of 1958–1963 were higher than the responses to the current style of question after 1964 (Figure A1). The current question is:
  • How satisfied are you with the current life as a whole?
  • 4: satisfied;
  • 3: fairly satisfied;
  • 2: somewhat unsatisfied;
  • 1: unsatisfied.
Comparison of secular changes in estimated satisfaction with survey data allowed us to conclude that the MDG-based LS (Equation (A3)) can explain the moderate increase in LS score during the period when both infant mortality rate and tuberculosis death rate were decreasing, but it cannot explain a decline in satisfaction after 1996, indicating that some determinants other than MDG-like material components are correlated better with life satisfaction in nations where national income has reached a certain level and material needs are met [10].
Table A4. Representative indicators and sources (Japan, 1958–2010).
ComponentRepresentative IndicatorData Sourcerj
PC1 (Poverty reduction)Infant mortality rate per 1000 births2012 Vital statistics in Japan, vol. 1, Table 6.1 (MHLW)−0.760
PC2 (Social welfare)Ratios of girls to boys in primary education (=1.0)-0.847
PC3 (Tuberculosis)Tuberculosis death rate per 100,000 population2012 Vital statistics in Japan, vol. 1, Table 5.12 (MHLW)0.853
PC4 (Environment)Proportion of land area covered by forest (=67%)-0.828
Note. MHLW = Ministry of Health, Labor and Welfare. rj indicates correlation coefficients between standardized representative indicators ( Z j ) and scores of PCj ( X j ) for the 56 nations.
Figure A1. Secular change in life satisfaction (Japan, 1958–2010). Survey data from 1960, 1998, and 2000 are not available. In years when two surveys were conducted, the first one was used (i.e., January 1974, May 1975, and May 1976). Survey life satisfaction LSwas higher during 1958 to 1963 owing to different wording of the question and options. LS rose from 1965, peaked in 1995 and then declined. Estimated LS showed a similar increase but has remained steady since about 1990.
Sustainability 08 00189 g004

Appendix D

Table A5. Regional averages of life satisfaction (in 1990, 2010 and scenario).
YearLife Satisfaction
19902010Full-MDG
North Africa5.065.795.77
sub-Saharan Africa4.464.945.57
Latin/Caribbean5.376.026.13
East Asia5.276.016.05
South Asia4.785.395.59
Southeast Asia4.965.755.85
West Asia5.135.915.95
Oceania4.434.925.47
Caucasus/Central Asia4.955.505.52
Note. Regional groupings are based on UN geographical divisions.
Table A6. Regional deficits of life satisfaction by each PC.
Deficits of Life Satisfaction
Poverty (PC1)Social Welfare (PC2)Tuberculosis (PC3)Environment (PC4)Total (LS Score)
North Africa−0.0030.068−0.074−0.005−0.014
sub-Saharan Africa0.5520.151−0.0720.0030.633
Latin/Caribbean−0.0450.0260.1040.0200.106
East Asia−0.0060.0140.0180.0190.045
South Asia0.0800.165−0.0440.0010.202
Southeast Asia−0.0580.0400.0800.0350.097
West Asia0.0050.078−0.036−0.0110.037
Oceania0.1740.1680.1460.0590.546
Caucasus/Central Asia0.0730.043−0.1080.0150.022
Note. Deficits of LS score are defined as Full-MDG levels in 2015 minus LS levels in 2010.

References

  1. United Nations Department of Economic and Social Affairs. The Millennium Development Goals Report 2010; United Nations Publications: New York, NY, USA, 2010; p. 74. [Google Scholar]
  2. Manning, R. Using Indicators to Encourage Development Goals: Lessons from the Millennium Development Goals; Danish Institute for International Studies, DIIS: Copenhagen, Denmark, 2009; pp. 77–97. [Google Scholar]
  3. United Nations System Task Team on the Post-2015 UN Development Agenda. Review of the Contributions of the MDG Agenda to Foster Development: Lessons for the Post-2015 UN Development Agenda. 2012. Available online: http://www.un.org/millenniumgoals/pdf/mdg_assessment_Aug.pdf (accessed on 23 December 2015).
  4. United Nations. General Assembly Resolution A/RES/55/2: United Nations Millennium Declaration; United Nations General Assembly: New York, NY, USA, 8 September 2000; Available online: http://www.un.org/millennium/declaration/ares552e.htm (accessed on 18 February 18 2016).
  5. United Nations Development Programme. Human Development Report 1990; Oxford University Press: New York, NY, USA, 1990; p. 10. [Google Scholar]
  6. Diener, E.; Suh, E.M. Subjective well-being and age: An international analysis. In Annual Review of Gerontology and Geriatrics Vol. 17; Schaie, W., Lawton, P., Eds.; Springer Publishing Co: New York, NY, USA, 1998; pp. 304–324. [Google Scholar]
  7. Diener, E. Subjective well-being: The science of happiness and a proposal of national index. Am. Psychol. 2000, 55, 34–43. [Google Scholar] [CrossRef] [PubMed]
  8. Blanchflower, D.G.; Oswald, A.J. Money, sex and happiness: An empirical study. Scand. J. Econ. 2004, 106, 393–415. [Google Scholar] [CrossRef]
  9. Frey, B.S.; Stutzer, A. The economics of happiness. World Econ. 2002, 3, 1–17. [Google Scholar]
  10. Easterlin, R.A. Does economic growth improve the human lot? Some empirical evidence. In Nations and Households in Economic Growth: Essays in Honour of Moses Abramowitz; David, P., Reder, M., Eds.; Academic Press: New York, NY, USA, 1974; pp. 89–125. [Google Scholar]
  11. Helliwell, J.F.; Putnam, R.D. The social context of well-being. In The Science of Well-Being; Huppert, F., Baylis, N., Keverne, B., Eds.; Oxford University Press: London, UK, 2004; pp. 1435–1446. [Google Scholar]
  12. Delhey, J. From materialist to post-materialist happiness? National affluence and determinants of life satisfaction in cross-national perspective. Soc. Indic. Res. 2010, 97, 65–84. [Google Scholar] [CrossRef]
  13. Inglehart, R.; Klingemann, H.D. Genes, culture, democracy and happiness. In Culture and Subjective Well-Being; Diener, E., Suh, E., Eds.; MIT Press: Cambridge, MA, USA, 2000; pp. 165–184. [Google Scholar]
  14. Graham, C. Happiness and health: Lessons—and questions—for public policy. Health Affair. 2008, 27, 72–87. [Google Scholar] [CrossRef] [PubMed]
  15. Graham, C. The Pursuit of Happiness: An Economy of Well-being; Booking Institution Press: Washington, DC, USA, 2011. [Google Scholar]
  16. Graham, C. Does more money make you happier? Why so much debate? Appl. Res. Qual. Life. 2011, 6, 219–239. [Google Scholar] [CrossRef]
  17. Organisation for Economic Cooperation and Development. How's Life?: Measuring Well-Being; OECD Publishing: Paris, France, 2011; pp. 13–35. [Google Scholar]
  18. Future Earth. Future Earth Strategic Research Agenda 2014; International Council for Science, ICSU: Paris, France, 2014; p. 19. [Google Scholar]
  19. Millennium Development Goals Indicators: The Official United Nations Site for MDG Indicators. Available online: http://millenniumindicators.un.org/unsd/mdg/Default.aspx (accessed on 23 December 2015).
  20. Nettle, D. Happiness: The Science Behind Your Smile; Oxford University Press: New York, NY, USA, 2005. [Google Scholar]
  21. Diener, E. Subjective well-being. Psychol. Bull. 1984, 95, 542–575. [Google Scholar] [CrossRef] [PubMed]
  22. Bradburn, N.M.; Caplovitz, D. Reports on Happiness: A Pilot Study of Behavior Related to Mental Health; Aldine Publishing Company: Chicago, IL, USA, 1965. [Google Scholar]
  23. Frey, B.S. Happiness: A Revolution in Economics; MIT Press: Cambridge, MA, USA, 2008; pp. 168–169. [Google Scholar]
  24. Andrews, F.; Robinson, J. Measures of subjective well-being. In Measures of Personality and Social Psychological Attitudes; Robinson, J., Shaver, P., Wrightsman, L., Eds.; Academic Press: San Diego, CA, USA, 1991; pp. 61–114. [Google Scholar]
  25. Organisation for Economic Cooperation and Development. OECD Guidelines on Measuring Subjective Well-Being; OECD Publishing: Paris, France, 2013; pp. 27–59. [Google Scholar]
  26. Larsen, R.J.; Diener, E.; Emmons, R.A. An evaluation of subjective well-being measures. Soc. Indic. Res. 1985, 17, 1–17. [Google Scholar] [CrossRef]
  27. Kahneman, D.; Wakker, P.P.; Sarin, R. Back to Bentham? Explorations of experienced utility. Q. J. Econ. 1997, 112, 375–406. [Google Scholar] [CrossRef]
  28. Gallup. Available online: http://www.gallup.com/home.aspx?ref=logo (accessed on 23 December 2015).
  29. Bjørnskov, C. How comparable are the Gallup World Poll life satisfaction data? J. Happiness Stud. 2010, 11, 41–60. [Google Scholar] [CrossRef]
  30. Cantril, H. The Pattern of Human Concerns; Rutgers University Press: New Brunswick, NJ, USA, 1965. [Google Scholar]
  31. Helliwell, J.F.; Barrington-Leigh, C.P.; Harris, A.; Huang, H. International Evidence on the Social Context of Well-Being; National Bureau of Economic Research: Cambridge, MA, USA, 2009. [Google Scholar]
  32. Helliwell, J.F.; Wang, S. World happiness: Trends, explanations and distribution. In World Happiness Report 2013; Helliwell, J., Layard, R., Sachs, J., Eds.; UN Sustainable Development Solutions Network: New York, NY, USA, 2013; pp. 8–33. [Google Scholar]
  33. Bue, M.C.; Klasen, S. Identifying synergies and complementarities between MDGs: Results from cluster analysis. Soc. Indic. Res. 2013, 113, 647–670. [Google Scholar] [CrossRef]
  34. Kaiser, H.F.; Rice, J. Little jiffy, mark IV. Educ. Psychol. Meas. 1974, 34, 111–117. [Google Scholar] [CrossRef]
  35. Ferrer-i-Carbonell, A.; Frijters, P. How important is methodology for the estimates of the determinants of happiness? Econ. J. 2004, 114, 641–659. [Google Scholar] [CrossRef] [Green Version]
  36. International Monetary Fund. World Economic Outlook Database October 2012. Available online: http://www.imf.org/external/pubs/ft/weo/2012/02/weodata/index.aspx (accessed on 1 February 2016).
  37. World Values Survey—Who we are. Available online: http://www.worldvaluessurvey.org/wvs.jsp (accessed on 23 December 2015).
  38. Ul Haq, M. The human development paradigm. In Reading in Human Development; Fukuda-Parr, S., Shiva Kumar, A.K., Eds.; Oxford University Press: Oxford, UK, 2003; pp. 17–34. [Google Scholar]
  39. Deaton, A. Income, health and well-being around the world: Evidence from the Gallup World Poll. J. Econ. Perspect. 2008, 22, 53–72. [Google Scholar] [CrossRef] [PubMed]
  40. Diener, E.; Suh, E.M. Societies we live in: International comparisons. In Well-Being: The Foundations of Hedonic Psychology; Kahneman, D., Diener, E., Schwarz, N., Eds.; Russell Sage Foundation: New York, NY, USA, 1999; pp. 434–452. [Google Scholar]
  41. OECD/Development Assistance Committee. Shaping the 21st Centry: The Contribution of Development Co-operation; OECD publishing: Paris, France, 1996; p. 9. Available online: : http://www.oecd.org/dac/ 2508761.pdf (accessed on 23 December 2015).
  42. McGillivray, M.; Clarke, M. Human well-being: Concepts and measures. In Understanding Human Well-Being; McGillivray, M., Clarke, M., Eds.; United Nations University Press: Tokyo, Japan, 2006; pp. 3–15. [Google Scholar]
  43. United Nations Development Programme. Human Development Report 2014: Sustaining Human Progress: Reducing Vulnerabilities and Building Resilience; Oxford University Press: New York, NY, USA, 2014; pp. 153–225. [Google Scholar]
  44. Griggs, D.; Stafford-Smith, M.; Gaffney, O.; Rockström, J.; Öhman, M.C.; Shyamsundar, P.; Steffen, W.; Glaser, G.; Kanie, N.; Noble, I. Sustainable development goals for people and planet. Nature 2013, 495, 305–307. [Google Scholar] [CrossRef] [PubMed]
  45. United Nations. General Assembly Resolution A/RES/70/1:Transforming Our World: the 2030 Agenda for Sustainable Development; United Nations General Assembly: New York, NY, USA, 25 September 2015; Available online: https://sustainabledevelopment.un.org/post2015/transformingourworld (accessed on 18 February 2016).
  46. Veenhoven, R. World Database of Happiness: Archive of Research Findings on Subjective Enjoyment of Life. Available online: http://worlddatabaseofhappiness.eur.nl/index.html (accessed on 24 December 2015).
  47. Ministry of Health, Labor and Welfare. e-Stat: Portal Site of Official Statistics of Japan. Ministry of Health, Labor and Welfare. Available online: http://www.e-stat.go.jp/SG1/estat/eStatTopPortalE.do (accessed on 24 December 2015).
  48. Veenhoven, R. World Database of Happiness—International Happiness Scale Interval Study. Available online: http://www1.eur.nl/fsw/happiness/scalestudy/scale_fp.htm (accessed on 24 December 2015).
Figure 1. Scree plot of the eigenvalues of PCA.
Sustainability 08 00189 g001
Figure 2. Comparison between survey data and estimates. (a) The 56 nations were divided among Latin America + the Caribbean, sub-Saharan Africa, and the Others (East Europe, Asia, and North Africa); and (b) the residual error (calculated as survey value minus estimate) is expected to reflect cultural factors or national characters. A dot means arithmetic mean; line within box, median; bottom and top of each box, 25th and 75th percentiles; horizontal lines outside box, 10th and 90th percentiles. There were significant differences in residual error among the three regions (one-way ANOVA, F(2,53) = 3.762, p < 0.05), and Tukey–Kramer test showed that the average level of LS was significantly higher in Latin America than in the Others (p < 0.05).
Sustainability 08 00189 g002
Figure 3. Regional averages (in 1990, 2010 and scenario) and deficits of life satisfaction. (a) Regional groupings are based on UN geographical divisions. Only North Africa reached the Full-MDG level of 5.77 in 2010 (◊: LS = 5.79 in 2010). Deficits of LS scores were largest in Oceania and sub-Saharan Africa; and (b) deficits were divided into four PCs by contribution; positive values mean there is still room for development in the domain.
Sustainability 08 00189 g003
Table 1. A list of 56 sample nations.
RegionsLow IncomeLower-Middle IncomeUpper-Middle Income
Sub-Saharan AfricaAngola, Benin, Burkina Faso, Cameroon, Chad, Ethiopia, Ghana, Guinea, Kenya, Madagascar, Mali, Mauritania, Mozambique, Niger, Nigeria, Rwanda, Senegal, Togo, Uganda, United Republic of Tanzania, Zambia--
Latin America/the Caribbean-Bolivia, Colombia, Dominican Republic, Ecuador, El Salvador, Guatemala, Paraguay, PeruArgentina, Brazil, Mexico, Panama, Uruguay
North Africa-Egypt, Morocco-
West AsiaYemenTurkey-
Caucasus and Central AsiaArmenia, Georgia, TajikistanKazakhstan Kyrgyzstan-
East EuropeRepublic of Moldova, UkraineBelarus, Romania-
Southeast AsiaCambodia, Indonesia, Laos, Viet NamPhilippinesMalaysia
South AsiaNepal, PakistanSri Lanka-
Note. All nations are classified by regional grouping and national income level.
Table 2. Achievement scenario for developing regions.
MDG Indicators (Numbered in Order of Goals/Targets)Scenario (Developing Regions)
1.1 Population below $1 (PPP) per day [%]Target 1.A (reduction by 1/2)
1.2 Poverty gap ratio at $1 a day (PPP)Developing world level in 20106.8
1.8 Children under 5 underweight [%]Target 1.C (reduction by 1/2)
1.9 Population undernourished [%]
2.1 Total net enrolment ratio in primary education [%]Target 2.A (all children)100%
2.2 Pupils who reach last grade of primary [%]
2.3 Literacy rates of 15-24 years old, both sexes [%]
3.1 Gender Parity Index in primary level enrolmentTarget 3.A (gender-gap elimination)1.00
4.1 Children under five mortality rate per 1,000Target 4.A (reduction by 2/3)
4.2 Infant mortality rate (0-1 year) per 1,000
4.3 Children one year old immunized against measles [%]World level in 201084%
5.1 Maternal mortality ratio per 100,000 live birthsTarget 5.A (reduction by 3/4)
5.2 Births attended by skilled health personnel [%]World level in 201067%
5.3 Current contraceptive use, women [%]World level in 201063.2%
5.4 Adolescent birth rate, per 1,000 womenWorld level in 201048.6
5.5 Antenatal care coverage, at least one visit [%]World level in 201081%
6.1 People living with HIV [%]World level in 20100.06%
6.9.1 TB prevalence rate per 100,000 populationWorld level in 2010170
6.9.2 TB death rate per year per 100,000 populationWorld level in 201014
6.9.3 TB incidence rate per year per 100,000 populationWorld level in 2010125
7.1 Land area covered by forest [%]Regional level in 2010
7.2 Metric tons of CO2 per capitaRegional level in 2010
7.3 Consumption of all Ozone-Depleting Substances [t]Regional level in 2010
7.6 Terrestrial and marine areas protected [%]Regional level in 2010
7.8 Using improved drinking water sources [%]Target 7.C (reduction by 1/2)
7.9 Using improved sanitation facilities [%]
8.14 Fixed telephone lines [%]World level in 201017.3%
8.15 Mobile cellular subscriptions [%]World level in 201085.8%
8.16 Internet users [%]World level in 201032.5%
Note. TB = Tuberculosis. Concrete numerical targets defined with a deadline are shaded.
Table 3. A matrix of varimax rotated principal component loadings.
MDG IndicatorsPrincipal Components
(Numbered in Order of Goals/Targets)1234h2
1.1 % Population below $1 (PPP) per day−0.80−0.380.210.150.84
1.2 Poverty gap ratio, log−0.72−0.310.200.220.70
1.8 % Underweight children under-5 years of age−0.29−0.820.330.010.87
2.1 Total net enrolment ratio in primary education0.480.720.030.210.79
3.1 Ratios of girls to boys in primary education0.280.850.090.050.80
4.1 Children under-five mortality rate per 1000−0.79−0.520.08−0.070.91
4.2 Infant mortality rate (0–1 year) per 1000−0.76−0.520.18−0.060.89
4.3 % Children 1 year-old immunized against measles0.470.73−0.190.030.79
5.1 Maternal mortality ratio per 100,000 live births−0.70−0.560.190.070.85
5.2 % Births attended by skilled health personnel0.460.75−0.30−0.110.88
5.5 % Antenatal care coverage, at least one visit0.020.89−0.25−0.010.85
6.1 % HIV prevalence, 15–24 years, log−0.83−0.040.010.240.75
6.9.1 Tuberculosis prevalence rate per 100,000−0.06−0.160.950.080.93
7.1 % Land area covered by forest0.040.190.140.830.74
7.2 Metric tons of CO2 per capita, log0.760.45−0.23−0.010.83
7.6 % Terrestrial and marine areas protected−0.21−0.02−0.030.830.74
7.8 % Population using an improved drinking water source0.690.48−0.38−0.020.84
8.16 % Internet users, log0.650.49−0.350.060.78
Eigenvalue9.97.73.82.0
Cumulative Proportion of Variance [%]34.360.773.980.6
Source. Official list of MDG Indicators [19]; Note: h2 = communality estimates. The full table is shown in Table A1. Some indicators were log-transformed (indicated by “log”). The Kaiser–Meyer–Olkin measure of sampling adequacy was 0.876 (p < 0.001), indicating that this analysis is appropriate for these variables, and the components are distinct and reliable.
Table 4. Ordinary least-squares estimation of LS equation for low- to middle-income nations.
VariablesLife Satisfaction (N = 56)
Model 1
(4 PCs)
Model 2
(4 PCs + Dummy)
Model 3
(GDP)
Model 4
(GDP + Dummy)
Const.4.845
(4.699 to 4.991)
[<0.001]
5.333
(4.945 to 5.720)
[<0.001]
−0.797
(−2.008 to 0.415)
[0.193]
1.180
(−1.003 to 3.363)
[0.283]
logGDP 1.646
(1.295 to 1.998)
[<0.001]
1.192
(0.627 to 1.756)
[<0.001]
Poverty reduction (PC1)0.499
(0.352 to 0.646)
[<0.001]
0.567
(0.211 to 0.922)
[0.002]
Social welfare (PC2)0.224
(0.076 to 0.371)
[0.004]
0.180
(−0.008 to 0.368)
[0.061]
Tuberculosis (PC3)−0.230
(−0.377 to −0.082)
[0.003]
−0.114
(−0.287 to 0.060)
[0.194]
Environment (PC4)0.153
(0.006 to 0.300)
[0.042]
0.012
(−0.155 to 0.179)
[0.882]
Region 1 −0.459
(−1.194 to 0.275)
[0.215]
−0.666
(−1.214 to −0.117)
[0.018]
Region 2 −0.873
(−1.421 to −0.325)
[0.002]
−0.591
(−1.023 to −0.160)
[0.008]
Region 3 −0.691
(−1.316 to −0.067)
[0.031]
−0.236
(−0.714 to 0.242)
[0.327]
Region 4 −0.902
(−1.594 to −0.209)
[0.012]
−0.500
(−1.052 to 0.051)
[0.074]
R-square0.5770.6700.6200.689
R-square (adj.)0.5440.6140.6130.658
Note. Four “regions” indicate dummy variables. Region 1: sub-Saharan Africa = 1; Region 2: East Europe + Caucasus/Central Asia = 1; Region 3: South Asia + Southeast Asia = 1; and Region 4: North Africa + West Asia. Referenced region was Latin America/the Caribbean. The number in a parenthesis indicates 95% confidence interval, and the number in square brackets indicates a significance level. The values of variance inflation factors (VIF) were relatively high for PC1 (VIF = 6.837) and Region1 (VIF = 6.976) in Model 2, suggesting that collinearity can be found between them.

