Article

A TOE Approach to Establish a Green Supply Chain Adoption Decision Model in the Semiconductor Industry

1
Department of Business Administration, National Yunlin University of Science & Technology, Yunlin 64002, Taiwan
2
Department of Industrial Education, National Taiwan Normal University, Taipei 106, Taiwan
*
Author to whom correspondence should be addressed.
Sustainability 2016, 8(2), 168; https://doi.org/10.3390/su8020168
Submission received: 31 December 2015 / Revised: 2 February 2016 / Accepted: 5 February 2016 / Published: 16 February 2016
(This article belongs to the Special Issue How Better Decision-Making Helps to Improve Sustainability - Part II)

Abstract

:
The green supply chain is an innovation that extends traditional sustainability initiatives to environmental activities in the supply chain and aims to minimize a product’s environmental impact throughout its life cycle. The adoption of a green supply chain involves a complex decision-making process characterized by multiple criteria. The goal of the current study is to construct a decision framework by identifying a comprehensive set of consideration factors and their causal relationships. The consideration factors are deliberately drawn from a variety of different, yet related, theories and are grouped into an extensive Technology-Organization -Environment (TOE) framework. In accordance with the Decision Making Trial and Evaluation Laboratory (DEMATEL) method, the decision framework was analyzed for appropriateness through surveys of selected experts in the semiconductor industry. Because the semiconductor industry has a long history of heavy resource usage and has proven an early advocate of green supply chains, results from this study can provide insights to other firms with similar operations and aims. The contributions of this research are twofold. First, its theoretical contribution consists of integrating previously separate strands of different theories into a holistic framework and exploring the causal relationships among decision factors. Second, its practical contribution lies in its establishment of a strategic path that provides firms a set of priorities when adopting green supply chains.

1. Introduction

The growing global attention to environmental sustainability has led to increased interest in green practices as a key factor in achieving sustainable development targets [1]. Most green solutions reflect traditional “end-of-pipe” solutions in which a firm tries to reduce its existing adverse environmental impacts rather than adopting proactive approaches to reducing sources of waste or pollution [2]. Focusing solely on issues within the boundary of a firm often exposes the firm to negative spillover effects from the poor environmental performance of its supply chain partners [3]. In an attempt to reduce sources of waste and pollution throughout the entire supply chain, firms have begun to adopt an externally-oriented approach to extend their green initiatives beyond their organizational frontiers. This extended responsibility comprises multiple organizations, both upstream and downstream [4]. Introducing a green supply chain early in the production process, rather than adopting an end-of-pipe control option during later stages, can improve the technical and economic performance of an entire industrial value chain [5,6].
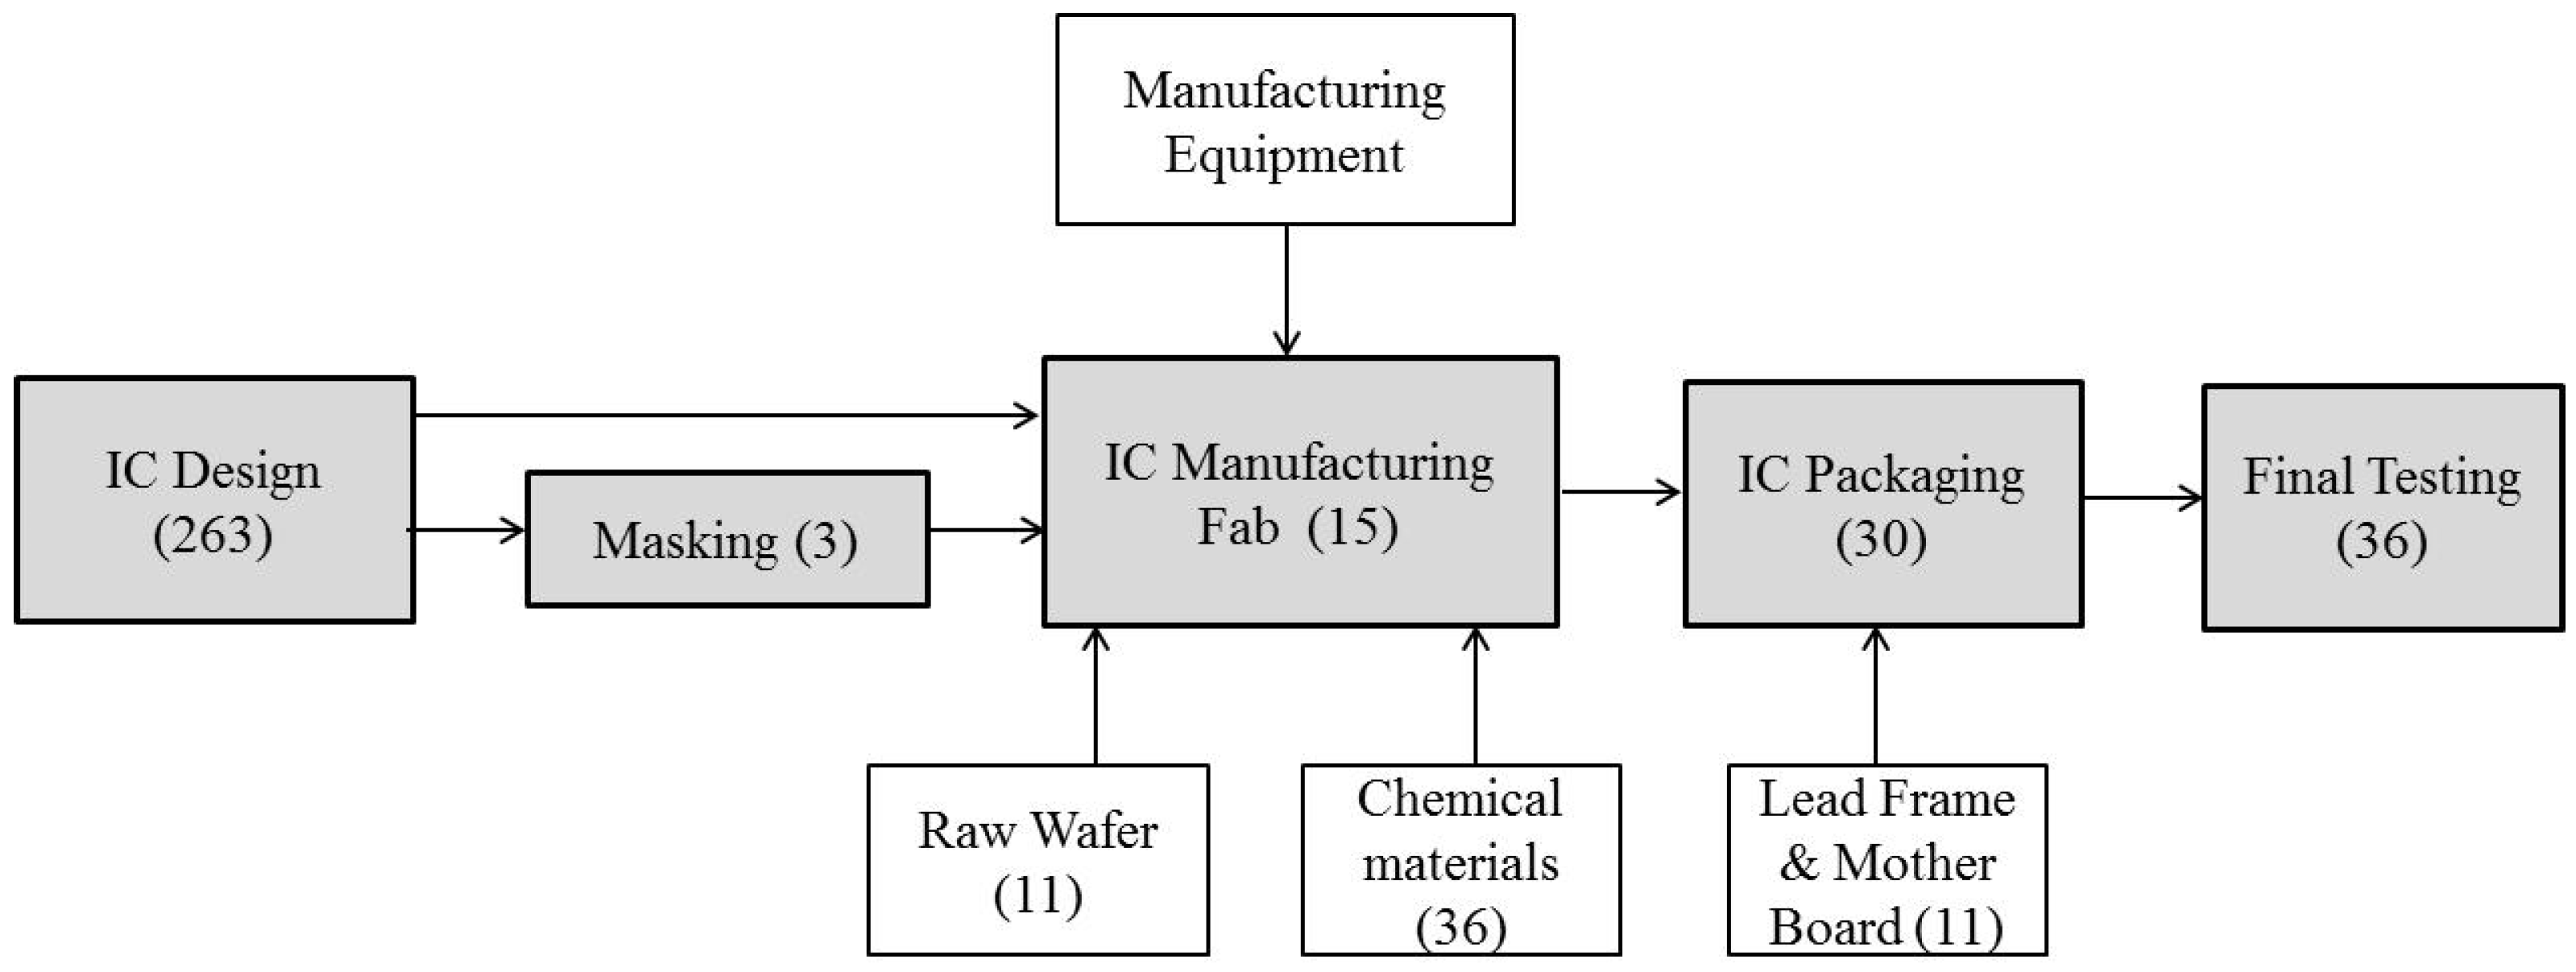
The semiconductor industry is an important one for the study of green supply chains, as it has a long history of heavy resource usage and environmental challenges. Additionally, the semiconductor industry has a unique vertically disintegrated structure that consists of many firms specializing in a narrow range of the supply chain, such as semiconductor Integrated Circuit (IC) design and semiconductor manufacturing, packaging, and testing [7]. A substantial body of research has investigated the life cycle impacts of semiconductors, including the impacts of raw material production, manufacture, use, and disposal [8]. The semiconductor industry uses large amounts of toxic chemicals to manufacture the components used by electric and electronic devices. Many of these chemicals are known to be harmful to the environment and human health. Over the past several years, the industry has created a group with the sole mission of improving environmental sustainability. Most prior studies of green manufacturing practices have often taken their sample data from a number of different industries [9,10,11], regardless of the industries’ characteristics or special requirements. However, environmental practices tend to be industry-specific [12,13,14]. This paper focuses on the semiconductor industry—a less researched industry, but one that plays an important role with respect to environmentally sustainable manufacturing practices. As the semiconductor industry is an early environmental mover within the entire electronics industry [15], results from a study such as this can provide insights for the rest of the electronics industry when considering the adoption of the green supply chain.
In the literature related to green practices, researchers address a number of reasons why organizations eventually adopt such practices [16,17,18,19,20,21,22]. Most studies address the topic only within organizational and/or external environmental contexts; few do so from a technological perspective [23,24]. Because applying environmental criteria to corporate operations requires exploring new resource combinations, deploying existing resources in new ways, and implementing or modifying processes, techniques, and systems, green supply chain adoption can be regarded as a technical innovation process [25,26]. A theoretical model for innovation adoption needs to consider factors that are rooted in the specific technological, organizational, and environmental contexts of firms [27]. To move beyond the limitations of current research, this study adopts the Technology-Organization -Environment (TOE) framework [28] and adapts it to the adoption of green supply chains; in doing so, it offers a holistic view of and conceptual guidelines for exploring the determinants of green supply chain adoption in the context of the semiconductor industry.
The adoption of green supply chain is a complex decision-making process involving multiple criteria from various perspectives [29,30]. In light of the TOE framework and related theories, we develop a decision framework that comprises a comprehensive set of key consideration factors concerning the green supply chain adoption. One of the Multi-Criteria Decision-Making (MCDM) methods, the Decision Making Trial and Evaluation Laboratory (DEMATEL) is used to test the proposed decision framework by examining the semiconductor industry supply chain in Taiwan. Based on a survey of experts, the DEMATEL method enables the analysis of cause-and-effect relationships among various consideration factors.
In summary, the objectives of this study are as follows:
(1)
To construct a TOE-based decision framework that comprises a comprehensive set of decision factors relating to green supply chain adoption.
(2)
To explore the causal relationships among decision factors within the TOE decision framework.
The contributions of this research are twofold. First, its theoretical contribution consists of integrating previously separate strands of different, yet related, theories into a holistic framework and exploring the causal relationship among decision factors. Second, its practical contribution lies in its establishment of a strategic path that provides firms a set of priorities when adopting green supply chains.
The remainder of this paper is organized as follows. Section 2 reviews the literature relating to green supply chains, the TOE framework, and theories concerning technological, organizational, and environmental factors. Section 3 introduces the research method. Section 4 presents the empirical study results. Section 5 discusses the research results and their implications. Finally, Section 6 highlights the findings of the research, considers its contributions and limitations, and offers suggestions for future studies.

2. Literature Review and Theoretical Background

This literature review aims to provide a clear background for green supply chains and a solid research framework for a decision model of green supply chain adoption. The review begins by considering the definition and scope of green supply chains and the theoretical underpinnings of the TOE framework. Subsequently, a comprehensive set of decision factors drawn from different, yet related, theories is explored; these factors situate the decision model in terms of technology, organization and environment. 
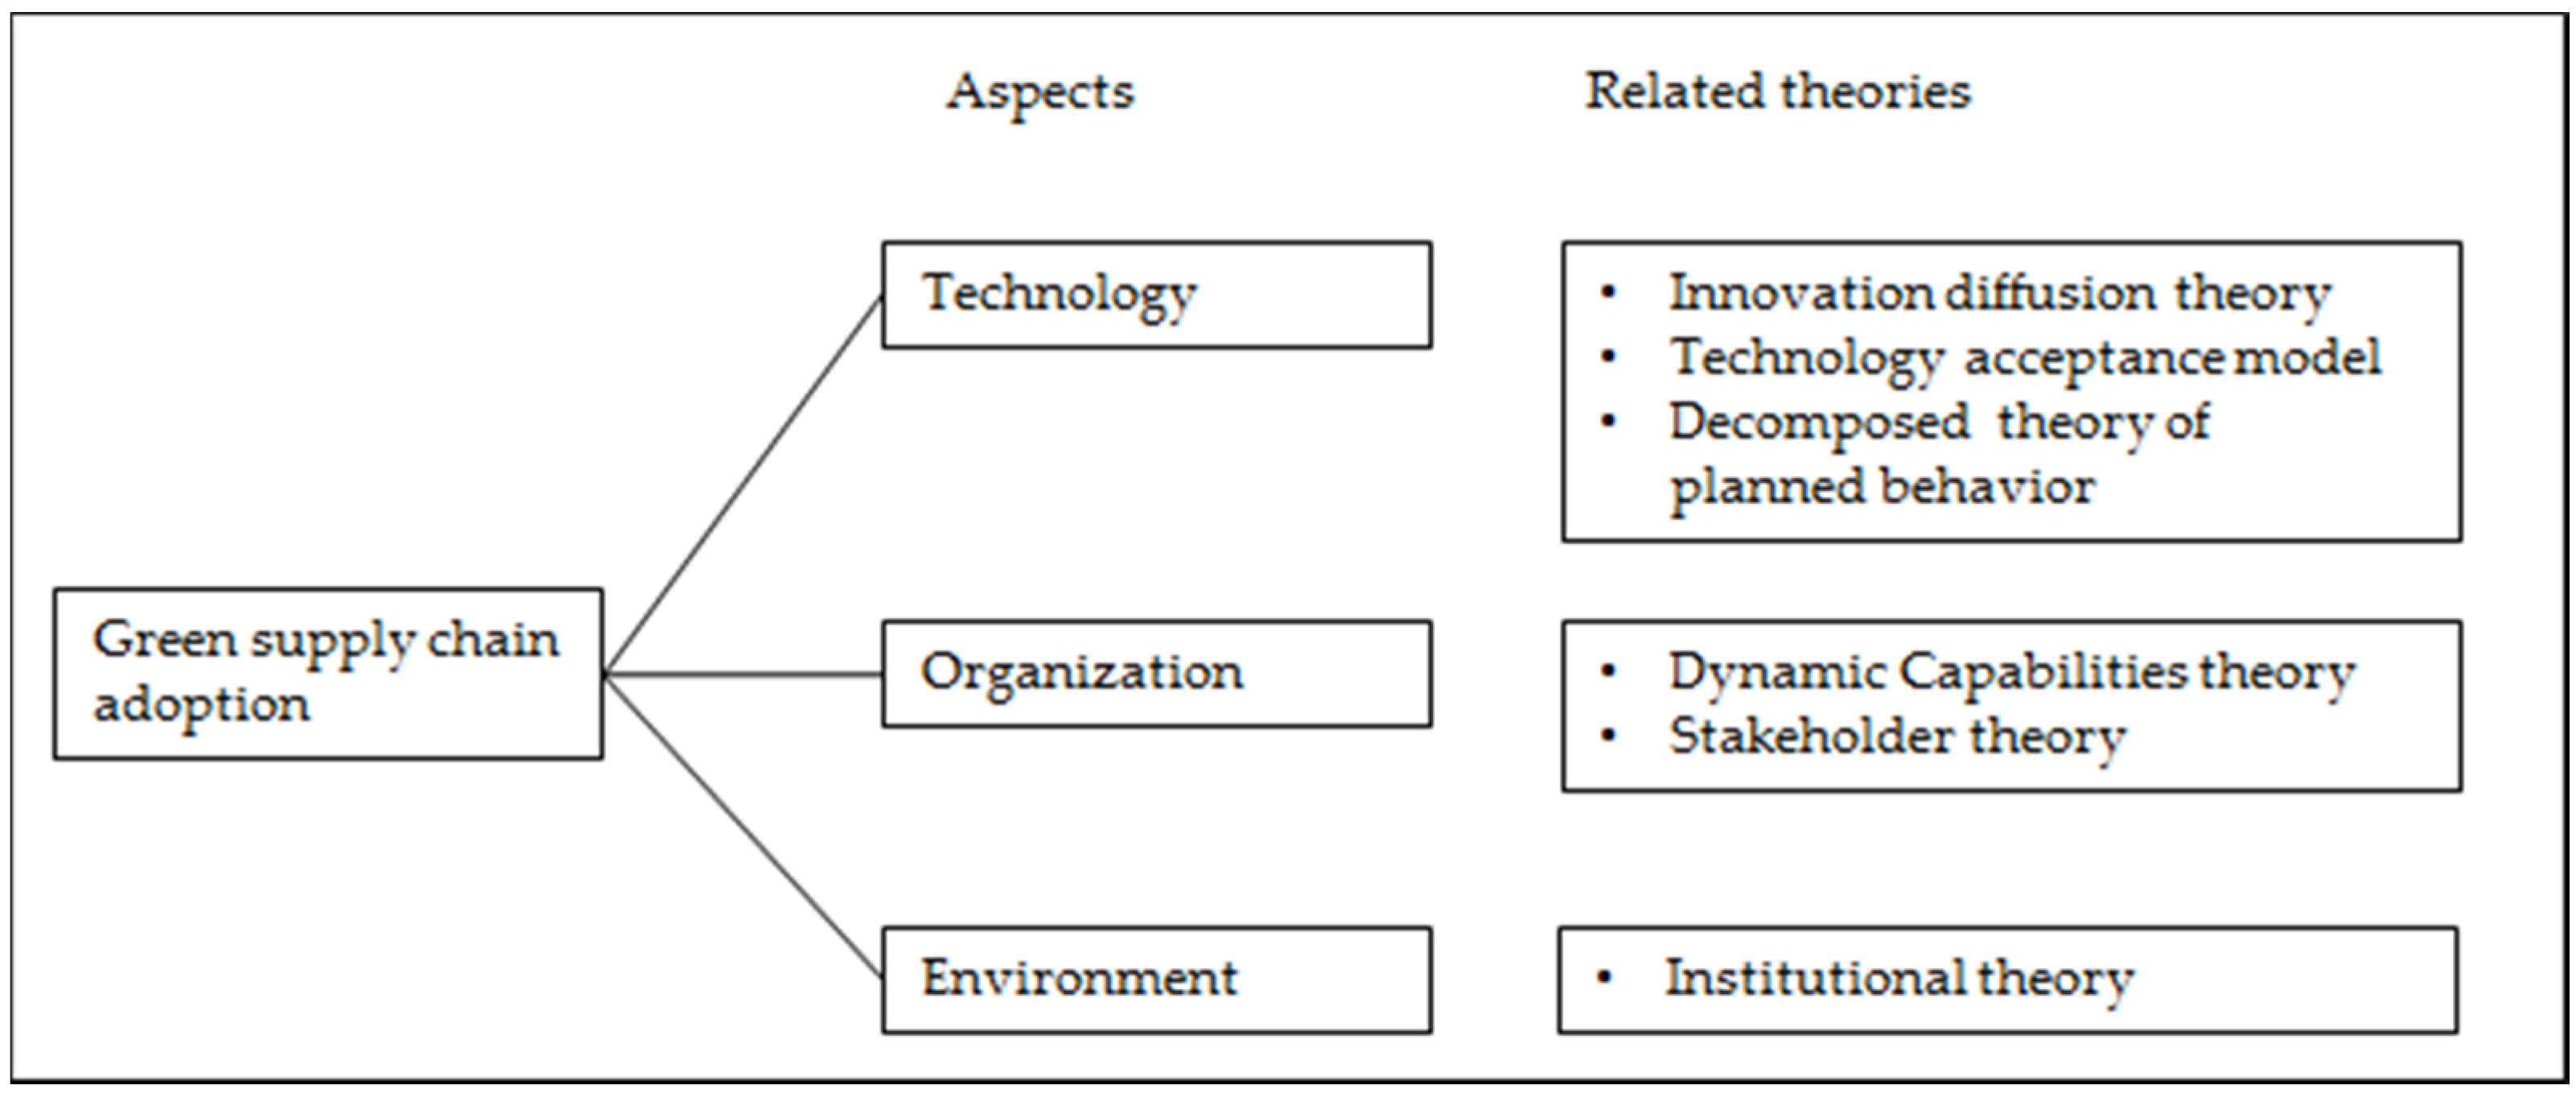
Figure 1 provides an overview of the TOE framework and related theories that will be discussed in this section.
Figure 1. Decision framework and related theories.
Sustainability 08 00168 g001

2.1. Green Supply Chain

A supply chain is a set of business entities that is directly involved in the upstream or downstream flows of products, services, and information from a source to a customer. From the standpoint of environmental sustainability, the customer is located at the end of the supply chain, while the chain itself reflects a linear production paradigm that assumes constant inputs of natural resources and an unlimited capacity to assimilate waste [31]. Unlike traditional supply chain models, a green supply chain considers the environmental impacts of the production process as goods flow through the chain. In this sense, a green supply chain can be considered an innovation that extends the traditional supply chain to include activities that aim at minimizing the environmental impacts of a product throughout its life cycle; such activities include green design, resource saving, harmful material reduction, and product recycling [2]. Firms embracing green supply chains attempt to “close the loop” by reusing, remanufacturing, and recycling products and materials through the systemic coordination of individual firms and their value networks [32].
The environmental and social aspects of sustainability can extend beyond an organization’s boundary by incorporating the activities of its partners along the supply chain. When coupled with economic objectives to develop a clear, long-term strategy, the inclusion of supply chain management activities in a firm’s sustainability plan can actually encourage a longer-lasting and less imitable set of processes [5]. In consequence, the benefits of adopting a green supply chain can be financial (e.g., cost reduction), physical (e.g., input and/or discharge reduction), legal (e.g., lowering emissions to avoid the need for an environmental permit), and personnel-related (e.g., fewer injuries) [33]. However, successfully adopting a green supply chain is no easy task [34]. The inherent complexity of environmental issues—their multiple stakeholders, the uncertain implications of competitiveness, and diverse socio-economic conditions—presents a significant challenge to firms. Green supply chains involve a number of closely related decision factors and constraints that affect the environmental performance of the entire supply chain; such factors and constraints may include designing and fabricating products, developing new manufacturing processes, and retrofitting existing ones [35]. In other words, forming the drivers of green supply chain adoption is a multidimensional concept that measures the extent to which a set of motivators encourage firms to improve their environmental performances [2]. The need for painting a holistic picture of the green supply chain adoption process can therefore not be underestimated.

2.2. The TOE Framework

The TOE framework identifies three context groups (technological, organizational, and environmental) that may influence organizational adoption of an innovation. The technological context refers to technological attributes relevant to the innovation in question. The organizational context refers to characteristics of the firm, including its size, its resources, and the complexity of its managerial structure. The environmental context refers to the arena in which a firm conducts its business; the arena in question may include the firm’s belonging industry, its customers, its competitors, and the government. The TOE framework, as originally presented in IT adoption studies [36,37,38], provides a useful analytical model that can be used for studying the adoption of different types of innovations. The TOE framework has a solid theoretical basis and consistent empirical support, though specific factors identified within the three contexts may vary across different studies [39]. For instance, Zhu and Kraemer [37] considered the TOE as the important antecedents to understand the diffusion of e-business, while Wang et al. [40] proposed a TOE-based model for understanding RFID adoption in manufacturing firms that wished to increase supply chain visibility and improve process efficiency. Finally, Weng and Lin [25] employed the TOE framework to analyze the determinants that influenced the adoption of green practices by small-and medium-sized companies.
To construct this study’s TOE framework on solid theoretical ground, the consideration factors selected for the decision framework were deliberately drawn from a set of related theories. Those theories are described in the following sections.

2.3. Technological Context

The technological context established in this study has its origins in Innovation Diffusion Theory (IDT) [41], the Technology Acceptance Model (TAM) [42], and the Decomposed Theory of Planned Behavior (DTPB) [43]. All three innovation adoption theories have been validated by a large number of studies in both organizational and individual settings [44,45,46]. The IDT proposes five perceived attributes of an innovation that influence its adoption: relative advantage, compatibility, complexity, trialability, and observability. However, empirical studies have indicated that, of these five attributes, only relative advantage, compatibility, and complexity are consistently related to adoption or utilization decisions [47,48,49,50]. The TAM is an information systems theory that models how users accept and use a technology. The model suggests that behavioral intention is determined by two specific characteristics of an innovation: perceived usefulness and perceived ease of use. Moore and Benbasat [51] and Fichman [52] noted that the TAM’s perceived usefulness and perceived ease categories are conceptually similar to IDT’s relative advantage and complexity, respectively. Perceived usefulness and relative advantage both encapsulate the degree to which an adopter perceives the use of the target technology to be advantageous over the current practice. Perceived ease of use is, in essence, the opposite of complexity. Extending the scope of the TAM, Taylor and Todd [43] proposed the model of Decomposed Theory of Planned Behavior (DTPB), which focuses exclusively on the study of technology adoption. The DTPB framework further includes the compatibility of a technology as one of the key characteristics and likens the importance of technological compatibility to that of perceived ease of use in the TAM. In the business organizational context, compatibility must be established between the general structure of an organization and the new technological system. Moreover, compatibility is obtained through the existing organizational operation system and through previous experience in the field of technology [53,54,55].
Relying on the innovation theories discussed above, the current research draws on three of the aforementioned key attributes of innovation in order to identify the technological factors that affect a firm’s decision to adopt a green supply chain. The attributes in question are relative advantage (usefulness), complexity (ease of use), and compatibility.

2.3.1. Relative Advantage

Relative advantage captures the extent to which a potential adopter views an innovation as offering an advantage over previous ways of performing the same task. The perceived advantages can be measured in economic or social terms such as performance, satisfaction, reputation, and convenience [41].
Traditionally, the relationship between the economy and the environment has been thought of in terms of a stark tradeoff. However, a growing body of empirical research has suggested that the adoption of a green supply chain enables firms to overcome the need for ‘either-or’ decisions [56,57]. Green supply chain initiatives, such as reductions in the use of natural resources, reductions in the amount of solid waste, and the recycling of production materials, can result in significant savings in manufacturing costs. In consequence, theoretical and case studies suggest that green supply chains are related to one of the traditional competitive manufacturing outcomes—cost [13]. This positive effect follows classical economic theory by assuming that firms act to reduce their costs, potentially leading to competitive advantages and higher profits [58]. This cost-saving effect, as well as the potential for improved resource productivity and the competitiveness of firms, should lead to the increased adoption of green supply chains.
Corporate decisions to adopt green supply chains are part of broader strategies to improve a firm’s overall business performance and environmental outcomes [59]. Adopting a green supply chain can allow a firm to preempt its competitors with respect to establishing a reputation as a “green” company; by cultivating such a reputation, firms may also develop other relative advantages [13]. Empirical studies have confirmed a positive and significant relationship between the adoption of green supply chains and company reputation [60]. Moreover, going green in manufacturing will improve the quality of the production process, which will in turn impact product quality and attract the growing number of customers looking for green products [61]. In sum, a green supply chain leads to reduced raw material costs, lower levels of pollution, production efficiency gains, better product quality, and improved corporate image.

2.3.2. Complexity

Complexity is the degree to which an innovation is perceived as relatively difficult to understand and use [41]. Liu et al. [62] defined complexity as “whether [an] innovation could be easily assimilated or not.” It has been suggested that the complexity of an innovation and the processes involved in its implementation negatively influence its adoption [63].
Studies on green supply chains have reported that the reduced complexity of adopting green practices influences firms’ adoption intentions [64,65,66]. Green supply chains are characterized by higher levels of complexity than individual green innovations [67]. The higher level of complexity can be explained by the fact that green supply chains need to consider multiple supply chain members and to address the environmental impact caused by upstream and downstream partners during the different phases of product life cycle [33]. Moreover, green supply chain contains certain tacit knowledge that is inherent in identifying sources of pollution, reacting to accidental spills, and proposing preventive solutions [68]. An innovation containing various forms of tacit knowledge requires laborious efforts to learn [28]. Complexity is therefore a fundamental issue in the adoption of the green supply chain, as such supply chain integrates and combines heterogeneous technologies and require profound knowledge resources. More specifically, the complexity of adopting a green supply chain involves both environmental issues and the many ways they can be managed (pollution prevention, waste handling, and emission cleaning) [67]. Because a green supply chain requires the integration of multiple competencies and capabilities, it often necessitates the performance of several functions simultaneously and the application of different strategies at different phases of the product/process life cycle. The complexity of a green supply chain makes it difficult to learn and adopt within a firm.

2.3.3. Compatibility

Compatibility is the degree to which an innovation is perceived as consistent with existing values, past experience, and the needs of potential adopters [41]. Liu et al. [62] contended that an innovation diffuses more freely and easily where such innovation appears to match the adopter’s existing processes. Delone and McLean [69] suggested that the compatibility of a system must be considered for the system to be implemented in an organization.
Literature on green supply chains has found that compatibility significantly influences the use intentions of potential adopters [70]. Because some green supply chain practices are additions to firms’ current technologies and processes, adopting such supply chain is not a single event but can be described as a process of knowledge accumulation and integration [23]. A green supply chain will be more easily adopted by a firm when the practices are more compatible with the firm’s current practices. Fit between previous experiences and environmental actions may generate greater environmental effectiveness [18]. In a study of the adoption of energy conservation initiatives in the utility manufacturing industry, Völlink et al. [66] contended that a green initiative that is an addition to existing practices is more likely to be adopted if (1) it is very consistent with the firm’s environmental objectives; (2) it is highly compatible with the firm’s ideas about successful strategies for stimulating environmental sustainability; and (3) it is compatible with other green initiatives that are already being implemented.

2.4. Organizational Context

The organizational context established in this study has its origins in the theory of Dynamic Capabilities [71] and Stakeholder theory [72]. These theories indicate that organizational factors matter significantly in firms’ adoption of organizational innovations [71]. The theories also suggest that organizations vary in their internal resource bases and procedures, which in turn affect their ability to respond to internal and external challenges and their overall performance. The determining factors of organizational context are organizational resources and assets, organizational internal stakeholders, and organizational procedures of fostering innovative business practices. These factors affect whether organizations have, recognize, and can seize innovation to improve their competitive advantages [33].
Grounded in Dynamic Capabilities and Stakeholder theories, the current study focuses on the organizational factors mentioned above. Organizational resources are the overall level of resources and specialized environmental resources and capacities possessed by firms. Internal stakeholders are the individuals and groups who have decision-making power in a firm or the ability to influence the business performance of a firm. Organizational innovativeness refers to firms′ previous commitment to and track record in implementing advanced organizational practices.

2.4.1. Organizational Resources

Organizational resources are the capabilities that an organization possesses for future needs or dynamic changes. These resources relate to the overall infrastructure of the organization and how well that infrastructure can support innovation [73]. In the context of green supply chains, the resources dedicated to environmental sustainability are critical, as the entire supply chain calls for specialized types of expertise and capabilities. From the standpoint of organizational operation, a firm’s ability to absorb the immediate costs of adopting a green supply chain is not just a function of the absolute incremental costs involved but also a function of relative costs, including the cost of the time needed to research environmental issues, to consult with internal and external sources of expertise, and to develop options for addressing the issue [74]. Because of the complex technical and legal ramifications of many environmental issues, both time and financial expenditures can be considerable. Among other things, environmental resources encompass the size of labor forces and sales, spending on research and development, and the size of the companies of which they are a part [23]. These resources provide the embedded capacity which enable firms to respond to external stimuli and implement environmental innovations. In effect, these resources create the opportunity space from which individual firms and working partners can experiment with and implement advanced environmental practices [75].

2.4.2. Organizational Innovativeness

Organizational innovations are conceived as an interrelated bundle of systems of practices (e.g., self-directed work teams, worker rotation, total quality management, and continuous process improvement) that helps a firm continuously uphold its innovation activities to meet market dynamics [33]. Innovation usually follows an established trajectory; thus, an organization with rich experiences in the application or adoption of related innovative initiatives will have a greater ability to lead innovation advancement [76]. In a comparative examination of environmental policy in Europe, the United States, and Japan, Wallace [77] concluded that a firm’s pursuit of innovation in environmental products and processes creates substantial opportunities for pollution prevention and waste reduction. Florida et al. [33] and Atlas and Florida [78] also contended that firms that are always searching for, evaluating, and implementing innovations find it relatively easy to include environmental considerations into their product designs and manufacturing processes. That is, the more that firms practice continuous innovation, the more opportunity they have, and thus the more likely they are, to adopt green initiatives.

2.4.3. Internal Stakeholders

According to Stakeholder theory [72], internal stakeholders can be divided into individuals or groups affecting a firm’s decisions. Internal stakeholders include managers, shareholders, and employees. In general, they play an important role in corporate environmental policy and are widely involved in research on environmental issues [18,79].
Much research reveals the positive relationship between a firm’s internal stakeholders and its environmental activities [80,81]. In a study on the adoption of green initiatives, Yunus et al. [82] concluded that management support is the primary factor for successful green practice adoption. Many green practices require the collaboration and coordination of different departments and divisions during the process of adoption [67]. In order to ensure successful adoption, green initiatives are usually endorsed and encouraged by managers. The central task of managers is to acquire resources and allocate them efficiently so that the firm is able to achieve its environmental goals [19]. Additionally, managers’ support can help an organization to defeat prejudice, stereotypes, and negative feelings by legitimizing diversity within an organization’s society [83].
Individual and institutional shareholders can express their concern about corporate environmental strategy and behaviors through investment decisions [84]. Because the green supply chain is a strategy for both environmental sustainability and business success, firms can leverage the adoption of a green supply chain to indicate their intent to be environmentally friendly. A study confirms that that green certification (e.g., ISO 14001) has a positive effect on firms’ stock prices [85]. If shareholders concur with the positive relationship between economic performance and environmental initiatives [86,87], they will further support the firms’ environmental endeavors.
Employees are the source of a company’s success, and successful environmental policy planning requires their active participation [88]. Previous studies have indicated that the level of environmental awareness among employees and their willingness to get involved are essential to the success of green initiatives [89,90]. Therefore, firms are more likely to engage in environmental practices when their employees’ personal values align with corporate commitments to environmental responsibility.

2.5. Environmental Context

Institutional theory concerns firms’ responses to institutional pressures within their operating environments [91] and assumes that firms commonly make normatively rational choices based on historical precedent and social justification [92]. Institutions constrain firms’ behavior by defining legal, moral, and cultural boundaries and thus setting legitimate behaviors and practices apart from illegitimate ones. Institutional constraints can be regulative (coerced through rules, laws, and sanctions), normative (prescriptively imposed through codes of conduct, accreditation, or certification), or cultural-cognitive (mimetic common beliefs and logic of action) [91]. Firms that conform to institutional demands or requirements are rewarded by increased legitimacy, stability, reduced uncertainty, and strengthened survival capabilities [91,93].
The literature has supported the use of Institutional theory understanding the drivers of green practice adoption [94,95]. In general, studies have increasingly agreed that the external pressures conceived by institutional theory play a significant role in determining the adoption of green practices [16,96,97]. This study draws four constructs from prior studies based on Institutional theory. The first of these is that government regulation is a form of coercive regulatory isomorphism, as governments use rules, laws, persuasion, and pressure to encourage compliance. The second constrcut is that customer pressure is a form of normative isomorphism based on expectations that firms should be cognizant of feedback from customers in their operations. The third and the fourth constrcuts are the pressures from competitors and social communities, they are a type of mimetic cultural-cognitive isomorphism that reflects the rational desire to embrace initiatives that have proven valuable to others.

2.5.1. Government Regulation

Coercive pressures, such as threats or legal sanctions, can force firms to pursue specific behaviors [98]. In the environmental context, the role of governmental pressure is so strong that threats of new environmental regulations or the explicit governmental support of sustainable practices are significant incentives for firms to participate in sustainability initiatives. These official mechanisms take the form of standards, laws, procedures, and incentives set by regulatory institutions to inspire firms to become environmentally responsible. Porter and van der Linde [58] have argued that firms engage in green practices as a way of responding to increasingly stringent and comprehensive environmental regulation. According to their research, firms react creatively, and at times reevaluate their entire approach to operations, in order to respond to government regulations in a cost-effective manner [78]. Such creative reactions can lead firms to incorporate green practices in manufacturing planning and processes and to insist that their upstream and downstream partners take similar measures; these across-the-board strategies for green practice implementation make it considerably more difficult for one firm to jeopardize the environmental and economic performance of the entire supply chain. Well-known legislative efforts to influence electronics production globally include the following: Restriction of the Use of Certain Hazardous Substances (RoHS), which regulates the use of toxic substances; Waste Electronics and Electrical Equipment (WEEE), which sets collection, recycling, and recovery targets for electrical goods; and the ISO 14000 series, which promotes more effective and efficient environmental management for gathering, interpreting, and communicating environmentally relevant information within organizations. In 2006, Taiwan’s Environmental Protection Administration (EPA) enforced similar acts. These international and domestic measures have regulated electronics and electrical manufacturing companies and forced them to comply with environmental standards. Those companies that fail to comply with the regulations incur sanctions, including the prohibition of importing and fabricating products until there has been demonstrated improvement of environmental performance.

2.5.2. Customer

Institutional theory holds that normative pressures cause firms to pursue legitimacy and trustworthiness [99]. Such pressures are exerted by external stakeholders, including customers who have a vested interest in the firm [100]. The green supply chain differs from stand-alone green initiatives in that it requires customer cooperation. To deal with uncertainty, firms adopting green supply chains create inter-organizational links that enable them to have long-term, mutually beneficial relationships with their customers. A growing body of studies also indicates that pressures from consumers force firms to adopt green practices [2,101,102]. The closest bonds between firms and their customers are often most evident in manufacturing, since tighter relations can facilitate cleaner production and are needed to incorporate management strategies, including JIT (just in time), continuous improvement, and total quality management [103]. To meet environmental challenges in an economically and environmentally sustainable way, a firm and its customers may form partnerships that allow them to find solutions for current issues and to seek innovations for future benefits [104]. Within the semiconductor manufacturing industry, for instance, a large number of Original Equipment Manufacturing (OEM) companies are organized according to outsourcing models; customers thus remain critically dependent on their suppliers to promptly deliver goods of the needed quality. As a result of increased outsourcing, companies have become more sensitive to the performance of their suppliers, including their environmental performance. It is quite common for multinational companies to ask their suppliers to implement RoHS, WEEE, and/or the ISO 14000 series, as these standards have become a widespread tool for encouraging environmentally sound practices.

2.5.3. Competitor

According to Institutional theory, firms seek to accrue prestige by imitating those they perceive as successful [105]. Such mimetic isomorphism occurs in all competing firms within an industry. Firms may follow or mimic competitors merely because of competitors’ success in operations and manufacturing. The rationale behind such mimicry is simple to understand: by imitating the actions of successful competitors, firms strive to become equally successful [59]. Some studies have shown that competitive factors play a large role in determining corporate responses to environmental issues [106]. Those firms that see their competitors succeed by attending to environmental issues often begin to attend to such issues as well. Moreover, similar firms within a specific industry become aware of each other’s environmental practices and use that awareness to assess and compete with other firms. Global competition has further encouraged the switch to green supply chains [2,59]. Firms working with leading global corporations have been forced to evaluate not only their immediate suppliers but also their second- and third-tier ones; without doing this, they face the likelihood of being replaced by competitors with better environmental performances.

2.5.4. Social Community

Within Institutional theory, cultural-cognitive isomorphism is held to occur as a result of a firm’s rational desire to engage in behaviors that it perceives as valuable. A firm may feel a voluntary obligation to society based on social expectations, norms, and codes of conduct [107]. A firm’s social community includes environmental organizations, community groups, and other special interest groups. In the past, firms were less likely to be influenced by the social community, which they either considered a nuisance or ignored [108]. As public concern about environmental sustainability has increased, however, firms can no longer ignore the social community, which can directly or indirectly influence their environmental strategies by mobilizing public sentiment in favor of or against firms’ environmental approaches [109]. Research has shown that social responsibility plays a significant role in encouraging firms to adopt green practices [81,110]. Firms often adopt those practices that enable them to establish a socially acceptable image consistent with the obligations and values of the society in which they function.
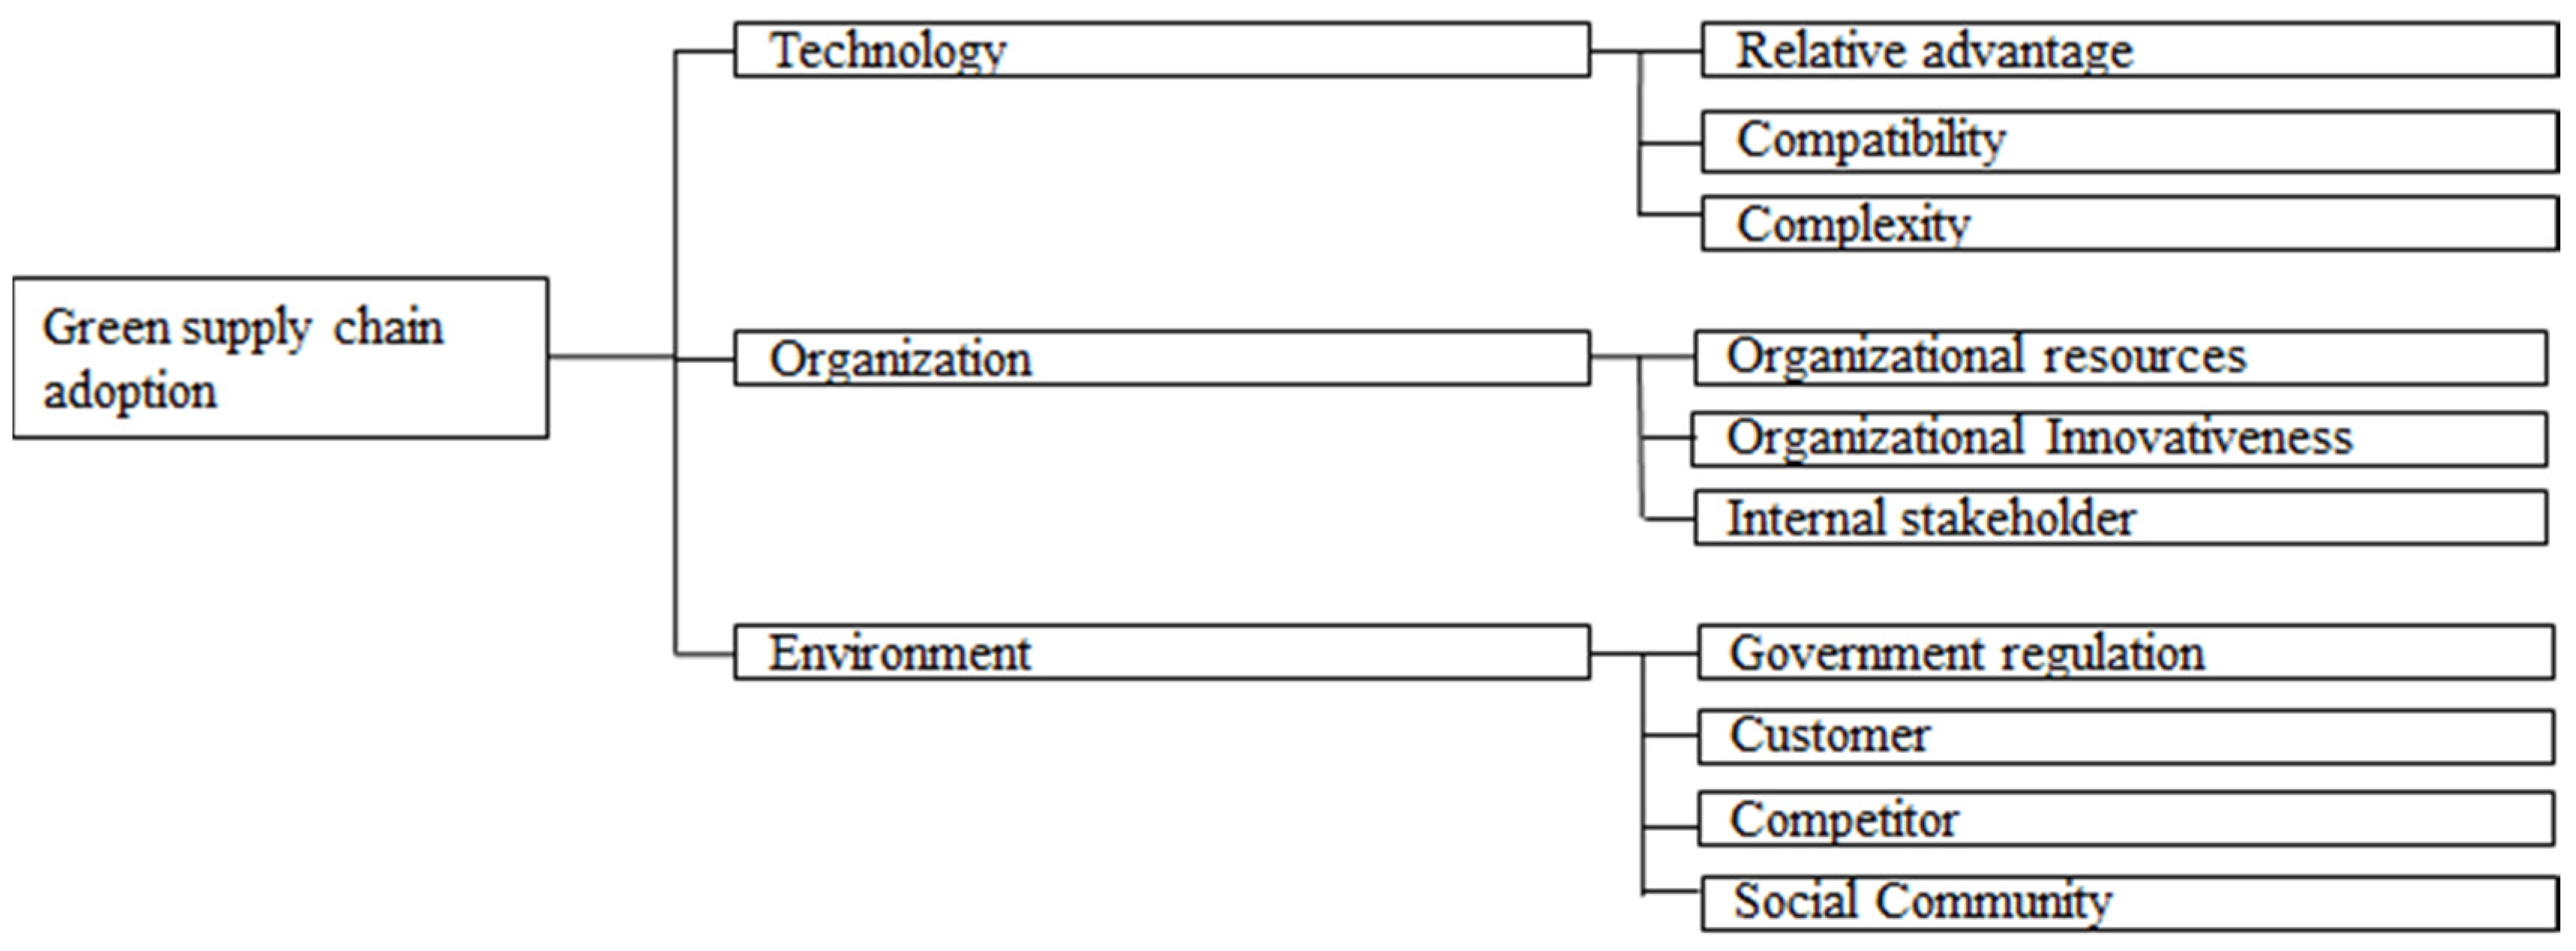
Table 1 groups previously discussed consideration factors according to their place within the contexts of the TOE framework; the table also includes definitions of consideration factors. A graphical representation of the proposed decision framework is given in Figure 2.
Table 1. Green Supply Chain Adoption Consideration Factors.
AspectsFactorsDefinitions
TechnologyRelative advantageThe extent to which a potential adopter views the innovation as offering an advantage over previous ways of performing the same task.
CompatibilityThe degree to which an innovation is perceived as relatively difficult to understand and use.
ComplexityThe degree to which an innovation is perceived as consistent with existing values, past experience, and the needs of potential adopters
OrganizationOrganizational resourcesThe capabilities that an organization possesses for future needs or dynamic changes.
Organizational innovativenessThe interrelated bundle of systems of practices which helps a firm continuously uphold its innovation activities to meet market dynamics.
Internal stakeholderManagers, shareholders, and employees who affect a firm’s decisions.
EnvironmentGovernment regulationOfficial mechanisms (e.g., standards, laws, procedures, and incentives) that are determined by regulatory institutions and that require individual or organizational compliance.
CustomerClients whose response to corporate practices affects firms’ decisions to adopt sounder environmental policies. Customers tend to prefer firms with strong environmental performance and market success.
CompetitorOther firms within the same industry whose economic and environmental success encourages imitation.
Social CommunityEnvironmental organizations, community groups, and other special interest groups that can influence a firm’s environmental policy.
Figure 2. Proposed decision framework.
Sustainability 08 00168 g002

3. Research Method and Setting

3.1. Research Method: DEMATEL

The DEMATEL method, which originated at the Geneva Research Centre of the Battelle Memorial Institute [111], has typically served to address the question of whether solving one problem can help solve another. The aim of the method is to identify direct and indirect causation and the strength of influence across consideration factors by applying matrix computations and by comparing the interrelations among the consideration factors. The DEMATEL method can convert complex systems into a clear causal structure; as a result, it assists in locating core issues and quantifies their causality and influence strength [112]. The DEMATEL technique can be applied in areas including, but not limited to, technology innovation, IT site selection, urban planning and design, operation research, and regional environmental assessment [113,114,115]. Unlike the classical approach of structural equation modeling (SEM), which requires a large research sample size for deriving causal relationships among variables, the “expert opinion”-driven DEMATEL method can yield good research results from a relatively small sample size [116]. Because the current study concentrates on the adoption of green supply chains in the semiconductor industry, survey respondents needed to possess both a good understanding of environmental sustainability and a background in supply chain management. The available research sample size of those with such qualifications was understandably limited. As such, the characteristics and applicability of the DEMATEL described herein clearly suit the research goal of this study. The steps involved in the method are as follows:
Step 1: Build an initial direct-relation matrix
Experts are asked to indicate the direct influence degree of direct influence each factor i exerts on each factor j , as indicated by a i j , using an integer scale ranging from 1 to 5 (going from “very low or no influence (1)”, to “very high influence (5)”). The initial direct-relation matrix is obtained by pairwise comparisons, in terms of influences and directions between the criteria, in which a i j is denoted as the degree to which the i t h criteria affects the j t h criteria.
A = [ a 11 a 1 j a 1 n a i 1 a i j a i n a n 1 a n j a n n ]
Step 2: Normalize the direct-relation matrix
The normalized direct-relation matrix N is obtained through Equations (2) and (3), in which all principal diagonal elements are equal to zero.
N = y × A
y = min i , j [ 1 max 1 i n j = 1 n z i j , 1 max 1 j n i = 1 n z i j ]
Step 3: Attain a total relation matrix T
The total-relation matrix T is acquired by Equation (4), where I stands for the identity matrix.
T = N ( I N ) 1
Step 4: Calculate the influence strength of the factors
Aggregate the values of the rows and columns in matrix T to obtain a value r i and c i through the Equations (5) and (6) respectively. The r i represents the level of direct or indirect impacts on other factor, and c i represents the level to which it is affected by other factors:
r i = [ j = 1 n t i j ] n x 1 = [ t i ] n x 1
c i = [ j = 1 n t i j ] 1 x n t = [ t i ] n x 1
Step 5: Produce a causal diagram
A causal diagram can be acquired by mapping a data set ( r i + c i , r i c i ). The value of r i + c i indicates the strength of influence. Similarly, the value of r i c i indicates the causal relationship between factors. If r i c i is positive, then the factor is a “cause factor”, dispatching influence to the others. If r i c i is negative, the factor is an “effect factor”, receiving influence from others.

3.2. Research Setting: Semiconductor Industry in Taiwan

The semiconductor industry in Taiwan is currently the fourth largest in the world, behind only the USA, Japan, and Korea. According to available statistics, Taiwan has become the largest semiconductor foundry manufacturer, the second largest semiconductor designer, and the fourth largest semiconductor producer in the world. In contrast to the vertically integrated conglomerates dominating in Korea and Japan, Taiwan’s semiconductor industry has a unique vertically disintegrated structure that consists of many firms of different sizes specializing in a narrow range of functions, such as IC design, mask production, foundry manufacturing, packaging, and testing [7]. The semiconductor firms in Taiwan are organized as a value chain; they have a strong connection with each other and to global electronics markets. Figure 3 illustrates the major segments that constitute the semiconductor industry supply chain.
Figure 3. Semiconductor Supply Chain in Taiwan. Notes: the number shown in the box represents the number of companies
Sustainability 08 00168 g003
The semiconductor industry uses large amounts of toxic chemicals to manufacture the components used by electric and electronic devices. Many of these chemicals are known to be harmful to the environment and human health. Responding to growing global concerns about the environment, the semiconductor industry in Taiwan has adopted the green supply chain and achieved significant results.

4. Empirical Study

4.1. Data sample and research results

The decision framework developed in this study consists of two levels. The high level comprises three aspects: technology, organization and environment. The detailed level comprises ten consideration factors belonging to the three aspects. In line with the hierarchical decision framework, we conducted a survey in 2015 using a questionnaire that was designed to comply with the DEMATEL method. The DEMATEL-based questionnaire was distributed to 15 selected experts who had actively participated in green supply chain practices in the semiconductor industry. The surveyed experts were senior managers responsible for manufacturing process development, material management, and logistics operations. More specifically, the survey sample included 5 managers in upstream semiconductor design, 5 in midstream semiconductor manufacturing, and 5 in downstream semiconductor packing and testing. All experts had more than ten years of experience working in the semiconductor industry.
As the purpose of the study was to explore the decision factors and their causal relationships in green supply chain adoption, a fourth aspect, adoption, was added into the DEMATEL calculation as a new aspect. To measure the relationship between factors, we surveyed the experts about the consideration factors’ direct influence on each other by employing pairwise comparison questionnaires (See Appendix A for details). After averaging all the comparison scores, we obtained the initial direct-relation matrix A of the technology, organization, environment and adoption aspects (See Table 2). Based on the initial direct-relation matrix, we continuously normalized these numbers in matrix A by using Equations (2) and (3) to obtain the normalized direct-relation matrix N, as shown in Table 3. Subsequently, we calculated the total relations of the three aspects by using Equation (4). Table 4 presents the resulting matrix T. We then calculated the values “r” and “c,” listed in the right-hand column and the bottom row, respectively, of Table 4, by applying Equations (5) and (6) respectively. Table 5 summarizes the values of r+c (prominence, indicating the influence strength of a context) and r-c (relation, indicating the causal relationship between contexts). In similar fashion, we derived the matrix of the total relations of the factors in each of the three aspects, as presented in Table 6, Table 7 and Table 8 (please refer to Appendix B for details). Finally, applying Equations (5) and (6) again to the factors in the three aspects, we obtained their r+c and r-c values, as summarized in Table 9. A causal diagram can be acquired by mapping the data set (r+c , r-c). Based on the data set shown in Table 5, we obtained Figure 4a, which demonstrates the causal relationships among the aspects of technology, organization, environment and adoption. With the data set in Table 9, we obtained Figure 4b–d demonstrating the causal relationships among the factors within the aspects of environment, organization and technology, respectively.
Table 2. The initial direct-relation matrix (A).
AspectTechnologyOrganizationEnvironmentAdoption
Technology0.0003.0003.0003.182
Organization3.2730.0003.2733.636
Environment3.3633.3640.0004.818
Adoption3.0913.0913.7270.000
Table 3. The normalized direct-relation matrix (N).
AspectTechnologyOrganizationEnvironmentAdoption
Technology0.0000.2540.2540.269
Organization0.2770.0000.2770.308
Environment0.3080.2850.0000.408
Adoption0.2620.2620.3150.000
Table 4. Total relation matrix (T).
AspectTechnologyOrganizationEnvironmentAdoptionr value (row sum)
Technology1.3291.4761.5391.7096.053
Organization1.6591.3821.6671.8596.566
Environment1.8521.7711.6282.1157.366
Adoption1.6271.5681.6671.6006.462
c value (column sum)6.4676.1966.5007.282-
Table 5. ri + ci and ri ci values.
Aspectr + cr − c
Technology12.520–0.414
Organization12.7620.369
Environment13.8660.865
Adoption13.744–0.821
Table 6. Total relation matrix of factors in Technology.
FactorRelative AdvantageCompatibilityComplexityr value (row sum)
Relative Advantage3.6473.9723.74111.360
Compatibility4.4744.1824.27212.928
Complexity4.5554.6184.02513.198
c value (column sum)12.67612.77212.038
Table 7. Total relation matrix of factors in Organization.
FactorResourcesInnovativenessInternal stakeholderr value (row sum)
Resources3.8394.4324.01612.287
Innovativeness3.7173.6573.59510.969
Internal stakeholder4.2854.5433.80812.636
c value (column sum)11.84112.63211.419
Table 8. Total relation matrix of factors in Environment.
FactorGovernment regulationCustomerCompetetiorCommunityr value (row sum)
Government regulation4.3885.0294.9174.82019.154
Customer4.4204.5694.7134.61518.317
Competetior4.2024.5924.2544.40317.451
Community4.6895.0834.9494.62119.342
c value (column sum)17.69919.27318.83318.459
Table 9. ri + ci and ri ci values of factors within 3 aspects.
Factorsr + cr − c
Relative advantage24.035−1.315
Compatibility25.7000.155
Complexity25.2351.160
Resources24.1270.447
Innovativeness23.600−1.664
Internal stakeholder24.0551.217
Government regulation36.8541.454
Customer37.591−0.955
Competitor36.284−1.383
Social Community37.8020.884
Figure 4. Causal relationship diagram.
Sustainability 08 00168 g004

4.2. Result Test

As the goal of the current study was to establish a decision framework and explore the causal relationships among the decision factors, the survey respondents we chose were the key decision-makers in determining whether green supply chains should be adopted in their firms. As noted previously, the survey respondents needed to possess both a good understanding of environmental sustainability and a background in supply chain management. Because of the small number of qualified respondents, the “expert opinion”-driven DEMATEL method, which requires a limited number of respondents, was employed in the current study. Unlike the traditional statistical approaches that explore cause-and-effect relationship among variables normally require a minimum sample size of 200 to provide sufficient statistical strength for data analysis [117], the expert opinion-driven MCDM approaches, such as DEMATEL, require only a minimum sample size of six [118,119]. In most studies using the DEMATEL method, the average sample size ranged between 10–15 experts [115,118,120,121,122].
To further verify the research results of the current study, we applied the following equation [118,123] to test the significance (confidence) level of our research results.
( 1 n 2 i = 1 n j = 1 n | A ij p A ij p 1 | t ij p ) × 100 %
where 𝑛 denotes the number of criteria, 𝑝 denotes to the number of experts, and t ij p is the average influence of criterion 𝑖 on criterion 𝑗.
This equation was used to test the result variances among the surveyed experts. For the “expert opinion”-driven research method, the main issue relating to result validity is not the distribution of the sample size but rather the consensus of the expert opinions [123]. The general guideline in applying the equation is that the opinion variances among the surveyed experts should be less than 5%—that is, the significance (confidence) level should be greater than 95%. Applying the data sample to the equation, we used 15 as 𝑝 value (15 experts) and 3, 3, 4 as 𝑛 values (there exist 3, 3, and 4 factors within the aspects of technology, organization and environment, respectively). As a result, we obtained the variance values of 3.03%, 1.71% and 1.65%, respectively (See Appendix C for details). Because all variance values were less than 5%, the research results were deemed trustworthy.

5. Discussion and Implications

Understanding the determinants of green supply chain adoption is important. The sustainability goals of the green supply chain require closer interaction between all firms along the chain in order to ensure strong economic, environmental, and social performance throughout a product’s life cycle. In contrast to decisions about adopting individual, in-house green initiatives, the decision to adopt a green supply chain thus involves a broader set of factors. For this reason, we constructed a comprehensive decision framework that incorporated the aspects of technology, organization and environment. After the DEMATEL analysis, the research results indicated different influential strengths and causal effects among the determinants in the TOE framework.

5.1. Aspect Level

As shown in Figure 4a, our research results indicate that all three aspects influence green supply chain adoption. Existing research suggests that the adoption of green practices is determined by external environments and internal organization [90,91,108], but technological factors are rarely discussed [23,25]. Because applying green practices into a firm’s operations requires exploring new resource combinations and deploying existing resources in new ways, the green supply chain requires the implementation of green technologies to reduce environmental harms and installation of information technologies to integrate with upstream and downstream partners concurrently. Technological factors should therefore be taken into account when considering the adoption of green practices [26,124]. The findings of the current research provide further evidence that technology, no less than organization and environment, has a significant influence on green supply chain adoption.
The research results also reveal the causal relationship among the three aspects of technology, organization and environment. As demonstrated in Figure 4a, both environment and organization influence technology. Table 5 shows that environment has the highest rici value (0.865) and influences both technology and organization; environment also has the highest ri + ci value (13.866), which indicates that it has the strongest degree of influence among the three aspects. In other words, environment plays a more important role than organization and technology for firms within the Taiwanese semiconductor industry when they consider green supply chain adoption. That environment is the most relevant aspect affecting a firm’s decision to adopt innovations has been shown in prior research [125]. Environmental factors often refer to the frequent and unpredictable changes in customer preferences, government regulations, and perceived competitive behavior. Firms operating in dynamic business environments tend to be more proactive and use more innovative strategies than firms in less turbulent environments [126]. In terms of green innovation, multiple researchers [26,127] concur that pressures from the external environment strongly influence a firm’s environmental practice.
The causal relationship between the aspects of environment and organization lies in that external pressures from governments, social communities, customers and competitors act as triggers for a firm to foster the green supply chain [128]. Sharma and Vredenburg [129] argued that unique organizational capabilities emerge when firms proactively incorporate social and environmental issues into their corporate behaviors. The green supply chain crucially defines the status quo of what is feasible for individual firms and whole supply chains when they aim to develop sustainable strategies [130]. External pressures thus determine how firms respond to various environmental sustainability issues and whether they have, recognize, and can seize opportunities to improve their economic, environmental, and social performance [131].
The technological aspect of green supply chain relates to the technologies used to reduce the environmental impact caused by product manufacturing or logistics along the supply chain. Examples include using technologies to increase energy efficiency, reduce waste or greenhouse gas emissions, and minimize the consumption of non-renewable raw materials [132]. When applying these green technologies across the life cycle of a product within an industrial supply chain, a firm has to consider the cost performance of the new technologies, their compatibility with the present ones, and the complexity of integrating them with upstream and downstream partners. The technological aspect is complex in nature; however, compared to the environmental and organizational ones that influence corporate policy, determine strategic direction, and align various stakeholders to achieve the environmental, economic, and social goals of a firm, the technological aspect is best considered as a tactical one that is affected by the other two aspects. The current research indicates that only after an organization decides to take the initiative to adopt a green supply chain owing to external environmental pressures does it start to evaluate technological alternatives by considering their relative advantage, complexity, and compatibility.
Like many other industries, the semiconductor industry faces sustainability challenges as a result of external environmental factors. These factors take the form of laws, procedures, and incentives set by regulatory institutions and social communities. Two of the latest legislative efforts to influence semiconductor products are the European Restriction of the Use of Certain Hazardous Substances (RoHS), which regulates the use of toxic substances, and Waste Electronics and Electrical Equipment (WEEE), which sets collection, recycling, and recovery targets for electrical goods [133]. Given that most semiconductor companies in Taiwan export their goods to developed countries, they and their suppliers are often expected by their customers to be compliant with RoHS and WEEE. Depending on their different positions in the semiconductor supply chain, the firms need to comply with different regulations and take different technological approaches. For example, the semiconductor manufacturing companies consuming large amounts of toxic chemicals in the process of IC chip manufacturing must be concerned with every aspect of WEEE and RoHS; in contrast, semiconductor design companies that do not fabricate any physical goods need only comply with certain regulations defined in WEEE and RoHS. As a result of such legislative measures, semiconductor manufacturing companies need to invest more organizational resources in green initiatives to control their environmental impacts; they must also consider the technological aspects of adopted green initiatives in greater detail than semiconductor design companies.

5.2. Factor Level

5.2.1. Environmental Factors

As shown in Figure 4b, the research results of this study indicate that government regulation and social community are cause factors in the environmental aspect that influence the effect factors of customer and competitor.
The cause-and-effect relationship between government regulations and firms (represented as customer and competitor of a firm in the relation) is straightforward. As all industrialized countries regulate toxic wastes and emissions, sustainability practices have become standardized practices that firms must adopt to remain within the law. Sustainability (or green) practices are most prevalent in situations where government agencies have the direct power to enact laws and enforce firms’ responses [134,135]. Since firms’ executive officers began to be held liable for infringement of pollution laws in the 1990s, government regulation has become the most important force driving sustainability practices [90]. It is unlikely that firms will vary significantly in their sustainability practices, as any variation would infringe the law and invite penalties and liabilities for senior managers.
The social community also has a strong influence on firms (represented as customer and competitor of a firm in the relation). The social community becomes a key factor in influencing firms’ sustainability practices when it moves beyond a watchdog role and becomes a collaborative partner of the firms [136]. Strategic collaboration and coordination with social communities in a supply chain helps a firm to manage the operational and environmental impact of supply-chain activities (including the impact of firms’ customers and competitors). Feedback from social communities represents a key resource, as social communities sometimes know more about the environmental problems facing parts of a supply chain than the firm itself [137]. Prior research indicates that those countries in which social communities are highly concerned about environmental issues will promote high environmental standards. Thus, firms operating in those countries face greater pressure to conform to environmental standards in order to gain legitimacy. By not conforming, firms face potential criticism from social communities, including activists, the media, and NGOs, and risk losing their reputations and legitimacy [138].
Environmental pressure from governments and social communities is intense in the semiconductor industry in Taiwan. In addition to environmental regulations legislated by foreign governments (e.g., RoHS, WEEE, and the ISO 14000 series in Europe and the USA), Taiwanese firms have become subject to environmental legislation by the Taiwanese Environmental Protection Administration (EPA) since 2006. The EPA has regulated that all domestic manufacturing companies must comply with prescribed environmental standards; failure to comply opens firms to the possibility of sanctions, including the prohibition of product fabrication and the withdrawal of export permits. Because the semiconductor industry often causes adverse environmental impacts and relies heavily on exporting to maintain its business growth, firms in the Taiwanese semiconductor industry strictly adhere to government regulations. The social community in Taiwan is also active. In many instances, social communities publicize information that could persuade consumers to favor the products of competitors who have demonstrated a stronger concern about environmental sustainability. In sum, both government regulations and social communities have motivated firms in Taiwan’s semiconductor industry to self-regulate; they have also encouraged supply-chain members to be committed to sustainability practices.

5.2.2. Organizational Factors

As shown in Figure 4c, the research results of this study indicate that internal stakeholders and organizational resources are cause factors in the organizational aspect that influence organizational innovativeness when a firm considers the adoption of green supply chains.
The results of this study are in line with previous studies [67,84] that highlighted the critical influence of internal stakeholders and organizational resources in determining the likelihood of green supply chain adoption. Internal stakeholders include managers, shareholders, and employees. The environmental resources required to implement a green supply chain include the human and financial forces spending on research and development. Green supply chain adoption is a complex procedure that requires abundant resources and close intra- and inter-organizational collaboration on both the operational and strategic levels. The support and encouragement of internal stakeholders is considered an essential force behind the adoption of innovation strategies, as the resources required for the adoption of new technologies will be more easily available if the main parties responsible for those resources support the plans [74]. Moreover, many corporate initiatives require the collaboration and coordination of different departments and divisions, and those initiatives are more easily undertaken when they are endorsed by major shareholders, the management team, and employees [24].
Organizational innovativeness refers to firms’ previous commitment and track record in implementing advanced organizational practices [33]. It is evident that organizational innovativeness is a factor affected by internal stakeholders and organizational resources. Prior research has indicated that only after a firm’s attention to continuous innovation development has achieved a certain critical intensity does it appear to be associated with increased adoption of green practices [78]. Above and below that critical intensity, there appears to be no difference in the use of green practice. This signifies that the pervasiveness, rather than the mere existence, of a firm’s commitment to continuous innovativeness is a palpable indicator of its likelihood to adopt a green supply chain. Apparently, a critical mass of innovativeness obtains only after firms’ internal stakeholders become aware of the necessity of adopting green supply chains and they agree to provide sufficient and continuous resources to support the green practice. As a result, firms have full opportunities to incorporate sustainability practices into their environmental operations.
Semiconductor manufacturing requires various resources (e.g., special gases and chemicals and large amounts of energy), but there has been a corresponding call for the industry to minimize its environmental impacts. Currently, the entire semiconductor industry in Taiwan is being asked to reduce in volume its emissions of greenhouse gases (e.g., carbon dioxide and perfluorocarbons) and its use of those substances that have a large impact on the environment. Taken Taiwan Semiconductor Manufacturing Company (TSMC), the largest semiconductor contracted manufacturing company in the world, as an example, this company sets a corporate environmental policy by incorporating its upstream design partners, material, and equipment suppliers and downstream assembly and testing service providers to achieve the goal of environmental sustainability. To encourage collaboration and coordination among different partners involved in the green supply chain, TSMC set up a dedicated, cross-function Green Fab Committee consisting of various internal stakeholders (e.g., technical executives, senior managers of engineering, equipment, procurement, and material management, and environmental and safety departments); the goal of the committee was to achieve widespread and thorough environmental sustainability through source reduction and the expansion of the scope of resource recovery. After aligning the direction of its various stakeholders, TSMC devoted significant human and financial resources to implementing the green supply chain. Table 10 shows the monetary data for TSMC’s investments in 2014. As the data show, the company spent around USD 450 million to directly and indirectly control its environmental impacts. With the support of internal stakeholders and organizational resources, TSMC has increased its organizational innovativeness by developing a series of technological and managerial innovations, including technology process enhancement, water resource management, energy saving, and pollution prevention. As a result, the company has made considerable environmental advancements. For example, a number of TSMC plants have attained a process water recycling rate of higher than 90%, when the average global rate within the semiconductor industry is 85%. Similarly, the company’s average removal efficiency of volatile organic compounds (VOC) treatment exhaust is relatively high at 95%, a percentage well above the standard proposed by local regulations (90%) [139].
Table 10. Environmental Cost of Taiwan Semiconductor Manufacturing Company (TSMC).
ClassificationDescriptionInvestmentExpense
1. Direct Cost for Reducing Environmental ImpactFees for air pollution control, water pollution control, and others229,857110,559
Costs for resource (e.g. water) conservation64,3203351
Costs for waste treatment (including recycling, incineration and landfill)022,539
2. Indirect Cost for Reducing Environmental ImpactCost of training
Environmental management system and certification expenditures
Environmental measurement and monitoring fees
Environmental protection product costs
Environmental protection organization fees
88326745
Total (unit: USD$ Thousands)303,009143,194
Source: TSMC Annual CSR Report [139].

5.2.3. Technological Factors

As shown in Figure 4d, our research results indicate that the factors of complexity and compatibility influence relative advantage. As far as innovation adoption is concerned, complexity is the degree to which using an innovation is perceived to be difficult. It is generally held that a complex innovation requiring greater implementation efforts will have a less likely chance of adoption [41]. In our research, complexity was found to influence the factors of relative advantage and compatibility. These findings are in accordance with those of Carayannis and Turner [140], who argue that one of the key challenges for firms adopting a technological innovation is to keep the complexity of the framework away from the end users for the purpose of user transparency and simplicity. As noted previously, implementing a green supply chain is a complex task that depends on firm members’ broad knowledge and requires integration across the different phases of a product’s life cycle [33]. Our research results indicate that firms made aware of underlying technological complexities are less likely to adopt a green supply chain. The level of complexity concerns compatibility between an underlying infrastructure and related interfaces across heterogeneous operational environments. Our results also confirm those of earlier studies in finding that firms interested in adopting a green supply chain should examine the compatibility of the chain with the firm’s existing environmental objectives and operational environment [18,66].
Relative advantage is the degree to which using an innovation is perceived to make one better off than otherwise. A firm is likely to adopt an innovation when it believes that the innovation will strengthen efficiency, effectiveness, and economic gains. Our research results indicate that the extent to which a green supply chain has a relative advantage depends on the extent to which the chain is perceived as compatible and complex. Studies have shown that green supply chains not only improve organizational environmental performance by reducing pollution but also economize environmental efforts by reducing energy and resource consumption, which leads to decreased costs and improved financial gains. However, in calculating possible financial gains, firms should “deduct” the tangible and intangible costs of solving compatibility and complexity issues during the process of adopting a green supply chain. Semiconductor manufacturing is expensive and complicated and requires a high compatibility between manufacturing equipment and manufacturing processes [15]. Although cerain studies [18,56,57] contend that the relative economic advantage of the green supply chain thoroughly lies behind firms’ decisions to adopt it, our research suggests that the practice of green supply chains has a maximum relative advantage for firms only when the practice has both a high degree of compatibility and a low degree of complexity.

5.3. Managerial Implications

As most firms face resource restrictions, their efforts should be directed to address the main cause factors, which have relatively strong relationships with other factors, and thus, the effort will result in immediate effects [141]. The managerial implications of this research are twofold. First, the study aims to help firms in determining which areas are likely to become focal points in the adoption of a green supply chain. Second, the study demonstrates that firms can use cause-and-effect relationships as guidelines during the course of adopting a green supply chain. At the high level, our research results suggest a firm should take technological, organizational, and environmental contexts into consideration when deciding whether to adopt a green supply chain. Nevertheless, firms should consider the environmental and organizational contexts prior to considering the technological one. On the detailed level, our findings are as follows:
(1)
From an environmental perspective, firms should not only comply with government regulations in their theaters of operation but should also track new developments in global environmental practices to reevaluate their environmental goals. In the mean time, firms should fulfill their social responsibilities and manage the operational and environmental impact of their supply chain activities by orchestrating their resources within and across various social communities. An excellent reputation as a legally compliant and socially responsible firm can translate into competitive advantage.
(2)
From an organizational perspective, firms should reach a consensus with their internal stakeholders before adopting a green supply chain. A firm with stronger support from its managers, shareholders, and employees will have more opportunities to successfully reach its environmental sustainability goal [81]. Therefore, a firm must display strong, consistent, and continuous leadership; mobilize organizational resources; and strive to enhance its organizational innovativeness to ensure that green supply chain efforts are focused upon and aligned with the firm’s business growth objectives and corporate environmental policy.
(3)
From a technological perspective, in determining the “cost” of a green supply chain, firms should take into account any efforts needed to solve issues of complexity and compatibility. To realize the maximum relative advantage of adopting a green supply chain, firms should concentrate their efforts on achieving a high degree of compatibility and a low degree of complexity.

6. Conclusions

The adoption of innovative environmental practices within industries is a subject of considerable interest across disciplines. The green supply chain is a special type of green innovation, as it take accounts not only of green practices within a firm but also of industrial ecology as a whole. In green supply chains, the decision varies from a small scale of a single firm’s operation to a large scales of an integrated industrial sector. The concept of overall sustainability goes beyond corporate policy and reflects the dynamics of the entire supply chain. The decision to adopt green supply chains involves dealing with uncertainty in environmental, organizational, and technological contexts. The goal of this research is to construct a holistic decision framework for green supply chain adoption by identifying a series of key consideration factors and their causal relationships. The semiconductor industry was chosen as the research subject not only because it is rarely discussed in studies of green supply chains but also because it is a prime mover in the electronics industry as a whole.
This study makes a number of contributions. Theoretically, this research offers an unprecedented empirical approach to green supply chain adoption in the semiconductor industry by integrating previously separate strands of Innovation theory, Stakeholder theory, Dynamic Capabilities theory, and Institutional theory into a TOE framework. Although previous research has acknowledged the significant technological, organizational and environmental challenges facing green supply chain adoption, few studies have empirically examined those effects. This study is significant not only because it offers a theoretical foundation for the investigation of the determinants of green supply chain adoption but also because it explores the cause-and-effect relationship among those determinants. Practically, this study provides firms with a holistic view of the consideration factors important to green supply chain adoption. Furthermore, the cause-and-effect relationships identified through the decision framework provide firms with a list of priorities. This implication stands to reason, as the outcome gained from addressing the main cause factors will yield an immediate impact on the main effect ones; hence, it will lessen the firm’s overall efforts to adopt green supply chain.
As with any empirical research, this study has limitations. First, the research focuses on one industry in one region. Although the semiconductor industry in Taiwan plays a leading global role and has striven to achieve environmental sustainability, future research might consider extending the coverage to include other countries to compare the results. The second limitation of this study is that its empirical data was gathered from a limited number of domain experts at the senior managment level. Although the DEMATEL method can yield good research results from a small sample size, future research might consider employing classical statistical methods with larger sample sizes that could include green supply chain users among firms’ staff and engineer groups. The results of such studies could then be compared against those of this study.

Acknowledgments

This research is partially sponsored by the Ministry of Science and Technology, Taiwan, Republic of China. Project number MOST 103-2410-H-224-033. The authors gratefully acknowledge the anonymous reviewers for their constructive advices on improving the earlier manuscript of this article.

Author Contributions

Bang-Ning Hwang did most of the research work including the research framework development, research conduct, manuscript composition and revision. Chi-Yo Huang helped to develop the survey questionnaires and advise the research method. Chih-Hsiung Wu helped to interview domain experts and analyze the research results. All authors read and approved the final manuscript.

Conflicts of Interest

The authors declare no conflict of interest.

Appendix

Appendix A: Survey Questionnaire 

Please indicate the influence degree between aspects (1: very small, 2: small, 3: medium, 4: strong, 5: very strong).
Table A1. The pairwise influence degree between aspects.
AspectTechnologyOrganizationEnvironmentAdoption
Technology-
Organization-
Environment-
Adoption-
Please indicate the influence degree between facators within Technology (1: very small, 2: small, 3: medium, 4: strong, 5: very strong).
Table A2. The pairwise influence degree between factors within Technology.
FactorRelative advantageCompatibilityComplexity
Relative advantage-
Compatibility-
Complexity-
Please indicate the influence degree between facators within Organization (1: very small, 2: small, 3: medium, 4: strong, 5: very strong).
Table A3. The pairwise influence degree between factors within Organization.
FactorOrganizational resourcesOrganizational innovativenessInternal stakeholder
Organizational resources-
Organizational innovativeness-
Internal stakeholder-
Please indicate the influence degree between facators within Environment (1: very small, 2: small, 3: medium, 4: strong, 5: very strong).
Table A4. The pairwise influence degree between factors within Environment.
FactorGovernment regulationCustomerCompetitorSocial Community
Government regulation-
Customer-
Competitor-
Social Community-

Appendix B: Survery Results 

Table B1. The initial direct-relation matrix (A) of 3 facators within Technology.
FactorRelative AdvantageCompatibilityComplexity
Relative Advantage0.0002.8182.545
Compatibility3.1820.0003.273
Complexity3.0913.5450.000
Table B2. The normalized direct-relation matrix (N) of 3 aspects facators within Technology.
FactorTechnologyOrganizationEnvironment
Technology0.0000.4250.384
Organization0.4790.0000.493
Environment0.4660.5340.000
Table B3. The initial direct-relation matrix (A) of 3 facators within Organization.
FactorResourcesInnovativenessInternal stakeholder
Resources0.0002.8182.545
Innovativeness3.1820.0003.273
Internal stakeholder3.0913.5450.000
Table B4. The normalized direct-relation matrix (N) of 3 aspects facators within Organization.
FactorResourcesInnovativenessInternal stakeholder
Resources0.0000.5060.457
Innovativeness0.4070.0000.407
Internal stakeholder0.5060.4940.000
Table B5. The initial direct-relation matrix (A) of 4 facators within Environment.
FactorGovernment regulationCustomerCompetetiorCommunity
Government regulation0.0003.7003.6363.545
Customer3.1820.0003.6363.455
Competetior2.8183.4550.0003.364
Community3.8183.8183.3640.000
Table B6. The normalized direct-relation matrix (N) of 4 facators within Environment.
FactorGovernment regulationCustomerCompetetiorCommunity
Government regulation0.0000.3360.3310.322
Customer0.2890.0000.3310.314
Competetior0.2560.3140.0000.306
Community0.3470.3470.3060.000

Appendix C: Results Test 

Table C1. The A i j p = 14 of Technology.
FactorRelative AdvantageCompatibilityComplexity
Relative Advantage0.0003.0002.600
Compatibility3.4000.0003.400
Complexity3.2003.7000.000
Table C2. The | A i j 15 A i j 14 | of Technology.
FactorRelative AdvantageCompatibilityComplexity
Relative Advantage0.0000.0650.021
Compatibility0.0690.0000.039
Complexity0.0350.0440.000
n2 = 9, significance confidence level: 0.27/9 = 3.03%.
Table C3. The A i j p = 14 of Organization.
FactorResourcesInnovativenessInternal stakeholder
Resources0.0003.9003.400
novativeness3.1000.0003.000
Internal stakeholder3.9003.7000.000
Table C4. The | A i j 15 A i j 14 | of Organization.
FactorResourcesInnovativenessInternal stakeholder
Resources0.0000.0460.011
novativeness0.0330.0000.000
Internal stakeholder0.0460.0180.000
n2 = 9, significance confidence level: 0.154/9 = 1.71%.
Table C5. The A i j p = 14 of Environment.
FactorGovernment regulationCustomerCompetetiorCommunity
Government regulation0.0003.7783.7003.500
Customer3.3000.0003.7003.400
Competetior2.9003.5000.0003.300
Community3.7003.7003.3000.000
Table C6. The | A i j 15 A i j 14 | of Environment.
FactorGovernment regulationCustomerCompetetiorCommunity
Government regulation0.0000.0210.0180.013
Customer0.0370.0000.0180.016
Competetior0.0290.0130.0000.019
Community0.0310.0310.0190.000
n2 = 16, significance confidence level: 0.264/16 = 1.65%.

References

  1. OECD. Eco-innovation in Industry. Enabling the Green Growth; OECD Publishing: Paris, France, 2009. [Google Scholar]
  2. Hsu, C.-C.; Choon Tan, K.; Hanim Mohamad Zailani, S.; Jayaraman, V. Supply chain drivers that foster the development of green initiatives in an emerging economy. Int. J. Oper. Prod. Manag. 2013, 33, 656–688. [Google Scholar]
  3. Cousins, P.D.; Lamming, R.C.; Bowen, F. The role of risk in environment-related supplier initiatives. Int. J. Oper. Prod. Manag. 2004, 24, 554–565. [Google Scholar]
  4. Benn Lawson, P.D.C.; Squire, B.; Vachon, S.; Klassen, R.D. Extending green practices across the supply chain: The impact of upstream and downstream integration. Int. J. Oper. Prod. Manag. 2006, 26, 795–821. [Google Scholar]
  5. Carter, C.R.; Rogers, D.S. A framework of sustainable supply chain management: Moving toward new theory. Int. J. Physic. Distrib. Logist. Manag. 2008, 38, 360–387. [Google Scholar]
  6. Weng, H.-H.R.; Chen, J.-S.; Chen, P.-C. Effects of green innovation on environmental and corporate performance: A stakehold. perspect. Sustainability 2015, 7, 4997–5026. [Google Scholar] [CrossRef]
  7. Chen, S.-H. Global production networks and information technology: The case of Taiwan. Ind. Innov. 2002, 9, 249–265. [Google Scholar]
  8. Chepesiuk, R. Where the chips fall: Environmental health in the semiconductor. Ind. Environ. Health Perspect. 1999, 107, A452–A457. [Google Scholar] [CrossRef]
  9. Cuerva, M.C.; Triguero-Cano, A.; Corcoles, D. Drivers of green and non-green innovation: Empirical evidence in low-tech smes. J. Clean. Prod. 2014, 68, 104–113. [Google Scholar] [CrossRef]
  10. Menguc, B.; Ozanne, L.K. Challenges of the “Green Imperative”: A natural resource-based approach to the environmental orientation–business performance relationship. J. Bus. Res. 2005, 58, 430–438. [Google Scholar] [CrossRef]
  11. Naffziger, D.W.; Almed, N.; Montagno, R.V. Perceptions of environmental consciousness in Us small businesses: An empirical study. SAM Adv. Manag. J. 2003, 68, 23–32. [Google Scholar]
  12. Christmann, P. Effects of “Best Practices” of environmental management on cost advantage: The role of complementary assets. Acad. Manag. J. 2000, 43, 663–680. [Google Scholar] [CrossRef]
  13. Rusinko, C. Green manufacturing: An evaluation of environmentally sustainable manufacturing practices and their impact on competitive outcomes. IEEE Trans. Eng. Manag. 2007, 54, 445–454. [Google Scholar] [CrossRef]
  14. Zhu, Q.; Sarkis, J.; Lai, K.-h. Green supply chain management implications for “Closing the Loop”. Transp. Res. Part E: Logist. Transp. Rev. 2008, 44, 1–18. [Google Scholar]
  15. Okuda, V.S.N.V.S. Green process aiming at reduction of environmental burden. FUJITSU Sci. Tech. J. 2005, 41, 251–258. [Google Scholar]
  16. Alvarez-Gil, M.J.; Berrone, P.; Husillos, F.J.; Lado, N. Reverse logistics, stakeholders′ influence, organizational slack, and managers′ posture. J. Bus. Res. 2007, 60, 463–473. [Google Scholar] [CrossRef]
  17. Aragon-Correa, J.A.; Matı́as-Reche, F.; Senise-Barrio, M.A.E. Managerial discretion and corporate commitment to the natural environment. J. Bus. Res. 2004, 57, 964–975. [Google Scholar] [CrossRef]
  18. Etzion, D. Research on organizations and the natural environment, 1992-present: A Rev. J. Manag. 2007, 33, 637–664. [Google Scholar] [CrossRef]
  19. González-Benito, J.; González-Benito, Ó. A rev. of determinant factors of environmental proactivity. Bus. Strategy Environ. 2006, 15, 87–102. [Google Scholar]
  20. Gadenne, D.L.; Kennedy, J.; McKeiver, C. An empirical study of environmental awareness and practices in smes. J. Bus. Ethics 2009, 84, 45–63. [Google Scholar] [CrossRef]
  21. López-Gamero, M.D.; Claver-Cortés, E.; Molina-Azorín, J.F. Complementary resources and capabilities for an ethical and environmental management: A qual/quan study. J. Bus. Ethics 2008, 82, 701–732. [Google Scholar] [CrossRef]
  22. Williamson, D.; Lynch-Wood, G.; Ramsay, J. Drivers of environmental behaviour in manufacturing smes and the implications for CSR. J. Bus. Ethics 2006, 67, 317–330. [Google Scholar] [CrossRef]
  23. Lin, C.-Y.; Ho, Y.-H. Determinants of green practice adoption for logistics companies in China. J. Bus. Ethics 2011, 98, 67–83. [Google Scholar] [CrossRef]
  24. Zailani, S.; Iranmanesh, M.; Nikbin, D.; Jumadi, H.B. Determinants and environmental outcome of green technology innovation adoption in the transportation industry in Malaysia. Asian J. Tech. Innov. 2014, 22, 286–301. [Google Scholar] [CrossRef]
  25. Weng, M.-H.; Lin, C.-Y. Determinants of green innovation adoption for small and medium-size enterprises (Smes). Afr. J. Bus. Manag. 2011, 5, 9154–9163. [Google Scholar]
  26. Rothenberg, S.; Zyglidopoulos, S.C. Determinants of environmental innovation adoption in the printing industry: The importance of task environment. Bus. Strategy Environ. 2007, 16, 39–49. [Google Scholar]
  27. Lin, H.-F. Understanding the determinants of electronic supply chain management system adoption: Using the technology–organization–environment framework. Tech. Foreca.& Soci. Chang. 2014, 86, 80–92. [Google Scholar]
  28. Tornatzky, L.G.; Fleischer, M.; Chakrabarti, A.K. Processes of Technological Innovation; Lexington Books: Lanham, MD, USA, 1990. [Google Scholar]
  29. Büyüközkan, G.; Çifçi, G. A novel hybrid mcdm approach based on fuzzy dematel, fuzzy anp and fuzzy topsis to evaluate green suppliers. Expert Syst. Appl. 2012, 39, 3000–3011. [Google Scholar] [CrossRef]
  30. Hsu, C.-W.; Hu, A.H. Green supply chain management in the electronic industry. Int. J. Environ. Sci. Tech. 2008, 5, 205–216. [Google Scholar]
  31. Geyer, R.; Jackson, T. Supply loops and their constraints: The industrial ecology of recycling and reuse. Calif. Manag. Rev. 2004, 46, 55–73. [Google Scholar] [CrossRef]
  32. Wells, P.; Seitz, M. Business models and closed-loop supply chains: A typology. Supply Chain. Manag. Int. J. 2005, 10, 249–251. [Google Scholar] [CrossRef]
  33. Florida, R.; Atlas, M.; Cline, M. What makes companies green? Organizational and geographic factors in the adoption of environmental practices. Econo. Geogr. 2001, 77, 209–224. [Google Scholar]
  34. Rosen, M.A.; Kishawy, H.A. Sustainable manufacturing and design: Concepts, practices and needs. Sustainability 2012, 4, 154–174. [Google Scholar] [CrossRef]
  35. Dornfeld, D.; Yuan, C.; Diaz, N.; Zhang, T.; Vijayaraghavan, A. Introduction to green manufacturing. Green Manuf. 2013, 1–23. [Google Scholar]
  36. Iacovou, C.L.; Benbasat, I.; Dexter, A.S. Electronic data interchange and small organizations: Adoption and impact of technology. MIS Q. 1995, 465–485. [Google Scholar] [CrossRef]
  37. Zhu, K.; Kraemer, K.L. Post-adoption variations in usage and value of e-business by organizations: Cross-country evidence from the retail industry. Inf. Syst. Res. 2005, 16, 61–84. [Google Scholar] [CrossRef]
  38. Lin, H.-F.; Lin, S.-M. Determinants of E-business diffusion: A test of the technology diffusion perspective. Technovation 2008, 28, 135–145. [Google Scholar] [CrossRef]
  39. Oliveira, T.; Martins, M.F. Literature rev. of information technology adoption models at firm level. Electr. J. Inf. Syst. Eval. 2011, 14, 110–121. [Google Scholar]
  40. Wang, Y.-M.; Wang, Y.-S.; Yang, Y.-F. Understanding the determinants of rfid adoption in the manufacturing industry. Technol. Forecast Soc. Chang. 2010, 77, 803–815. [Google Scholar] [CrossRef]
  41. Rogers, E.M. Diffusion of Innovations, 3rd ed.; Simon and Schuster: New York, NY, USA, 1983. [Google Scholar]
  42. Davis, F.D. Perceived usefulness, Perceived ease of use, and user acceptance of information technology. MIS Q. 1989, 319–340. [Google Scholar] [CrossRef]
  43. Taylor, S.; Todd, P. Decomposition and crossover effects in the theory of planned behavior: A study of consumer adoption intentions. Int. J. Res. In Market. 1995, 12, 137–155. [Google Scholar] [CrossRef]
  44. Choudhury, V.; Karahanna, E. The relative advantage of electronic channels: A multidimensional view. MIS Q. 2008, 179–200. [Google Scholar]
  45. Kim, C.; Mirusmonov, M.; Lee, I. An empirical examination of factors influencing the intention to use mobile payment. Comput. Hum. Behav. 2010, 26, 310–322. [Google Scholar] [CrossRef]
  46. Mallat, N. Exploring consumer adoption of mobile payments–a qualitative study. J. Strateg. Info. Syst. 2007, 16, 413–432. [Google Scholar] [CrossRef]
  47. Agarwal, R.; Prasad, J. A conceptual and operational definition of personal innovativeness in the domain of information technology. Inf. Syst. Res. 1998, 9, 204–215. [Google Scholar] [CrossRef]
  48. Low, C.; Chen, Y.; Wu, M. Understanding the determinants of cloud computing adoption. Ind. Manag. Data Syst. 2011, 111, 1006–1023. [Google Scholar]
  49. Sia, C.-L.; Teo, H.-H.; Tan, B.C.; Wei, K.-K. Effects of environmental uncertainty on organizational intention to adopt distributed work arrangements. IEEE Trans. Eng. Manag. 2004, 51, 253–267. [Google Scholar] [CrossRef]
  50. Yang, S.; Lu, Y.; Gupta, S.; Cao, Y.; Zhang, R. Mobile payment services adoption across time: An empirical study of the effects of behavioral beliefs, social influences, and personal traits. Comput. Hum. Behav. 2012, 28, 129–142. [Google Scholar] [CrossRef]
  51. Moore, G.C.; Benbasat, I. Development of an instrument to measure the perceptions of adopting an information technology innovation. Inf. Syst. Res. 1991, 2, 192–222. [Google Scholar] [CrossRef]
  52. Fichman, R.G. In information technology diffusion: A rev. of empir. Res. ICIS 1992, 195–206. [Google Scholar]
  53. Grandon, E.E.; Pearson, J.M. Electronic commerce adoption: An empirical study of small and medium Us businesses. Inf. Manag. 2004, 42, 197–216. [Google Scholar]
  54. White, A.; Daniel, E.; Ward, J.; Wilson, H. The adoption of consortium B2b E-Marketplaces: An exploratory study. J. Strateg. Inf. Syst. 2007, 16, 71–103. [Google Scholar] [CrossRef] [Green Version]
  55. Hernández-Ortega, B. The role of post-use trust in the acceptance of a technology: Drivers and consequences. Technovation 2011, 31, 523–538. [Google Scholar] [CrossRef]
  56. del Rio Gonzalez, P. Analysing the factors influencing clean technology adoption: A study of the Spanish pulp and paper industry. Bus. Strategy Environ. 2005, 14, 20–37. [Google Scholar]
  57. Robinson, S.; Stubberud, H.A. Green innovation in Germany: A comparison by business size. J. Int. Bus. Res. 2013, 12, 47–50. [Google Scholar]
  58. Porter, M.E.; van der Linde, C. Green and competitive: ending the stalemate. Harv. Bus. Rev. 1995, 73, 120–134. [Google Scholar]
  59. Zhu, Q.; Sarkis, J. The moderating effects of institutional pressures on emergent green supply chain practices and performance. Int. J. Prod. Res. 2007, 45, 4333–4355. [Google Scholar] [CrossRef]
  60. Chen, Y.-S. The driver of green innovation and green image–green core competence. J. Bus. Ethics 2008, 81, 531–543. [Google Scholar] [CrossRef]
  61. Deif, A.M. A system model for green manufacturing. J. Clean. Prod. 2011, 19, 1553–1559. [Google Scholar] [CrossRef]
  62. Liu, C.-Y.; Yang, S.-S.; Lin, I.-C. Critical factors of educational institutions adoption for Bs 10012: Persional information management system. Int. J. Network Secur. 2014, 16, 161–167. [Google Scholar]
  63. Jain, M.; Le, A.N.-H.; Lin, J.Y.-C.; Cheng, J.M.-S. Exploring the factors favoring mcommerce adoption among indian msmes: A TOE perspective. Tunghai Manag. Rev. 2011, 13, 147–188. [Google Scholar]
  64. Chou, C.-J.; Chen, K.-S.; Wang, Y.-Y. Green practices in the restaurant industry from an innovation adoption perspective: Evidence from Taiwan. Int. J. Hosp. Manag. 2012, 31, 703–711. [Google Scholar] [CrossRef]
  65. Faiers, A.; Neame, C.; Cook, M. The adoption of domestic solar-power systems: Do consumers assess product attributes in a stepwise process? Energy Policy 2007, 35, 3418–3423. [Google Scholar] [CrossRef]
  66. Vollink, T.; Meertens, R.; Midden, C.J. Innovating ‘diffusion of innovation’theory: Innovation characteristics and the intention of utility companies to adopt energy conservation interventions. J. Environ. Psych. 2002, 22, 333–344. [Google Scholar] [CrossRef]
  67. Messeni Petruzzelli, A.; Maria Dangelico, R.; Rotolo, D.; Albino, V. Organizational factors and technological features in the development of green innovations: Evidence from patent analysis. Innov 2011, 13, 291–310. [Google Scholar] [CrossRef]
  68. Boiral, O. Tacit knowledge and environmental management. Long Range Plan. 2002, 35, 291–317. [Google Scholar] [CrossRef]
  69. Delone, W.H.; McLean, E.R. The delone and mclean model of information systems success: A ten-year update. J. Manag. Inf. Syst. 2003, 19, 9–30. [Google Scholar]
  70. Ozaki, R. Adopting sustainable innovation: What makes consumers sign up to green electricity? Bus. Strategy Environ. 2011, 20, 1–17. [Google Scholar]
  71. Teece, D.; Pisano, G. The Dynamic Capabilities of Firms. In Handbook on Knowledge Management; Springer: Berlin, Germany, 2003; pp. 195–213. [Google Scholar]
  72. Freeman, R. Strategic Management: A Stakeholder Approach, Boston, Pitman. Friedman, M.(1970)’the Social Responsibility of Business Is to Increase Its Profits’; Cambridge University Press: Cambridge, UK, 2010. [Google Scholar]
  73. Ensminger, D.C.; Surry, D.W.; Porter, B.E.; Wright, D. Factors contributing to the successful implementation of technology innovations. J. Educ. Tech. Soc. 2004, 7, 61–72. [Google Scholar]
  74. Ho, Y.-H.; Lin, C.-Y.; Chiang, S.-H. Organizational determinants of green innovation implementation in the logistics industry. Int. J. Organ. Innov. 2009, 2, 3–12. [Google Scholar]
  75. Macaneiro, M.B.; da Cunha, S.K.; Balbinot, Z. Drivers of the adoption of eco-innovations in the pulp, paper, and paper products industry in brazil. Latin American Bus. Rev. 2013, 14, 179–208. [Google Scholar] [CrossRef]
  76. Chesbrough, H.; Vanhaverbeke, W.; West, J. Open Innovation: Researching a New Paradigm; Oxford University Press: Oxford, UK, 2006. [Google Scholar]
  77. Wallace, D. Environmental Policy and Industrial Innovation: Strategies in Europe, the USA and Japan. Available online: http://econpapers.repec.org/article/eeeenepol/v_3a24_3ay_3a1996_3ai_3a5_3ap_3a492-493.htm (accessed on 2 February 2016).
  78. Atlas, M.K.; Florida, R. Why Do Firms Adopt Green Design?: Organizational Opportunity, Organizational Resources, Costs, or Regulation. Available online: http://papers.ssrn.com/sol3/papers.cfm?abstract_id=37748 (accessed on 2 February 2016).
  79. Buysse, K.; Verbeke, A. Proactive environmental strategies: A stakeholder management perspective. Strateg. Manag. J. 2003, 24, 453–470. [Google Scholar] [CrossRef]
  80. Lee, S.-Y. Drivers for the participation of small and medium-sized suppliers in green supply chain initiatives. Supply Chain Manag.: An Int. J. 2008, 13, 185–198. [Google Scholar] [CrossRef]
  81. Guoyou, Q.; Saixing, Z.; Chiming, T.; Haitao, Y.; Hailiang, Z. Stakeholders′ influences on corporate green innovation strategy: A case study of manufacturing firms in China. Corp. Soc. Responsib. Environ. Manag. 2013, 20, 1–14. [Google Scholar]
  82. Yunus, S.; Jailani, S.F.A.K.; Hairuddin, H.; Kassim, E.S. Green it Adoption Towards Environmental Sustainability: The Moderating Role of Top Management Enforcement. In Proceedings of the 2013 International Conference on Research and Innovation in Information Systems (ICRIIS), Kuala Lumpur, Malaysia, 27–28 November 2013; pp. 241–244.
  83. Groschl, S. Persons with disabilities a source of nontraditional labor for Canada’s hotel industry. Cornell Hotel Restaur. Adm. Q. 2005, 46, 258–274. [Google Scholar] [CrossRef]
  84. Capelle-Blancard, G.; Laguna, M.-A. How does the stock market respond to chemical disasters? J. Environ. Econ. Manag. 2010, 59, 192–205. [Google Scholar] [CrossRef] [Green Version]
  85. Jacobs, B.W.; Singhal, V.R.; Subramanian, R. An empirical investigation of environmental performance and the market value of the firm. J. Oper. Manag. 2010, 28, 430–441. [Google Scholar] [CrossRef]
  86. Chen, Y.-S.; Lai, S.-B.; Wen, C.-T. The influence of green innovation performance on corporate advantage in Taiwan. J. Bus. Ethics. 2006, 67, 331–339. [Google Scholar] [CrossRef]
  87. Nishitani, K. An empirical study of the initial adoption of Iso 14001 in Japanese manufa. Firms. Ecolog. Econ. 2009, 68, 669–679. [Google Scholar] [CrossRef]
  88. Buzzelli, D.T. Time to structure an environmental policy strategy. J. Bus. Strategy 1991, 12, 17–20. [Google Scholar] [CrossRef]
  89. Ramus, C.A.; Steger, U. The roles of supervisory support behaviors and environmental policy in employee “Ecoinitiatives” at leading-edge european companies. Acad. Manag. J. 2000, 43, 605–626. [Google Scholar] [CrossRef]
  90. Sharma, S.; Henriques, I. Stakeholder influences on sustainability practices in the Canadian forest products industry. Strateg. Manag. J. 2005, 26, 159–180. [Google Scholar] [CrossRef]
  91. Scott, W.R. Institutions and Organizations; Sage: Thousand Oaks, CA, USA, 1995; Volume 2. [Google Scholar]
  92. Oliver, C. Sustainable competitive advantage: Combining institutional and resource-based views. Strateg. Manag. J. 1997, 18, 697–713. [Google Scholar] [CrossRef]
  93. Krishnan, R.A.; Joshi, S.; Krishnan, H. The influence of mergers on firms′ product-mix strategies. Strategy Manag. J. 2004, 25, 587–611. [Google Scholar] [CrossRef]
  94. Ketokivi, M.A.; Schroeder, R.G. Strategic, structural contingency and institutional explanations in the adoption of innovative manufacturing practices. J. Oper. Manag. 2004, 22, 63–89. [Google Scholar] [CrossRef]
  95. Tate, W.L.; Dooley, K.J.; Ellram, L.M. Transaction cost and institutional drivers of supplier adoption of environmental practices. J. Bus. Logist. 2011, 32, 6–16. [Google Scholar] [CrossRef]
  96. Rivera, J.; De Leon, P.; Koerber, C. Is greener whiter yet? The sustainable slopes program after five years. Policy Stud. J. 2006, 34, 195–221. [Google Scholar]
  97. Kassinis, G.; Vafeas, N. Stakeholder pressures and environmental performance. Acad. Manag. J. 2006, 49, 145–159. [Google Scholar] [CrossRef]
  98. Meyer, J.W.; Rowan, B. Institutionalized organizations: Formal structure as myth and ceremony. Am. J. Sociol. 1977, 340–363. [Google Scholar] [CrossRef]
  99. Sarkis, J.; Zhu, Q.; Lai, K.-h. An Organizational theoretic rev. of green supply chain management literature. Int. J. Prod. Econ. 2011, 130, 1–15. [Google Scholar]
  100. Vachon, S.; Halley, A.; Beaulieu, M. Aligning competitive priorities in the supply chain: The role of interactions with suppliers. Int. J. Oper. Prod. Manag. 2009, 29, 322–340. [Google Scholar]
  101. Nawrocka, D. Environmental supply chain management, ISO 14001 and rohs. how are small companies in the electronics sector managing? Corp. Soc. Responsib. Environ. Manag. 2008, 15, 349–360. [Google Scholar]
  102. Wolf, J. Sustainable supply chain management integration: A qualitative analysis of the German manufacturing industry. J.Bus. Ethics 2011, 102, 221–235. [Google Scholar] [CrossRef]
  103. Florida, R.; Davison, D. Gaining from green management. Calif. Manag.Rev. 2001, 43, 63–84. [Google Scholar] [CrossRef]
  104. Geffen, C.A.; Rothenberg, S. Suppliers and environmental innovation: The automotive paint process. Int. J. Oper. Prod. Manag. 2000, 20, 166–186. [Google Scholar]
  105. Perrow, C. Organizational prestige: Some functions and dysfunctions. Am. J. Sociol. 1961, 335–341. [Google Scholar] [CrossRef]
  106. Kagan, R.A.; Gunningham, N.; Thornton, D. Explaining corporate environmental performance: How does regulation matter? Law Soc. Rev. 2003, 37, 51–90. [Google Scholar]
  107. Jones, M.T. The institutional determinants of social responsibility. J. Bus. Ethics 1999, 20, 163–179. [Google Scholar] [CrossRef]
  108. Henriques, I.; Sadorsky, P. The relationship between environmental commitment and managerial perceptions of stakeholder importance. Acade. Manag. J. 1999, 42, 87–99. [Google Scholar] [CrossRef]
  109. Benn, S.; Dunphy, D.; Martin, A. Governance of environmental risk: New approaches to managing stakeholder involvement. J. Environ. Manag. 2009, 90, 1567–1575. [Google Scholar] [CrossRef] [PubMed]
  110. Pavlovich, K.; Akoorie, M. Innovation, sustainability and regional development: The nelson/marlborough seafood cluster, New Zealand. Bus. Strategy Environ. 2010, 19, 377–386. [Google Scholar]
  111. Fontela, E.; Gabus, A. The Dematel Observer, Dematel 1976 Report; Battelle Geneva Research Center: Geneva, Switzerland, 1976. [Google Scholar]
  112. Lin, C.-J.; Wu, W.-W. A causal analytical method for group decision-making under fuzzy environment. Expert Syst. Appl. 2008, 34, 205–213. [Google Scholar] [CrossRef]
  113. Huang, C.-Y.; Shyu, J.Z.; Tzeng, G.-H. Reconfiguring the innovation policy portfolios for Taiwan′s sip mall industry. Technovation 2007, 27, 744–765. [Google Scholar] [CrossRef]
  114. Chen-Yi, H.; Ke-Ting, C.; Gwo-Hshiung, T. Fmcdm with fuzzy dematel approach for customers’ choice behavior model. Int. J. Fuzzy Syst. 2007, 9, 236–246. [Google Scholar]
  115. Yang, C.-L.; Yuan, B.J.; Huang, C.-Y. Key Determinant derivations for information technology disaster recovery site selection by the multi-criterion decision making method. Sustainability 2015, 7, 6149–6188. [Google Scholar] [CrossRef]
  116. Lee, S.-G.; Chae, S.H.; Cho, K.M. Drivers and inhibitors of saas adoption in Korea. Int. J. Inf. Manag. 2013, 33, 429–440. [Google Scholar] [CrossRef]
  117. Hoe, S.L. Issues and procedures in adopting structural equation modeling technique. J. Appl. Quant. Methods 2008, 3, 76–83. [Google Scholar]
  118. Huang, C.-Y.; Kao, Y.-S. Utaut2 based predictions of factors influencing the technology acceptance of phablets by DNP. Available online: http://www.hindawi.com/journals/mpe/2015/603747/ (accessed on 2 February 2016).
  119. Daim, T.U.; Udbye, A.; Balasubramanian, A. Use of Analytic Hierarchy Process (Ahp) for selection of 3pl providers. J. Manuf. Tech. Manag. 2012, 24, 28–51. [Google Scholar] [CrossRef]
  120. Liang, L.-W.; Shih, K.-H.; Chung, Y.-H. Financing instruments and strategies of agribusiness: Evidence from Taiwan. Afr. J. Bus. Manag. 2010, 4, 320–332. [Google Scholar]
  121. Lee, Y.-C.; Hsieh, Y.-F.; Guo, Y.-B. Construct Dtpb model by using dematel: A study of a university library website. Program 2013, 47, 155–169. [Google Scholar] [CrossRef]
  122. Lee, Y.-C.; Li, M.-L.; Yen, T.-M.; Huang, T.-H. Analysis of adopting an integrated decision making trial and evaluation laboratory on a technology acceptance model. Expert Syst. Appl. 2010, 37, 1745–1754. [Google Scholar] [CrossRef]
  123. Lu, M.-T.; Lin, S.-W.; Tzeng, G.-H. Improving Rfid adoption in Taiwan′s healthcare industry based on a dematel technique with a hybrid mcdm model. Decis. Support Syst. 2013, 56, 259–269. [Google Scholar] [CrossRef]
  124. Henriques, I.; Sadorsky, P. Environmental technical and administrative innovations in the Canadian manufacturing industry. Bus. Strategy amp; Environ. 2007, 16, 119–132. [Google Scholar]
  125. Li, H.; Atuahene-Gima, K. 5. The adoption of agency business activity, product innovation and performance in Chinese technology Ventures. Strategy Manage. J. 2002, 23, 469–490. [Google Scholar]
  126. Zhu, K.; Weyant, J.P. Strategic decisions of new technology adoption under asymmetric information: A game? Theoretic Model. Decis. Sci 2003, 34, 643–675. [Google Scholar] [CrossRef]
  127. Aragon-Correa, J.A.; Sharma, S. A contingent resource-based view of proactive corporate environmental strategy. Acad. Manag. Rev. 2003, 28, 71–88. [Google Scholar]
  128. Gold, S.; Seuring, S.; Beske, P. Sustainable supply chain management and inter? organizational resources: A literature rev. Corp. Soci. Responsib. Environ. Manag. 2010, 17, 230–245. [Google Scholar]
  129. Sharma, S.; Vredenburg, H. Proactive corporate environmental strategy and the development of competitively valuable organizational capabilities. Strate. Manag. J. 1998, 19, 729–753. [Google Scholar] [CrossRef]
  130. Bowen, F.E.; Cousins, P.D.; Lamming, R.C.; Farukt, A.C. The role of supply management capabilities in green supply. Prod. Oper. Manag. 2001, 10, 174–189. [Google Scholar]
  131. Elkington, J. Enter the triple bottom line. the triple bottom line: Does it all add up. 2004. Available online: http://www.johnelkington.com (accessed on 2 February 2016).
  132. OECD. Nanotechnology for Green Innovation. Available online: http://www.keepeek.com/Digital-Asset-Management/oecd/science-and-technology/nanotechnology-for-green-innovation_5k450q9j8p8q-en#page1 (accessed on 2 February 2016).
  133. Wright, R.; Elcock, K. The rohs and weee directives: Environmental challenges for the electrical and electronic products sector. Environ. Qual. Manag. 2006, 15, 9–24. [Google Scholar] [CrossRef]
  134. Sarkar, R. Public policy and technology environmental behaviour: A broader view. Corp. Soc. Responsib. Environ. Manag. 2008, 15, 281–297. [Google Scholar]
  135. Chan, J.C.h.; Welford, R. Assessing corporate environmental risk in China: An evaluation of reporting activities of hong kong listed enterprises. Corp. Soc. Responsib. Environ. Manag. 2005, 12, 88–104. [Google Scholar]
  136. Maria Jesus Saenz, P.; Xenophon Koufteros, D.; Meixell, M.J.; Luoma, P. Stakeholder pressure in sustainable supply chain management: A systematic Rev. Int. J. Phys. Distrib. Logist. Manag. 2015, 45, 69–89. [Google Scholar]
  137. Maria Jesus Saenz, P.; Xenophon Koufteros, D.; Wong, C.Y.; Wong, C.W.; Boon-itt, S. Integrating environmental management into supply chains: A systematic literature rev. and theoretical framework. Int. J. Phys. Distrib. Logist. Manag. 2015, 45, 43–68. [Google Scholar]
  138. Ortiz-de-Mandojana, N.; Aguilera-Caracuel, J.; Morales-Raya, M. Corporate governance and environmental sustainability: The moderating role of the national institutional context. Corp. Soc.Responsib. Environ. Manag. 2014. [Google Scholar] [CrossRef]
  139. TSMC CSR Annual Report. 2014. Available online: http://www.tsmc.com/english/csr/csr_press.htm (accessed on 2 February 2016).
  140. Carayannis, E.G.; Turner, E. Innovation diffusion and technology acceptance: The case of Pki technology. Technovation 2006, 26, 847–855. [Google Scholar] [CrossRef]
  141. Wu, H.-Y. Constructing a strategy map for banking institutions with key performance indicators of the balanced scorecard. Eval. Program Plan. 2012, 35, 303–320. [Google Scholar]

