Article

Proactive Environmental Strategy, Technological Eco-Innovation and Firm Performance—Case of Poland

Institute of Production Engineering, Faculty of Organization and Management, Silesian University of Technology, Roosevelt 32 Str., 41-800 Zabrze, Poland
Sustainability 2016, 8(2), 156; https://doi.org/10.3390/su8020156
Submission received: 4 December 2015 / Revised: 1 February 2016 / Accepted: 2 February 2016 / Published: 5 February 2016
(This article belongs to the Section Economic and Business Aspects of Sustainability)

Abstract

:
Nowadays, scholars exploring the relationship between proactive environmental strategy and firm competitiveness do not focus on the question of whether it pays to be green but rather investigate when, for whom or how it does so. This paper analyzes the links between proactive environmental strategy, technological eco-innovation and firm performance. In particular, it examines the influence of proactive environmental strategy on firm performance and explores this relationship through technological eco-innovation. A research model has been developed and tested using a sample of 292 firms operating in Poland. In order to test the proposed research model and hypotheses, structural equation modeling using partial least squares has been employed. The findings do not confirm that proactive environmental strategy directly affects firm performance. However, the results show the significant mediating role of technological eco-innovation in this relationship. Since the technological eco-innovation reduces environmental impact and improves business performance, this research proves that it simultaneously contributes to environmental and economic pillars of sustainable development.

1. Introduction

The mitigation of environmental burden caused by the business activity is one of the key challenges in achieving sustainable development. The beyond-compliance behaviors by firms, especially adopting the proactive environmental strategy, play a crucial role in this area. The previous theoretical and empirical studies analyzing the relation between proactive environmental strategy and firm competitiveness have concentrated on the question whether it pays to be green [1]. Nowadays, scholars analyzing this relationship do not focus on the question of whether it pays to be green but rather investigate when, for whom or how it does so [2,3]. The outcomes of the research addressing these issues are not consistent and the debate on it is still open. In addition, the recent studies emphasize that the link between implementation of voluntary environmental practices and firm performance is not direct [4]. This calls for searching the variables that mediate this relationship because sufficient knowledge about such conditions could positively affect organizational competitiveness.
Since the eco-innovation may reduce environmental impact and improve business performance [5], this study contributes to the mentioned above literature dispute and proposes an empirically tested model of links between proactive environmental strategy, technological eco-innovation and firm performance. On the basis of a sample of 292 firms operating in Poland, the direct and indirect effects have been estimated and, in particular, the mediating role of technological eco-innovation in the relationships between proactive environmental strategy and firm performance has been analyzed. This research is to prove that proactive environmental strategy and technological eco-innovation simultaneously contribute to the environmental and economic pillars of sustainable development.
This paper is structured as follows: Section 2 reviews the theoretical and empirical literature on proactive environmental strategy, technological eco-innovation and firm performance and presents the developed hypotheses. Section 3 characterizes the sample and data collection and defines the measures used in the study. Section 4 describes the obtained empirical results. Finally, Section 5 summarizes the research and draws principal conclusions.

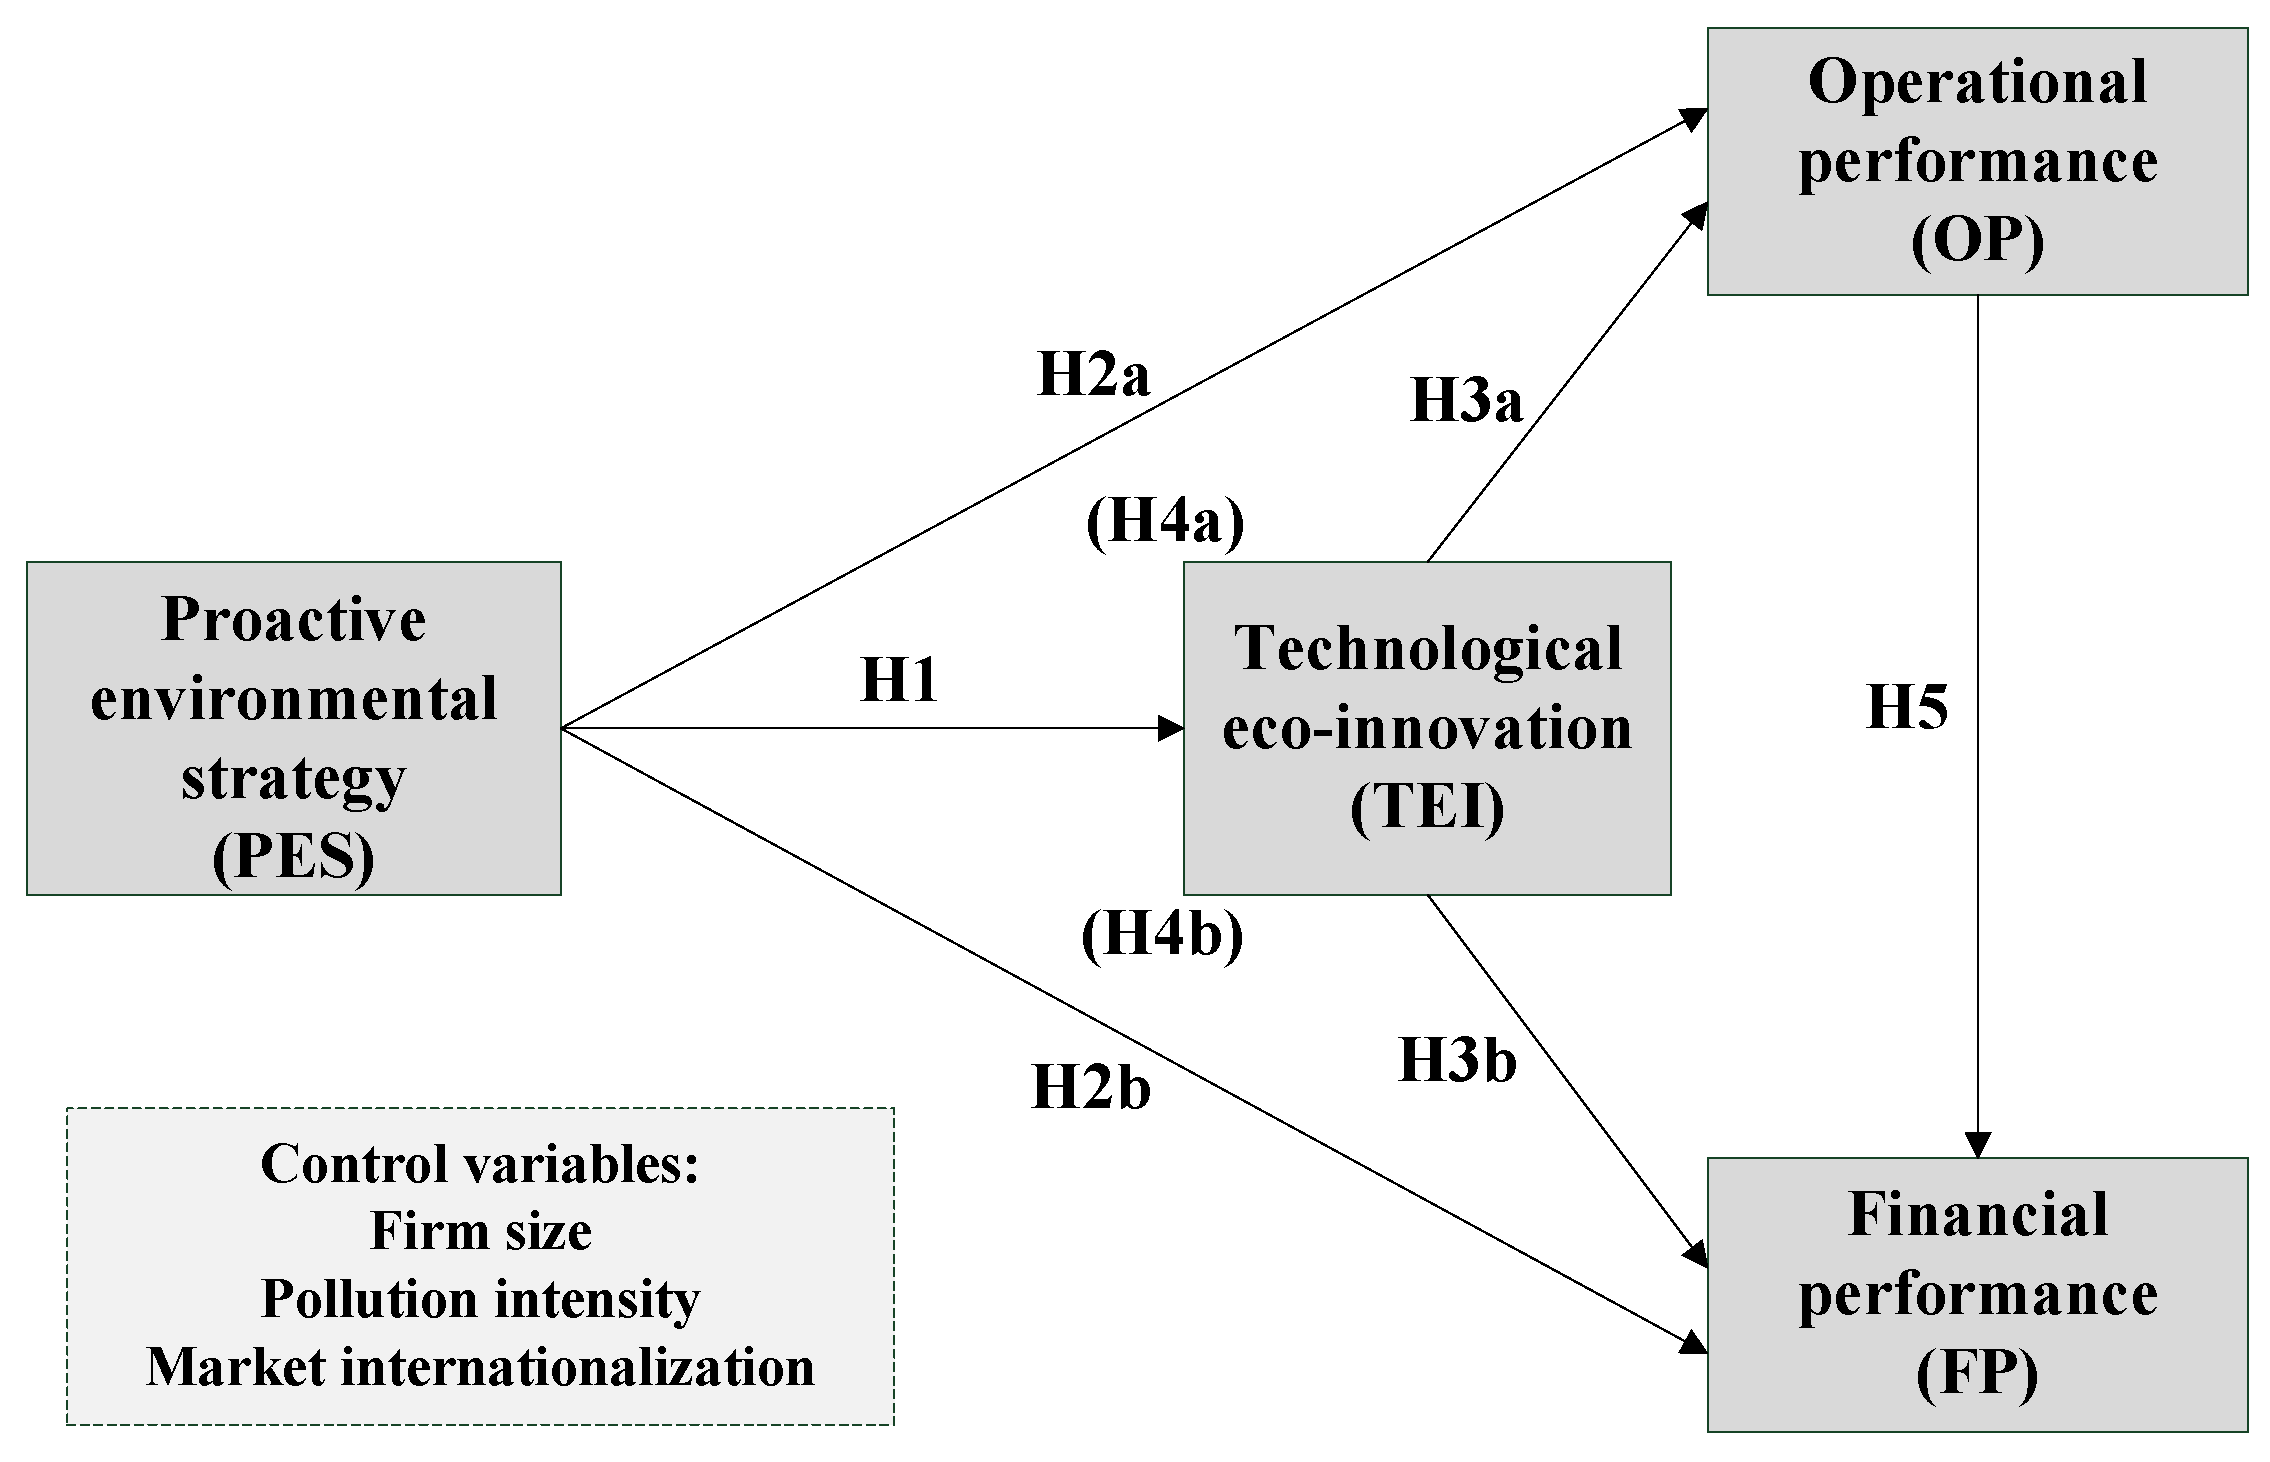
2. Theoretical Framework and Hypotheses Development

The research on proactive environmental strategy exploits different theoretical perspectives [6]. Some researchers have adopted in this area institutional theory (e.g., [7]). Another conceptual background is stakeholder theory (e.g., [8,9]). Numerous studies have utilized the resource-based view of the firm as contributing to the adoption of proactive environmental strategy (e.g., [10,11,12,13]), including dynamic capability perspective (e.g., [14]). The resource-based view approach is broadly widespread in the research on links between proactive environmental strategy and firm performance. Therefore, this perspective seemed to be the most useful in the context of this study.
The diverse theoretical background is also adopted in the research on eco-innovation. The eco-innovation has been discussed using neoclassical and co-evolutionary approaches from innovation economics to environmental economics [15], and evolutionary economics theory on innovation [16]. The study on eco-innovation previously utilized general innovation theory (e.g., [17]). This approach was extended and named the environmental innovation theory [18] and has been subsequently adopted by other scholars (e.g., [19]). Numerous recent studies have used institutional and neo-institutional theory (e.g., [20,21]) and stakeholder perspective (e.g., [22]), but very limited research on eco-innovation applied the resource-based theory (e.g., [23,24]). With regard to the latter approach, del Rio concludes that internal factors to the firm such as resources, competences and dynamic capabilities have been underrepresented in the empirical literature on eco-innovation and their complex role in the eco-innovation process are not grasped in the existing studies [25]. Thus, this approach has been utilized in this research.
It should be emphasized that, according to the Eco-Innovation Scoreboard, Poland is among countries catching up in eco-innovation, and is characterized by one of the worst overall eco-innovation performance in the European Union [26]. In such a situation, the primary focus of eco-innovation tends to rely on technological advances, typically with products or processes as eco-innovation targets [27]. For this reason, this study focuses on technological eco-innovation.

2.1. Proactive Environmental Strategy and Technological Eco-Innovation

In the literature, we can find various typologies of corporate approaches to environmental management. In general, researchers distinguish between two extreme postures: the environmental reactivity, typical for firms that only implement the minimal compulsory changes to meet regulations, and the environmental proactivity, typical for firms that voluntarily take measures to reduce their impact on the natural environment [28]. Sharma and Vredenburg assume that a corporate environmental strategy is proactive if it exhibits a consistent pattern of environmental practices, across all dimensions relevant to their range of activities, not required to be undertaken in fulfillment of environmental regulations or in response to isomorphic pressures within the industry as standard business practices [12]. There are no commonly agreed constructs, dimensions and variables involved in measuring proactive environmental strategy. Previous conceptual studies [29,30] suggested that there is a linear path which ranges from reactivity to proactivity. Some scholars have empirically studied the one-dimensional approach [8,9,12] by reducing different sets of proactive environmental practices to a single factor. On the contrary, other papers [28,31,32] suggested multidimensional and contingent view of environmental proactivity.
There is also no commonly accepted definition of eco-innovation and technological eco-innovation. Fussler and James, in one of the first appearances of this concept in the literature, define eco-innovation as a process of developing new products, processes or services which provide customer and business value but significantly decrease environmental impact [33]. According to the more recent definition, eco-innovation is the production, assimilation or exploitation of a product, production process, service, management or business method that is novel to the organization (developing or adopting it) and which results, throughout its life cycle, in a reduction of environmental risk, pollution and other negative impacts of resources use (including energy use) compared to relevant alternatives [34]. The European Commission defines eco-innovation as any form of innovation resulting in or aiming at significant and demonstrable progress towards the goal of sustainable development, through reducing impacts on the environment, enhancing resilience to environmental pressures, or achieving a more efficient and responsible use of natural resources [35]. The definition of technological eco-innovations is based on the general understanding of technological innovations as defined in the Oslo Manual [36] which distinguishes product and process innovations. Thus, technological eco-innovations, i.e., product and process eco-innovations, as specific kind of technological innovations consist of new or significantly improved products and processes to avoid or reduce environmental burden [37,38].
The complex nature of technological eco-innovation requires firms developing or adopting it to employ specific resources and green capabilities. According to the natural-resource-based view of the firm [10], proactive environmental strategy provides the accumulation of such resources and capabilities to prevent environmental degradation by innovative, environmentally friendly products, processes and technologies [39]. Proactive environmental strategy also supports the experimentation and development of the new opportunities, at the business-natural environment interface, in an efficient and effective manner [12]. Therefore, the following hypothesis is proposed:
H1. 
Proactive environmental strategy has a positive direct effect on technological eco-innovation.

2.2. Proactive Environmental Strategy and Firm Performance

The natural-resource-based view of the firm is rooted in interconnected strategic capabilities (i.e., pollution prevention, product stewardship and sustainable development) that facilitate environmentally sustainable economic activity [10]. Each of them faces different driving forces, is built upon different key resources and constitutes heterogeneous sources of competitive advantage [11]. Sharma and Vredenburg argue that proactive environmental strategy can be associated with the development of unique organizational capabilities as conceived by the resource-based view of the firm (e.g., path dependent, inimitable and socially complex) [12]. Aragon-Correa and Sharma assert that environmental proactive strategy is a dynamic capability that allows firms to align their strategy with the changing, complex and uncertain business environment [14]. It is also embedded in organizational competencies which may lead firms to gain competitive advantages [40,41]. According to the natural-resource-based view of the firm, it is expected that firms’ profitability is positively influenced by the competitive advantage generated by proactive environmental behaviors that favor the development of strategic resources and capabilities that are engendering positive economic returns [42]. Proactive environmental strategy can be associated with different benefits and positive changes. Nevertheless, the theoretical views and empirical research are not conclusive about the competitive consequences of environmental proactivity. While some scholars found a positive relationship (e.g., [43,44]), others did not recognize a positive impact of proactive environmental strategy on firm’s financial performance (e.g., [45,46]). Klassen and Whybark proved that preventive technologies instead of control technologies significantly affect operational (manufacturing) performance [47]. On the contrary, other study revealed that some dimensions of proactive environmental strategy have positive effect on operational performance but certain negative effects of environmental practices on operational performance measures have also been registered [28]. According to González-Benito and González-Benito there is no single relationship between environmental proactivity and business performance. This relationship depends on the portfolio of practices in which this proactivity is demonstrated, and on the type of business performance which is considered [28]. Given the above, the following hypotheses are proposed:
H2a. 
Proactive environmental strategy has a positive direct effect on firm’s operational performance.
H2b. 
Proactive environmental strategy has a positive direct effect on firm’s financial performance.

2.3. Technological Eco-Innovation and Firm Performance

The way firms can integrate environmental concerns into their strategies while consolidating their competitive advantage is through eco-innovations [20]. Cheng et al. claim that eco-innovation can be seen as a distinctive and unique green capability developed with various resources, which should in turn contribute to competitive advantage and business performance. This assumption was confirmed by showing the positive relationship between eco-innovation and business performance [5]. Since technological eco-innovation leads to a reduction in the use of physical resources, it can consequently be a source of competitive advantage and thus it is expected to exert a positive effect on firms’ profitability. The results of a study conducted by Weng et al. indicated that green product and process innovation practices have positive and significant effects not only on environmental performance but also on firm performance, both financial and non-financial [22]. The research of Ghisetti and Rennings showed that cost saving and/or efficiency improving innovations positively affect firms’ competitiveness [42]. Nevertheless, for innovations aimed at reducing externalities cost burden of the adoption of the innovation may overcome the potential gains. Technological eco-innovation can also serve as an attempt to achieve the differentiation for environmentally conscious customers by providing them with a better product quality and improved product features [41]. However, the research of Salvadó et al. shows that while financial returns through a green image are easier to achieve, the relationship between environmental product innovation and firm performance is inconclusive [48]. It is hypothesized that:
H3a. 
Technological eco-innovation has a positive direct effect on firm’s operational performance.
H3b. 
Technological eco-innovation has a positive direct effect on firm’s financial performance.

2.4. Mediating Role of Technological Eco-Innovation in the Relationship between Proactive Environmental Strategy and Firm Performance

Blanco et al. suggest that no direct causality would exist between environmental and economic performance [2]. Based on the review of the quantitative studies on the impact of green management on financial performance, Molina-Azorín et al. also agree that this relationship might not be direct [3]. Therefore, it may be interesting for the prospect research to analyze this causal link, considering the role of potential mediating variables. Delmas et al. argue that by studying the link between proactive environmental strategies and competitive advantage independently from the firms’ more general organizational capabilities, researchers might just be looking at the tip of the iceberg and missing the most fundamental element of the success of proactive environmental strategies [4]. Proactive environmental strategy has a positive effect on firm performance when mediated by valuable organizational capabilities [12,45]. Boons and Wagner, assessing the relationship between economic and ecological performance, recognize the crucial role of innovation [49]. Drawing on the resource-based view of the firm, Christmann has indicated that capabilities for process innovation and implementation are complementary assets that influence the relationship between best practices of environmental management and firm performance of “best practices” [13]. Proactive environmental strategy requires firms to prevent environmental degradation by innovative approach to develop environmentally friendly products, processes and technologies. Firms that have a high rate of environmentally friendly product implementations and are the first to introduce such products and technologies into the market are likely to thrive [39]. Therefore, the following hypotheses are proposed:
H4a. 
Technological eco-innovation mediates the relationship between proactive environmental strategy and firm’s operational performance.
H4b. 
Technological eco-innovation mediates the relationship between proactive environmental strategy and firm’s financial performance.

2.5. Interdependence of Firm Performance

Many previous studies have analyzed different firm performance measures separately. This might be one of the explanations for reaching the conflicting results [28]. The empirical research reveals that performance measures are interdependent, with regard to operational and financial performance. Chi and Gursoy confirm the direct relationship between customer satisfaction and financial performance [50]. In addition, recent study showed positive relationship between product quality and financial performance [51]. Therefore, it is hypothesized that:
H5. 
Firm’s operational performance has a positive direct effect on firm’s financial performance.
The research model proposed in this study is shown in Figure 1.
Figure 1. The research model. Source: own elaboration.
Sustainability 08 00156 g001

3. Research Methodology

3.1. Sample and Data Collection

The empirical study presented in this article is a part of the research conducted in November and December 2013 on a sample of firms representing selected industries operating in Poland. The research method applied was the computer assisted telephone interview (CATI), conducted by the largest Polish research agency, PBS Ltd., which meets the highest research standards. The interviews were conducted among representatives of firms: owners, management board members or other decision-makers in a given organization. In order to enable analysis in the established groups of firms in each of the determined categories, ratios by industry and employment size were used. After defining the categories and the size required to carry out the research, firms were randomly drawn from the nationwide business database with a stratification procedure along the dimensions of firm size (three categories: 10–49 employees; 50–249 employees, and ≥250 employees) and selected industrial and service sectors. The surveyed sample comprised firms from highly and moderately polluting sectors. These sectors have been chosen due to their high environmental impact and substantial technological eco-innovation potential. As a result of conducted interviews, representatives of 292 firms fully completed the survey questionnaire. The reply rate was 5.2%, which is consistent with the other previous studies of corporate proactive environmental strategies that obtained similar response rates [41,52,53,54]. The surveyed sample is characterized in Table 1.
In order to assess potential non-response bias, the early and late respondents were compared as suggested by Armstrong and Overton [55]. The results of independent t-tests showed no statistical differences across key firms characteristics and each analyzed measure (Table A1 in Appendix Section) at a significance level of 0.05. This suggests that non-response bias was not a concern.
Table 1. The details of surveyed sample.
CharacteristicsSurvey Sample
N%
Size of firm
Small-sized15051.4
Medium-sized9532.5
Large-sized4716.1
Total292100.0
Sector
Food Products and Beverages4114.0
Wood and Paper Products165.5
Chemicals and Chemical Products268.9
Textiles155.2
Basic Metals and Metal Products3712.7
Non-Metallic and Mineral Products3411.6
Machinery and Equipment2910.0
Electrical Machinery and Apparatus175.8
Motor Vehicles and Transportation227.5
Electricity Production and Supply217.2
Environmental protection289.6
Others62.0
Total292100.0

3.2. Measures

All measures included in the questionnaire were based on the prior literature review. Additionally, all questions were consulted with a panel of scholar and industrial experts in order to evaluate the validity of the items in the questionnaire. The seven-point Likert-type scales (1—strongly disagree/much worse; 7—strongly agree/much better) were used throughout the questionnaire. The characteristics of question items for the analyzed measures are listed in Table A2 in Appendix Section.

3.2.1. Proactive Environmental Strategy (PES)

To measure proactive environmental strategy, respondents were asked to score the degree of implementation of sixteen environmental practices adapted from previous studies [28,31]. These practices encompassed a wide range of environmental activities in different areas, such as strategy and firm’s objectives, organizational structure, environmental policy and long-term plans, product and process operational practices, purchasing policy, etc.

3.2.2. Technological Eco-Innovation (TEI)

The technological eco-innovation was measured by six items. The scale was developed by referring to the previous studies on innovation and eco-innovation [37,56]. Respondents were asked to assess statements reflected on product and process eco-innovation number, technological eco-innovation speed (i.e. firm agility to eco-innovative product launching and new environment friendly processes development) and technological eco-innovation quality (i.e., novelty and eco-efficiency of eco-innovative products and processes) as compared to the key competitors.

3.2.3. Operational Performance (OP)

The operational performance has been measured by two items adapted from Chi and Gursoy [50], González-Benito and González-Benito [28], and Wang and Wang [56]. The items reflected product quality and customer satisfaction as compared to key competitors.

3.2.4. Financial Performance (FP)

The four items for measuring financial performance of the firm were adapted from Chi and Gursoy [50] and Wang and Wang [56]. They reflected the increase in market share, profit growth, average return on sales and average return on investment as compared to key competitors.

3.2.5. Control Variables

Since firm size is regularly incorporated as control variable to explain the adoption of proactive environmental strategy [28,31] and technological eco-innovation [20,37], during the research an analysis has been conducted taking into account the affiliation of the studied firms in groups of entities by their employment size. Firms pollution intensity has also been considered in the analysis depending on their sector affiliation [52,57]. The surveyed firms were divided according to classification of sectors with respect to pollution intensity made by Demirel and Kesidou [57] into highly polluting sectors (food products and beverages, chemicals and chemical products, basic metals and metal products, non-metallic and mineral products, electricity production and supply and environmental protection) and moderately polluting sectors (wood and paper products, textiles, machinery and equipment, electrical machinery and apparatus, motor vehicles and transportation and others). In addition, since the export orientation might influence implementation of proactive environmental strategy [58,59] and eco-innovation [60], the performed analysis has taken into consideration geographical market reach of the surveyed firms—local, regional or national and international.

3.3. Methods Specification

In order to test the research model and hypotheses proposed, the structural equation modeling (SEM) using partial least squares (PLS) has been employed and the R package (3.2.2 version) plspm was applied [61]. The PLS path modeling is a statistical method for studying complex multivariate relationships among observed and latent variables. PLS avoids small sample size problems, has less stringent assumptions about the distribution of variables and error terms and it is suitable where theory is still insufficiently grounded and the research focuses on predicting dependent variables [62,63]. PLS path models are formally defined by two sets of linear equations: the inner model and the outer model. The inner (structural) model specifies the relationships between unobserved or latent variables, whereas the outer (measurement) model specifies the relationships between a latent variable and its observed or manifest variables [63].
The two-step approach to the data analysis has been adopted. In the first step, the measurement model was assessed to ensure reliability and validity of the constructs. In the second step, the causal paths between the constructs that composed the theoretical model were tested and the structural model was evaluated. As initial step, prior to PLS path modeling, an analysis of the factor structure of the data has been performed through principal component analysis and varimax rotation. After exploring the scales structure, the hierarchical model in PLS path modeling has been constructed. Item reliability, internal consistency and discriminant validity were used to test the reliability and validity of the model [62]. The item reliability was examined through factor loadings which indicate whether each indicator that forms the construct is highly correlated with its relevant latent variable. The internal consistency was explored by analyzing Cronbach’s alpha (C-α). In addition, composite reliability (CR) and average variance extracted (AVE) values have been tested. The discriminant validity was to determine the extent to which relevant construct differs from other constructs within the developed model. The existence of discriminant validity is confirmed when the AVE values are higher than the squared inter-correlations among the latent variables [64].
The developed structural model within PLS path modeling framework can be written in mathematical notation as:
TEI = β 10 + β 11 PES + ζ 1
OP = β 20 + β 21 PES + β 22 TEI + ζ 2
FP = β 30 + β 31 PES + β 32 TEI + β 33 OP + ζ 3
where β i 0 is the intercept term, β i j is the path coefficients, and ζ i is the error term/random disturbance term.
The structural model has been examined through the significance of the path coefficients (standardized β) that denote the strength of causal relationships between constructs and by observing the R2 values of the dependent variables. In addition, the Stone-Geisser test utilizing the cross-validated redundancy approach has been used to evaluate the predictive relevance of the model [63,65]. Finally, the goodness of fit index as suggested by Tenenhaus et al. [65] has been calculated.
The direct effects have been tested through the interpretation of the structural path coefficients. The non-parametric bootstrap estimation with 5000 subsamples was performed to assess the statistical significance of each path coefficients. In order to explore mediating effects, the method of confidence intervals (CI) suggested by Chin [66] with non-parametric bootstrap estimation with 5000 subsamples was employed. This method examines the indirect effect of independent variable (X) on dependent variable (Y) through a mediating variable (M), by calculating a confidence interval which is obtained by multiplying the path coefficients included in the mediating relationship (X→M × M→Y). The confidence interval is calculated by eliminating extreme cases utilizing the percentile formula. According to this method, the indirect effect is significant if the confidence interval for a mediating variable does not include the value zero.
Although simulation research shows that confidence intervals with bootstrap estimation is more powerful than the causal steps approach to testing mediating variable effects [67], in order to confirm the mediating effects, the causal steps approach popularized by Baron and Kenny [68] has also been tested. According to this procedure, the variable functions as a mediator if meets the following conditions: (a) independent variable X significantly accounts for the variations in the presumed mediator M, (b) mediator M significantly accounts for variations in the dependent variable Y, and (c) when paths (a) and (b) are controlled, a previously significant relationship between the independent and dependent variables is no longer significant [68]. This means that independent variable (X) significantly accounts for variations of dependent variable (Y) when no presumed mediator (M) is included in the model.
With regard to control variables, as initial step, the t-test has been used to determine if the mean values of analyzed constructs are significantly different in the established groups of surveyed firms on the basis of control variables. In order to examine effects of control variables, alternative models that consider these variables as moderators of the examined causal paths in the structural model have been estimated. Two-stage approach has been employed for all control variables (i.e., firm size, pollution intensity, market internationalization) separately [69]. It involved the creation of new models with control variables adopting values of 0 or 1 (0 for small and medium sized firms/moderately polluting sector/local, regional and national market or 1 for large sized firms/highly polluting sector/international market) and in the second stage new interactions within the structural models have been included, which had been derived by multiplying the dependent and the control variables.

4. Results

4.1. The Measurement Model Assessment

As initial step, an analysis of the data’s factor structure has been performed through principal component analysis. The exploratory factor analysis (EFA) revealed the two-factor construct for proactive environmental strategy and unidimensionality of the technological eco-innovation, operational performance and financial performance. A two-factor construct of proactive environmental strategy is similar to that obtained in previous study [32]. The revealed factors were labeled as planning and organizational practices (P&O-PES) and operational practices (O-PES). After exploring the scales structure, the hierarchical model in PLS path modeling has been constructed. The P&O-PES and O-PES were included in the model as first-order dimensions forming the second-order reflective construct of the proactive environmental strategy. The loadings of the first-order latent variables P&O-PES and O-PES on the second order construct PES were 0.927 and 0.931, respectively.
In order to assess the reliability and validity of the developed model, item reliability, internal consistency and discriminant validity were tested. [62]. As shown in Table 2, all factor loadings are greater than the minimum threshold of 0.7 recommended in the literature [62] that indicates that the survey instrument was reliable for measuring each construct. Cronbach’s α and Composite Reliability (CR) values also exceed the critical threshold of 0.7 for all constructs. This confirms the internal consistency for each construct [65,70]. The average variance extracted (AVE) values were above 0.5 for all of the scales, which demonstrates the convergent validity and justifies the use of all constructs [62,71].
Table 2. The measurement model.
ConstructItemMeanSDStandardized LoadingC-αCRAVE
P&O-PESPES-14.8601.7400.7770.9230.9370.651
PES-24.7502.0380.850
PES-34.6412.0640.863
PES-44.5961.9810.815
PES-54.5892.1160.749
PES-63.9972.3820.757
PES-74.7951.9860.834
PES-84.1952.1310.800
O-PESPES-93.9902.0180.7380.9160.9320.633
PES-104.9551.7980.860
PES-115.1271.5910.732
PES-124.9041.6700.855
PES-134.7741.8210.854
PES-144.7051.8390.775
PES-154.3391.8920.740
PES-164.5311.8770.799
TEITEI-13.2471.7270.7650.9030.9260.674
TEI-23.6611.6370.849
TEI-34.0141.7270.837
TEI-43.2641.7020.782
TEI-54.1061.6990.844
TEI-64.2091.6520.846
OPOP-14.9141.1850.8490.7030.8710.769
OP-14.9351.2380.904
FPFP-14.2671.2510.7830.8610.9060.707
FP-23.9901.4180.889
FP-33.9621.3680.861
FP-43.9761.2960.826
Table 3 shows that the existence of discriminant validity has been confirmed since the AVE values are higher than the squared inter-correlations among the latent variables [64].
Table 3. The discriminant validity.
ConstructP&O-PESO-PESTEIOPFP
P&O-PES0.651
O-PES0.5260.633
TEI0.3560.4470.674
OP0.0440.0740.1110.769
FP0.0540.0500.0790.1900.707
Diagonal figures present the AVE values. Off-diagonal figures represent the constructs’ squared correlations.

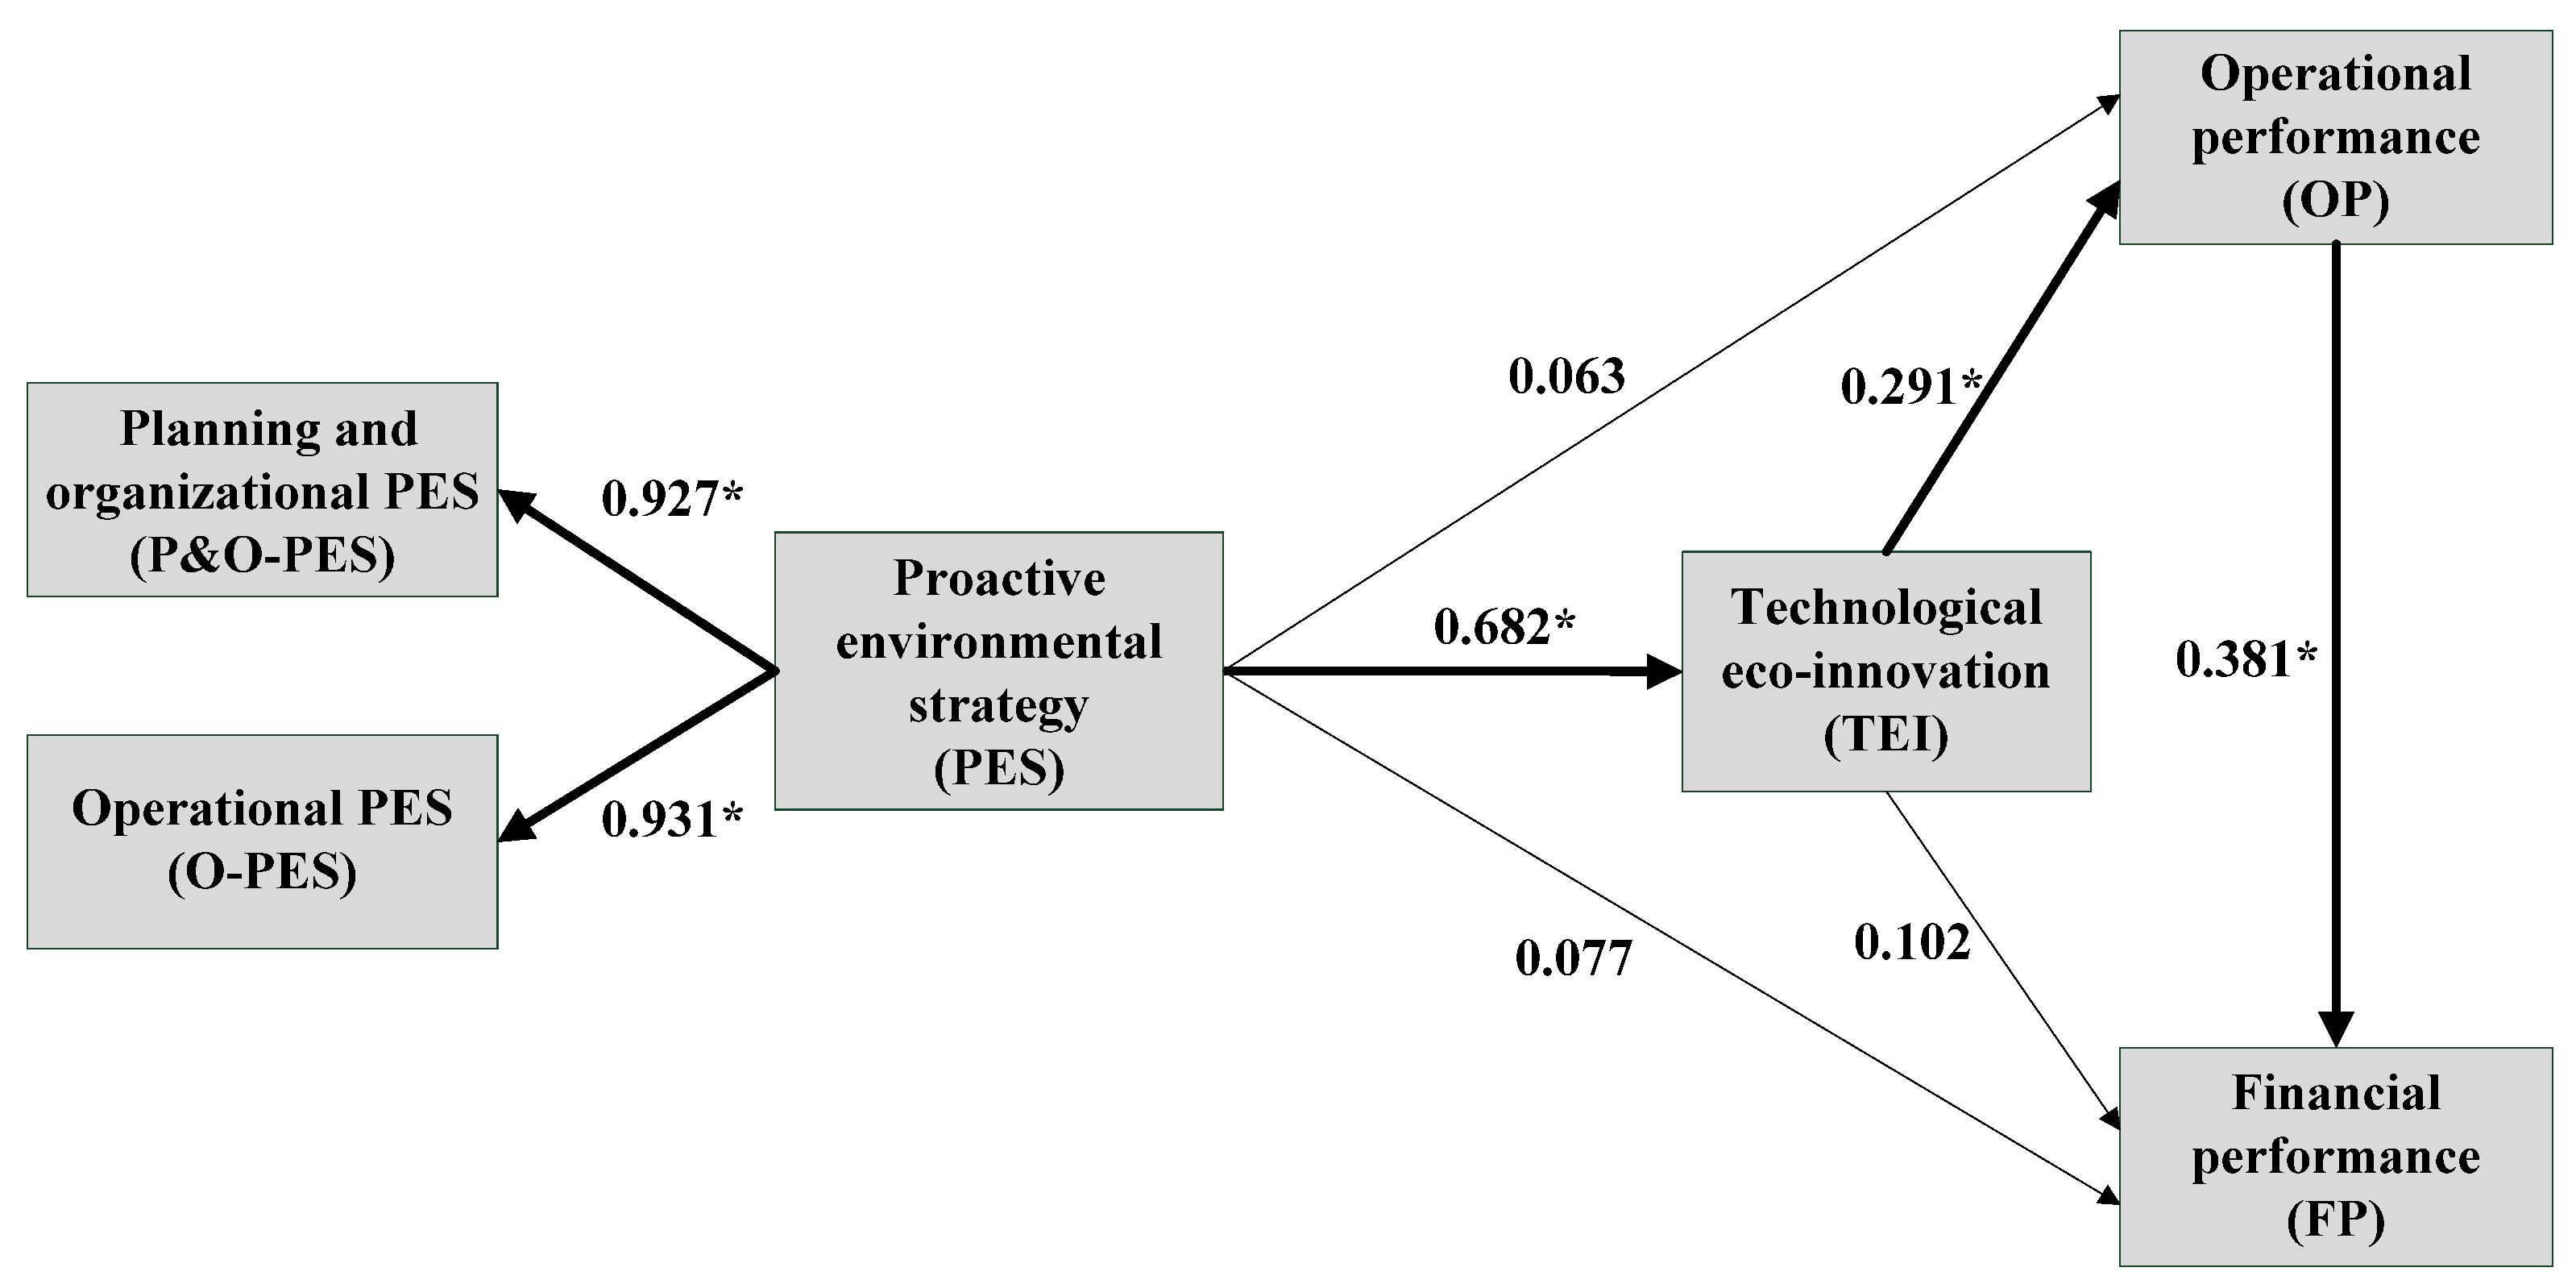
4.2. The Structural Model Assessment

The proposed structural model has been examined through the significance of the path coefficients (standardized β) and by observing the R2 values of the dependent variables. The developed model explains the 46.5% variance for technological eco-innovation, the 11.4% variance for operational performance and the 21.4% variance for financial performance. This confirms that there are variables other than proactive environmental strategy and technological eco-innovation that influence firm performance to a greater extent. However, the Stone-Geisser test revealed that the Q2 values for all three dependent variables were positive (model has predictive relevance when Q2 is greater than zero) [63,65]. Finally, the obtained value of 0.419 with regard to goodness of fit index [65] should be consider high [72]. Results of the structural model are shown in Table 4 and Figure 2.
Table 4. The results of the structural model.
HypothesisRelationshipEstimatet-Valuep-ValueR2Q2
H1.PES→TEI0.68215.888<0.001R2 (TEI) = 0.4650.31
H2a.PES→OP0.0630.8290.408R2(OP) = 0.1140.07
H3a.TEI→OP0.2913.843<0.001
H2b.PES→FP0.0771.0740.284R2(FP) = 0.2140.14
H3b.TEI→FP0.1021.3860.166
H5.OP→FP0.3816.871<0.001

4.3. The Analysis of the Direct Effects

The direct effects have been tested through the interpretation of the structural path coefficients (Table 4). The statistical significance of each path coefficients was assessed by means of bootstrap estimation with 5000 subsamples. The results have shown that proactive environmental strategy has a strong significant positive effect on technological eco-innovation (β = 0.682; p < 0.001), thus hypothesis H1 was supported. With regard to the hypotheses H2a and H2b, proactive environmental strategy is not significantly related to operational performance (β = 0.063, p > 0.10) and financial performance (β = 0.077, p > 0.10), therefore hypotheses H2a and H2b were rejected. This suggests that proactive environmental strategy does not directly affect operational and financial performance. For hypotheses H3a and H3b, the effects of technological eco-innovation on operational and financial performance, respectively, have been examined. The direct effect of technological eco-innovation on operational performance has a value β = 0.291 and is statistically significant (p < 0.001), and therefore provides support for H3a. However, the direct effect of technological eco-innovation on financial performance has a value β = 0.102 and is not statistically significant (p > 0.10), thus it does not provide support for H3b. With regard to the operational and financial performance, as expected, there was a positive statistically significant relationship (β = 0.381; p < 0.001), hence hypothesis H5 was supported. The results of direct effects testing are shown in Figure 2.
Figure 2. The research model and direct effects testing results. Source: own elaboration. Note: * significant at the 0.001 level.
Sustainability 08 00156 g002

4.4. The Analysis of the Indirect Effects

The results of the structural model suggest the possible existence of mediating relationships between analyzed constructs. Thus, this study also explores these mediating effects. The method of confidence intervals (CI) [66] with bootstrap estimation (number of subsamples equals 5000) was employed. The calculated indirect effects and total effects and relevant (99% percentile) confidence intervals are shown in Table 5.
With regard to the results of estimation presented in Table 5, proactive environmental strategy indirectly influences operational performance through technological eco-innovation (p < 0.01). Moreover, proactive environmental strategy indirectly influences financial performance through eco-innovation and operational performance (p < 0.01). Since the direct effects of proactive environmental strategy on firm performance were not significant, these findings reveal that technological eco-innovation mediates analyzed relationships respectively. This means that proactive environmental strategy does not influence firm performance directly, but does so indirectly through technological eco-innovation. It is worth mentioning that with regard to the relationship between technological eco-innovation and financial performance, the obtained results show that there is indirect effect through operational performance (p < 0.01).
Table 5. The results of the indirect effects estimation.
RelationshipIndirect Effect PathDirect Effect βIndirect Effect βTotal Effect βIndirect Effect Confidence IntervalTotal Effect Confidence Interval
PES→OPPES→TEI→OP0.0630.199*0.262*(0.042; 0.328)(0.093; 0.407)
PES→FPPES→TEI→OP→FP0.0770.169*0.246*(0.026; 0.297)(0.080; 0.389)
TEI→FPTEI→OP→FP0.1020.111*0.213*(0.030; 0.201)(0.015; 0.390)
* significant at the 0.01 level.
In order to supplement the results obtained by means of the method of confidence intervals with bootstrap estimation on the mediating role of technological eco-innovation in relationships between proactive environmental strategy and operational and financial performance, the causal steps approach suggested by Baron and Kenny has been applied [68].
The subsequent procedure steps are presented in Table A3 in Appendix Section. The analysis has revealed that when technological eco-innovation (presumed mediator) is not taken into account, proactive environmental strategy has significant effect on operational performance (p < 0.001). The next steps showed that proactive environmental strategy significantly affects technological eco-innovation (p < 0.001) and technological eco-innovation significantly influences operational performance (p < 0.001). Subsequently, when technological eco-innovation has been taken into account as mediator, the previously significant relationship between proactive environmental strategy and operational performance becomes not significant. This confirms mediating effect of technological eco-innovation according to Baron and Kenny approach [68].
The same steps have been employed in order to test the mediating role of technological eco-innovation in the relationship between proactive environmental strategy and financial performance. The obtained results, presented in Table A4 in Appendix Section, also confirm the mediating effect of technological eco-innovation on relationship between proactive environmental strategy and financial performance.
Therefore, the hypotheses H4a and H4b were fully supported.

4.5. Control Variables

As initial step, the t-test has been used to determine significant differences between the mean values of analyzed constructs in the established groups of surveyed firms on the basis of control variables. Taking into account firm size, the first group consisted of small and medium sized firms and the second group comprised large firms. The next two groups, based on pollution intensity criterion, included firms from moderately polluting sectors and firms from highly polluting sectors. Finally, two groups of firms, based on their market reach, were included in the analysis (i.e., firms operating on local, regional or national market and firms operating on international market, respectively).
With regard to firm size, the mean values of proactive environmental strategy, technological eco-innovation and financial performance were significantly different (p < 0.001) and were higher in large firms. As far as pollution intensity is concerned, only the mean values of proactive environmental strategy were significantly different (p < 0.05) and were higher in firms from highly polluting industrial sectors. By contrast, the mean values of operational and financial were significantly higher (p < 0.001) in firms operating on international market compared to firms operating on local, regional and national market.
In the next step, alternative structural models that considered control variables as moderators of the examined causal paths have been estimated. Two-stage approach has been employed for all control variables (i.e. firm size, pollution intensity and market internationalization) separately [69]. It involved the creation of new models with control variables adopting values of 0 or 1 and in the second stage new interactions within the models have been included by multiplying the dependent and the moderator variable. This estimation in the research model has indicated that for firm size and market internationalization all moderator paths were not significant. With regard to pollution intensity (PI), the estimation has revealed significant path coefficient (βPollutionIntxOP→FP = 0.477), which means that the relationships between operational and financial performance is stronger in firms from highly polluting sectors. The rest of the moderator paths that took into account pollution intensity were not significant. The details on testing the effects of control variables on causal paths in the structural model are presented in Table A5, Table A6 and Table A7 in Appendix Section.

5. Discussion and Conclusions

The aim of this study has been to explore the relationships between proactive environmental strategy, technological eco-innovation and firm performance. There is still scarce research done in this area and the existing results are not conclusive. In addition, such study has not been carried out in Poland up till now.
On the basis of empirically tested model, the findings have shown that proactive environmental strategy comprising both, planning and organizational practices as well as operational practices, strongly affects technological eco-innovation. This is in line with the assumptions from earlier research [12,39] that proactive environmental strategy seems to be crucial capability for implementation of innovative and environmentally friendly products, processes and technologies.
The obtained results do not confirm the direct effect of proactive environmental strategy on firm performance. This is consistent with some previous studies that have identified ambiguity in such a link [28,45,46]. However, the findings show the significant mediating role of technological eco-innovation in this relationship. It means that technological eco-innovation and not proactive environmental strategy allows firms to improve business performance. This suggests that organizational capabilities related to proactive environmental strategy do not necessarily create competitive advantage. What is crucial might be the firm’s effort to make effective use of these capabilities in development of technological eco-innovation that actually contributes to better performance. Thus, sufficient orientation of business activities and beyond-compliance behaviors may allow to use technological eco-innovation to proactively enhance and sustain adequate capabilities and satisfactory business performance.
It should be emphasized that previous research showed that among the different difficulties affecting proactive environmental strategy, only endemic limitations prevent firms from advancing in such a strategy [52]. This shows how important the attitudes and decisions of managers are, for they determine overcoming internal barriers in the development of organizational capabilities linking proactive environmental strategy with technological eco-innovation. Their efficiency facilitates firms with more rapidly adapt to environmental changes and to create market value.
This study confirms that technological eco-innovation can successfully contribute to achieving differentiation for environmentally conscious customers [41]. Customer satisfaction and better product quality resulting from knowledge based design and development of eco-innovation [73,74] can improve firm’s operational performance and subsequently its financial performance. This means that through technological eco-innovation firms can not only improve their corporate image and achieve better customer satisfaction but they can also generate increase in market share, profit growth, return on sales, etc. The obtained results suggest that it is even more important for firms from highly polluting industrial sectors. Since the technological eco-innovation reduces environmental impact and improves business performance, this research proves that it simultaneously contributes to environmental and economic pillars of sustainable development.
This research has some limitations that must be considered. First, it relies on self-reported data and the single informants as the source of information. In order to get around this limitation, the absence of common method variance has been tested. The Harman’s single factor test has been applied [75]. The results confirmed the lack of a unique factor and that the one general factor has not accumulated the majority of the variance. Second, subjective measures of firm performance have been employed. It is possible that there are gaps between subjective and objective measures. Nevertheless, prior research has confirmed that subjective measures of firm performance relative to key competitors are linked with objective measures with a high degree of reliability [76]. Third, this study is based on cross-sectional data. A longitudinal sample collected over multiple points of time would help support the obtained results. Fourth, links between limited number of constructs were examined. Therefore, future research should examine additional variables that are likely to influence the explored relationships. The combined theoretical framework, which merges different perspectives, should be considered in order to provide comprehensive picture of links between proactive environmental strategy, technological eco-innovation and firm performance [25]. Finally, the obtained results do not imply definitive conclusion about the analyzed relationships and might have limited generalizability due to the sectors and geographical specificity of the researched sample.

Acknowledgments

The research presented in the article was supported by grant UMO-2011/01/D/HS4/03997 from the Polish National Science Centre. The author would like to thank two anonymous reviewers for their very helpful comments and suggestions. The author is also grateful to the participants of the 25th IBIMA conference on Innovation Vision 2020: from Regional Development Sustainability to Global Economic Growth held in Amsterdam for their constructive comments and discussion on an earlier version of this paper.

Conflicts of Interest

The author declares no conflict of interest.

Appendix

Table A1. The results of non-response bias testing.
ConstructEarly Respondents (n = 88)Late Respondents (n = 88)t-Valuep-Value
MeanSDMeanSD
P&O-PES4.5371.5984.3531.7730.8310.407
O-PES4.5661.4574.5181.5430.2130.831
TEI3.6991.4513.6131.4050.3960.693
OP5.0510.9595.0011.1790.3160.753
FP4.1481.2344.1021.0590.2620.793
Table A2. The characteristics of question items for the analyzed measures.
Variable CodeDefinition of Question Items for the Analyzed Measures
Proactive environmental strategy
PES-1Environmental issues are high priorities in our organization’s objectives and strategy
PES-2We have explicitly defined and documented environmental policy
PES-3We have clearly defined and documented environmental objectives and long-term environmental plans
PES-4Our top management regularly measures and assesses the environmental performance
PES-5We conduct periodic environmental reviews and internal audits
PES-6Our organizational structure includes management representative responsible entirely for environmental issues
PES-7We have management representative responsible for environmental issues actively participating in formulation of firm’s objectives and strategy
PES-8Our employees participate in environmental trainings
PES-9We conduct periodical environmental impact assessments of products with regard to all stages of their life cycle
PES-10We take into account environmental criteria in design and development of products
PES-11We use cleaner technology and environmental friendly processes
PES-12We take into account environmental issues in design and development of production methods, maintenance and logistics
PES-13We take into account environmental criteria during suppliers selection
PES-14We require our suppliers and subcontractors to improve environmental activities and to keep relevant environmental standards
PES-15We consider environmental issues during selection of mode of transport and distribution channels
PES-16We emphasize commitment to environmental protection in marketing activities
Technological eco-innovation (during last 3 years as compared to key competitors)
TEI-1We usually were the first on the market to introduce new eco-innovative products
TEI-2We have introduced more products that are eco-innovative
TEI-3We have introduced products that are more eco-innovative
TEI-4We usually were the first to introduce new, environment friendly methods of manufacturing, maintenance and logistics
TEI-5We have introduced more new or significantly improved processes bringing environmental benefits
TEI-6We have been improving environmental parameters of our processes more effectively
Operational performance (during last 3 years as compared to key competitors)
OP-1Product quality
OP-2Customer satisfaction
Financial performance (during last 3 years as compared to key competitors)
FP-1Increase in market share
FP-2Profit growth
FP-3Return on sales
FP-4Return on investment
Table A3. Testing TEI as mediator of relationship between PES and OP—causal steps approach.
Causal PathEstimatet-Valuep-Value
Model (X→Y)
PES→OP0.2774.904<0.001
Model (X→M)
PES→TEI0.68716.112<0.001
Model (X, M→Y)
TEI→OP0.2803.707<0.001
PES→OP0.0821.0830.280
Model (X→M; M→Y; X→Y)
PES→TEI0.68616.044< 0.001
TEI→OP0.2913.820< 0.001
PES→OP0.0650.8510.396
Table A4. Testing TEI as mediator of relationship between PES and FP—causal steps approach.
Causal PathEstimatet-Valuep-Value
Model (X→Y)
PES→FP0.2584.554<0.001
Model (X→M)
PES→TEI0.68716.112<0.001
Model (X, M→Y)
TEI→FP0.2242.931<0.01
PES→FP0.1071.4050.161
Model (X→M; M→Y; X→Y)
PES→TEI0.68616.038<0.001
TEI→FP0.2252.918<0.01
PES→FP0.1011.3060.192
Table A5. Testing firm size as a control variable.
RelationshipEstimatet-Valuep-Value
Size × PES→TEI−0.138−0.6430.520
PES→TEI0.68014.422<0.001
Size × PES→OP−0.535−1.5990.111
Size × TEI→OP0.2590.9580.339
PES→OP0,0981.2010.231
TEI→OP0.2663.487<0.001
Size × PES→FP0.0100.3090.757
Size × TEI→FP0.2150.7910.430
Size × OP→FP−0.216−0.7020.483
PES→FP0.0530.6860.493
TEI→FP0.0710.9100.364
OP→FP0.4016.744<0.001
Table A6. Testing pollution intensity as a control variable.
RelationshipEstimatet-Valuep-Value
Pollution Int. × PES→TEI−0.042−0.2120.831
PES→TEI0.70412.378<0.001
Pollution Int. × PES→OP0.1890.6940.488
Pollution Int. × TEI→OP0.2120.8970.371
PES→OP0.1131.0820.280
TEI→OP0.2412.484<0.01
Pollution Int. × PES→FP0.0720.2800.780
Pollution Int. × TEI→FP0.0320.1330.895
Pollution Int. × OP→FP0.4772.002<0.05
PES→FP0.0970.9890.323
TEI→FP0.1001.0050.316
OP→FP0.4756.612<0.001
Table A7. Testing market internationalization as a control variable.
RelationshipEstimatet-Valuep-Value
Market × PES→TEI0.0210.4500.653
PES→TEI0.67214.693<0.001
Market × PES→OP−0.395−1.5640.118
Market × TEI→OP0.3421.3560.176
PES→OP0.0770.9820.327
TEI→OP0.2633.356<0.001
Market × PES→FP0.0760.2860.775
Market × TEI→FP0.2300.8480.397
Market × OP→FP−0.224−1.0330.302
PES→FP0.0520.6720.502
TEI→FP0.0760.9790.328
OP→FP0.3816.370<0.001

References

  1. King, A.A.; Lenox, M.J. Does it really pay to be green? An empirical study of firm environmental and financial performance. J. Ind. Ecol. 2001, 5, 105–116. [Google Scholar] [CrossRef]
  2. Blanco, E.; Rey-Maquieira, J.; Lozano, J. The economic impacts of voluntary environmental performance of firms: A critical review. J. Econ. Surv. 2009, 23, 462–502. [Google Scholar] [CrossRef]
  3. Molina-Azorín, J.F.; Claver-Cortés, E.; López-Gamero, M.D.; Tarí, J.J. Green management and financial performance: A literature review. Manag. Decis. 2009, 47, 1080–1100. [Google Scholar]
  4. Delmas, M.; Hoffman, V.; Kuss, M. Under the tip of the iceberg: Absorptive capacity, environmental strategy and competitive advantage. Bus. Soc. 2011, 50, 116–154. [Google Scholar] [CrossRef]
  5. Cheng, C.C.J.; Yang, C.L.; Sheu, C. The link between eco-innovation and business performance: A Taiwanese industry context. J. Clean. Prod. 2014, 64, 81–90. [Google Scholar] [CrossRef]
  6. Deutz, P.; Ioppolo, G. From Theory to Practice: Enhancing the Potential Policy Impact of Industrial Ecology. Sustainability 2015, 7, 2259–2273. [Google Scholar] [CrossRef]
  7. Bansal, P.; Roth, K. Why companies go green: A model of ecological responsiveness. Acad. Manag. J. 2000, 43, 717–736. [Google Scholar] [CrossRef]
  8. Buysse, K.; Verbeke, A. Proactive environmental strategies: A stakeholder management perspective. Strateg. Manag. J. 2003, 24, 453–470. [Google Scholar] [CrossRef]
  9. Henriques, I.; Sadorsky, P. The relationship between environmental commitment and managerial perceptions of stakeholder importance. Acad. Manag. J. 1999, 42, 87–99. [Google Scholar] [CrossRef]
  10. Hart, S.L. Natural-resource-based view of the firm. Acad. Manag. Rev. 1995, 20, 986–1014. [Google Scholar]
  11. Hart, S.L.; Dowell, G. Invited editorial: A natural-resource-based view of the firm fifteen years after. J. Manag. 2011, 37, 1464–1479. [Google Scholar] [CrossRef]
  12. Sharma, S.; Vredenburg, H. Proactive corporate environmental strategy and the development of competitively valuable organizational capabilities. Strateg. Manag. J. 1998, 19, 729–753. [Google Scholar] [CrossRef]
  13. Christmann, P. Effects of “best practices” of environmental management on cost competitiveness: The role of complementary assets. Acad Manag. J. 2000, 43, 663–680. [Google Scholar] [CrossRef]
  14. Aragón-Correa, J.A.; Sharma, S. A contingent resource-based view of proactive corporate environmental strategy. Acad. Manag. Rev. 2003, 28, 71–88. [Google Scholar]
  15. Rennings, K. Redefining innovation—Eco-innovation research and the contribution from ecological economics. Ecol. Econ. 2000, 32, 319–332. [Google Scholar] [CrossRef]
  16. Oltra, V. Environmental Innovation and Industrial Dynamics: The Contributions of Evolutionary Economics. Working Papers of GREThA, (28). 2008. Available online: http://ideas.repec.org/p/grt/wpegrt/2008–28.html (accessed on 10 October 2015).
  17. Rehfeld, K.M.; Rennings, K.; Ziegler, A. Integrated product policy and environmental product innovations: An empirical analysis. Ecol. Econ. 2007, 61, 91–100. [Google Scholar] [CrossRef]
  18. Horbach, J. Determinants of environmental innovation—new evidence from German panel data sources. Res. Policy 2008, 37, 163–173. [Google Scholar] [CrossRef]
  19. Triguero, A.; Moreno-Mondéjar, L.; Davia, M.A. Drivers of different types of eco-innovation in European SMEs. Ecol. Econ. 2013, 92, 25–33. [Google Scholar] [CrossRef]
  20. De Marchi, V. Environmental innovation and R&D cooperation: Empirical evidence from Spanish manufacturing firms. Res. Policy 2012, 41, 614–623. [Google Scholar]
  21. Li, Y. Environmental innovation practices and performance: Moderating effect of resource commitment. J. Clean. Prod. 2014, 66, 450–458. [Google Scholar] [CrossRef]
  22. Weng, H.-H.R.; Chen, J.-S.; Chen, P.-C. Effects of Green Innovation on Environmental and Corporate Performance: A Stakeholder Perspective. Sustainability 2015, 7, 4997–5026. [Google Scholar] [CrossRef]
  23. Chen, Y.S. The driver of green innovation and green image—green core competence. J. Bus. Ethics. 2008, 81, 531–543. [Google Scholar] [CrossRef]
  24. Yarahmadi, M.; Higgins, P.G. Motivations towards environmental innovation: A conceptual framework for multiparty cooperation. Eur. J. Innov. Manag. 2012, 15, 400–420. [Google Scholar]
  25. Del Río, P.; Peñasco, C.; Romero-Jordán, R. What drives eco-innovators? A critical review of the empirical literature based on econometric methods. J. Clean. Prod. 2016, 112, 2158–2170. [Google Scholar] [CrossRef]
  26. EIO. Europe in transition: Paving the way to a green economy through eco-innovation. 2013. Available online: http://www.eco-innovation.eu/images/stories/Reports/EIO_Annual_Report_2012.pdf (accessed on 28 September 2015).
  27. OECD. Sustainable Manufacturing and Eco-Innovation. Framework, Practices and Measurement. 2009. Available online: http://www.oecd.org/innovation/inno/43423689.pdf (accessed on 15 October 2015).
  28. González-Benito, J.; González-Benito, O. Environmental proactivity and business performance: An empirical analysis. Omega-Int. J. Manag. Sci. 2005, 33, 1–15. [Google Scholar] [CrossRef]
  29. Hunt, C.B.; Auster, E.R. Proactive environmental management: Avoiding the toxic trap. Sloan Manag. Rev. 1990, 31, 7–18. [Google Scholar]
  30. Roome, N. Developing environmental management systems. Bus. Strat. Environ. 1992, 1, 11–24. [Google Scholar] [CrossRef]
  31. Aragón-Correa, J.A. Strategic proactivity and firm approach to the natural environment. Acad. Manag. J. 1998, 41, 556–567. [Google Scholar] [CrossRef]
  32. Carballo-Penela, A.; Castromán-Diz, J.L. Environmental Policies for Sustainable Development: An Analysis of the Drivers of Proactive Environmental Strategies in the Service Sector. Bus. Strat. Environ. 2015, 24, 802–818. [Google Scholar] [CrossRef]
  33. Fussler, C.; James, P. Driving Eco-Innovation: A Breakthrough Discipline for Innovation and Sustainability; Pitman Publishing: London, UK, 1996. [Google Scholar]
  34. Kemp, R.; Pearson, P. Final Report MEI Project about Measuring Eco-Innovation. Maastricht. 2008. Available online: http://www.oecd.org/env/consumption-innovation/43960830.pdf (accessed on 5 September 2015).
  35. European Commission. Communication from the Commission to the European Parliament, the Council, the European Economic and Social Committee and the Committee of the Regions. Innovation for a Sustainable Future—The Eco-Innovation Action Plan (Eco-AP). 2011. Available online: http://eur-lex.europa.eu/legal-content/EN/TXT/?uri=CELEX%3A52011DC0899 (accessed on 5 September 2015).
  36. Organization for Economic Co-Operation and Development. The Measurement of Scientific and Technological Activities: Guidelines for Collecting and Interpreting Innovation Data, 3rd ed.; OECD: Paris, France, 2005. [Google Scholar]
  37. Ziegler, A.; Nogareda, J.S. Environmental management systems and technological environmental innovations: Exploring the causal relationship. Res. Policy 2009, 38, 885–893. [Google Scholar] [CrossRef] [Green Version]
  38. Ioppolo, G.; Cucurachi, S.; Salomone, R.; Saija, G.; Ciraolo, L. Industrial ecology and environmental lean management: Lights and shadows. Sustainability 2014, 6, 6362–6376. [Google Scholar] [CrossRef]
  39. Menguc, B.; Ozanne, L.K. Challenges of the “green imperative”: A natural resource-based approach to the environmental orientation-business performance relationship. J. Bus. Res. 2005, 58, 430–438. [Google Scholar] [CrossRef]
  40. Clarkson, P.; Li, Y.; Richardson, G.; Vasvari, F. Does it really pay to be green? Determinants and consequences of proactive environmental strategies. J. Account. Public Pol. 2011, 30, 122–144. [Google Scholar] [CrossRef]
  41. López-Gamero, M.D.; Molina-Azorin, J.F.; Claver-Cortés, E. The whole relationship between environmental variables and firm performance: Competitive advantage and firm resources as mediator variables. J. Environ. Manag. 2009, 90, 3110–3121. [Google Scholar] [CrossRef] [PubMed]
  42. Ghisetti, C.; Rennings, K. Environmental innovations and profitability: How does it pay to be green? An empirical analysis on the German innovation survey. J. Clean. Prod. 2014, 75, 106–117. [Google Scholar] [CrossRef]
  43. Aragón-Correa, J.A.; Rubio-López, E.A. Proactive corporate environmental strategies: Myths and misunderstandings. Long Range Plan. 2007, 40, 357–381. [Google Scholar] [CrossRef]
  44. Wahba, H. Does the market value corporate environmental responsibility? An empirical examination. Corp. Soc. Responsib. Environ. Manag. 2008, 15, 89–99. [Google Scholar] [CrossRef]
  45. Wagner, M. How to reconcile environmental and economic performance to improve corporate sustainability: Corporate environmental strategies in the European paper industry. J. Environ. Manag. 2005, 76, 105–118. [Google Scholar] [CrossRef] [PubMed]
  46. Watson, K.; Klingenberg, B.; Polito, T.; Geurts, T. Impact of environmental management system implementation on financial performance. Manag. Environ. Qual. 2004, 15, 622–628. [Google Scholar] [CrossRef]
  47. Klassen, R.D.; Whybark, D.C. The impact of environmental technologies on manufacturing performance. Acad. Manag. J. 1998, 42, 599–615. [Google Scholar] [CrossRef]
  48. Salvadó, J.A.; de Castro, G.M.; López, J.E.N.; Verde, M.D. Environmental Innovation and Firm Performance. A Natural Resource-Based View; Palgrave Macmillan: Basingstoke, UK, 2012. [Google Scholar]
  49. Boons, F.; Wagner, M. Assessing the relationship between economic and ecological performance: Distinguishing system levels and the role of innovation. Ecol. Econ. 2009, 68, 1908–1914. [Google Scholar] [CrossRef]
  50. Chi, C.G.; Gursoy, D. Employee satisfaction, customer satisfaction, and financial performance: An empirical examination. Int. J. Hosp. Manag. 2009, 28, 245–253. [Google Scholar] [CrossRef]
  51. Li, Y.; Wang, L.; Liu, Y. Organisational learning, product quality and performance: The moderating effect of social ties in Chinese cross-border outsourcing. Int. J. Prod. Res. 2011, 49, 159–182. [Google Scholar] [CrossRef]
  52. Murillo-Luna, J.L.; Garcés-Ayerbe, C.; Rivera-Torres, P. Barriers to the adoption of proactive environmental strategies. J. Clean. Prod. 2011, 19, 1417–1425. [Google Scholar] [CrossRef]
  53. Liu, X.; Liu, B.; Shishime, T.; Yu, Q.; Bi, J.; Fujitsuka, T. An empirical study on the driving mechanism of proactive corporate environmental management in China. J. Environ. Manag. 2010, 91, 1707–1717. [Google Scholar] [CrossRef] [PubMed]
  54. Singh, N.; Jain, S.; Sharma, P. Determinants of proactive environmental management practices in Indian firms: An empirical study. J. Clean. Prod. 2014, 66, 469–478. [Google Scholar] [CrossRef]
  55. Armstrong, J.S.; Overton, T.S. Estimating nonresponse bias in mail surveys. J. Mark. Res. 1977, 14, 396–402. [Google Scholar] [CrossRef]
  56. Wang, Z.; Wang, N. Knowledge sharing, innovation and firm performance. Expert Syst. Appl. 2012, 39, 8899–8908. [Google Scholar] [CrossRef]
  57. Demirel, P.; Kesidou, E. Stimulating different types of eco-innovation in the UK: Government policies and firm motivations. Ecol. Econ. 2011, 70, 1546–1557. [Google Scholar] [CrossRef]
  58. Martín-Tapia, I.; Aragón-Correa, J.A.; Rueda-Manzanares, A. Environmental strategy and exports in medium, small and micro-enterprises. J. World Bus. 2010, 45, 266–275. [Google Scholar] [CrossRef]
  59. Darnall, N.; Henriques, I.; Sadorsky, P. Do environmental management systems improve business performance in an international setting? J. Int. Manag. 2008, 14, 364–376. [Google Scholar] [CrossRef]
  60. Cainelli, G.; Mazzanti, M.; Montresor, S. Environmental innovations, local networks and internationalization. Ind. Innov. 2012, 19, 697–734. [Google Scholar] [CrossRef]
  61. Sanchez, G. PLS Path Modeling with R. Berkeley, 2013, Trowchez Editions ed. Available online: http://gastonsanchez.com/PLS_Path_Modeling_with_R.pdf (accessed on 15 September 2015).
  62. Chin, W.W. The partial least squares approach to structural equation modeling. In Modern Methods for Business Research; Marcoulides, G.A., Ed.; Taylor & Francis: Oxfordshire, UK, 1998; pp. 295–336. [Google Scholar]
  63. Henseler, J.; Ringle, C.M.; Sinkovics, R.R. The use of partial least squares path modeling in international marketing. Adv. Int. Mark. 2009, 20, 277–319. [Google Scholar]
  64. Barclay, D.; Higgins, C.; Thompson, R. The Partial Least Squares (PLS). Approach to causal modeling: Personal computer adoption and use as an illustration. Technol. Stud. 1995, 2, 285–309. [Google Scholar]
  65. Tenenhaus, M.; Vinzi, V.E.; Chatelin, Y.M.; Lauro, C. PLS path modeling. Comput. Stat. Data Anal. 2005, 48, 159–205. [Google Scholar] [CrossRef]
  66. Chin, W.W. How to write up and report PLS analyses. In Handbook of Partial Least Squares; Springer: Berlin/Heidelberg, Germany, 2010; pp. 655–690. [Google Scholar]
  67. Hayes, A.F. Beyond Baron and Kenny: Statistical Mediation Analysis in the New Millennium. Commun. Monogr. 2009, 76, 408–420. [Google Scholar] [CrossRef]
  68. Baron, R.M.; Kenny, D.A. The moderator-mediator variable distinction in social psychological research: Conceptual, strategic, and statistical considerations. J. Pers. Soc. Psychol. 1986, 51, 1173–1182. [Google Scholar] [CrossRef] [PubMed]
  69. Henseler, J.; Chin, W.W. A Comparison of Approaches for the Analysis of Interaction Effects Between Latent Variables Using Partial Least Squares Path Modeling. Struct. Equ. Model. 2010, 17, 82–109. [Google Scholar] [CrossRef]
  70. Nunnally, J.C.; Bernstein, I.H. Psychometric Theory; McGraw-Hill: New York, NY, USA, 1994. [Google Scholar]
  71. Fornell, C.; Larcker, D.F. Evaluating structural equation models with unobservable variables and measurement error. J. Mark. Res. 1981, 18, 39–50. [Google Scholar] [CrossRef]
  72. Wetzels, M.; Odekerken-Schroder, G.; Van Oppen, C. Using PLS path modeling for assessing hierarchical construct models: Guidelines and Empirical Illustration. MIS Quart. 2009, 33, 177–195. [Google Scholar]
  73. Baran, J.; Janik, A.; Ryszko, A. Knowledge based eco-innovative product design and development—Conceptual model built on life cycle approach. In Proceedings of International Multidisciplinary Scientific Conference on Social Sciences and Arts SGEM2014, Albena, Bulgaria, 1–9 September 2014; Volume 1, pp. 775–787.
  74. Baran, J.; Janik, A.; Ryszko, A.; Szafraniec, M. Making eco-innovation measurable—Are we moving towards diversity or uniformity of tools and indicators? In Proceedings of 2nd International Multidisciplinary Scientific Conference on Social Sciences and Arts SGEM2015, Albena, Bulgaria, 26 August–1 September 2015; Volume 2, pp. 787–798.
  75. Podsakoff, P.M.; MacKenzie, S.; Lee, J.; Podsakoff, N. Common method biases in behavioral research: A critical review of the literature and recommended remedies. J. Appl. Psychol. 2003, 88, 879–903. [Google Scholar] [CrossRef] [PubMed]
  76. Venkatraman, N.; Ramanujam, V. Measurement of business performance in strategy research: A comparison of approaches. Acad. Manag. Rev. 1986, 11, 801–814. [Google Scholar]

