
An Approach for R&D Partner Selection in Alliances between Large Companies, and Small and Medium Enterprises (SMEs): Application of Bayesian Network and Patent Analysis


Abstract
:1. Introduction
2. Theoretical Background
2.1. R&D Partner Selection for Alliances between Large Firms and SMEs

| Concepts | Methods | Large Firms Level | SMEs Level | Researchers |
|---|---|---|---|---|
| Purpose of development | Qulitative analysis | Product platform development | Product development basd on key technology | [26] |
| Global operation | Structural Equation modeling | Focusing on global market | Focusing on domestic market | [27] |
| Knowledge requirements | Probit model | Preferring internal knowledge | Preferring external knowledge | [28] |
| Collaboration effect | Probit model | An influence on process | An influence on products | [7] |
| Appropriability | Univariate general linear model | Stong appropriability | Weak appropriability | [29] |
2.2. Bayesian Network
3. Proposed Approach
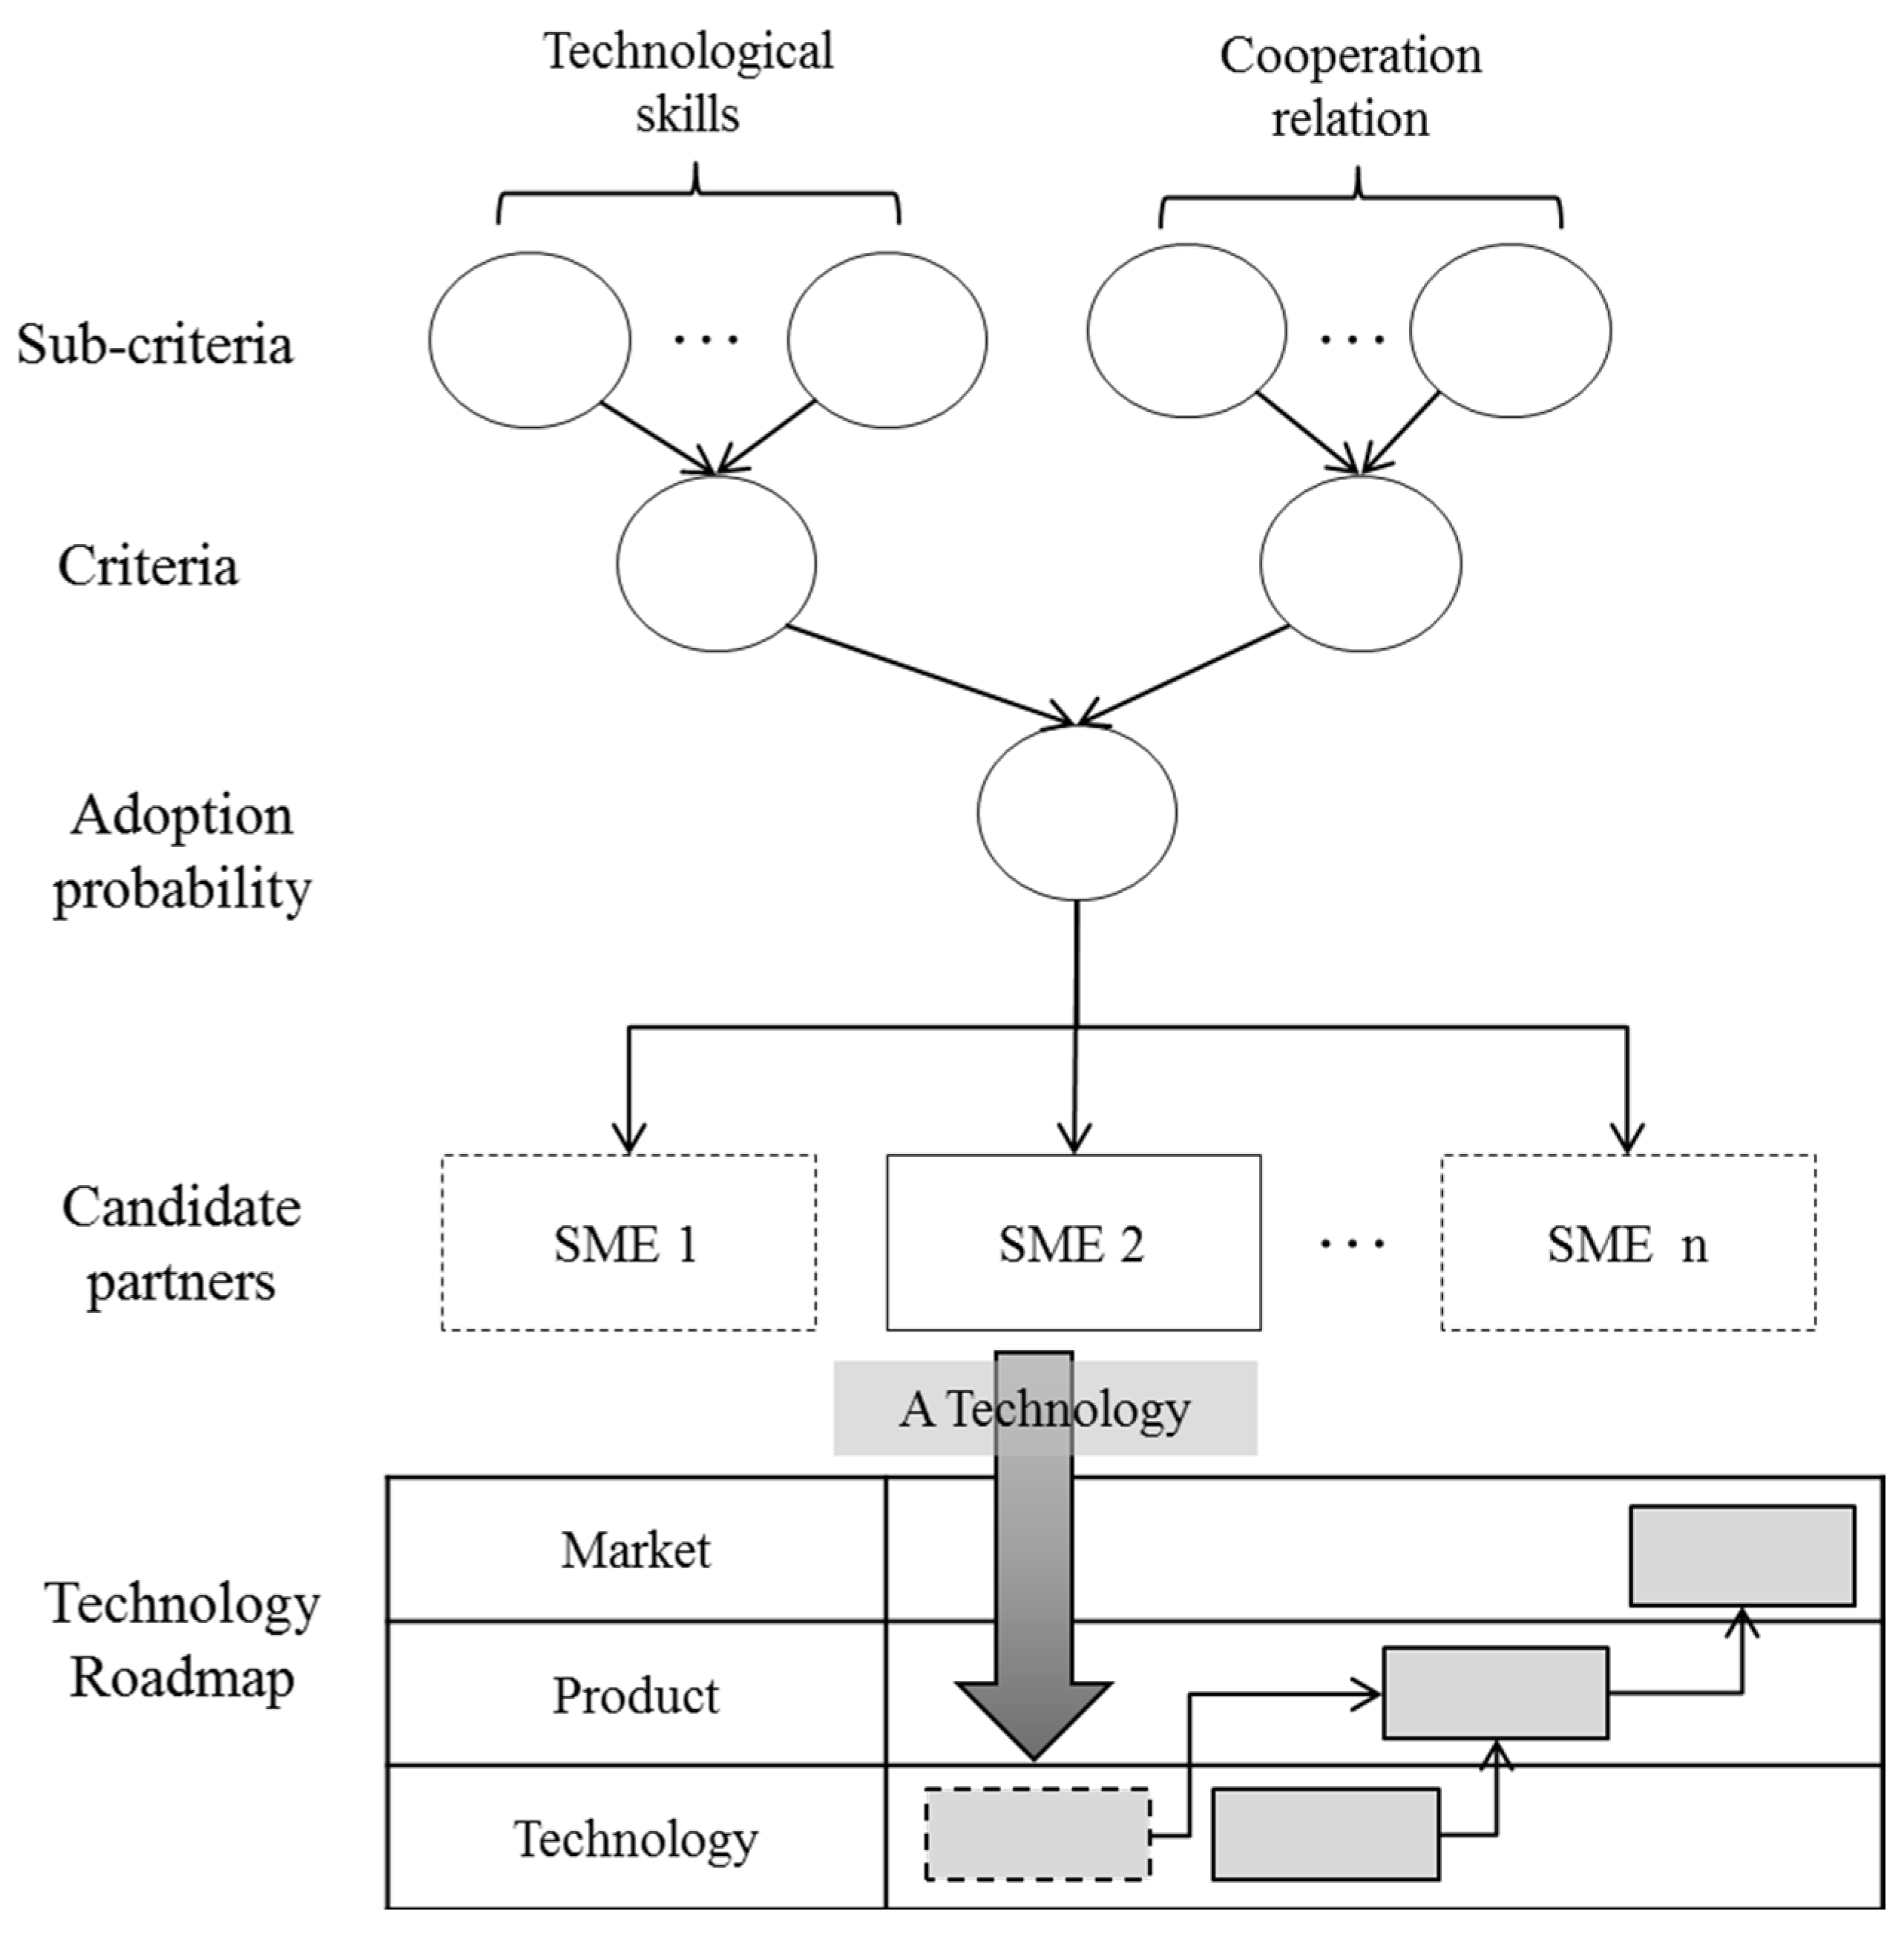
3.1. Basic Concepts

3.2. Data
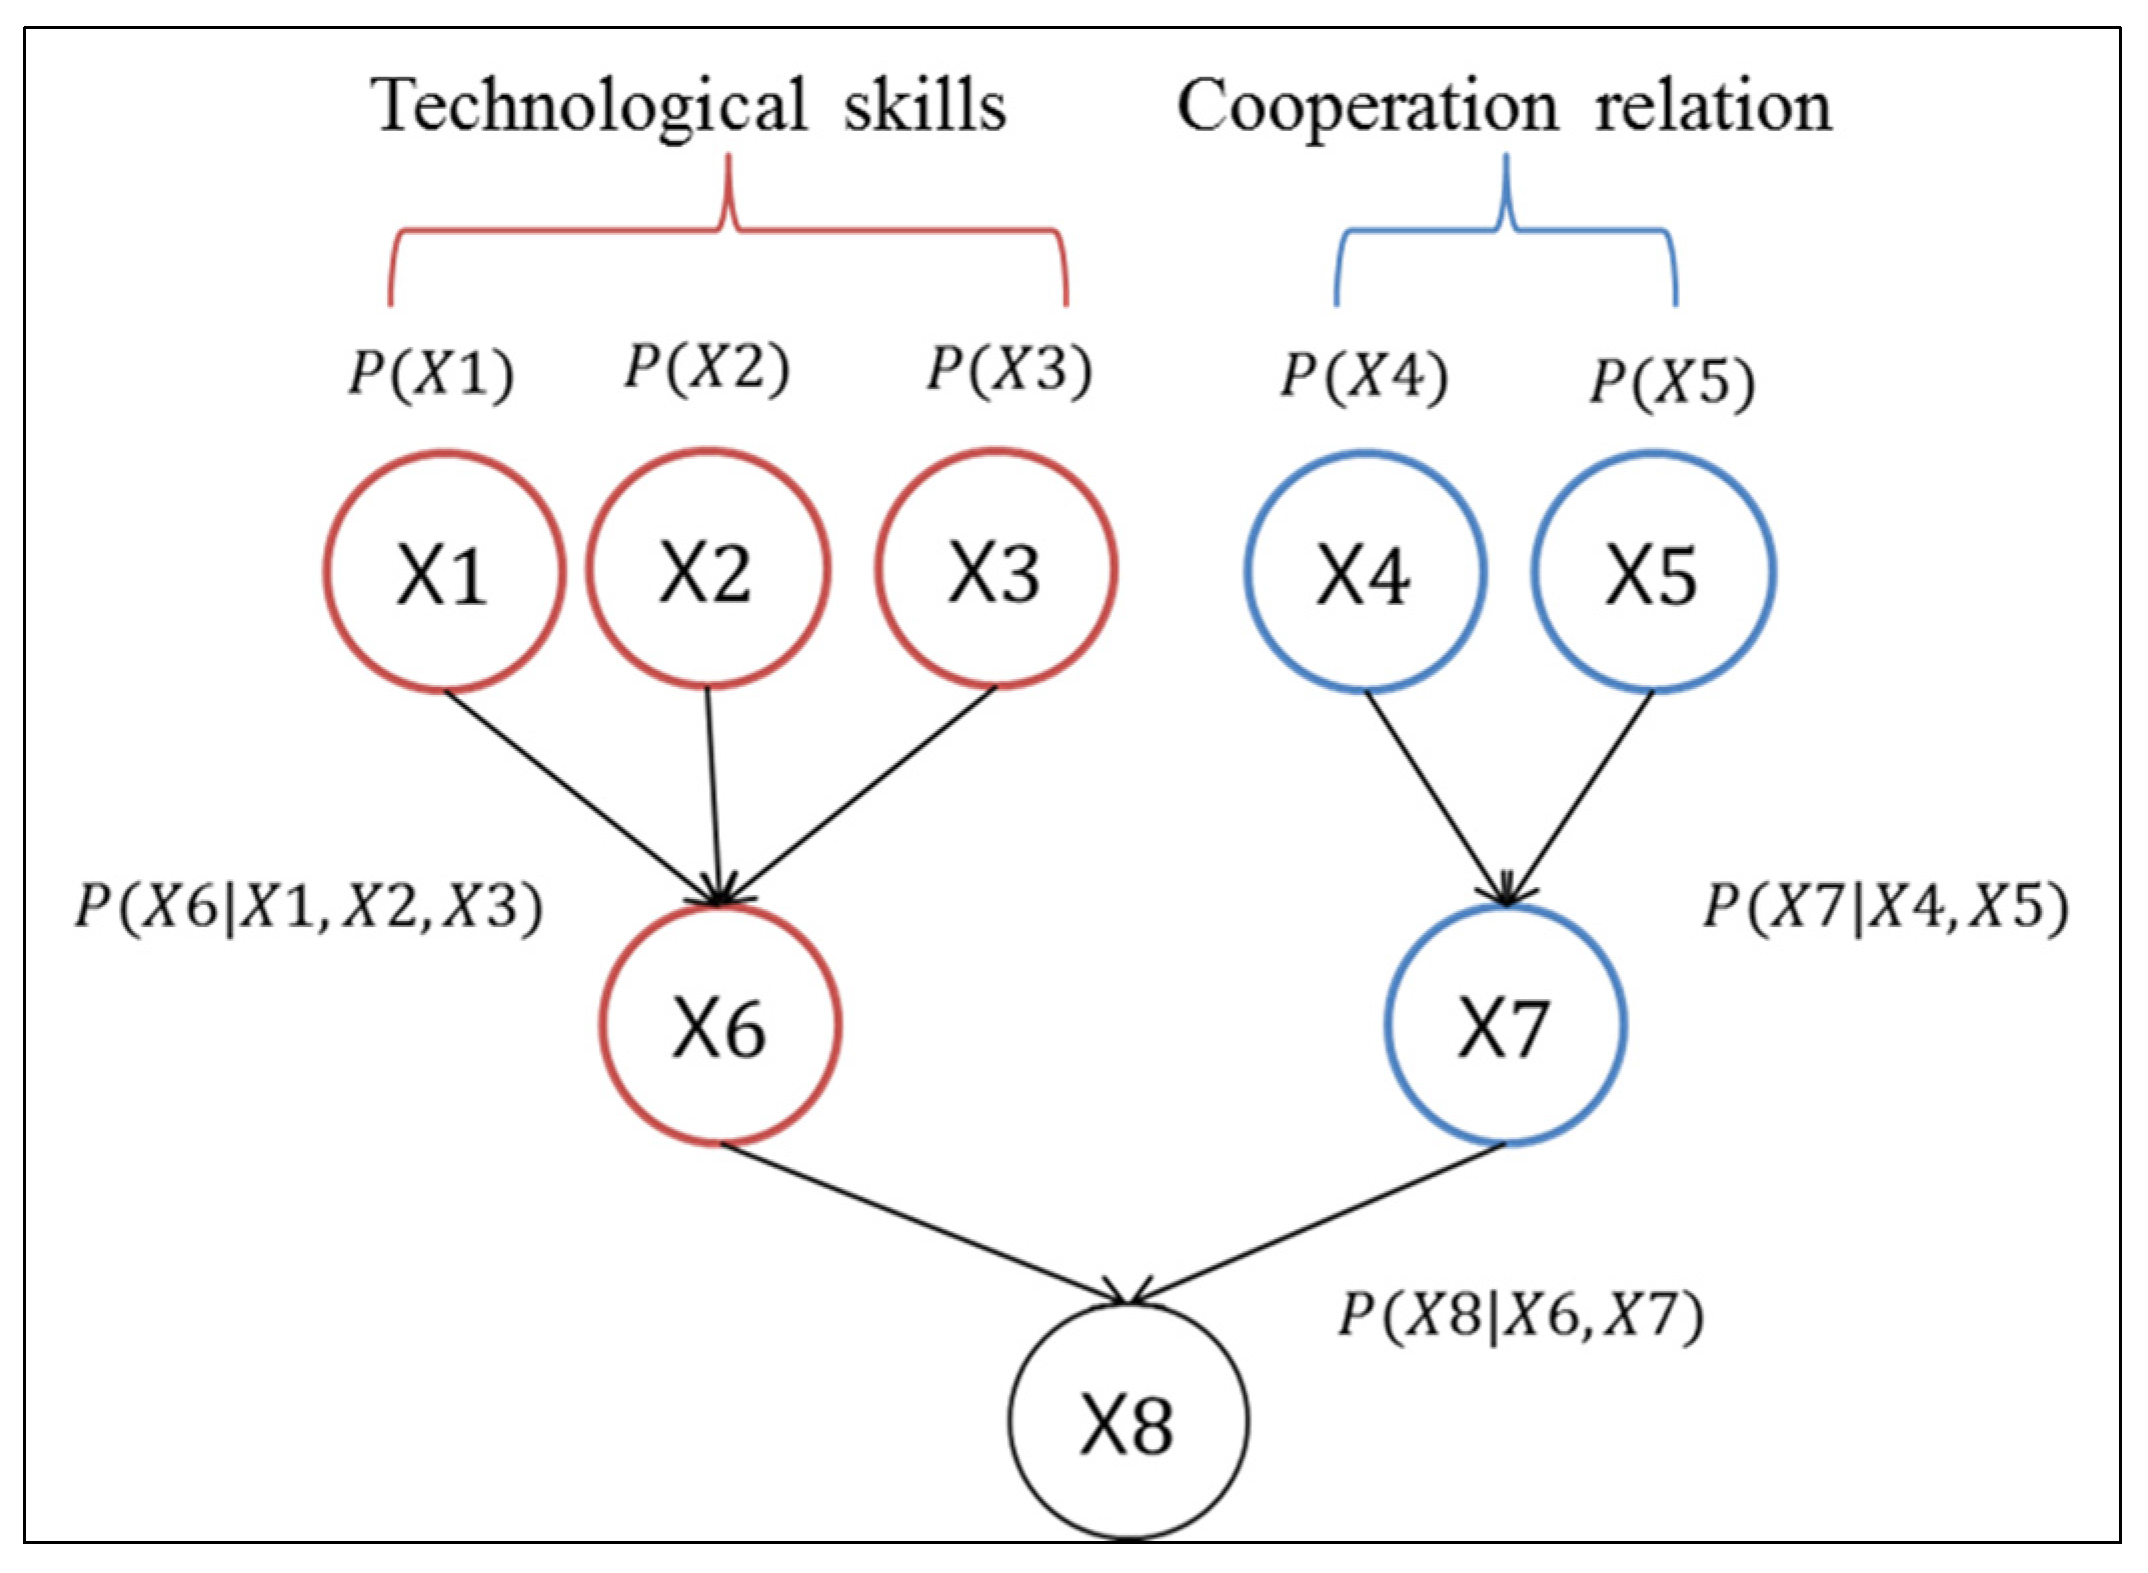
3.3. Criteria
| Node Label | Name | Operational Definition | Type | Section | Dividing Method |
|---|---|---|---|---|---|
| X1 | Technical experience (TE) | The number of patents in a SME | Small firm | High/Medium/Low | Dividing into three equal parts |
| X2 | Absorptive capacity (AC) | Average value of backward citation in a SME’s patents | Small firm | Good/Fair/Poor | Dividing into three equal parts |
| X3 | Technology lifecycle (TL) | The stage according to ratio of recent patents in a SME | Small firm | Introduction (I)/Growth & Maturity (G)/Decline (D) | TL = 1/ 0 < TL < 1/TL = 0 |
| X4 | Collaboration experience (CE) | The number of joint patents regardless of partner types -1 | Small firm | Yes/No | Experienceor not |
| X5 | Geographical distance (GD) | The distance between large and small assignees’ country | Small and large firms | Nearness (N)/Common (C)/Far (F) | Dividing into three equal parts |
| X6 | Technological skills (TS) | The number of joint patents between large and small firms | Joint patents | Good/Fair/ Poor | Dividing into three equal parts |
| X7 | Cooperation relation (CR) | Joint patents/√(the number of large firm’s patents × small firm’s patents) | Joint patents | Good/Fair/ Poor | Dividing into three equal parts |
| X8 | Success (S) | Average value of forward citation in joint patents | Joint patents | Yes/No | Yes (more than 1), No (=0) |
3.4. Methodology

3.5. Process

3.5.1. Step 1: Selecting a Necessary Technology for a Large Firm
3.5.2. Step 2: Identifying SMEs as Candidates for Joint Technical Development
3.5.3. Step 3: Constructing Conditional Probability Tables
3.5.4. Step 4: Assessing and Determining an R&D Partner Based on the Bayesian Network Model
4. Case study
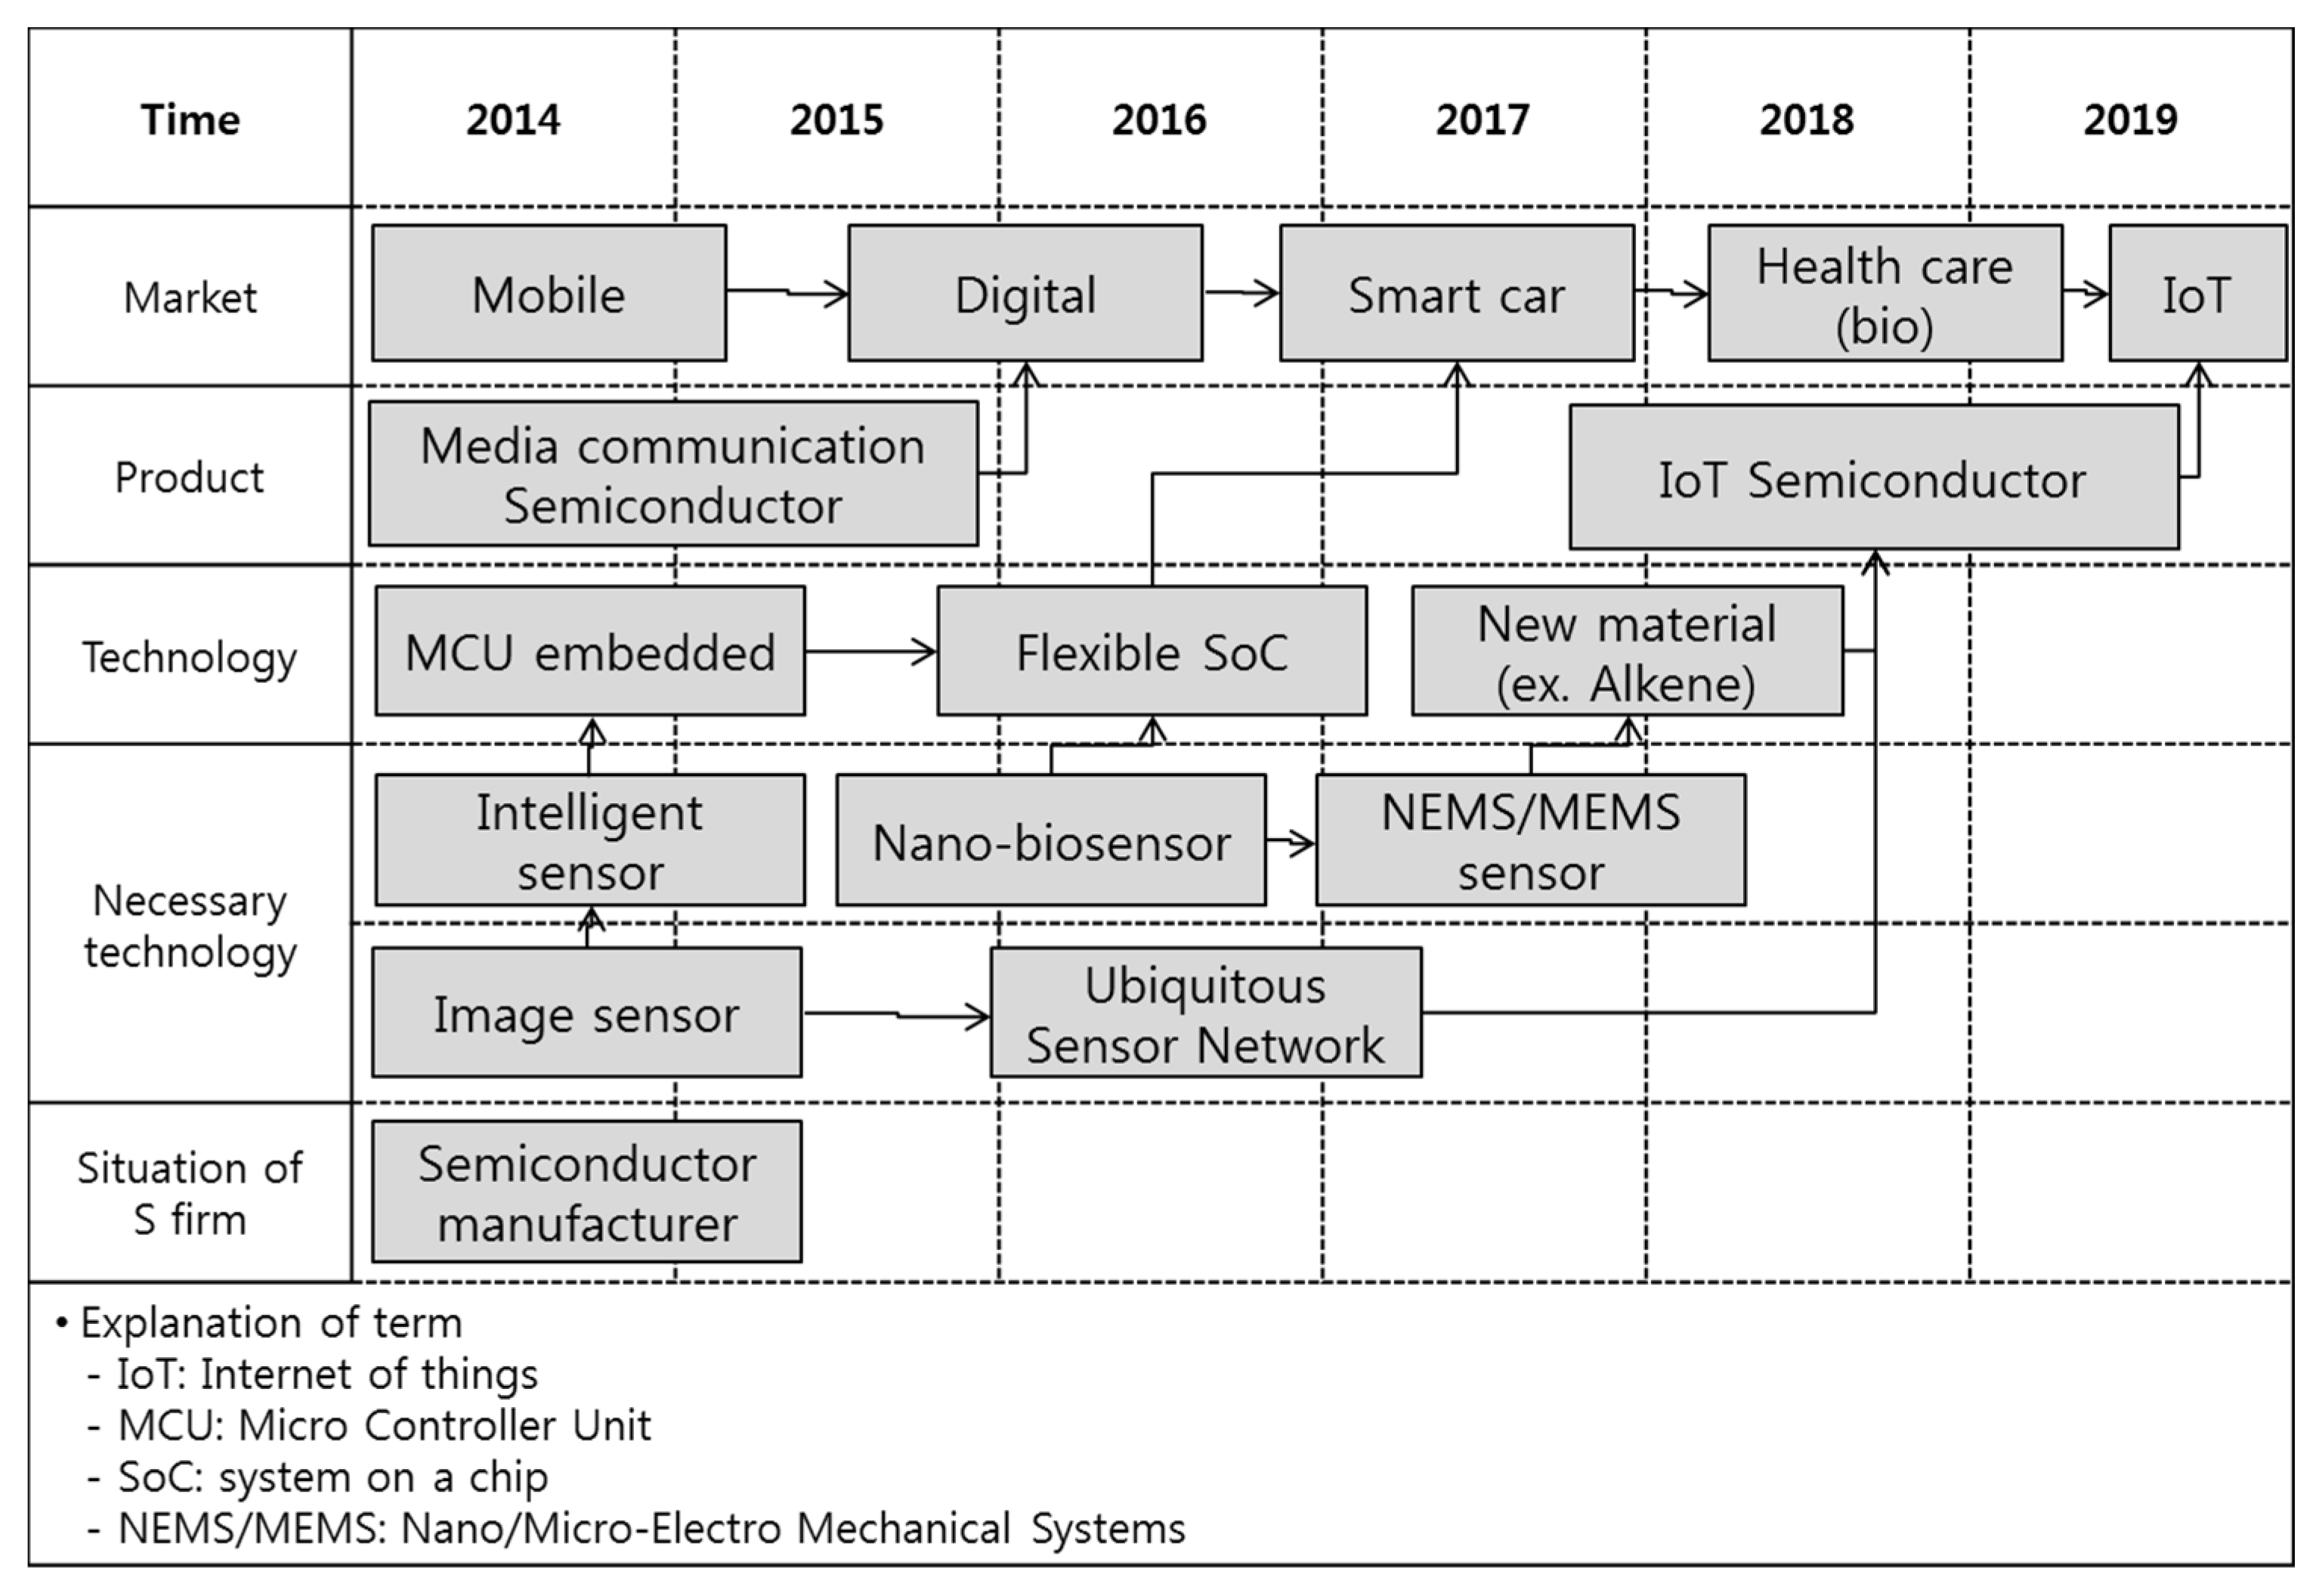
4.1. Background
4.2. Selecting a Necessary Technology for a Large Firm

4.3. Identifying SMEs as Candidates for Joint Technical Development
4.4. Constructing Conditional Probability Tables
| X1 | X2 | X3 | X6 | Probability |
|---|---|---|---|---|
| 1 | 1 | 1 | 1 | 66.6 |
| 1 | 2 | 1 | 1 | 44.4 |
| 1 | 2 | 2 | 1 | 33.3 |
| 1 | 3 | 2 | 1 | 22.5 |
| 1 | 3 | 3 | 1 | 41 |
| 2 | 1 | 3 | 1 | 100 |
| 2 | 3 | 2 | 2 | 100 |
| 3 | 1 | 2 | 1 | 80 |
| 3 | 2 | 2 | 1 | 35 |
| X4 | X5 | X7 | Probability |
|---|---|---|---|
| 1 | 1 | 1 | 42 |
| 1 | 2 | 1 | 50 |
| 1 | 3 | 1 | 100 |
| 2 | 1 | 1 | 69 |
| 2 | 2 | 1 | 25 |
| 2 | 3 | 1 | 95.45 |
| 2 | 3 | 2 | 4.54 |
| X6 | X7 | X8 | Probability |
|---|---|---|---|
| 1 | 1 | 1 | 70 |
| 1 | 2 | 1 | 30 |
| 2 | 1 | 1 | 55 |
| 2 | 2 | 1 | 45 |
| TE | AC | TL | CE | GD | TS | CR | S | |
|---|---|---|---|---|---|---|---|---|
| Small firm | 128 | 17 | 0.74 | 2 | - | - | - | - |
| Large and small firm | - | - | - | - | N | - | - | - |
| Joint patents | - | - | - | - | - | 1 | 0.03 | 0 |
| Mean | Standard Deviation | Minimum | Maximum | |
|---|---|---|---|---|
| Technical experience | 58.41 | 42.99 | 1.00 | 161.00 |
| Absorptive capacity | 10.22 | 13.48 | 1.75 | 62.5 |
| Technology lifecycle | 0.54 | 0.27 | 0 | 1 |
| Collaboration experience | 2.47 | 7.89 | 0 | 34 |
| Geographical distance | 1.23 | 0.57 | 1 | 3 |
| Technological skills (TS) | 4.97 | 12.81 | 1.00 | 81.00 |
| Cooperation relation (CR) | 0.04 | 0.07 | 0.00 | 0.71 |
| Success (S) | 3.76 | 11.99 | 0.00 | 47.76 |
| The number of small firms’ patents | 58.41 | 42.99 | 1.00 | 161.00 |
| The number of large firms’ patents | 5875.10 | 12,327.95 | 1.00 | 50,572.00 |
| The number of joint patents | 4.97 | 12.81 | 1.00 | 81.00 |
4.5. Assessing and Determining an R&D Partner Based on the Bayesian Network Model
| No. | Criteria | Candidate A | Candidate B | Candidate C | Candidate D |
|---|---|---|---|---|---|
| X1 | Technical experience | 16 (3) | 3 (1) | 14 (3) | 5 (1) |
| X2 | Absorptive capacity | 10 (2) | 19 (3) | 7 (1) | 20 (2) |
| X3 | Technology lifecycle | 0.75 (2) | 1 (3) | 0.21 (2) | 0 (1) |
| X4 | Collaboration experience | 2 (2) | 0 (1) | 3 (2) | 0 (1) |
| X5 | Geographical distance | 1 (1) | 1 (1) | 2 (2) | 1 (1) |
| Criteria | Candidate A | Candidate B | Candidate C | Candidate D |
|---|---|---|---|---|
| High technological skill (1) | 35% | 41% | 80% | 44% |
| High cooperation skill (1) | 69% | 42% | 25% | 42% |
| Success R&D collaboration (1) | 53.8% | 48.2% | 41.5% | 48.1% |
5. Results and Discussion
| Category | Output | Coverage | Consistency | |
|---|---|---|---|---|
| Model | X8 = f(X1, X2, X3, X4, X5) | 0.47 | 0.86 | |
| Solution | 1 | X1*X2*~X4*X5 | ||
| 2 | ~X1*~X2*~X3*~X4*~X5 | |||
| 3 | ~X1*~X2*~X3*X4*X5 | |||
| → X1*X2*~X4*X5 + ~X1*~X2*~X3*~X4*~X5 + ~X1*~X2*~X3*X4*X5 | ||||
| Case | X1 | X2 | X3 | X4 | X5 | Actual Results | Prediction Results | |
|---|---|---|---|---|---|---|---|---|
| Proposed Method | FsQCA | |||||||
| 1 | H (3) | H (2) | H (2) | H (2) | H (2) | Fail | Fail | Fail |
| 2 | H (3) | H (2) | H (2) | L (1) | L (1) | Fail | Fail | Success |
| 3 | L (1) | L (1) | L (1) | H (2) | H (2) | Success | Fail | Success |
| 4 | H (3) | H (2) | H (2) | L (1) | H (2) | Success | Success | Fail |
| 5 | L (1) | L (1) | L (1) | L (1) | L (1) | Fail | Fail | Success |
| 6 | L (1) | L (1) | H (2) | H (2) | H (2) | Fail | Fail | Fail |
| 7 | L (1) | L (1) | L (1) | L (1) | H (2) | Success | Success | Fail |
| 8 | L (1) | H (3) | L (1) | H (2) | H (2) | Fail | Fail | Fail |
| 9 | L (1) | L (1) | L (1) | L (1) | H (2) | Success | Success | Fail |
| 10 | L (1) | L (1) | H (2) | H (2) | L (1) | Fail | Success | Fail |
| Prediction probability | 80% | 50% | ||||||
6. Conclusions
Acknowledgments
Author Contributions
Conflicts of Interest
References
- Shi, J.; Li, P. An initial review of policies for SMEs in the US, Japan and China. In Management of Innovation and Technology, 2006 IEEE International Conference on; IEEE: New York, NY, USA, 2006; pp. 270–274. [Google Scholar]
- SME Agency. White Paper on Small and Medium Enterprises in Japan; Japan Small Business Research Institute: Tokyo, Japan, 2005. [Google Scholar]
- Wei, J.; Waiker, G.; Kogut, B. Interfirm cooperation and startup innovation in the biotechnology industry. Strat. Manag. J. 2000, 15, 387–394. [Google Scholar]
- Nestic, S.; Stefanovic, M.; Djordjevic, A.; Arsovski, S.; Tadic, D. A model of the assessment and optimisation of production process quality using the fuzzy sets and genetic algorithm approach. Eur. J. Ind. Eng. 2015, 9, 77–99. [Google Scholar] [CrossRef]
- Laurie, D.L. Venture Catalyst: The Five Strategies for Explosive Corporate Growth, 1st ed.; Basic Books: New York, NY, USA, 2002. [Google Scholar]
- Sawers, J.L.; Pretorius, M.W.; Oerlemans, L.A. Safeguarding SMEs dynamic capabilities in technology innovative sme-large company partnerships in South Africa. Technovation 2008, 28, 171–182. [Google Scholar] [CrossRef]
- Nieto, M.J.; Santamaría, L. Technological collaboration: Bridging the innovation gap between small and large firms. J. Small Bus. Manag. 2010, 48, 44–69. [Google Scholar] [CrossRef]
- Blomqvist, K.; Hurmelinna, P.; Seppänen, R. Playing the collaboration game right—Balancing trust and contracting. Technovation 2005, 25, 497–504. [Google Scholar] [CrossRef]
- Hancké, B. Trust or hierarchy? Changing relationships between large and small firms in France. Small Bus. Econ. 1998, 11, 237–252. [Google Scholar] [CrossRef]
- Kim, S.K.; Oh, Y.S.; Park, B.S.; Chung, H.J. A win-win cooperation strategy for big and small businesses: 10 policy proposals. In Proceedings of the 2006 PICMET Conference, Istanbul, Turkey, 8–13 July 2006.
- Geum, Y.; Lee, S.; Yoon, B.; Park, Y. Identifying and evaluating strategic partners for collaborative R&D: Index-based approach using patents and publications. Technovation 2013, 33, 211–224. [Google Scholar]
- Saen, R.F. Suppliers selection in the presence of both cardinal and ordinal data. Eur. J. Operational Res. 2007, 183, 741–747. [Google Scholar] [CrossRef]
- Zheng, Z.B.; Li, Y.; Zhu, W.X. Partner selection with a due date constraint in virtual enterprises. Appl. Math. Comput. 2006, 175, 1353–1365. [Google Scholar] [CrossRef]
- Chen, S.H.; Wang, P.W.; Chen, C.M.; Lee, H.T. An analytic hierarchy process approach with linguistic variables for selection of an R&D strategic alliance partner. Comput. Ind. Eng. 2010, 58, 278–287. [Google Scholar]
- Katila, R.; Rosenberger, J.D.; Eisenhardt, K.M. Swimming with sharks: Technology ventures, defense mechanisms and corporate relationships. Admin. Sci. Q. 2008, 53, 295–332. [Google Scholar] [CrossRef]
- Lee, K.; Yoon, B. A method for partner selection in R&D collaboration between large companies and SMEs using patent information. In Technology Management in the IT-Driven Services (PICMET), 2013 Proceedings of PICMET’13; IEEE: New York, NY, USA, 2013; pp. 1886–1891. [Google Scholar]
- Contractor, F.J.; Lorange, P. The growth of alliances in the knowledge-based economy. Int. Bus. Rev. 2002, 11, 485–502. [Google Scholar] [CrossRef]
- Garcia, M.; Bray, O. Fundamentals of Technology Roadmapping; SAND97-0665; Sandia National Laboratories: Aluquerque, NM, USA, 1998. [Google Scholar]
- Krieg, M.L. A Tutorial on Bayesian Belief Networks; DSTO: Edinburgh, Australia, 2001. Available online: http://dspace.dsto.defence.gov.au/dspace/handle/1947/3537 (accessed on 21 January 2016).
- Dushnitsky, G.; Shaver, J.M. Limitations to interorganizational knowledge acquisition: The paradox of corporate venture capital. Strat. Manag. J. 2009, 30, 1045–1064. [Google Scholar] [CrossRef]
- Bierly, P.E.; Gallagher, S. Explaining alliance partner selection: Fit, trust and strategic expediency. Long Range Plan. 2007, 40, 134–153. [Google Scholar] [CrossRef]
- Diestre, L.; Rajagopalan, N. Are all ‘sharks’ dangerous? New biotechnology ventures and partner selection in R&D alliances. Strat. Manag. J. 2012, 33, 1115–1134. [Google Scholar]
- Chesbrough, H.W. Open Innovation; Harvard Business School Press: Boston, MA, USA, 2003. [Google Scholar]
- Van de Vrande, V.; de Jong, J.P.; Vanhaverbeke, W.; de Rochemont, M. Open innovation in smes: Trends, motives and management challenges. Technovation 2009, 29, 423–437. [Google Scholar] [CrossRef]
- Lichtenthaler, U. Outbound open innovation and its effect on firm performance: Examining environmental influences. R&D Manag. 2009, 39, 317–330. [Google Scholar]
- Ledwith, A.; Richardson, I.; Sheahan, A. Small firm-large firm experiences in managing NPD projects. J. Small Bus. Enterprise Dev. 2006, 13, 425–440. [Google Scholar] [CrossRef]
- Prater, E.; Ghosh, S. A comparative model of firm size and the global operational dynamics of US firms in Europe. J. Oper. Manag. 2006, 24, 511–529. [Google Scholar] [CrossRef]
- Teirlinck, P.; Spithoven, A. Research collaboration and R&D outsourcing: Different R&D personnel requirements in SMEs. Technovation 2013, 33, 142–153. [Google Scholar]
- Pérez-Cano, C. Firm size and appropriability of the results of innovation. J. Eng. Tech. Manag. 2013, 30, 209–226. [Google Scholar] [CrossRef]
- Dogan, I.; Aydin, N. Combining bayesian networks and total cost of ownership method for supplier selection analysis. Comput. Ind. Eng. 2011, 61, 1072–1085. [Google Scholar] [CrossRef]
- Jensen, F.V. An Introduction to Bayesian Networks; UCL Press: London, UK, 1996; Volume 210. [Google Scholar]
- Lee, J.Y.; Choi, Y.J. Network identification of major risk factor associated with delirium by Bayesian network. Korean J. Appl. Stat. 2011, 24, 323–333. [Google Scholar] [CrossRef]
- Acid, S.; de Campos, L.M.; Fernández-Luna, J.M.; Rodrıguez, S.; Rodrıguez, J.M.; Salcedo, J.L. A comparison of learning algorithms for Bayesian networks: A case study based on data from an emergency medical service. Artif. Intell. Med. 2004, 30, 215–232. [Google Scholar] [CrossRef] [PubMed]
- Hudson, L.D.; Ware, B.S.; Laskey, K.B.; Mahoney, S.M. An application of Bayesian networks to antiterrorism risk management for military planners. Available online: http://mars.gmu.edu/bitstream/handle/1920/268/Antiterrorism.pdf?sequence=1&is Allowed=y (accessed on 21 January 2016).
- Kubota, N.; Mori, T. Conversation system based on boltzmann selection and bayesian networks for a partner robot. In Robot and Human Interactive Communication, 2009. RO-MAN 2009, The 18th IEEE International Symposium on; IEEE: New York, NY, USA, 2009; pp. 763–768. [Google Scholar]
- Trajtenberg, M. A penny for your quotes: Patent citations and the value of innovations. Rand J. Econ. 1990, 21, 172–187. [Google Scholar] [CrossRef]
- Yoon, B.; Song, B. A systematic approach of partner selection for open innovation. Ind. Manag. Data Syst. 2014, 114, 1068–1093. [Google Scholar] [CrossRef]
- Abbas, A.; Zhang, L.; Khan, S.U. A literature review on the state-of-the-art in patent analysis. World Patent Inform. 2014, 37, 3–13. [Google Scholar] [CrossRef]
- SBA. The Small Business Economy; SBA: Washington, DC, USA, 2010. [Google Scholar]
- Harrigan, K.R. Joint ventures and competitive strategy. Strat. Manag. J. 1988, 9, 141–158. [Google Scholar] [CrossRef]
- Shin, W.Y. A study on success cases between large firms and technological cooperation of small firms. Master’s Thesis, Hanyang University, Seoul, Korea, 2005. [Google Scholar]
- Jeon, J.H. Identification, selection, and planning of technology partners in open innovation. Ph.D. Thesis, Seoul National University, Seoul, Korea, 2011. [Google Scholar]
- Barney, J. Firm resources and sustained competitive advantage. J. Manag. 1991, 17, 99–120. [Google Scholar] [CrossRef]
- Das, T.K.; Teng, B.-S. A resource-based theory of strategic alliances. J. Manag. 2000, 26, 31–61. [Google Scholar] [CrossRef]
- Williamson, O.E. Comparative economic organization: The analysis of discrete structural alternatives. Admin. Sci. Q. 1991, 36, 269–296. [Google Scholar] [CrossRef]
- Haeckel, S. Adaptive Enterprise: Creating and Leading Sense-and-Respond Organizations; Harvard Business Press: Boston, Massachusetts, USA, 2013. [Google Scholar]
- Song, M.; Droge, C.; Hanvanich, S.; Calantone, R. Marketing and technology resource complementarity: An analysis of their interaction effect in two environmental contexts. Strat. Manag. J. 2005, 26, 259–276. [Google Scholar] [CrossRef]
- Anand, B.N.; Khanna, T. Do firms learn to create value? The case of alliances. Strat. Manag. J. 2000, 21, 295–315. [Google Scholar] [CrossRef]
- Büyüközkan, G.; Görener, A. Evaluation of product development partners using an integrated ahp-vikor model. Kybernetes 2015, 44, 220–237. [Google Scholar] [CrossRef]
- Williamson, O.E. The economics of organization: The transaction cost approach. Am. J. Sociol. 1981, 87, 548–577. [Google Scholar] [CrossRef]
- Farr, C.M.; Fischer, W.A. Managing international high technology cooperative projects. R&D Manag. 1992, 22, 55–68. [Google Scholar]
- Sampson, R.C. Experience effects and collaborative returns in R&D alliances. Strat. Manag. J. 2005, 26, 1009–1031. [Google Scholar]
- Buvik, A.; Andersen, O. The impact of vertical coordination on ex post transaction costs in domestic and international buyer-seller relationships. J. Inter. Market. 2002, 10, 1–24. [Google Scholar] [CrossRef]
- Salton, G.; McGill, M.J. Introduction to Modern Information Retrieval; Mcgraw-Hill College: New York City, NY, USA, 1983. [Google Scholar]
- Salton, G. Automatic Text Processing: The Transformation, Analysis, and Retrieval of Information by Computer; Addison-Wesley: Boston, MA, USA, 1989. [Google Scholar]
- Mohr, J.; Spekman, R. Characteristics of partnership success: Partnership attributes, communication behavior, and conflict resolution techniques. Strat. Manag. J. 1994, 15, 135–152. [Google Scholar] [CrossRef]
- Pearl, J. Causality: Models, Reasoning, and Inferenc; Cambridge University Press: Cambridge, UK, 2000. [Google Scholar]
- Vojak, B.A.; Chambers, F.A. Roadmapping disruptive technical threats and opportunities in complex, technology-based subsystems: The sails methodology. Technol. Forecast. Soc. Change 2004, 71, 121–139. [Google Scholar] [CrossRef]
- Vasudeva, G.; Spencer, J.W.; Teegen, H.J. Bringing the institutional context back in: A cross-national comparison of alliance partner selection and knowledge acquisition. Organ. Sci. 2013, 24, 319–338. [Google Scholar] [CrossRef]
- Ragin, C.C. Fuzzy-Set Social Science; University of Chicago Press: Chicago, IL, USA, 2000. [Google Scholar]
- Ragin, C.C. Redesigning Social Inquiry: Fuzzy Sets and Beyond; Wiley Online Library: Hoboken, NJ, USA, 2008. [Google Scholar]
© 2016 by the authors; licensee MDPI, Basel, Switzerland. This article is an open access article distributed under the terms and conditions of the Creative Commons by Attribution (CC-BY) license (http://creativecommons.org/licenses/by/4.0/).
Share and Cite
Lee, K.; Park, I.; Yoon, B. An Approach for R&D Partner Selection in Alliances between Large Companies, and Small and Medium Enterprises (SMEs): Application of Bayesian Network and Patent Analysis. Sustainability 2016, 8, 117. https://doi.org/10.3390/su8020117
Lee K, Park I, Yoon B. An Approach for R&D Partner Selection in Alliances between Large Companies, and Small and Medium Enterprises (SMEs): Application of Bayesian Network and Patent Analysis. Sustainability. 2016; 8(2):117. https://doi.org/10.3390/su8020117
Chicago/Turabian StyleLee, Keeeun, Inchae Park, and Byungun Yoon. 2016. "An Approach for R&D Partner Selection in Alliances between Large Companies, and Small and Medium Enterprises (SMEs): Application of Bayesian Network and Patent Analysis" Sustainability 8, no. 2: 117. https://doi.org/10.3390/su8020117