Article

Laboratory Tests in the Development of WaveCat

School of Marine Science and Engineering, University of Plymouth, Drake Circus, Plymouth PL4 8AA, UK
*
Author to whom correspondence should be addressed.
Sustainability 2016, 8(12), 1339; https://doi.org/10.3390/su8121339
Submission received: 27 October 2016 / Revised: 13 December 2016 / Accepted: 14 December 2016 / Published: 19 December 2016
(This article belongs to the Special Issue Wave Energy Converters)

Abstract

:
WaveCat, a novel overtopping Wave Energy Converter, was tested with the aim of determining its performance under different sea states, establishing a starting point for optimisation of the device, numerical model validation and proof-of-concept for the control systems. The tests were carried out at a 1:30 scale in the Ocean Basin of the COAST Laboratory at University of Plymouth. A state-of-the-art control system was implemented, and overtopping rates and device motions were recorded alongside the wave field. It was observed that power generation is dependent on both the wave height and period, with smaller periods tending to produce greater overtopping rates, and therefore greater power generation, for the same wave height. Due to time constraints in the laboratory, only one configuration of draft/freeboard was tested; with this configuration, overtopping occurred under significant wave heights of 0.083 m or more, corresponding to 2.5 m or more in prototype values. These experimental results form the basis for future development and optimisation of WaveCat.

1. Introduction

In order to reduce the impact of fossil fuels on our climate, the contribution of renewable energy to energy production must be enhanced. Within the European Union, targets have been set for member countries to produce a percentage of their energy from renewable sources [1]; for example, the UK must produce 15% of its energy share from renewable sources by 2020. In order to reach the targets set by the EU, alternative energy generation methods must be explored.
Marine renewable energy is a relatively underutilised area of energy extraction, with avenues in offshore wind, tidal stream, tidal range and wave energy available. Worldwide, wave energy potential is estimated to be 17 TW h/year [2] with the largest concentrations at mid-latitudes, 30° to 60°, which Europe is in a prime position to exploit.
For the potential of wave energy to be fully realised and commercially viable, several fundamental steps must be completed. Firstly, the resource must be assessed at each proposed site, as it can present significant spatial and temporal variation in a local area [3,4,5,6,7,8,9,10,11,12,13]. The uncertainty of the resource as well as the potential for weather windows allowing access to the device for operation and maintenance tasks should also be considered [14,15]. Secondly, the impact on the local marine environment must be assessed in terms of the effect on the coastline [16,17,18] and the immediate marine ecosystem [19], amongst others. The above impacts are not necessarily negative, as a wave farm extracting energy from an incoming wave field can protect vulnerable coastlines [20,21,22] or other renewable energy installations [23,24]. Thirdly, a WEC must be chosen to suit the conditions in which energy extraction is occurring, both to minimise negative impacts and to efficiently capture energy in a commercially viable manner. Finally, the device must be able to survive at the location it is deployed as the local wave climate will impart wave loading forces to the device, which it must resist [25,26].
This article focuses on the WaveCat WEC and continues from previous proof of concept work [26,27,28,29] with further physical modelling. The objectives of the experiments were three-fold. First, device motions are examined in preparation for validation of a numerical model and overtopping rates analysed to characterise power performance for the tested waves. Second, baseline data were acquired with which to begin the design optimisation process both physically and numerically. Third, the control systems designed for this model were shown to work in test conditions.
The WaveCat, Figure 1, is an offshore, floating WEC which operates on the principle of oblique overtopping, where waves impinge the device at an angle, compared to other devices which overtop front-on [30,31,32].
The WaveCat consists of two symmetrical hulls joined at the stern via a hinge, allowing the relative angle between the hulls to be varied depending on the sea state. In addition, the freeboard of the device decreases along the inner edge towards the stern allowing incoming waves to continue overtopping despite the reduction in height caused by the overtopping itself. Furthermore, the draft and trim of the device can be altered through the use of ballast tanks to adapt to sea states and tune the freeboard to spread overtopping volumes throughout the device. Volumes of overtopping water are collected in onboard tanks contained within the hulls and released through low-head turbines to generate electricity. The overall length of the planned prototype is 90 m and is intended to operate in water depths of between 50 m and 100 m. Typically these water depths are found further offshore, where the low profile of the device will limit visual impacts compared to large offshore structures such as wind turbines.
The device is moored via a single point to the seabed, using a Catenary Anchor Leg Mooring (CALM). This allows the device to orient itself along the direction of wave propagation passively, reducing the need for complex systems devoted to maintaining device direction. The survivability of the device is closely linked to the wedge angle. By reducing the angle to 0°, effectively closing the wedge, the device acts as a single hull body.

2. Materials and Methods

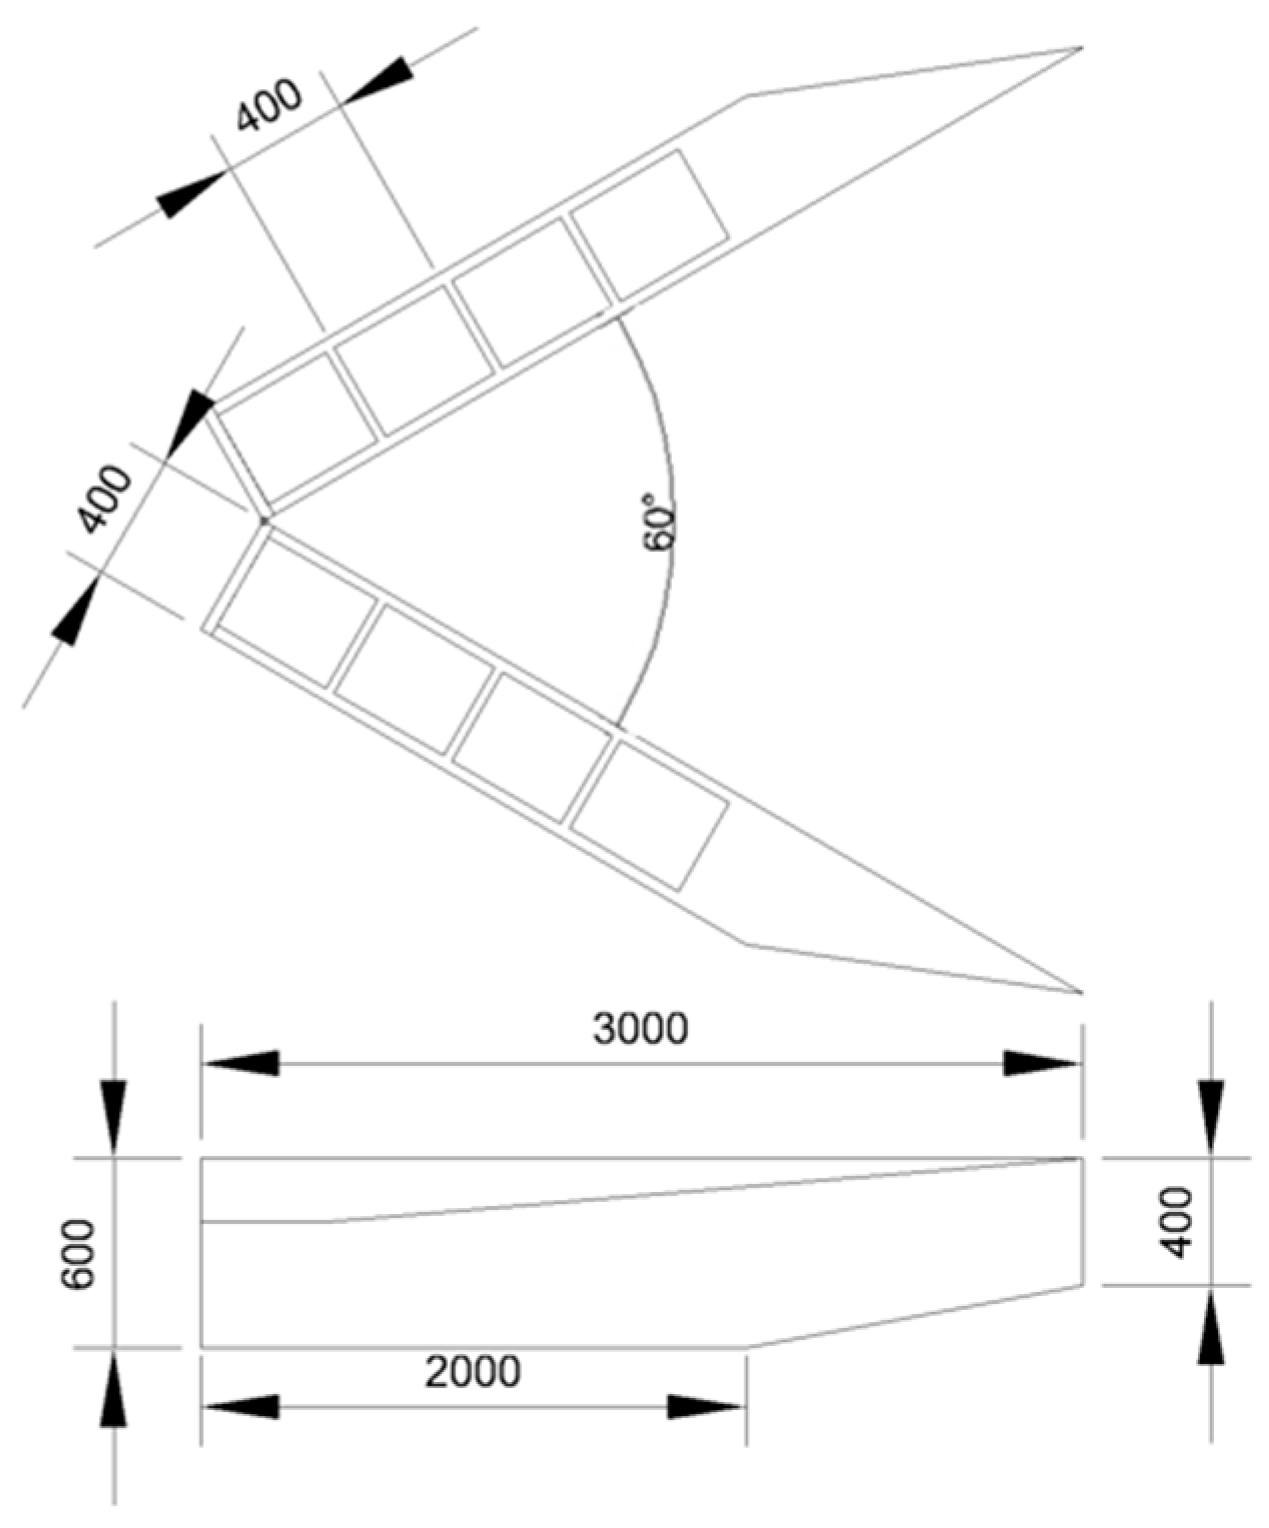
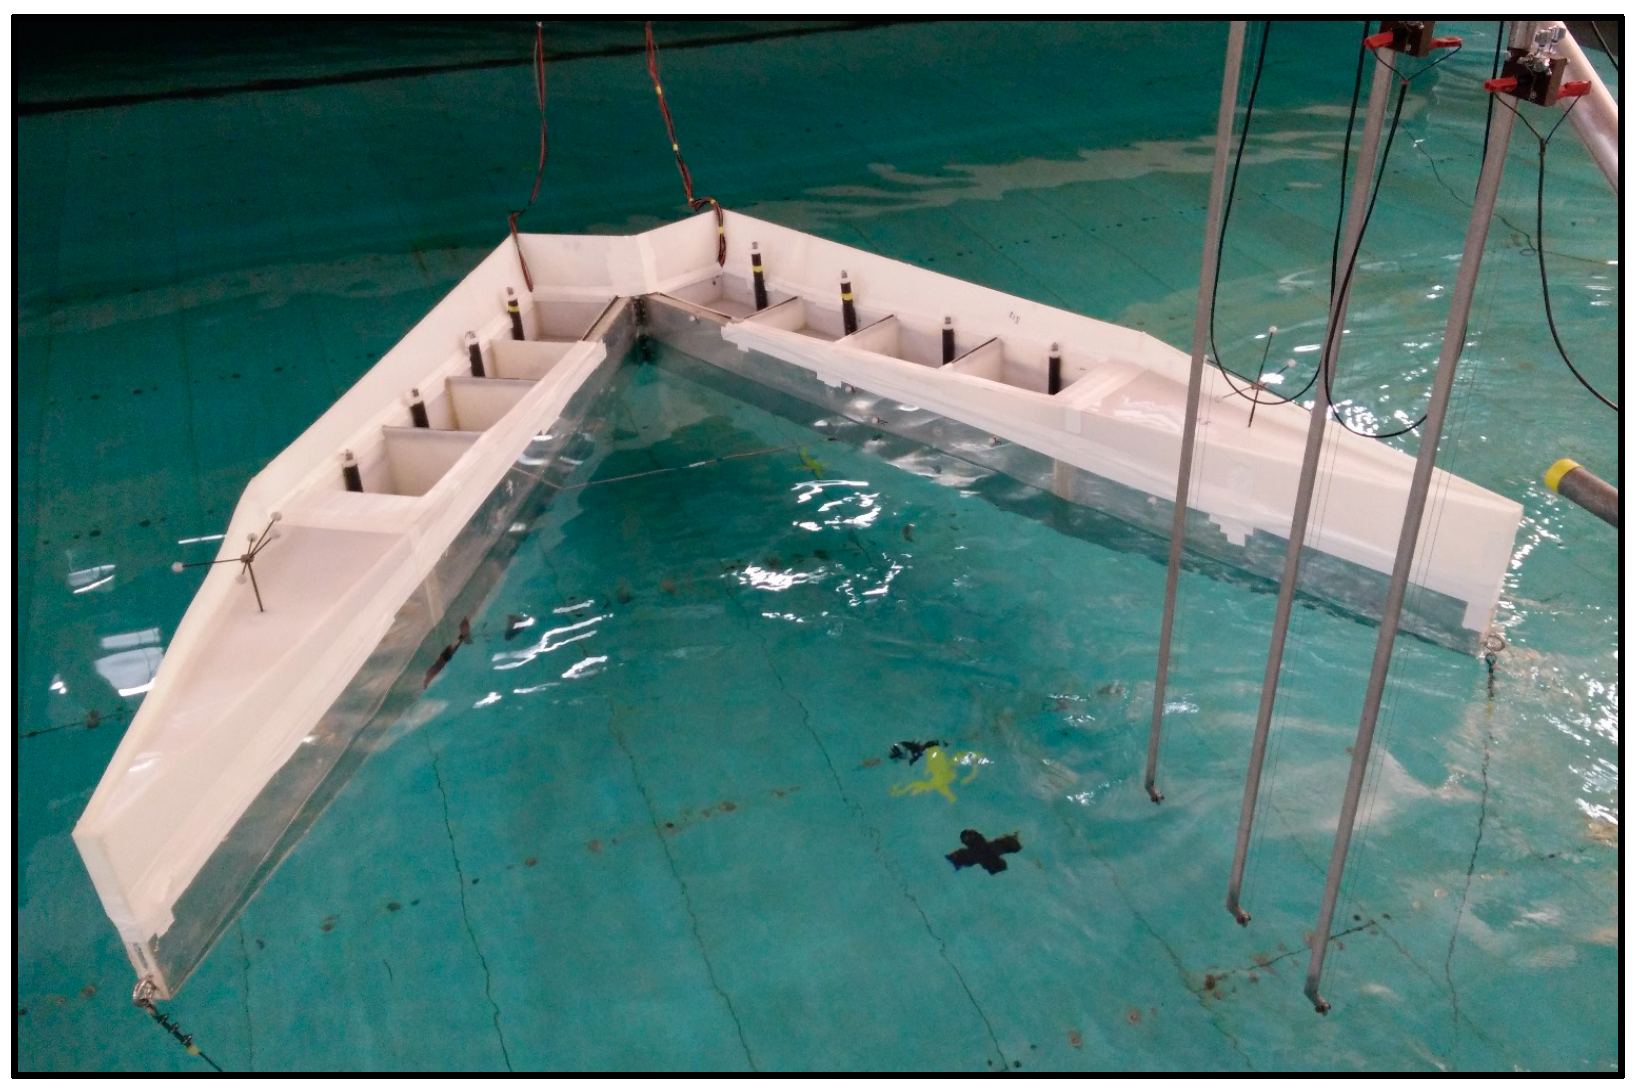
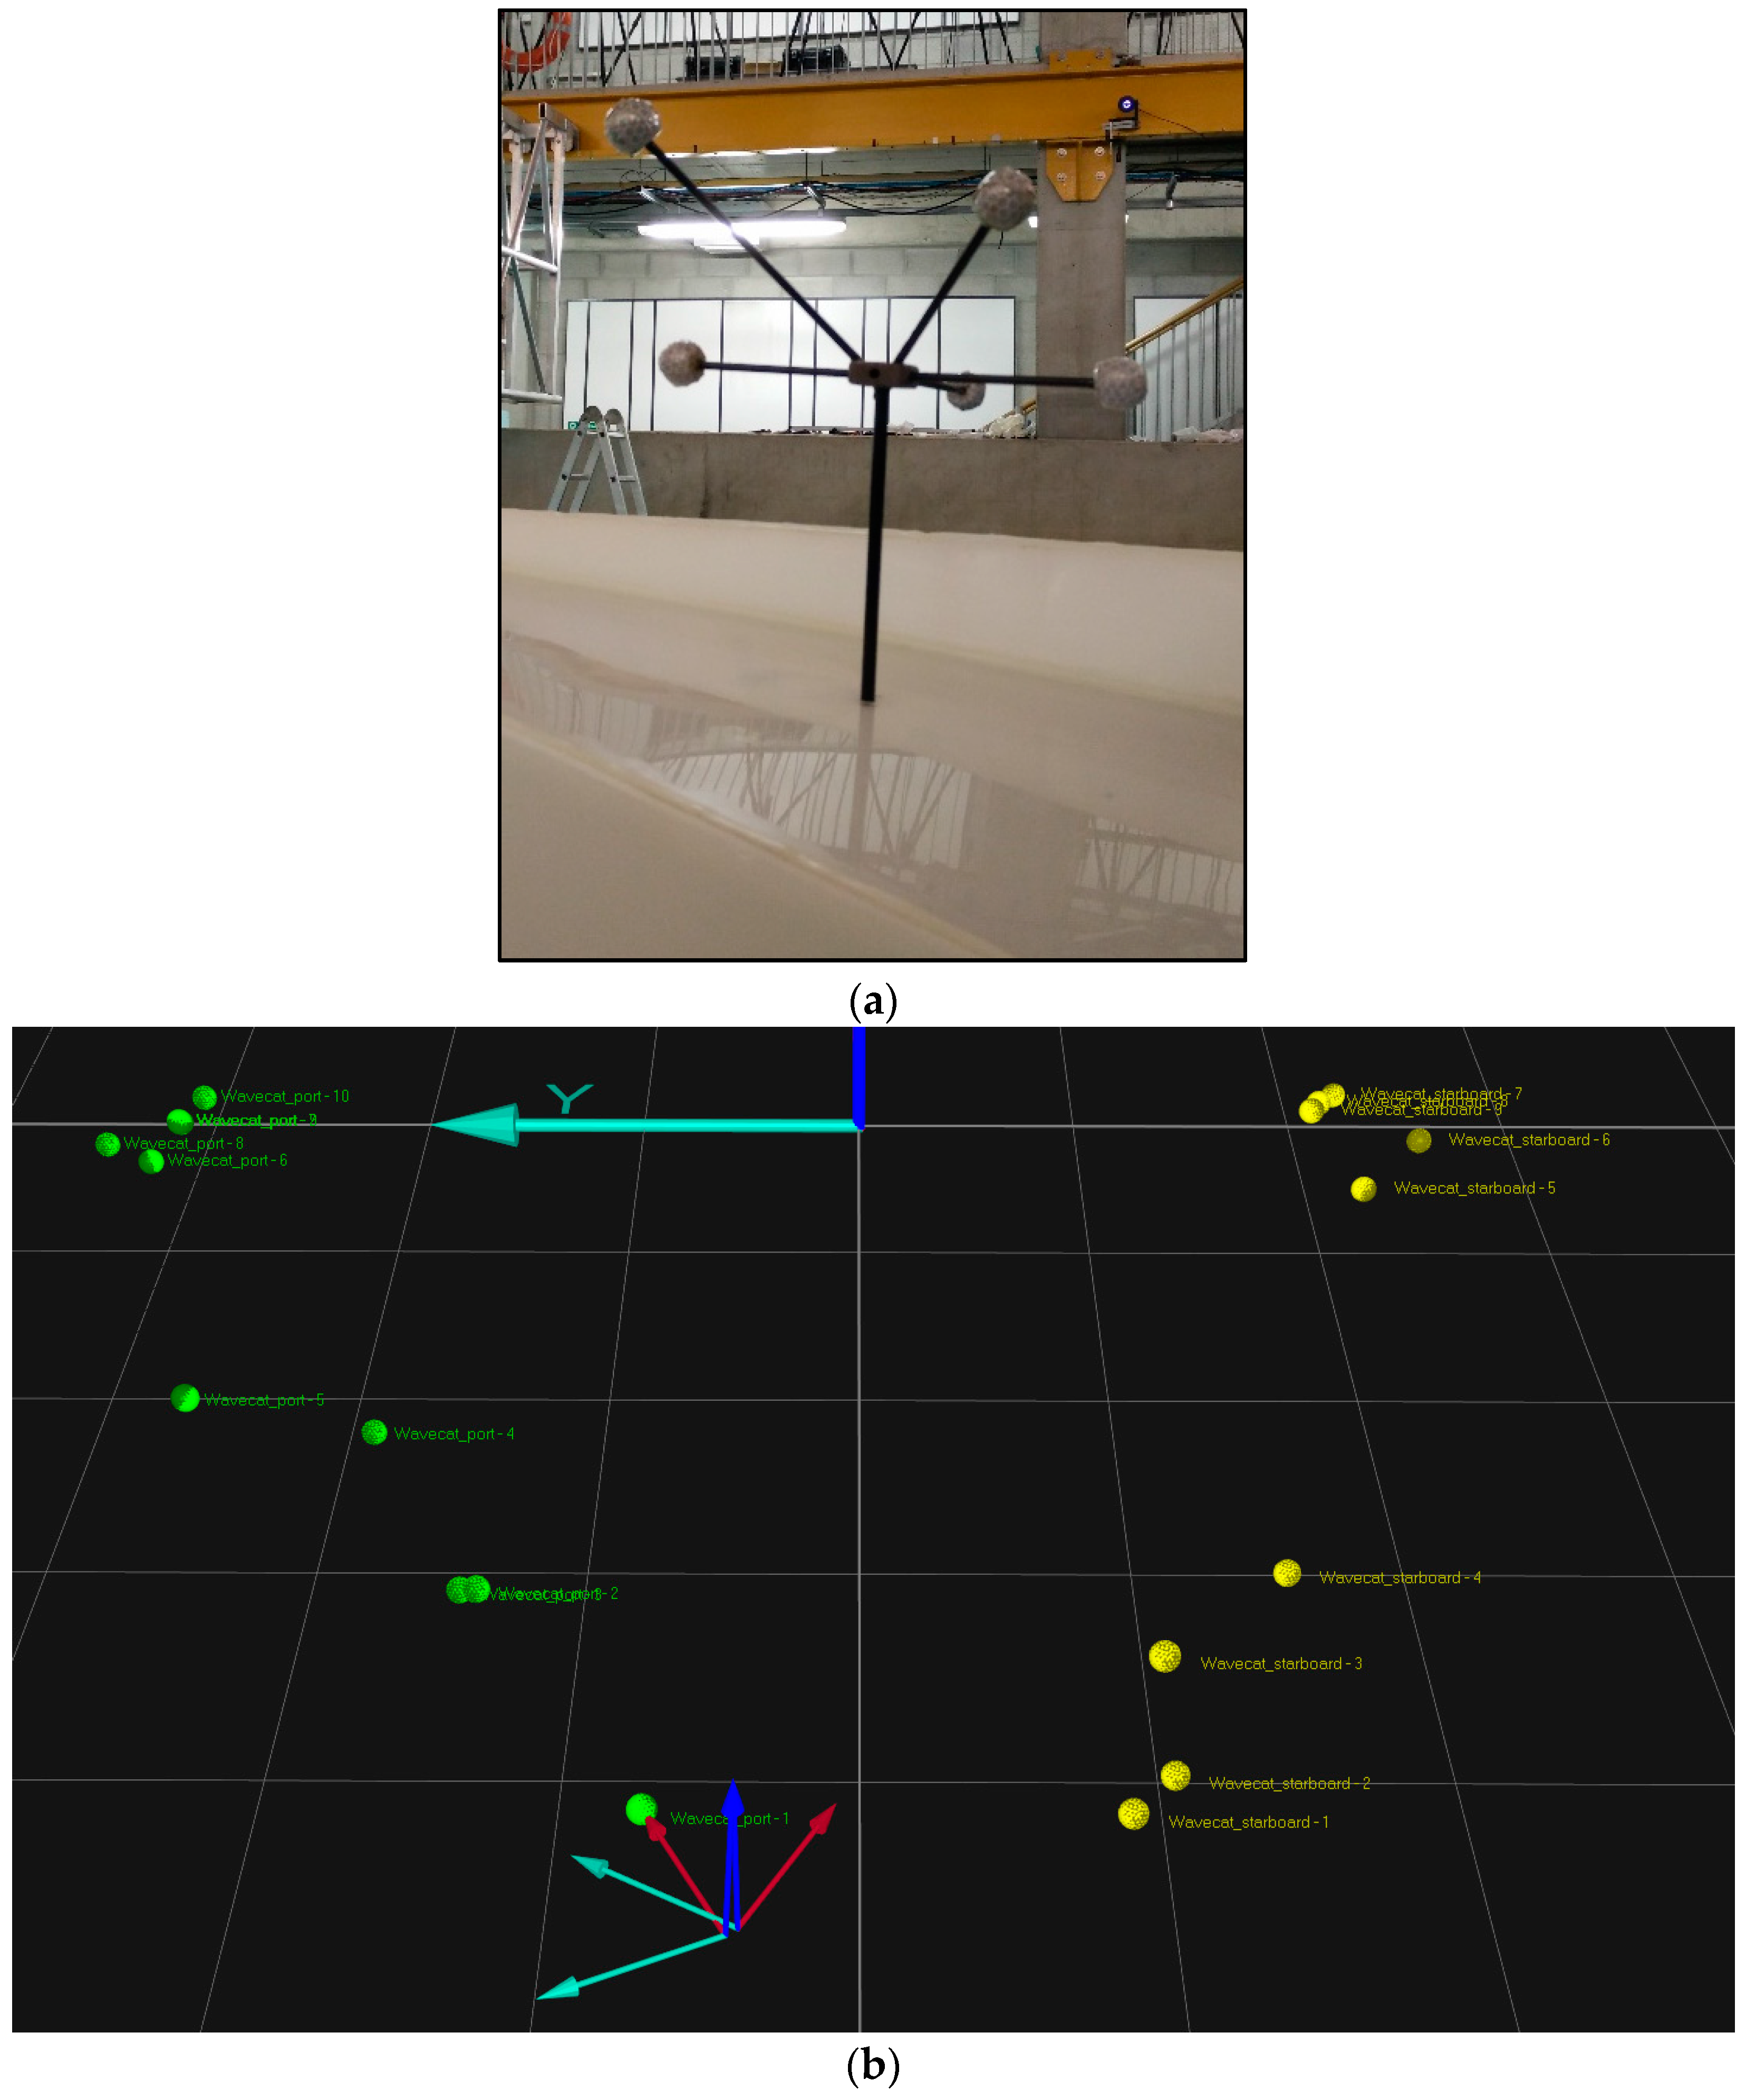
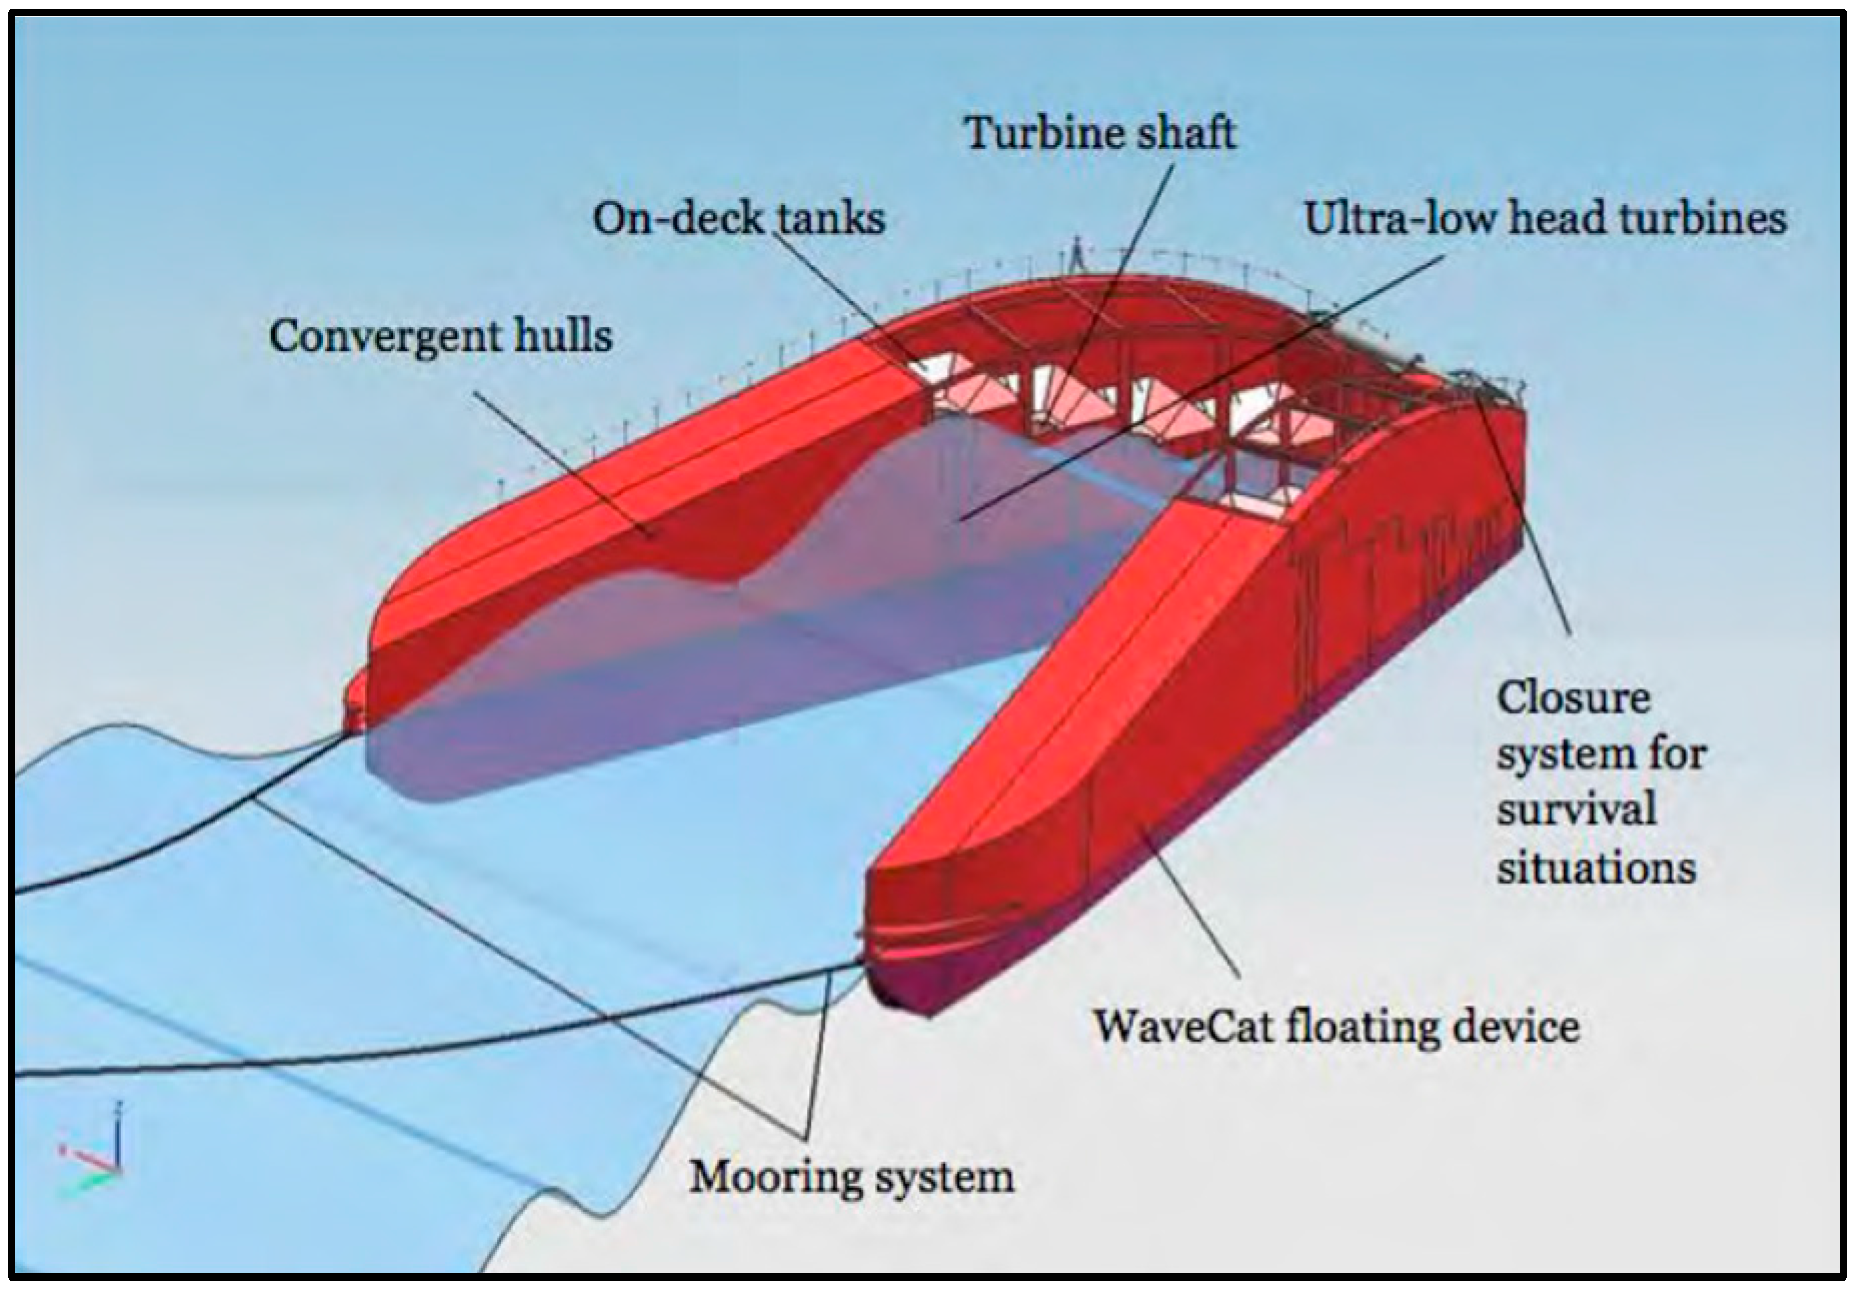
2.1. The WaveCat Model and Instrumentation

Following initial tests of a 1:30 model [27,28,29] a new version of the WaveCat model was built at the University of Plymouth at the same scale, Figure 2, for extended tests. The main dimensions of the model are length of 3 m, height of 0.6 m and maximum width of 0.4 m. The main section of the model was manufactured from aluminium, with the tanks and top mounted wave deflector fabricated from polypropylene sheet. Four tanks were built into the hulls of the new model, compared to two in the previous model, as seen in Figure 3. The tanks and wave deflectors are removable, allowing the internal components to be accessed. The body of the model will therefore be preserved whilst allowing changes to be made to part, or all, of the internal components. This model also contained 135 kg of removable solid ballast in each hull, with potential for additional ballast to be added. The ballast can be configured to set the device to have a defined freeboard and trim prior to testing. The shape of the bow was also modified to include a watertight compartment for the control system.
Within each overtopping tank a resistance level sensor was mounted in a pipe to control surface oscillations. The pipe is open at the base, equalising the level with the tank whilst blocking surface ripples from overtopping water and limiting sloshing due to device movements. A valve controlled the release of water from each tank to a communal exhaust pipe for each hull, in which a flowmeter was placed to measure the flow simultaneously with the level of each tank. The valve was programmed to release when water reached a certain level in the tank and close when a minimum level was reached. A microcontroller (Arduino Leonardo revision 3) was used to control the valves and allowed modifications when considering which values to open and close, as well as manual control for a safeguard. The addition of a microcontroller gave a further level of flexibility to the design as it was able to be configured to specific test conditions.
A motion capture system was also used in the tests. A total of nineteen reflective markers were placed on the model, Figure 4, which were tracked using six infrared cameras station around the wave tank. The software governing the motion capture detects the markers on the model, creates a rigid body representation and tracks the translations and rotations of the device during testing in six degrees of freedom (6DOF). The device was modelled as two fixed bodies, one representing each hull and the origin of the coordinate system located on the hinge of the device.

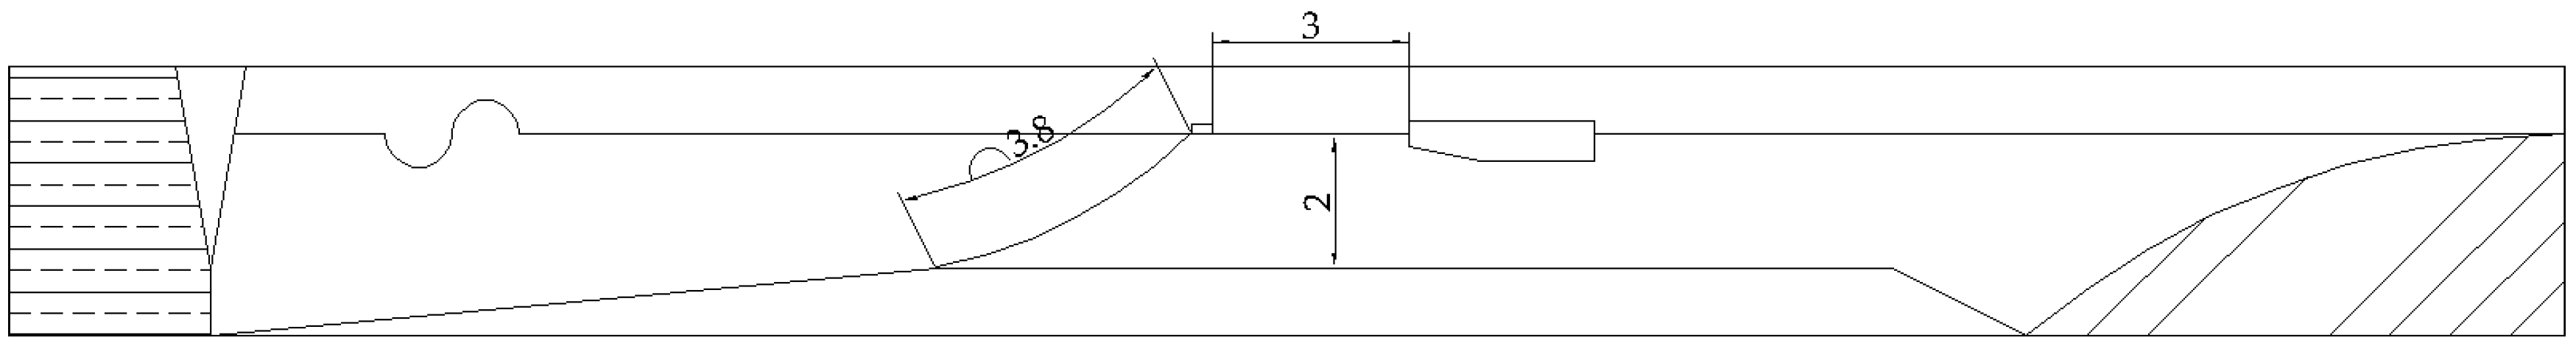
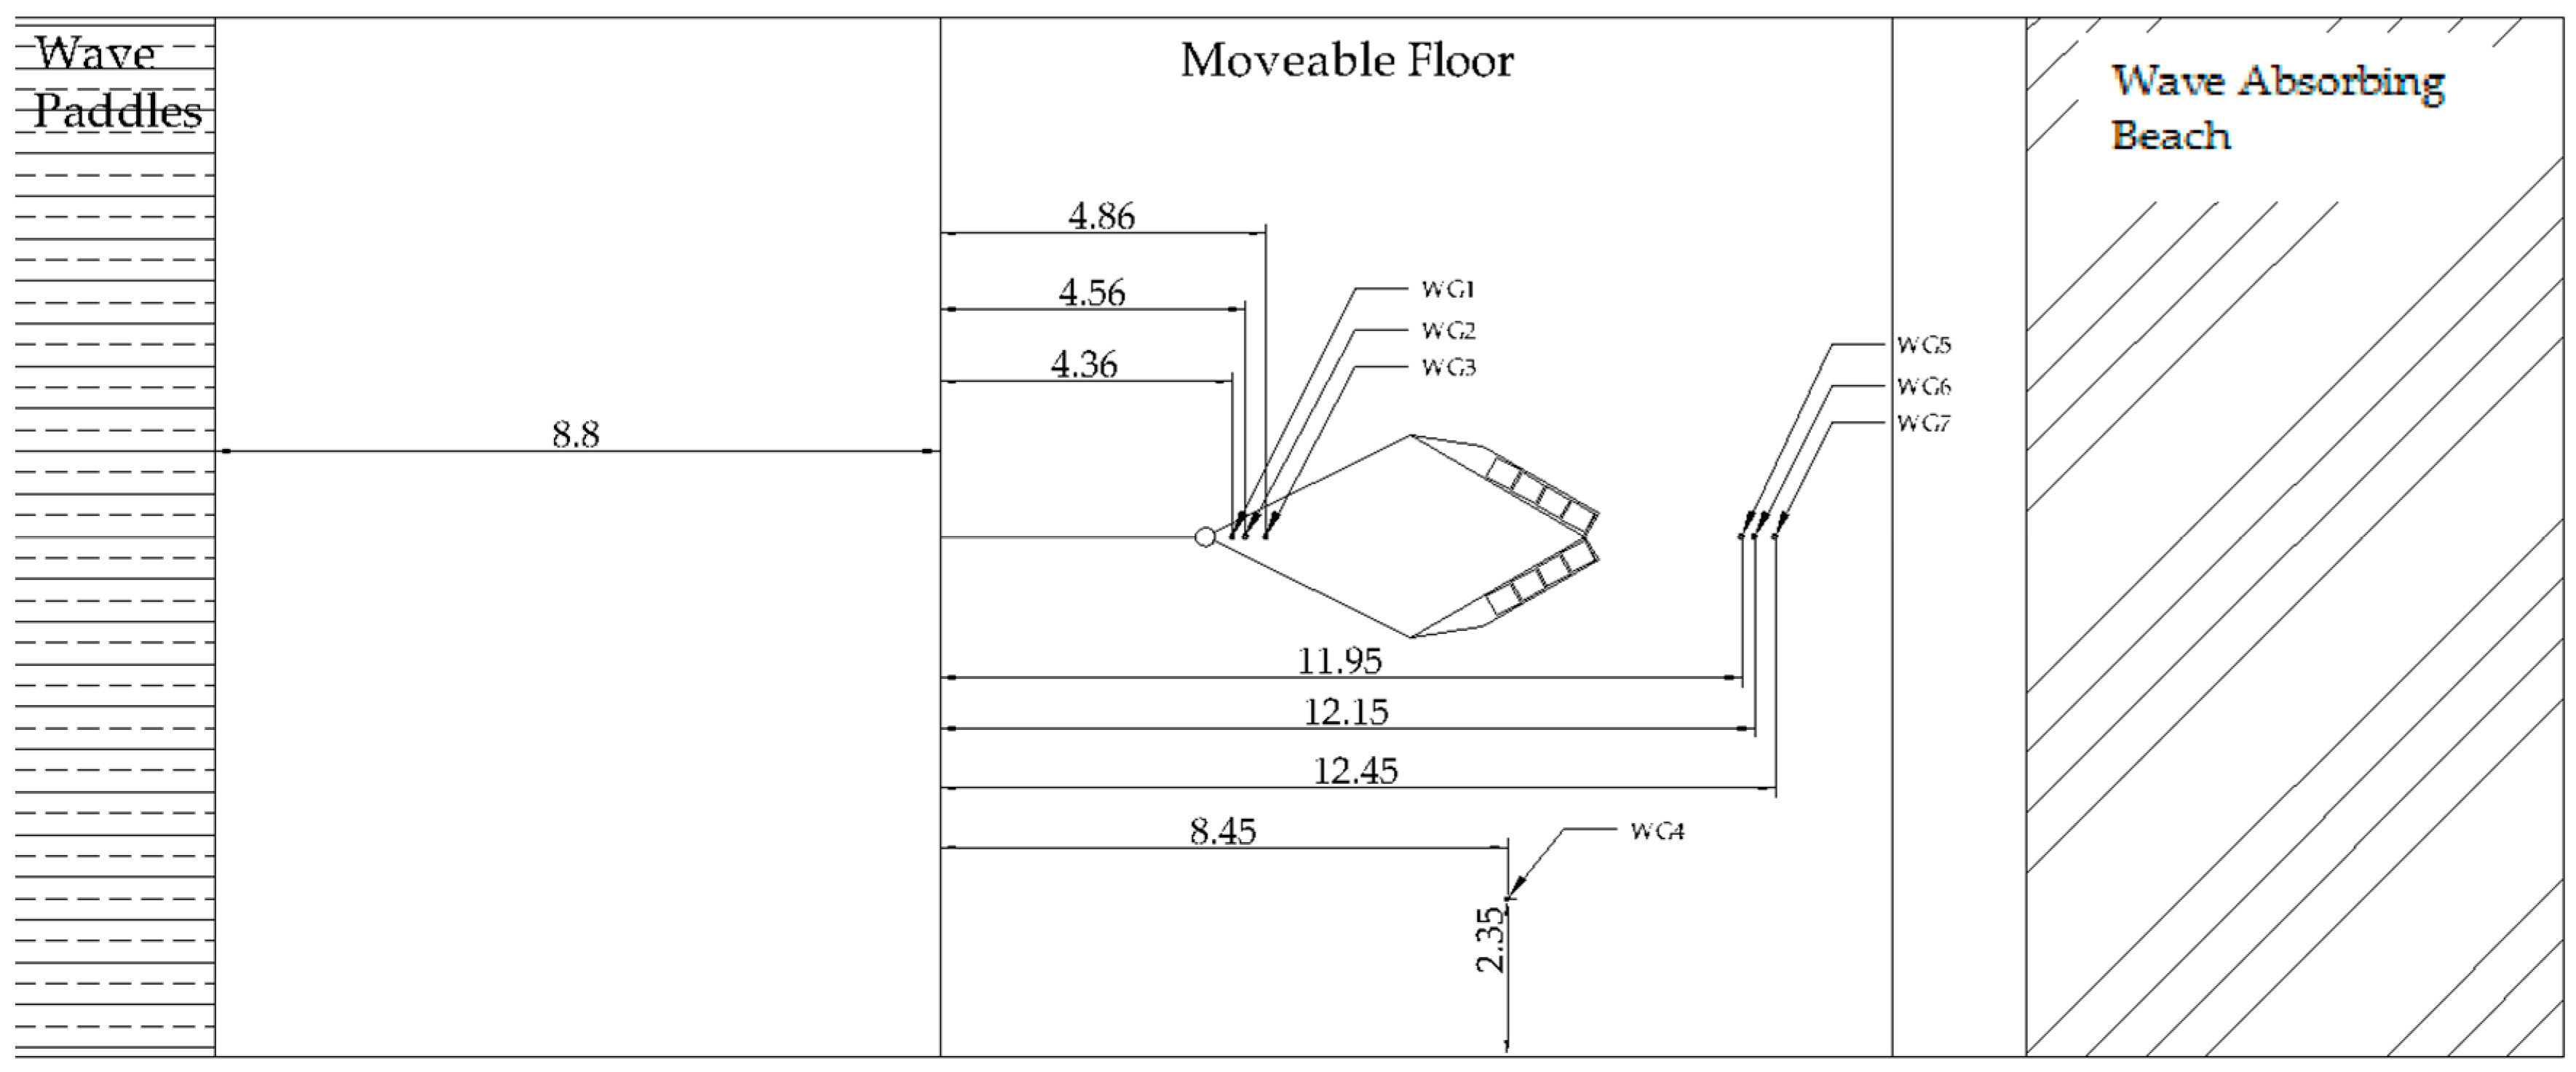
2.2. The Wave Tank, Experimental Setup and Test Campaign

The University of Plymouth Ocean Basin was used for these experiments. The basin is 35 m in length, 15.5 m wide and 3 m deep at its maximum. The tank has a moveable floor which covered the experimental area and was set to a depth of 2 m, representing 60 m at prototype scale. The tank has 24 individually controlled, flap-type paddles to generate waves with active reflection absorption built in. There is also a parabolic beach at the down-wave end of the tank to minimise reflections.
The model was ballasted to control the freeboard and to keep the inner edge of the hull parallel to the still water surface during all tests. The device was kept at a constant starting freeboard of 200 mm throughout all tests to establish a benchmark with which to begin the optimisation of the device. Previous proof of concept work [27,28,29] used a freeboard of 40 mm, reducing to 30 mm at the aft reservoir. As tests progress and tanks collect overtopping water the device freeboard will naturally vary therefore the device was expected to behave differently for each value of Hs as smaller values would result in fewer waves during a test that could breach the freeboard threshold and overtop.
The device was moored using a CALM system and located approximately 17.25 m from the wave paddles, as seen in Figure 5 and Figure 6. A group of three resistance wave gauges (WG), WG1, WG2 and WG3, was situated before the model, along with a single gauge, WG4, at the same distance as the model to the paddles and a final group of three gauges, WG5, WG6 and WG7, in the lee of the device. Additionally, four video cameras were mounted around the model, one of which on the floor of the tank, to record video of the tests. The device was set to a wedge angle of 60° for the purposes of these experiments, to match the wedge angle shown to generate the highest potential power in Fernandez et al. [28].
A total of 45 tests with random waves and zero angle spread were performed with overtopping with significant wave heights (Hs) between 0.0167 m and 0.117 m in model scale, between 0.5 m and 3.5 m at prototype scale. The peak periods (Tp) range between 1.28 s and 2.74 s at model scale and between 7 s and 15 s at prototype scale. A Bretschneider spectrum was used for these tests [33]. Additional tests were performed in the absence of overtopping to monitor the movements of the device for the calibration of a future numerical model, using STAR-CCM+. The numerical model will be first calibrated to the device motions and wave field interaction in the absence of overtopping before progressing on to use device motions with overtopping. The numerical model will then be used for the optimisation of the device. A total of 56 wave cases, 28 with regular waves and 28 with random waves, were tested for this purpose.
The device experienced no overtopping during tests with Hsm values of 0.067 m or less, or with Hsm of 0.083 m and Tpm of 1.64 s or less, at model scale. The characteristics of the irregular sea states in which overtopping occurred are shown in Table 1, with the model scale and prototype scale parameters. In addition to the 10 tests shown, in which overtopping occurred, 35 additional tests were performed where no overtopping occurred, and therefore no potential power was generated. These are not shown for the sake of brevity.

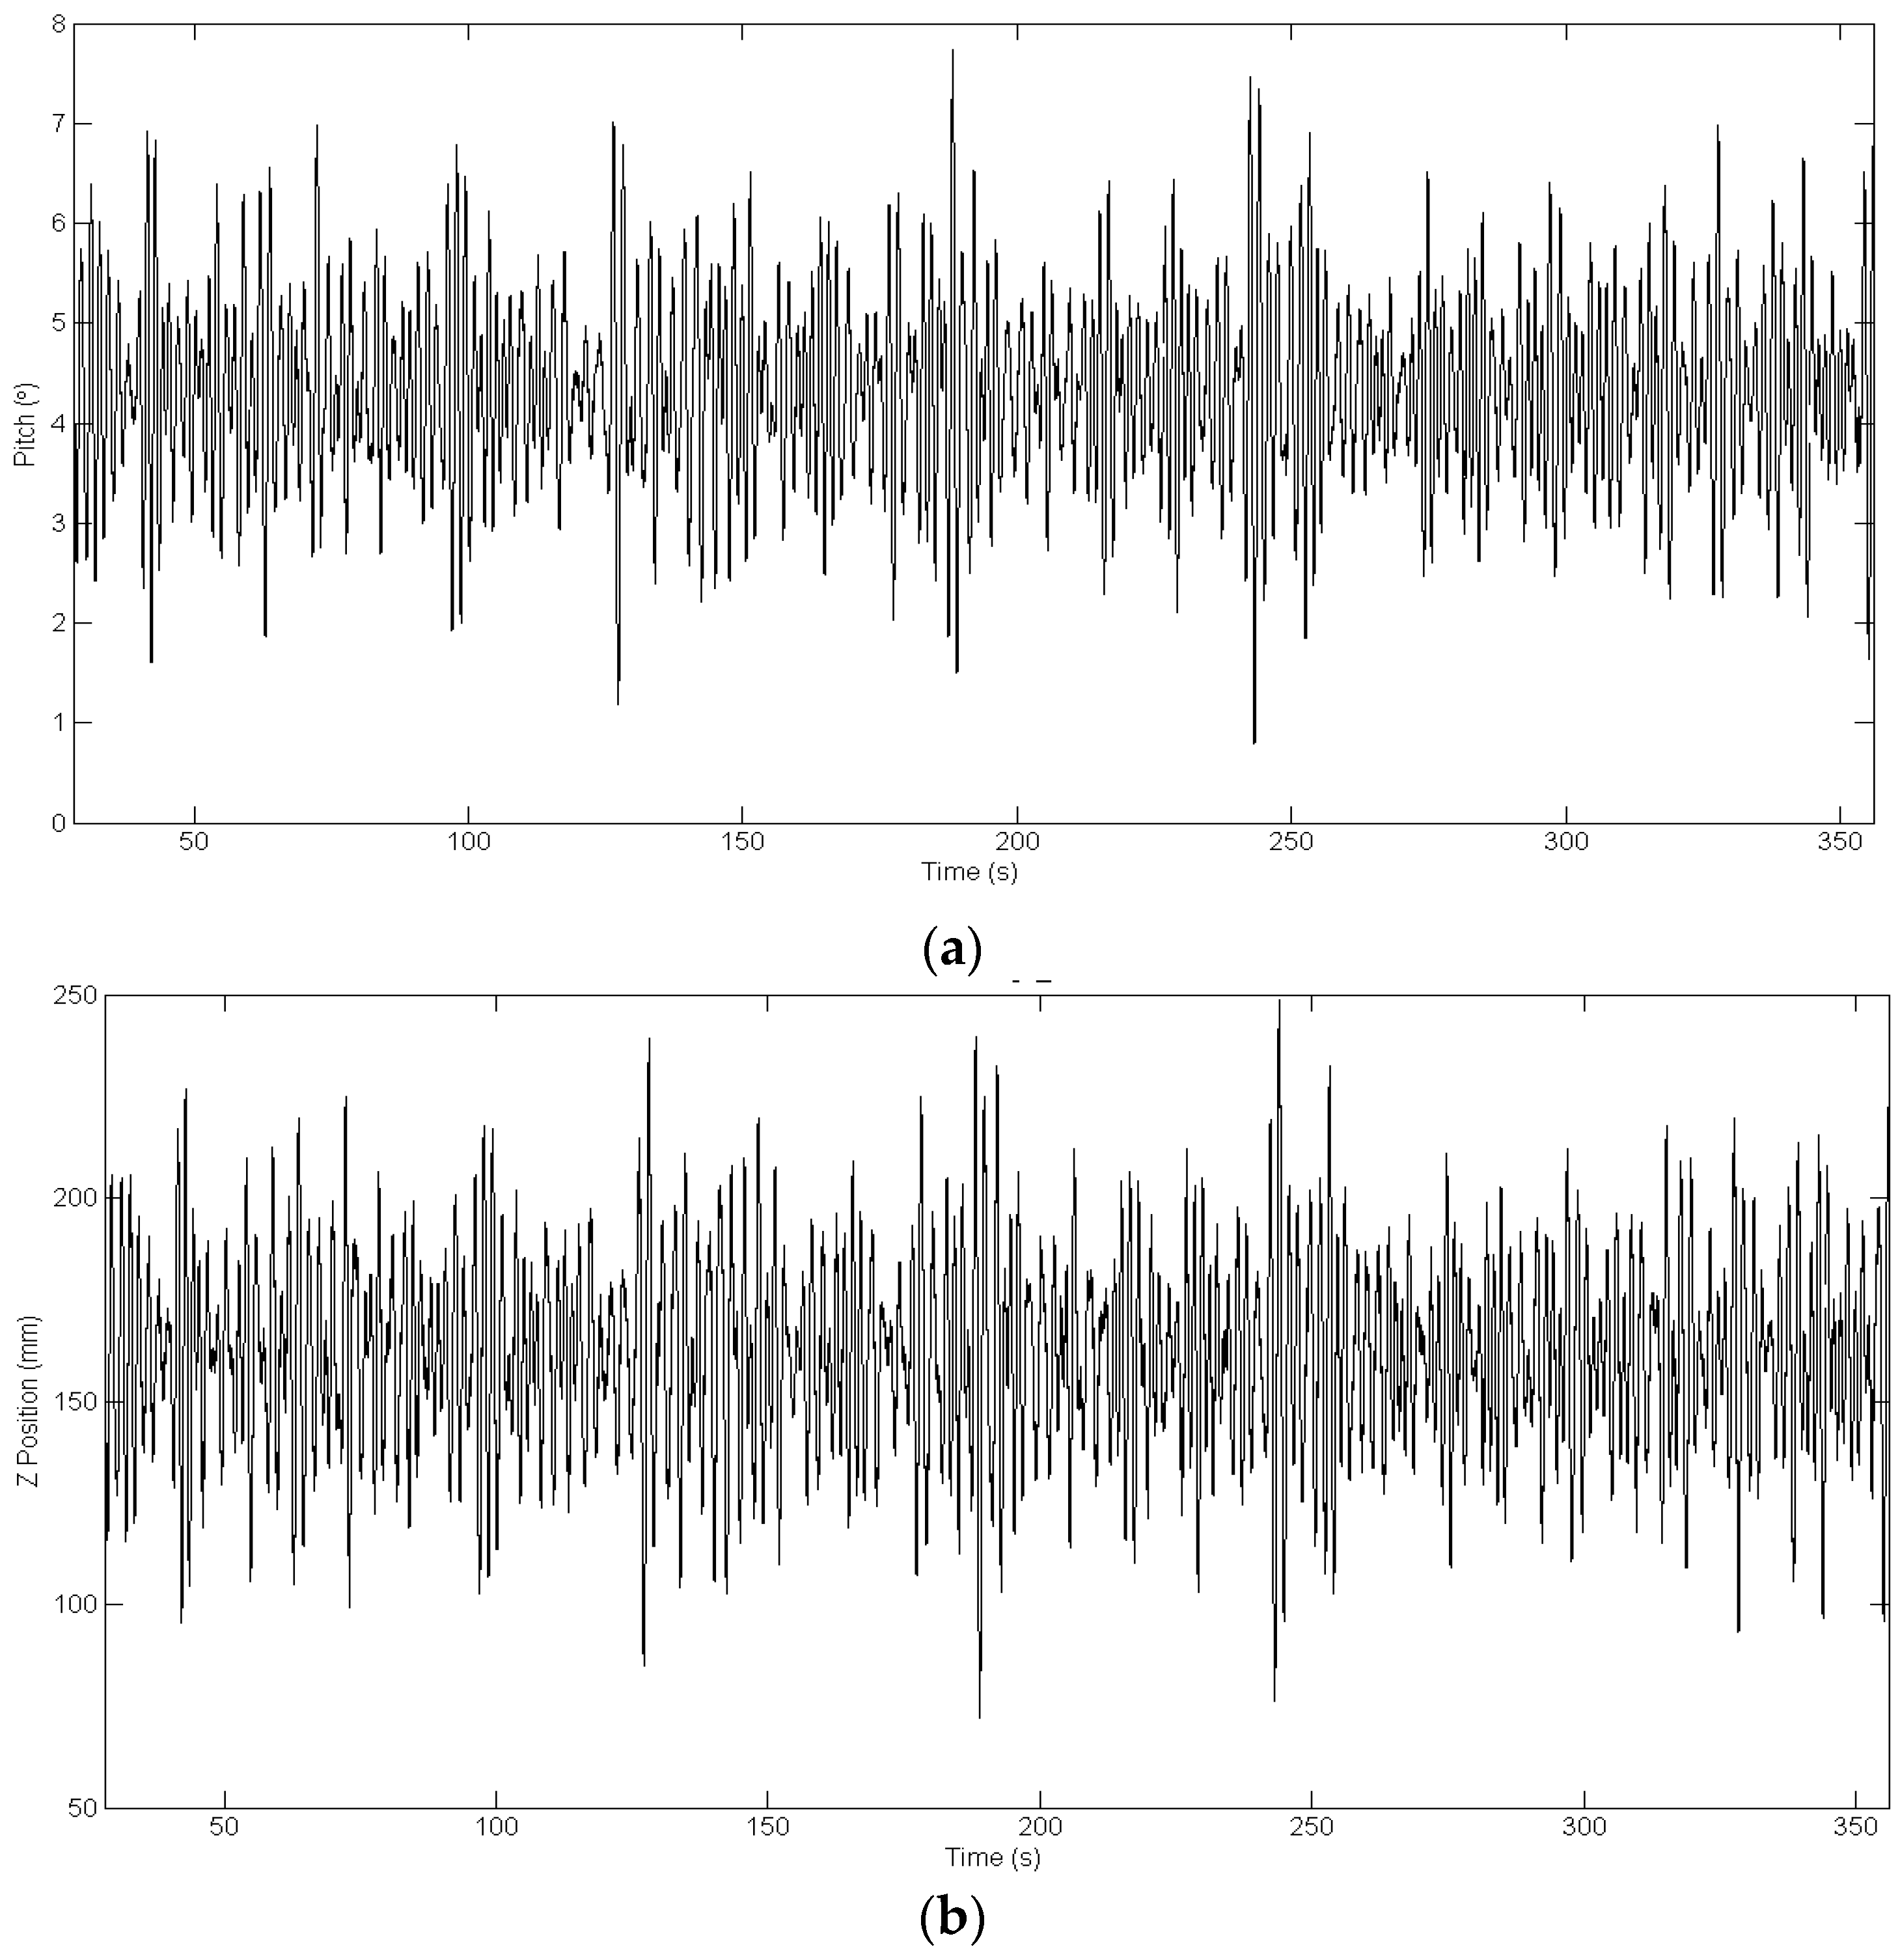
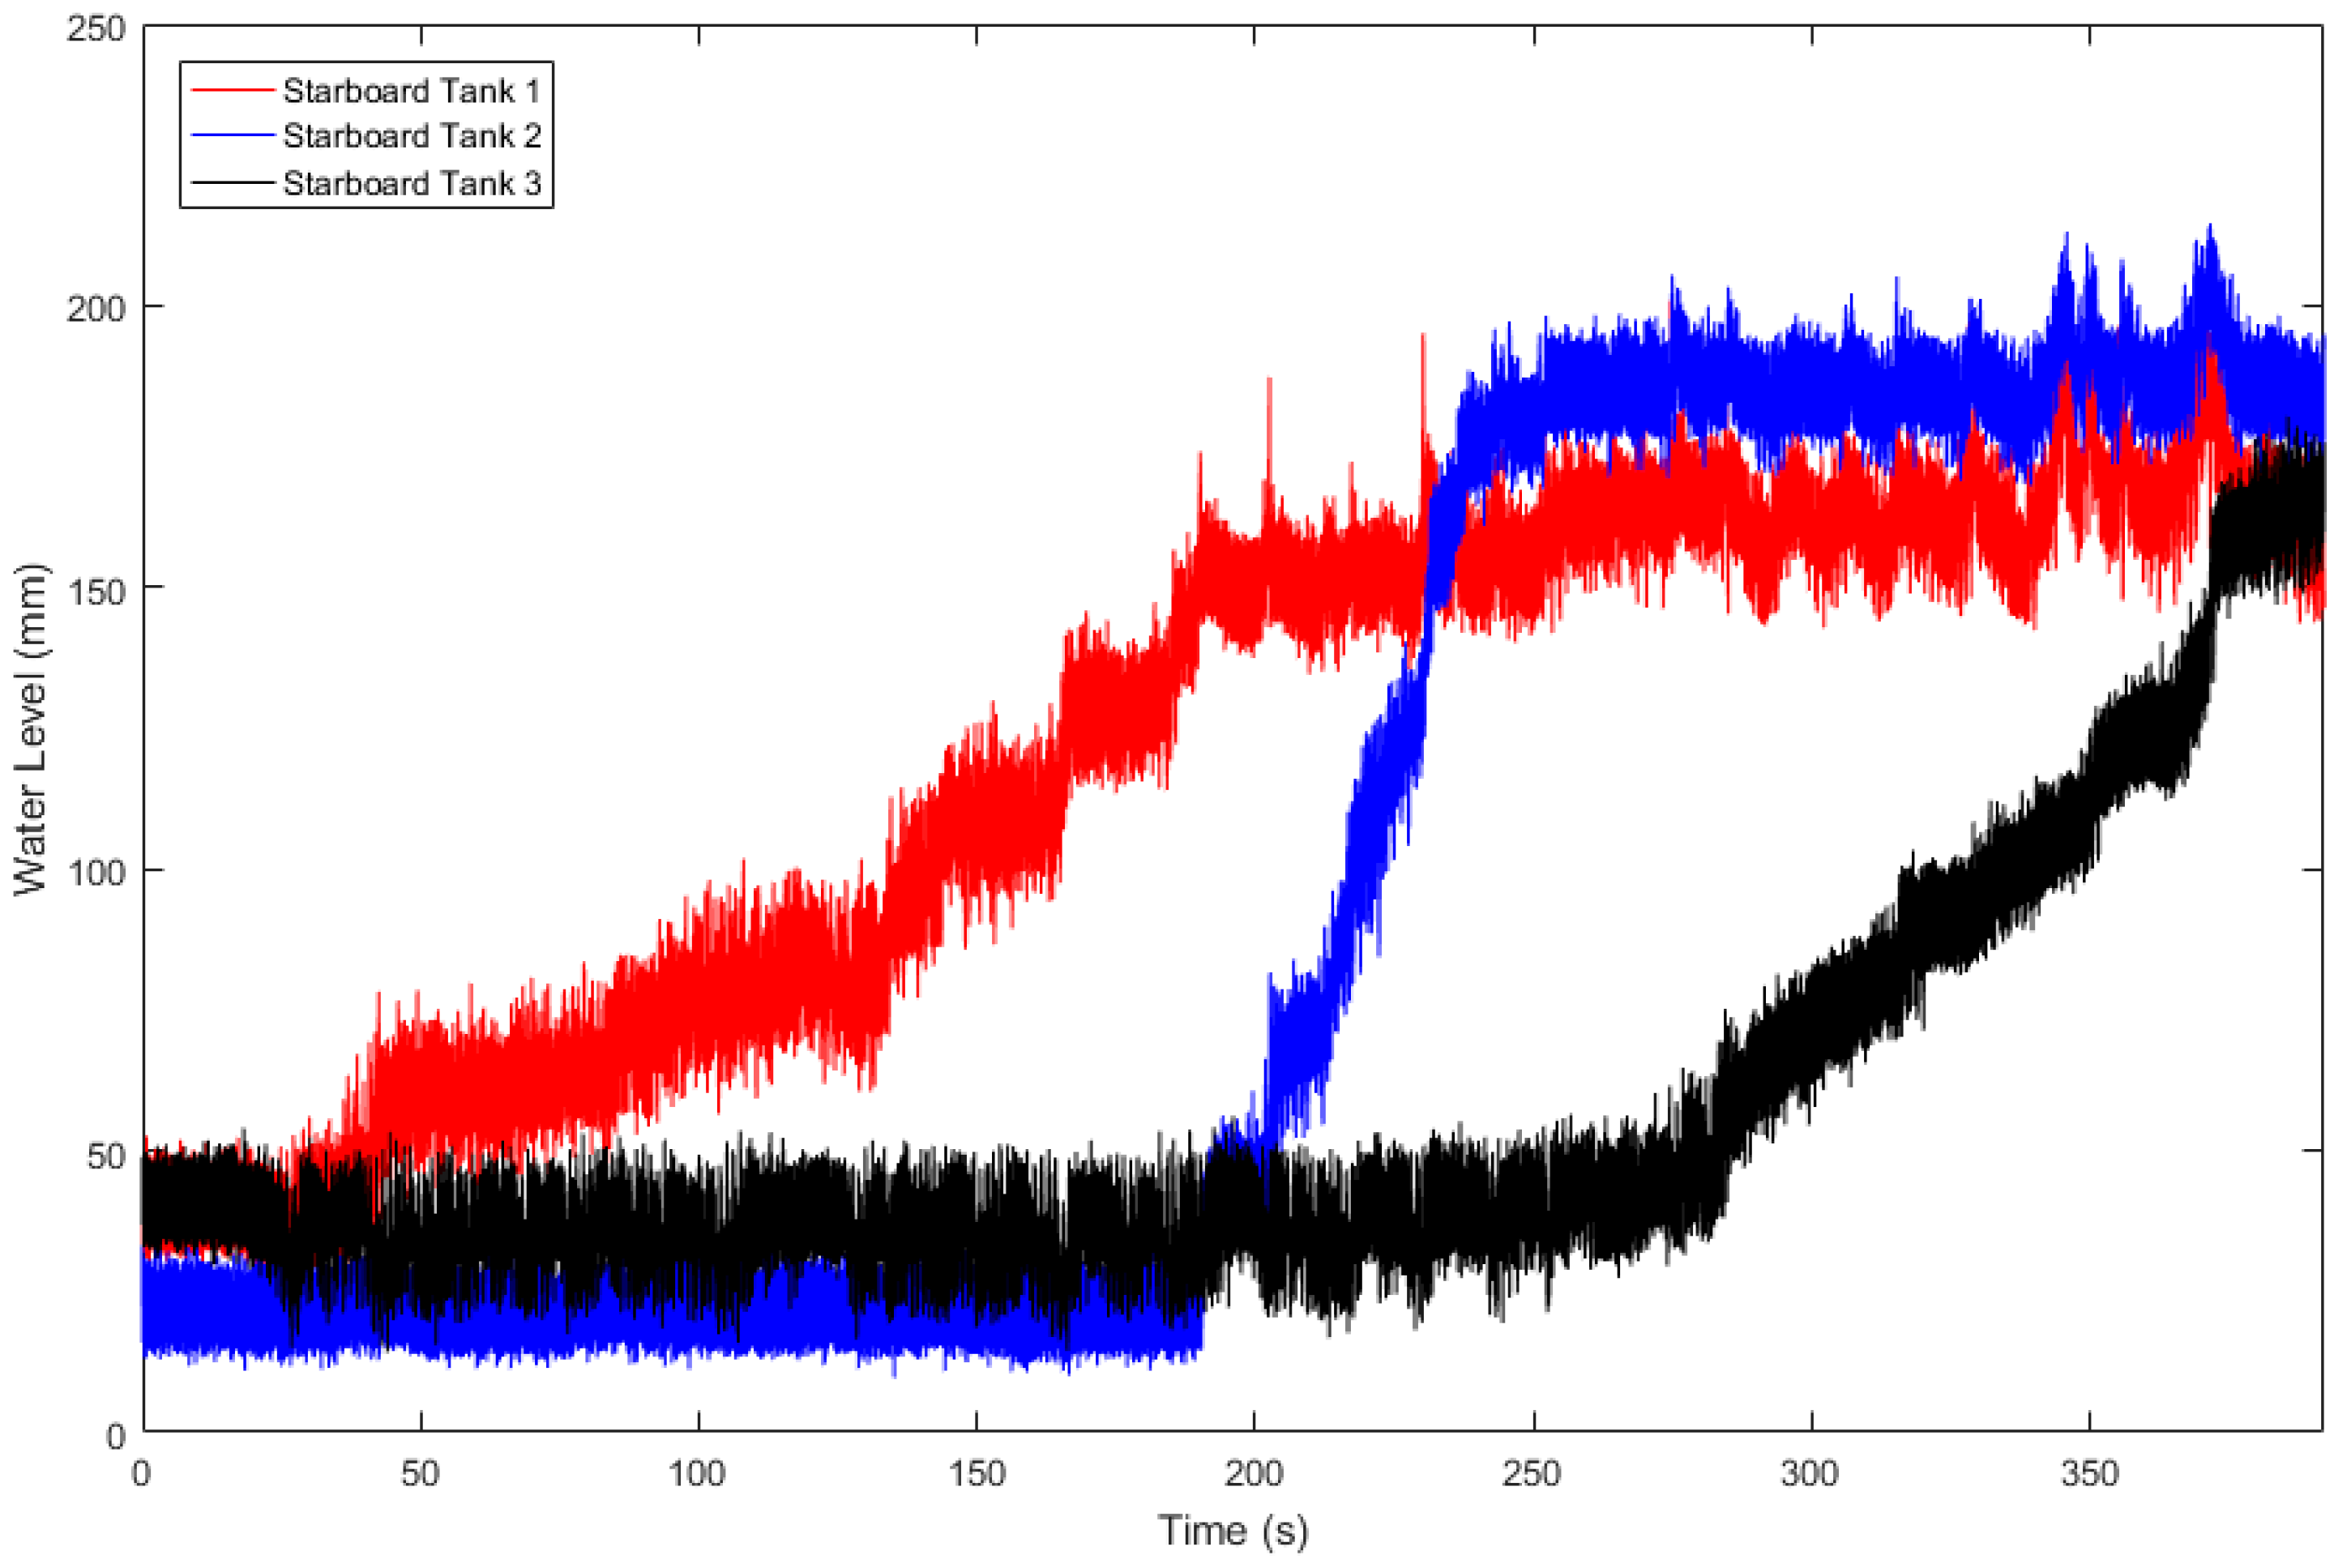
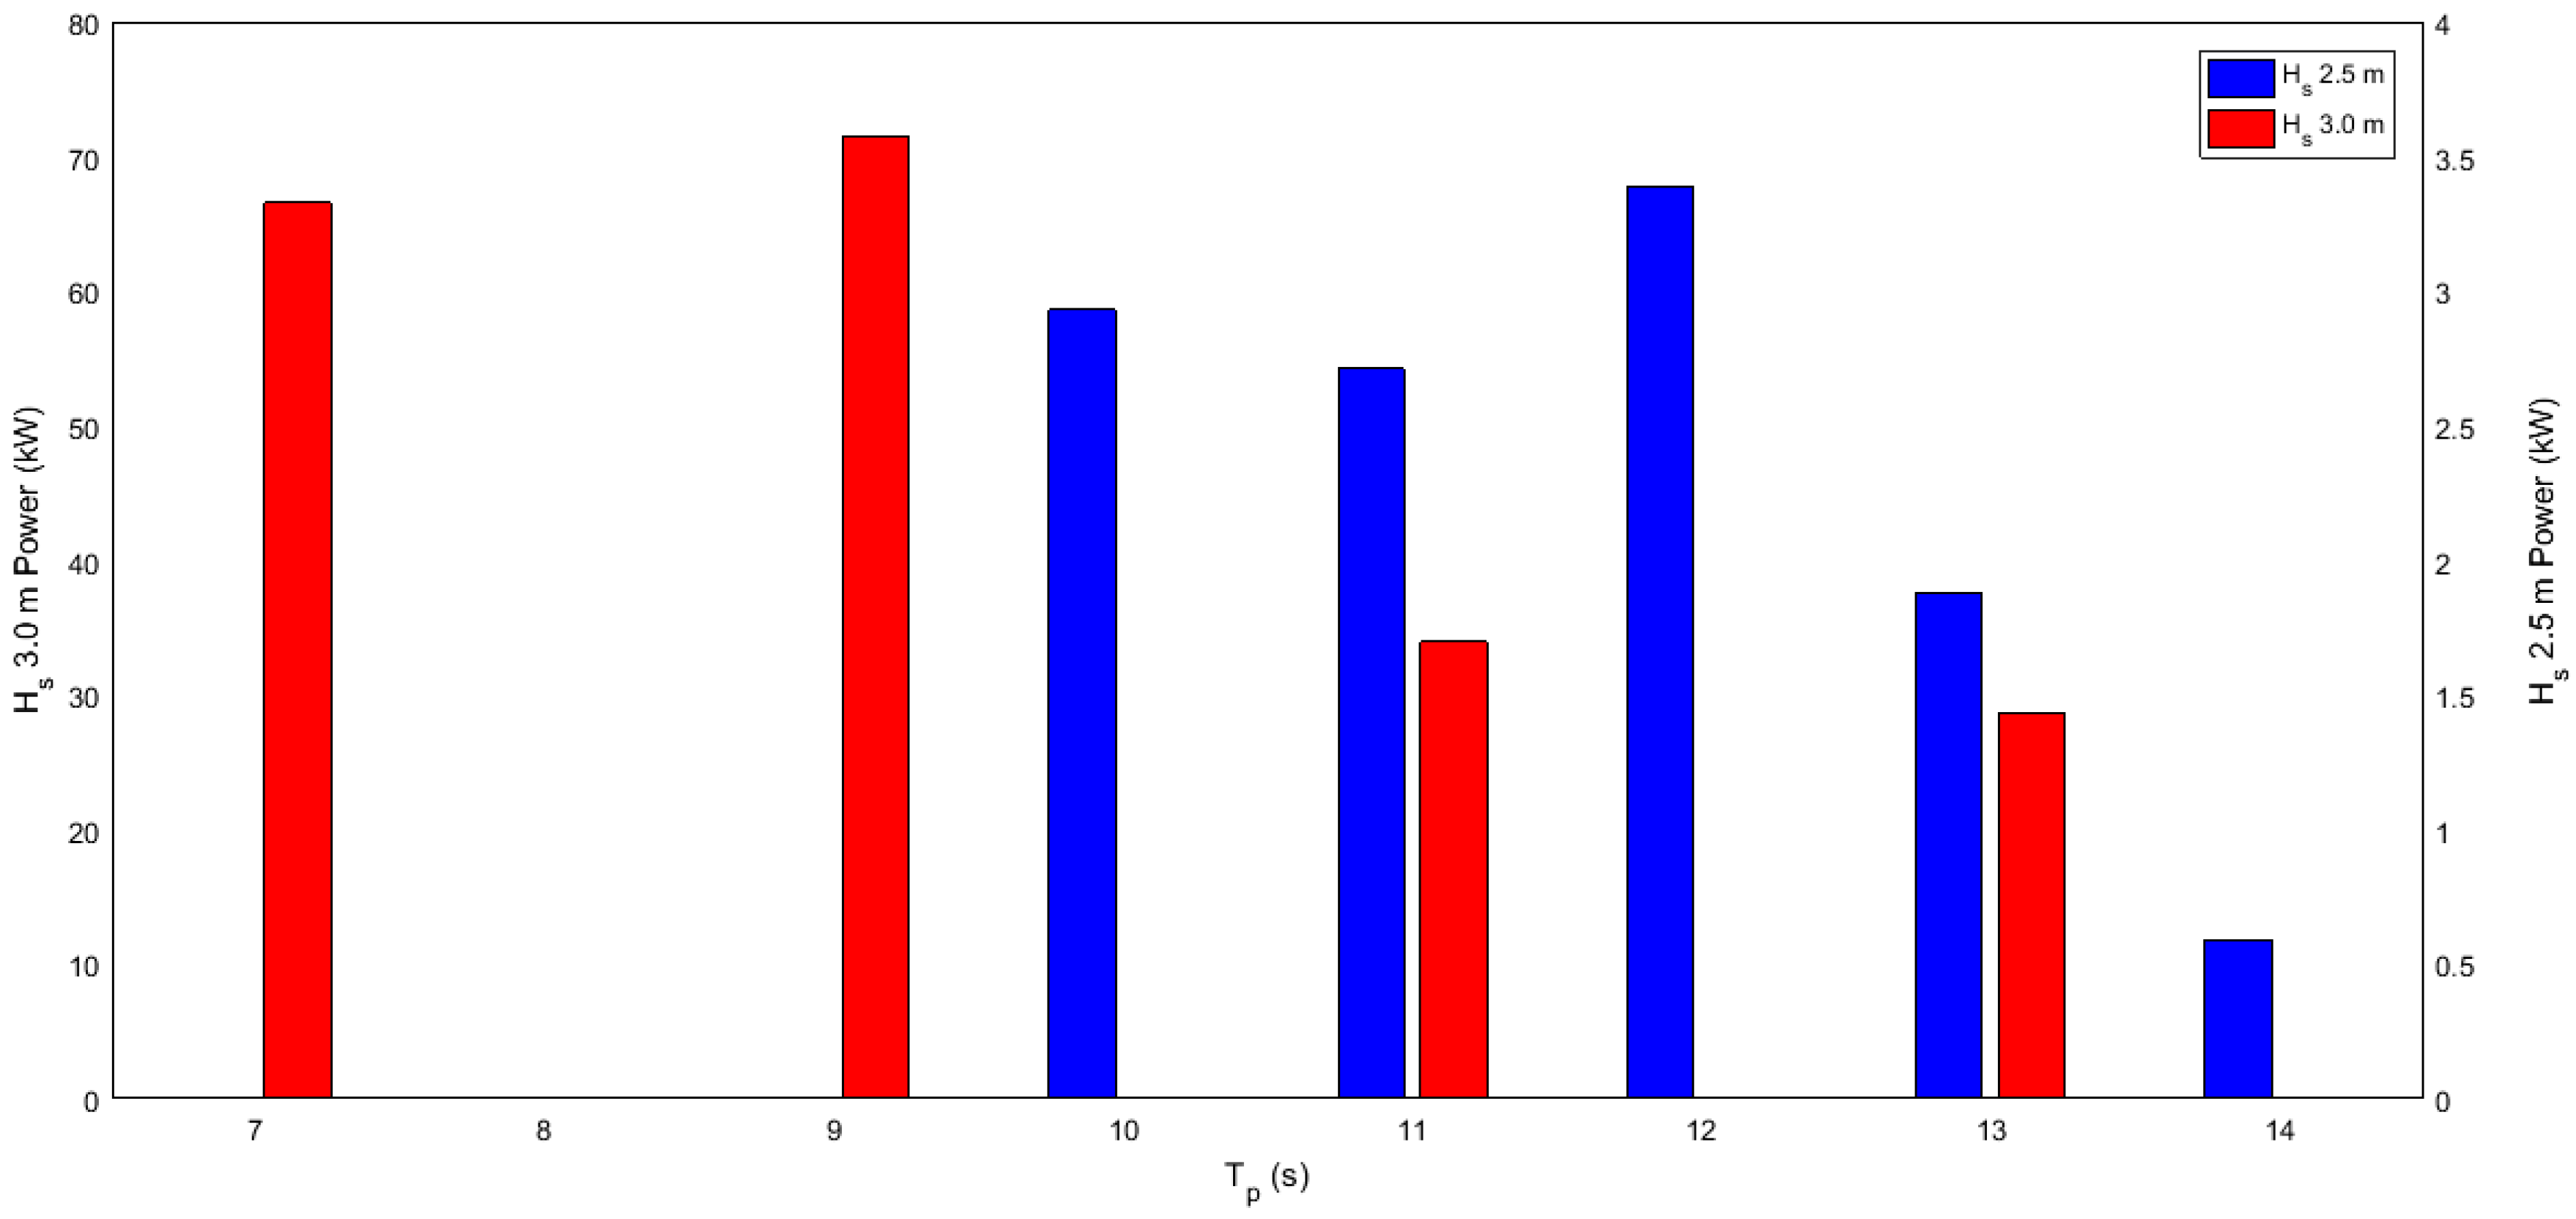
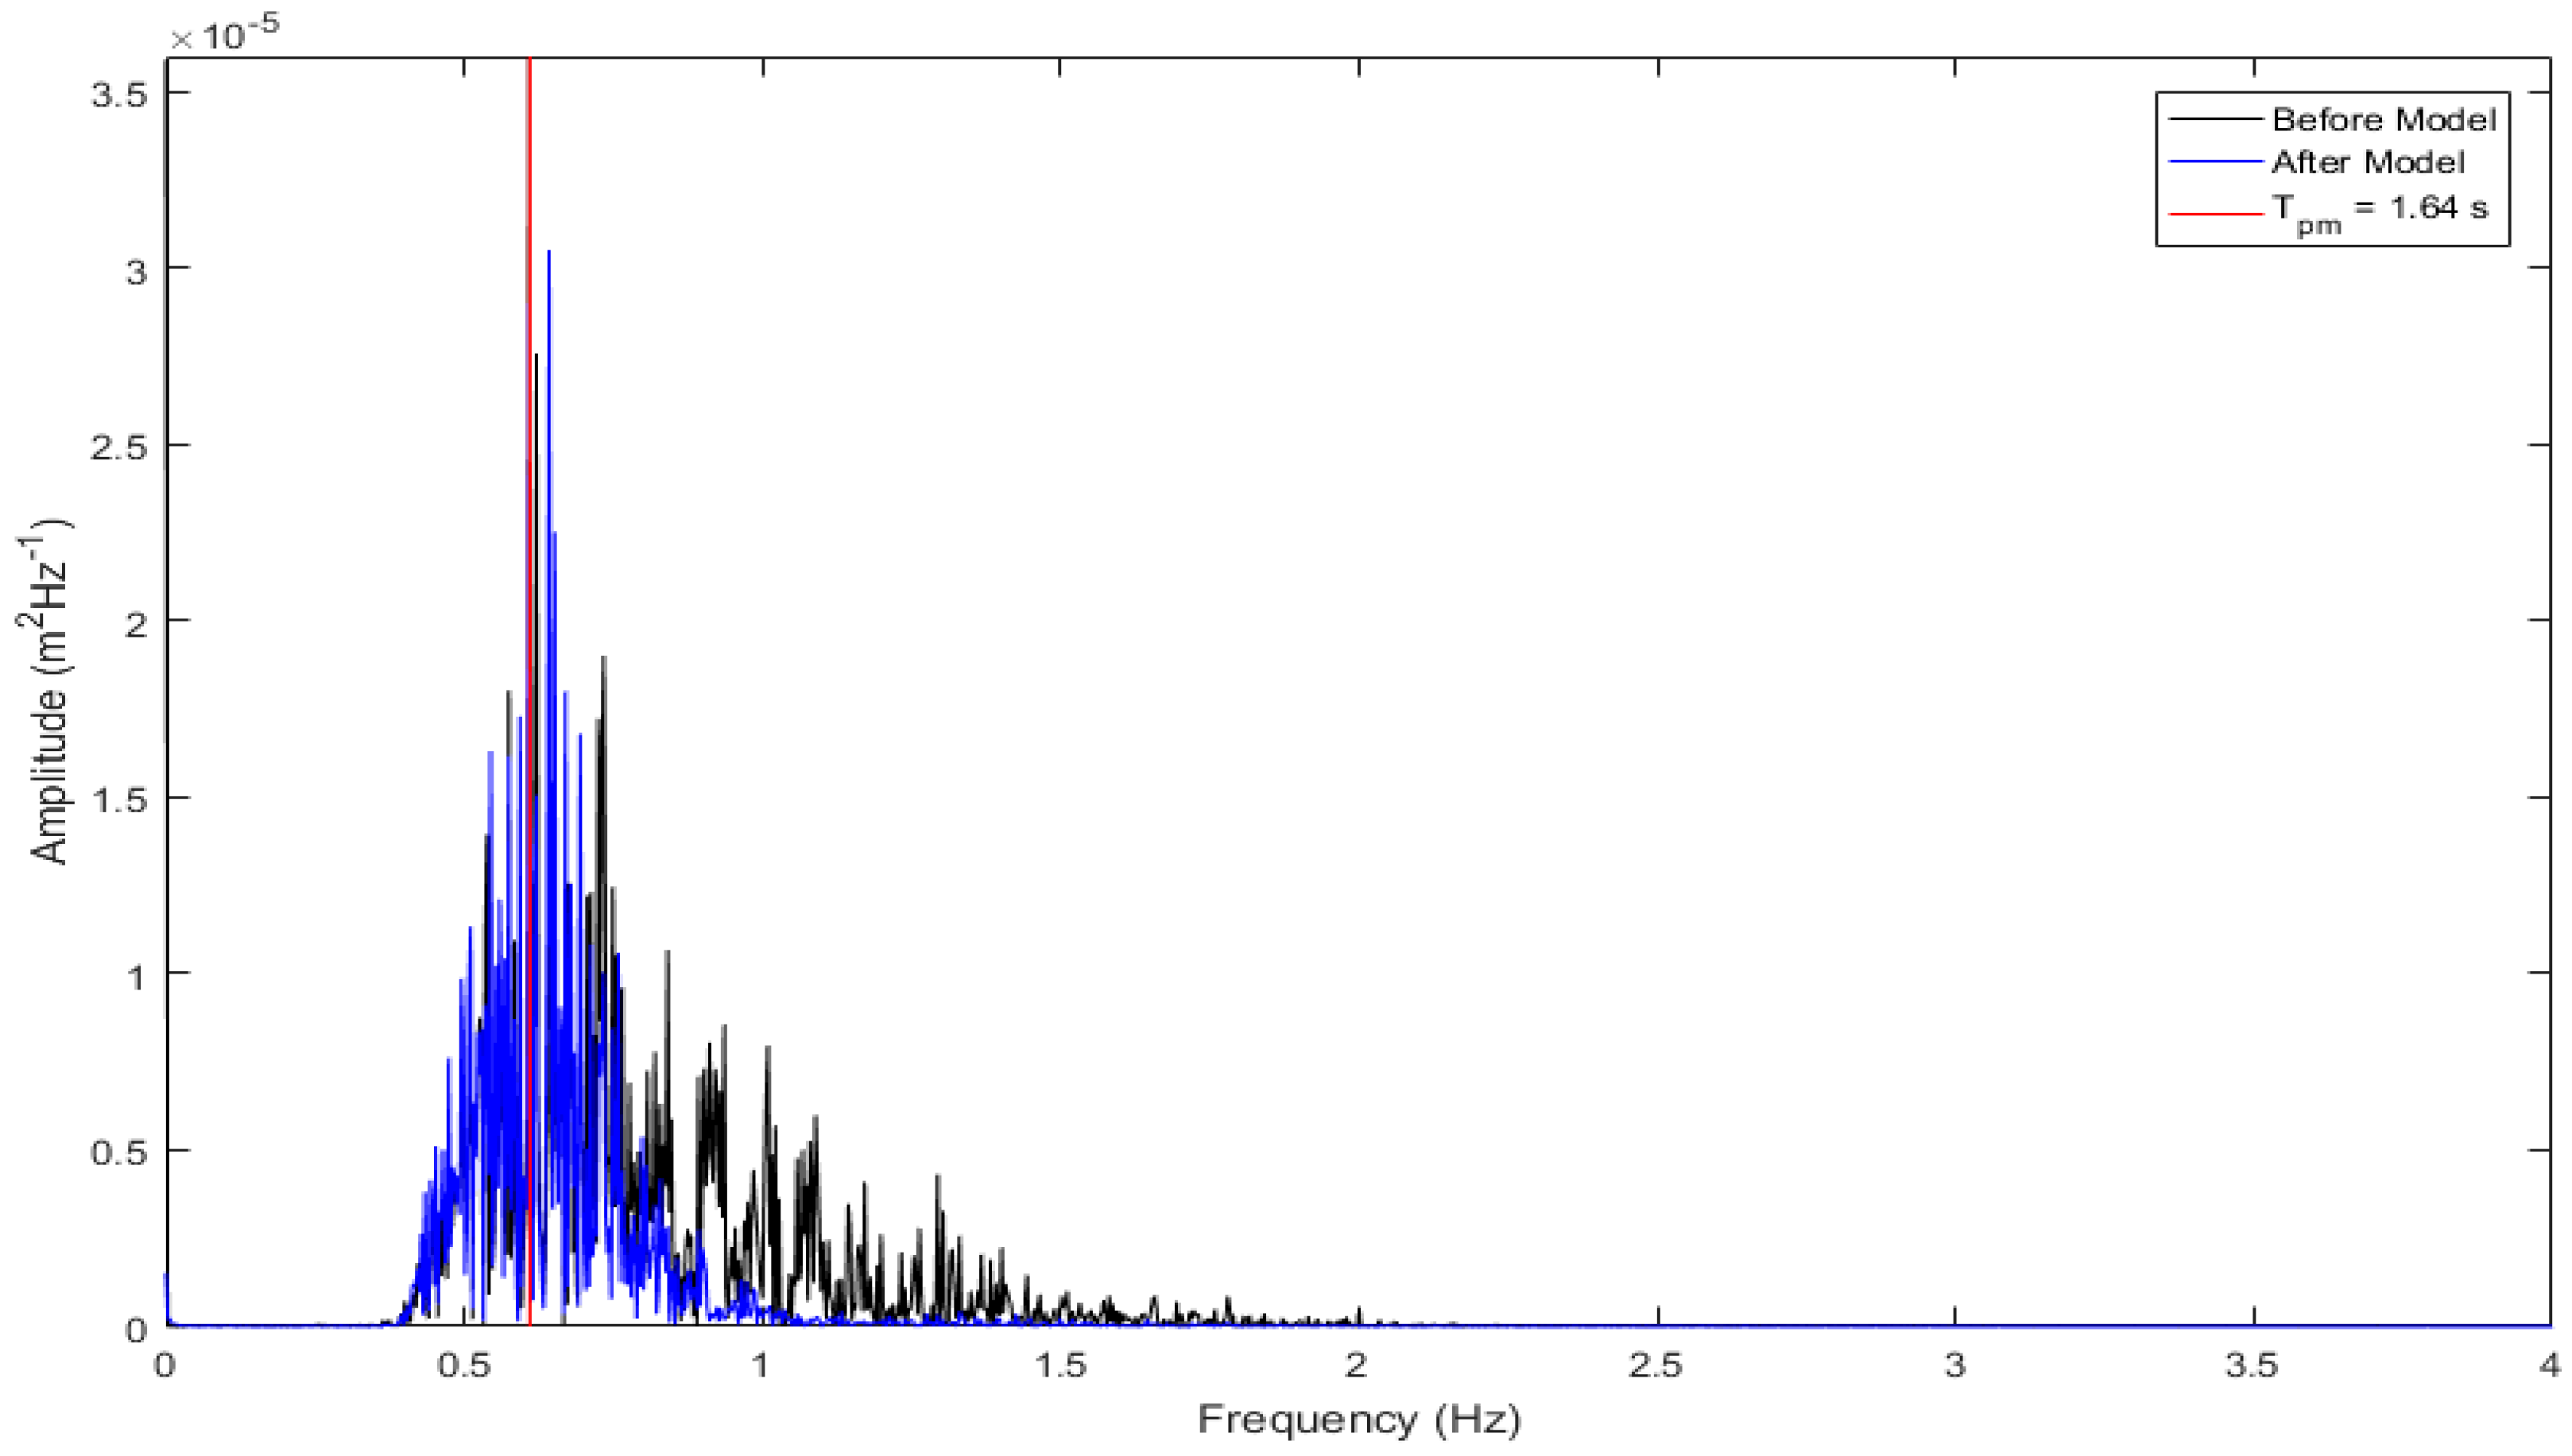
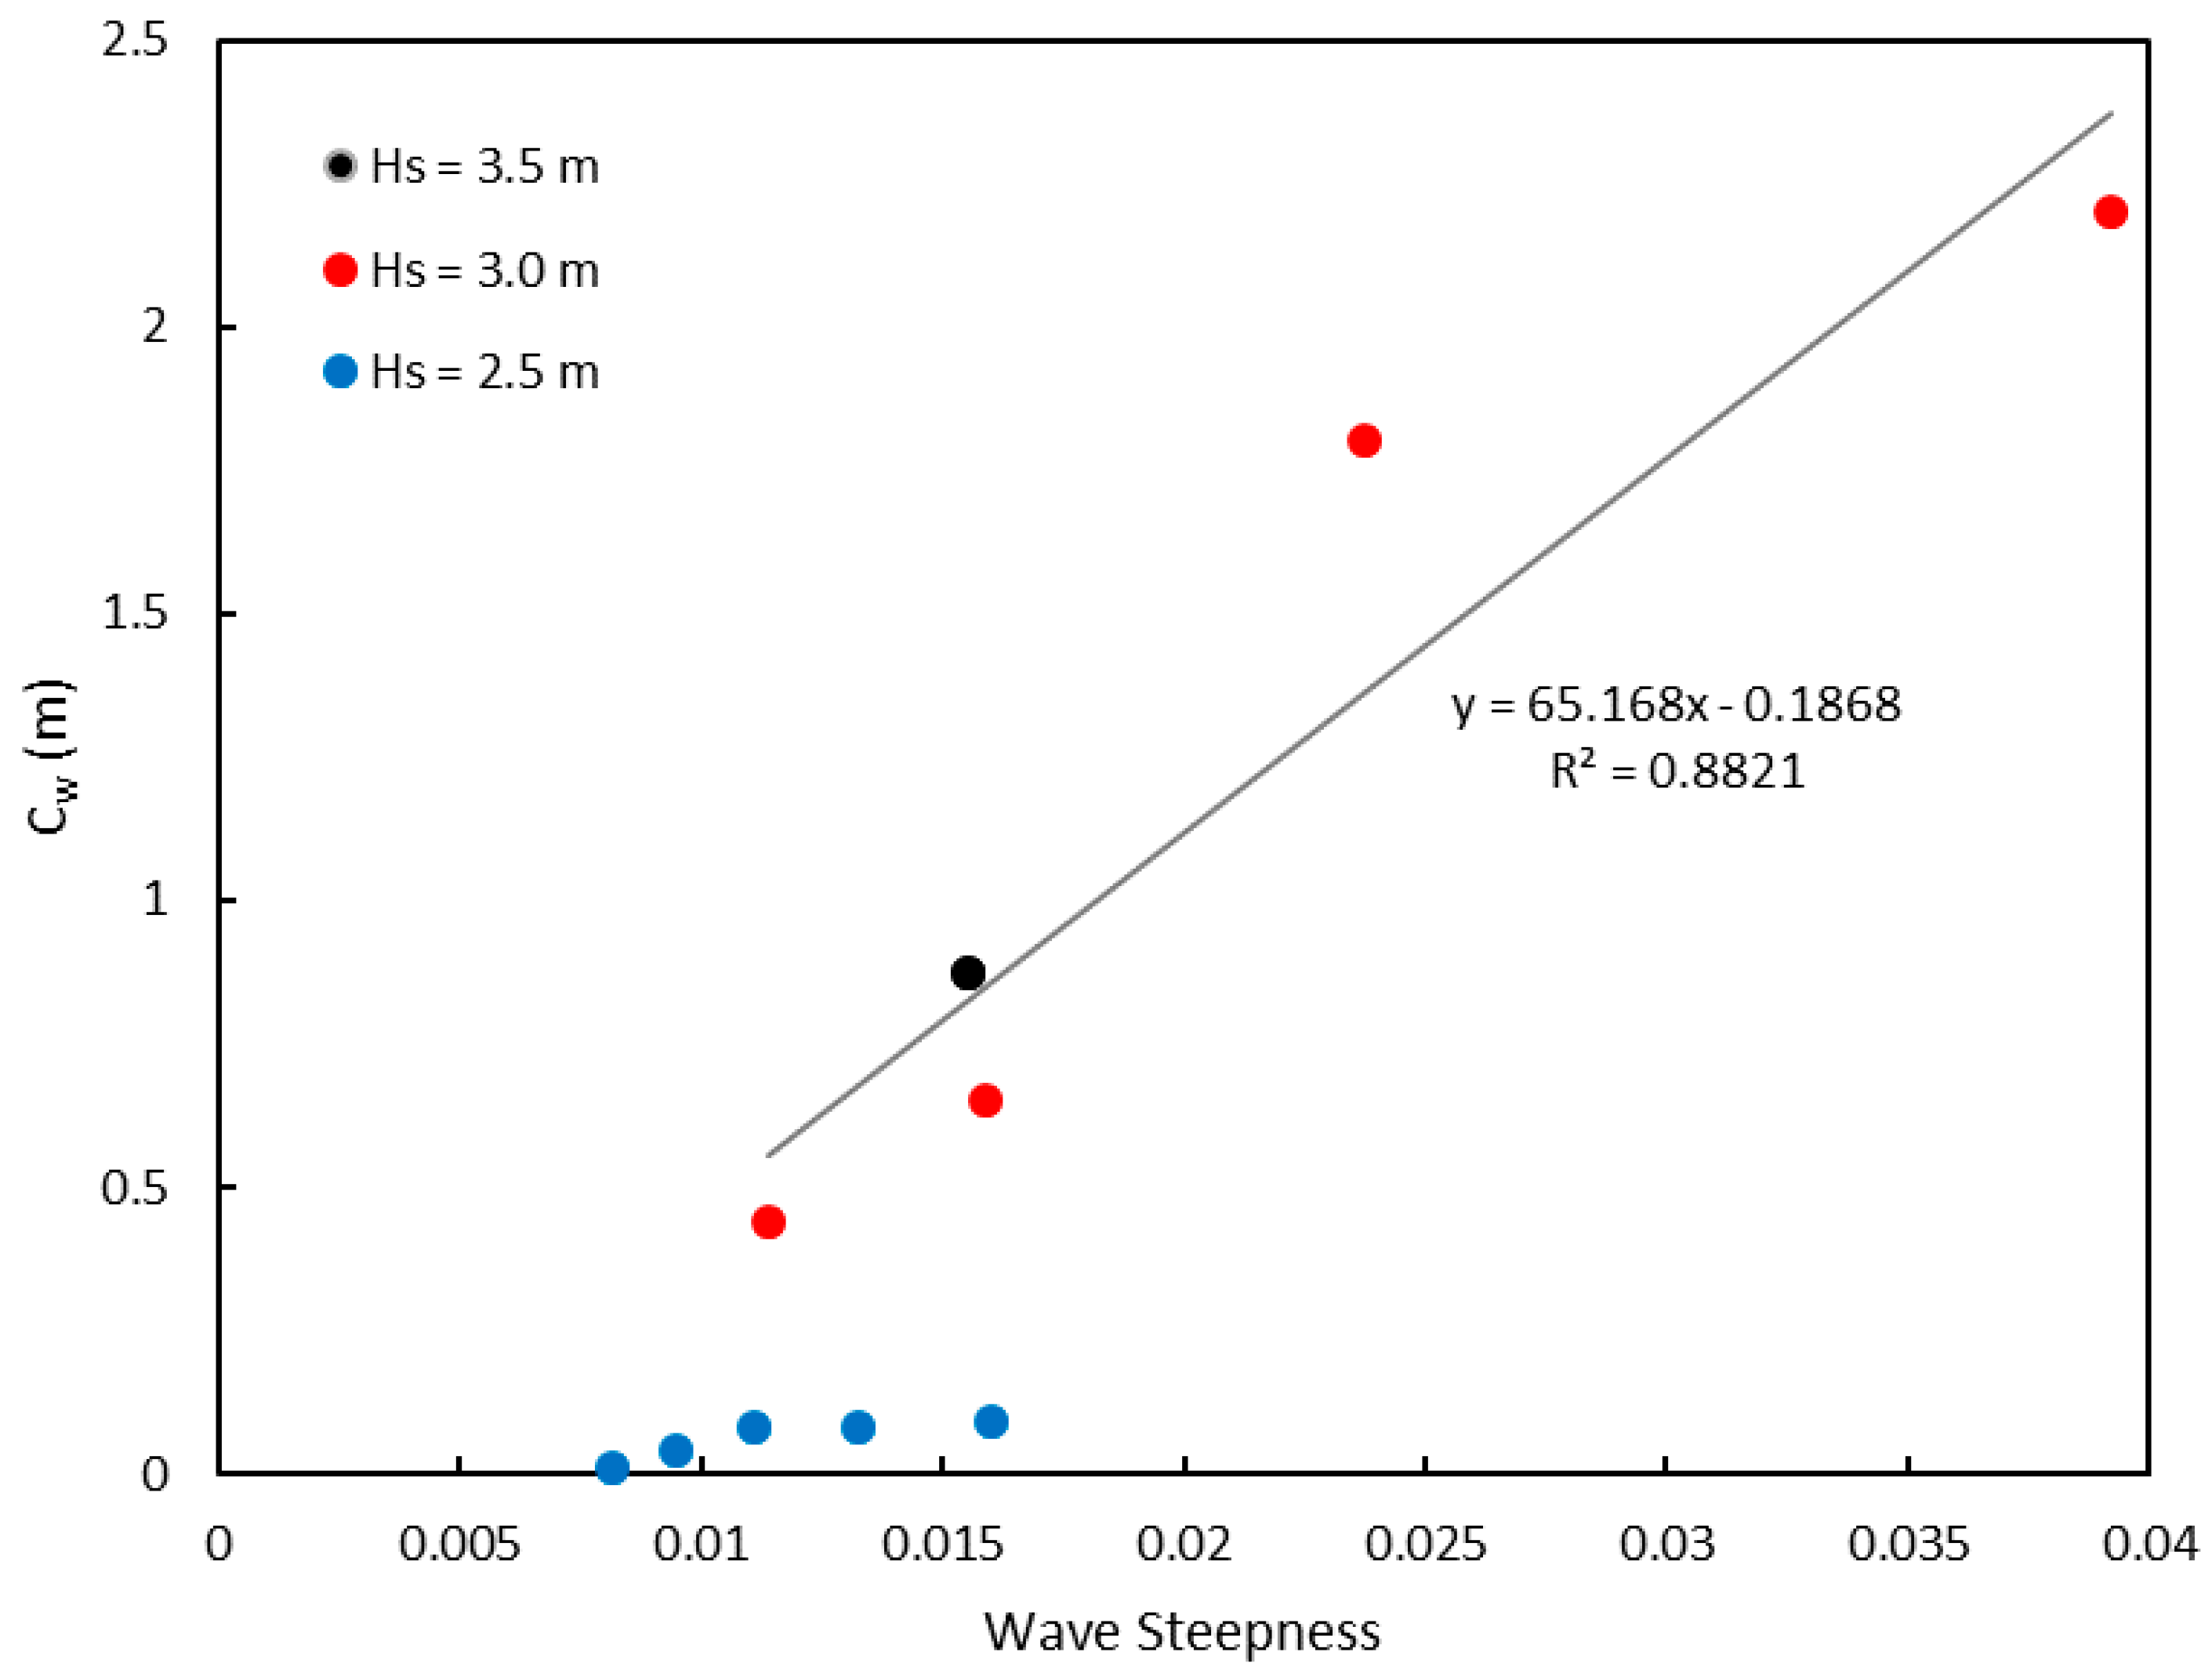
3. Results and Discussion

The Qualisys motion capture system recorded motion data for all tests performed, with and without overtopping. Figure 7 shows an example of the main movements of interest to the numerical model: heave and pitch. Heave is the translational movement in the vertical axis and pitch is the rotational motion around the axis parallel to the wave fronts. The device experiences the largest rotational and translational movements when the largest waves impinge on the model.
Figure 8 shows the levels recorded in the starboard overtopping tanks during an example test of Tpm = 2.19 s and Hsm = 0.117 m. The rearmost tank fills up first during the test, and the second tank is filled both by larger waves and when the first tank fills and cascades forward. The third tank then fills after the second tank has reached maximum capacity. Ideally the device would overtop at a rate proportional to the volume of the tank and the flow rate capacity, resulting in a constant level within the tank. This presents potential for design optimisation, to be addressed in future experiments.
In the example of the wave spectra from WG1 and WG5, shown in Figure 9, corresponding to a test with Hsm = 0.1 m and Tpm = 1.64 s, the effect of the device interacting with the wave field is apparent. The device attenuates waves of a higher frequency more than those of a lower frequency, showing that there is absorption of energy bands corresponding to higher frequencies within the sea spectra.
The potential power generation can be estimated based on the overtopping flowrate and the water head in the tanks:
P = ρ g H Q η ,
where ρ is the density of water (ρ = 1000 kg/m3), g is acceleration due to gravity (g = 9.81 m/s2), H is the head of the water in the tanks, Q is the instantaneous volumetric flowrate and η is the efficiency of the energy conversion system. Efficiency was assumed to be 75% from the combination of the efficiencies of the individual systems: 85% for the turbine, 95% for the drive and 93% for the generator. The potential power generated for tests with overtopping is presented in Table 2. The capture width, Cw, of the device is defined as:
C w = P P w ,
where P is the power as defined in Equation (1) and Pw is the power available per metre of wave front, detailed in Table 2. The WaveCat device, when at a wedge angle of 60°, will collect 3 m of wave crest at model scale and 90 m at prototype scale.
The device generated more potential power at lower values of Tp for each wave height, and increased as wave height increased, as seen in Figure 10. Wave steepness is defined by the ratio of Hs to wavelength, L, and Figure 11 shows the relationship between Cw and wave steepness. The potential power generated by the device increases as wave steepness increases. Considering only the tests that experienced significant overtopping, shown with red and black markers, the results show good correlation with R2 = 0.88. The maximum power generated was for Tp of 9 s and Hs of 3.0 m, at prototype scale, and would have generated 71 kW at prototype scale.
There is a large difference in overtopping rates between the fore and aft tanks, Figure 8, with the aft tanks collecting significantly more water. This is true for both hulls due to the models symmetry and the lack of angle spread on the incident waves. It is also observed that lower wave periods generate higher quantities of power, consistent with the spectra attenuation shown in Figure 9.
The efficiency of the device, for the device configuration tested, depends on the characteristics of the incoming wave field. With a lower Tp the device generates more power for similar Hs values. To compare devices which may have significantly different dimensions, a capture width ratio (CWR) was developed, in which the Cw of a device is divided by its significant dimension. For the WaveCat the significant dimension is the width of the wave front captured by the wedge. The typical CWR of an overtopping device is approximately 0.17, implying a device will generate power equivalent to 17% of the power contained in the total wave front acting on the device [34]. This version of the WaveCat device has a CWR of between 2.5% and 0.5% during its most productive states. Whilst this is lower than other overtopping devices it is crucial to note that the device has yet to undergo optimisation tests to increase the power generated for the same incoming wave power, whereas other overtopping devices are prototype testing in real sea conditions. The main factor in reduced CWR is the imbalance in overtopping rates along the device, where the rear tanks were becoming swamped and the fore tanks would experience reduced overtopping until the previous tank was full and cascaded forward. In addition, this study only takes into account a limited set of tests with one constant freeboard (draft) and wedge angle. This configuration has not been optimised for the sea states, which will be performed as part of future experimental and numerical campaigns. Both the freeboard/draft and the wedge angle should be varied according to the sea state to maximise overtopping rates, and this will be addressed in future optimisation. Upcoming tests are likely to produce higher CWR as they approach ideal conditions for the device and the model begins the optimisation process in future design iterations.
To potentially generate more power at lower Hsm, a number of aspects of the device configuration can be altered, and the effect of doing so will require future optimisation. Avenues to consider include widening the wedge angle for smaller Hsm values, and narrowing the angle at larger Hsm values; setting the device to have a freeboard lower at the rear of the device and focusing overtopping into the rearmost tanks; and adjusting the ballast of the device so the entire model sits lower in the water whilst increasing the level at which the valve opens to retain head.
In addition, due to the unequal filling of tanks, several solutions are proposed to explore in future iterations of the model. The first is to increase the size of the rear tanks, reducing the fore tank size, so levels remain equal during overtopping. To perform this efficiently, however, a numerical model would be preferable to test several different tank sizes in several configurations. The second solution is to use larger pipes on the rear tanks to allow the overtopped water to drain faster, again the specific pipe gauge would require optimisation. The third solution is to link the tanks so that water can be transferred between, allowing a uniform distribution of overtopping even with unequal overtopping rates along the hull. The tank walls, in this case, would act as slosh buffers and the model would effectively be one tank with several outlets.
As indicated, several key features of the device must be optimised individually and as a whole to ensure the optimum overtopping rates for any sea state, following similar optimisation pathways to those of other WECs, e.g., Wave Dragon [31] or SSG [32]. Features that require optimisation include, but are not limited to: the freeboard/draft, trim, size of tanks relative to both the device and one another, geometry of the freeboard, wedge angle, and overall shape of the hulls of the device.
A numerical model using the presented data, along with the 6DOF motion data, is currently under development with the aim of providing optimisation routines for power generation. Once the design is optimised through the numerical model, a more exhaustive campaign of tests will be carried out to fully determine the power generation properties of the device.

4. Conclusions

An experimental campaign of the WaveCat WEC at a 1:30 scale was conducted in the Ocean Basin at the University of Plymouth. The campaign had three objectives: to obtain 6DOF data for the calibration of a numerical model; to form a basis for future optimisation of power conversion rates by measuring the power generation for this specific configuration of tanks and freeboard; and to test the concept of the on-board control system.
The device experienced overtopping for waves above Hsm of 0.083 m, and more overtopping at lower Tpm. The CWR of the device was between 0.5% and 2.5% for Hsm of 0.1 m, showing the need for device optimisation.
Three main conclusions were drawn from these experimental tests. First, for a given Hsm the power generation depends heavily on Tpm. The wave period that led to the greatest potential power was Tpm = 1.64 s; both Hsm of 0.083 m and 0.1 m saw the potential power generated drop at higher Tpm values. The Cw of the device depends on the wave steepness, with the greatest Cw value corresponding with the greatest wave steepness tested and showing positive correlation. Second, the model tanks must be optimised to accept greater quantities of water in the rear tanks compared to the fore tanks, with exact values determined from a numerical modelling campaign based on the experimental results presented in this paper. Third, and most critically, the optimisation of the model is crucial to the device’s ability to generate power and a greater CWR, and steps towards this goal have been outlined.

Acknowledgments

We are grateful for the funding received by Gregorio Iglesias through a Marie Curie fellowship (WAVEIMPACT, PCIG13-GA-2013-618556). Additionally, two Santander Seed-corn Scholarships were granted to both James Allen and Jian Wan for the experimental phase of the project and development of the control systems respectively. The authors would also like to thank the staff of the COAST Laboratory at Plymouth University for their invaluable help in construction and testing the model.

Author Contributions

Gregorio Iglesias designed the concept WaveCat model and revised the text; James Allen, Gregorio Iglesias, Deborah Greaves and Jon Miles conceived and designed the experiments; Jian Wan contributed to the control systems; James Allen and Konstantinos Sampanis constructed the model, performed the experiments and analysed the data.

Conflicts of Interest

The authors declare no conflict of interest.

Abbreviations

The following abbreviations are used in this manuscript:
WECWave Energy Converter
CALMCatenary Anchor Leg Mooring
6DOFSix Degrees of Freedom
HsmSignificant Wave Height—Model Scale
TpmPeak Period—Model Scale
HsSignificant Wave Height—Prototype Scale
TpPeak Period—Prototype Scale
WGWave Gauge
CWRCapture Width Ratio

References

  1. European Parliament, Council of the European Union. Directive 2009/28/EC on the promotion of the use of energy from renewable sources. Off. J. EU 2009, 140, 16–62. [Google Scholar]
  2. Lund, H. Renewable energy strategies for sustainable development. Energy 2007, 32, 912–919. [Google Scholar] [CrossRef]
  3. Iglesias, G.; Carballo, R. Wave energy potential along the death coast (Spain). Energy 2009, 34, 1963–1975. [Google Scholar] [CrossRef]
  4. Iglesias, G.; Carballo, R. Wave resource in El Hierro—An island towards energy self-sufficiency. Renew. Energy 2011, 36, 689–698. [Google Scholar] [CrossRef]
  5. Iglesias, G.; Carballo, R. Wave energy resource in the Estaca de Bares area (Spain). Renew. Energy 2010, 35, 1574–1584. [Google Scholar] [CrossRef]
  6. Iglesias, G.; López, M.; Carballo, R.; Castro, A.; Fraguela, J.A.; Frigaard, P. Wave energy potential in Galicia (NW Spain). Renew. Energy 2009, 34, 2323–2333. [Google Scholar] [CrossRef]
  7. Mirzaei, A.; Tangang, F.; Juneng, L. Wave energy potential assessment in the central and southern regions of the South China Sea. Renew. Energy 2015, 80, 454–470. [Google Scholar] [CrossRef]
  8. Carballo, R.; Sánchez, M.; Ramos, V.; Fraguela, J.A.; Iglesias, G. The intra-annual variability in the performance of wave energy converters: A comparative study in N Galicia (Spain). Energy 2015, 82, 138–146. [Google Scholar] [CrossRef]
  9. Iglesias, G.; Carballo, R. Offshore and inshore wave energy assessment: Asturias (N Spain). Energy 2010, 35, 1964–1972. [Google Scholar] [CrossRef]
  10. Iglesias, G.; Carballo, R. Wave energy and nearshore hot spots: The case of the SE Bay of Biscay. Renew. Energy 2010, 35, 2490–2500. [Google Scholar] [CrossRef]
  11. Sierra, J.P.; González-Marco, D.; Sospedra, J.; Gironella, X.; Mösso, C.; Sánchez-Arcilla, A. Wave energy resource assessment in Lanzarote (Spain). Renew. Energy 2013, 55, 480–489. [Google Scholar] [CrossRef]
  12. Neill, S.P.; Hashemi, M.R. Wave power variability over the northwest European shelf seas. Appl. Energy 2013, 106, 31–46. [Google Scholar] [CrossRef]
  13. Carballo, R.; Sánchez, M.; Ramos, V.; Fraguela, J.A.; Iglesias, G. Intra-annual wave resource characterization for energy exploitation: A new decision-aid tool. Energy Convers. Manag. 2015, 93, 1–8. [Google Scholar] [CrossRef]
  14. López-Ruiz, A.; Bergillos, R.J.; Ortega-Sánchez, M. The importance of wave climate forecasting on the decision-making process for nearshore wave energy exploitation. Appl. Energy 2016, 182, 191–203. [Google Scholar] [CrossRef]
  15. Guanche, R.; de Andrés, A.; Losada, I.J.; Vidal, C. A global analysis of the operation and maintenance role on the placing of wave energy farms. Energy Convers. Manag. 2015, 106, 440–456. [Google Scholar] [CrossRef]
  16. Abanades, J.; Greaves, D.; Iglesias, G. Wave farm impact on the beach profile: A case study. Coast. Eng. 2014, 86, 36–44. [Google Scholar] [CrossRef]
  17. Abanades, J.; Greaves, D.; Iglesias, G. Wave farm impact on beach modal state. Mar. Geol. 2015, 361, 126–135. [Google Scholar] [CrossRef]
  18. Rusu, E.; Onea, F. Study on the influence of the distance to shore for a wave energy farm operating in the central part of the Portuguese nearshore. Energy Convers. Manag. 2016, 114, 209–223. [Google Scholar] [CrossRef]
  19. Azzellino, A.; Conley, D.; Vicinanza, D.; Kofoed, J.P. Marine renewable energies: Perspectives and implications for marine ecosystems. Sci. World J. 2013, 2013. [Google Scholar] [CrossRef] [PubMed]
  20. Abanades, J.; Greaves, D.; Iglesias, G. Coastal defence through wave farms. Coast. Eng. 2014, 91, 299–307. [Google Scholar] [CrossRef]
  21. Abanades, J.; Greaves, D.; Iglesias, G. Coastal defence using wave farms: The role of farm-to-coast distance. Renew. Energy 2015, 75, 572–582. [Google Scholar] [CrossRef]
  22. Mendoza, E.; Silva, R.; Zanuttigh, B.; Angelelli, E.; Lykke Andersen, T.; Martinelli, L.; Nørgaard, J.Q.H.; Ruol, P. Beach response to wave energy converter farms acting as coastal defence. Coast. Eng. 2014, 87, 97–111. [Google Scholar] [CrossRef]
  23. Astariz, S.; Perez-Collazo, C.; Abanades, J.; Iglesias, G. Co-located wind-wave farm synergies (operation & maintenance): A case study. Energy Convers. Manag. 2015, 91, 63–75. [Google Scholar]
  24. Pérez-Collazo, C.; Greaves, D.; Iglesias, G. A review of combined wave and offshore wind energy. Renew. Sustain. Energy Rev. 2015, 42, 141–153. [Google Scholar] [CrossRef]
  25. Buccino, M.; Banfi, D.; Vicinanza, D.; Calabrese, M.; Giudice, G.; Carravetta, A. Non breaking wave forces at the front face of seawave slotcone generators. Energies 2012, 5, 4779. [Google Scholar] [CrossRef]
  26. Buccino, M.; Vicinanza, D.; Salerno, D.; Banfi, D.; Calabrese, M. Nature and magnitude of wave loadings at seawave slot-cone generators. Ocean Eng. 2015, 95, 34–58. [Google Scholar] [CrossRef]
  27. Iglesias, G.; Fernandez, H.; Carballo, R.; Castro, A.; Taveira-Pinto, F. The WaveCat ©—Development of a new wave energy converter. In Proceedings of the World Renewable Energy Congress, Linkoping, Sweden, 8–13 May 2011; pp. 2151–2158.
  28. Fernandez, H.; Iglesias, G.; Carballo, R.; Castro, A.; Fraguela, J.A.; Taveira-Pinto, F.; Sanchez, M. The new wave energy converter WaveCat: Concept and laboratory tests. Mar. Struct. 2012, 29, 58–70. [Google Scholar] [CrossRef]
  29. Fernandez, H.; Iglesias, G.; Carballo, R.; Castro, A.; Sanchez, M.; Taveira-Pinto, F. Optimization of the WaveCat wave energy converter. Coast. Eng. 2012. [Google Scholar] [CrossRef]
  30. Frigaard, P.; Kofoed, J.P.; Knapp, W. Wave dragon. Wave power plant using low-head turbines. In Proceedings of the Hidroenergia, Falkenberg, Sweden, 17–19 June 2004.
  31. Kofoed, J.P.; Frigaard, P.; Friis-Madsen, E.; Sørensen, H.C. Prototype testing of the wave energy converter Wave Dragon. Renew. Energy 2006, 31, 181–189. [Google Scholar] [CrossRef]
  32. Margheritini, L.; Vicinanza, D.; Frigaard, P. SSG wave energy converter: Design, reliability and hydraulic performance of an innovative overtopping device. Renew. Energy 2009, 34, 1371–1380. [Google Scholar] [CrossRef]
  33. Reeve, D.; Chadwick, A.; Fleming, C. Coastal Engineering: Processes, Theory and Design Practice; Taylor & Francis: Abingdon, UK, 2004. [Google Scholar]
  34. Babarit, A. A database of capture width ratio of wave energy converters. Renew. Energy 2015, 80, 610–628. [Google Scholar] [CrossRef]
Figure 1. The concept design of the WaveCat WEC (Reprinted from [28]).
Sustainability 08 01339 g001
Figure 2. Plan and lateral view of the model with dimensions in mm and at model scale. The wedge angle aperture can range between 0°, closed, and 170°.
Sustainability 08 01339 g002
Figure 3. The new physical model used for this experiment built at the University of Plymouth containing four tanks in each hull.
Sustainability 08 01339 g003
Figure 4. (a) The reflective markers mounted on the nose of each hull of the device; (b) The Qualisys motion tracker program showing all the markers mounted on the device. The markers in (a) are represented by the cluster of yellow markers at the top right of the image.
Sustainability 08 01339 g004
Figure 5. The wave tank layout and experimental setup, showing the WaveCat model and the location of the wave gauges (WG1 to WG7) in the tank. Dimensions in m.
Sustainability 08 01339 g005
Figure 6. Lateral view of the wave tank and experimental setup showing the model, floor depth and mooring system. Dimensions in m.
Sustainability 08 01339 g006
Figure 7. Pitch (a) and heave (b) for an irregular sea state with Hsm = 0.05 m and Tpm = 2.19 s (model values).
Sustainability 08 01339 g007
Figure 8. The levels in the rear three overtopping tanks in the starboard hull during a test with Tpm = 2.19 s and Hsm = 0.117 m (Tp = 12 s and Hs = 3.5 m). Tanks 1, 2 and 3 are the rearmost, second rearmost and furthest forward tanks, respectively.
Sustainability 08 01339 g008
Figure 9. The spectra of waves before the device and behind. The Tpm value of the test case is 1.64 s.
Sustainability 08 01339 g009
Figure 10. The potential power generation for tests with Hs values of 3.0 m, in red, and 2.5 m, in blue, with constant freeboard for all tests. Dimensions in prototype scale.
Sustainability 08 01339 g010
Figure 11. The Cw compared to wave steepness for tests with Hs values of 3.0 m, in red, and 2.5 m, in blue. Dimensions in prototype scale.
Sustainability 08 01339 g011
Table 1. Test parameters where overtopping occurred. Hs and Hsm represent significant wave height in prototype and model scales respectively. Tp and Tpm represent peak periods in prototype and model scales, respectively.
Test CaseHsm (m)Hs (m)Tpm (s)Tp (s)
10.1003.01.277
20.1003.01.649
30.1003.02.0011
40.1003.02.3713
50.1173.52.1912
60.0832.51.8210
70.0832.52.0011
80.0832.52.1912
90.0832.52.3713
100.0832.52.5514
Table 2. Potential power generated in the tests compared to the incident wave power. Hs is significant wave height at prototype scale. Tp is peak period in prototype scale. Pm and P are power generated by the device at model and prototype scale, respectively, Pwm and Pw are the power per metre of wave in incident waves for each test for model and prototype scale, respectively, and Cw is the capture width of the device at prototype scale.
Test CaseHs (m)Tp (s)Pm (W)P (kW)Pwm (W·m−1)Pw (kW·m−1)Cw (m)
13.070.4566.570.2030.22.20
23.090.4871.420.2739.71.80
33.0110.2333.950.3552.00.65
43.0130.1928.710.4465.40.44
53.5120.4769.120.5479.90.87
62.5100.022.930.2131.60.09
72.5110.022.710.2436.10.08
82.5120.023.390.2840.80.08
92.5130.011.880.3145.40.04
102.5140.000.590.3449.80.01

