1. Introduction
Pavement results in failure due to excessive load and climate effects. When analysing climate factors influencing pavement performance, frost is assumed to be a decisive element in cold regions. Beskow [
1] was one of the first researchers to analyse frost phenomena in the pavement. Any pavement layer (including the subgrade) that becomes frozen undergoes a change in volume owing to the pore water conversion to ice lenses. The water, changing its phase, expands about 8%–10%. As ice lenses grow, they push soil or fine aggregate particles apart, creating void space. This void space, lying on the water-ice boundary, leads to further water accumulation if surplus water is available. The repetition of this procedure results in a large volume increase, leading to a raised and uneven pavement surface, i.e., development of frost heaves.
When the ice melts, the water content remains much higher than it was before freezing. It results in a very weak subgrade, subbase and/or base layer, leading to a decrease in pavement bearing capacity. White and Coree [
2] have reported that, in the American Association of State Highway and Transportation Officials (AASHTO) road test, 60% of distresses occurred in spring thaw. St-Laurent and Roy [
3] carried out measurements on several test sections in Quebec and announced that the relative damage caused by a given load during spring thaw is about 1.5–3 times higher than the average annual damage. Doré and Savard [
4] observed two test roads and reported that more than 90% of the fatigue cracks in these pavements occurred in partial winter thaw or spring thaw periods. Zhang and Macdonald [
5] performed full-size testing in the Danish Road Testing Machine. This study indicated that about 60%–75% of the permanent deformation in the tested pavement structures occurred during the spring thaw. Salour and Erlingsson [
6] back-calculated deflection data of falling weight deflectometer of the test section and pointed out that bearing capacity of the subgrade and granular layer reduced by 63% and 48% in the spring thaw compared with the recovered summer values. This confirms that frost is an essential factor influencing pavement performance.
In the European Union, the cost of maintenance and rehabilitation due to winter is about 245 million euros a year, based on 2000–2010 data [
7]. The consequences of one occasional severe winter, in a country of normally moderate climate, may be devastating. For example, in France, the severe winter of 1962–1963 caused damage estimated at 800 million euros [
8]. The situation is worse in the northern countries. For instance, on Norway’s national roads the cost of winter amounts to about 150 million euros [
9]. The US Federal Highway Administration spends millions of euros on repair of infrastructure damaged by snow and ice. It is about 30% of the maintenance budget of cold countries [
10].
Pavement deterioration due to the frost effect is restricted by using non-frost-susceptible materials within the frost zone and regulating water accumulation. Therefore, the number of particles smaller than 0.063 mm and water permeability are the main requirements of the frost blanket course [
11]. Experience shows that the thickness of constructed pavement structure is often inadequate and that frost penetrates into the subgrade of frost-susceptible materials. This confirms Lithuanian practice. There, the initial thickness of the frost resistant pavement structure varies from 55 cm to 90 cm depending on subgrade susceptibility to frost and the number of equivalent single axle loads (ESALs). However, the actual frost depth is greater than the thickness of the constructed frost resistant pavement structure. At the test road, in which the thickness of the frost resistant pavement structure is 85 cm, frost depth was recorded as being greater than 130 cm in winter 2012/2013 [
12]. An inadequate pavement thickness leads to the development of distresses [
13]. Besides, according to the data available with road weather stations (RWSs), in severe winters frost depth in some roads reaches even more than 140 cm. Thus, countries in which the development of frost defects is an issue have to apply a more reliable design approach that ensures adequate pavement resistance to frost. The purpose of this paper is to introduce the design approach of the frost resistant pavement structure based on RWS data.
2. Analysis of the Thickness Calculation of the Frost Resistant Pavement Structure
Most of the methods used to calculate the thickness of the frost resistant pavement structure considering the effect of frost are empirical or semi-empirical and based on:
In France, the effect of frost on pavement performance is assessed by the freezing index. The thickness of designed pavement structure is selected on the basis of the atmospheric freezing index that the pavement is able to withstand. It has to be greater than the reference freezing index. The atmospheric freezing index that the pavement is able to withstand is evaluated according to the subgrade susceptibility to the frost, the thickness and nature of the capping layer and mechanical function fulfilled by the pavement. Two reference indexes are usually used: exceptional freezing index (the highest freezing index since 1951) and non-exceptional freezing index (freezing index within the last 10 years). The consideration of the frost effect on pavements is very significant in the north-east of France, where most pavement structures designed by mechanical conditions have to be overdesigned in view of the effect of frost [
14]. A detailed study of how climate change will affect the design of the frost resistant pavement structure revealed that by 2100 climate change will drastically reduce the effect of frost on pavement performance and that it will become less important than the mechanical effect for the main network [
15].
In Poland, pavement structure is protected from negative frost effect by considering the maximum frost depth. The thickness of the frost resistant pavement structure is calculated by multiplying the maximum frost depth by a coefficient that depends on soil type and number of ESALs. The coefficient varies from 0.40 to 0.85. The lowest value is used if the soil is the least susceptible to the frost and the number of ESALs is less than 0.09 million, while the highest value is used if the soil is the most susceptible to the frost and the number of ESALs is higher than 52 million. The maximum frost depth is determined by the map in which the country is zoned according to the maximum frost penetration into the pavement. However, the map is not reviewed and updated annually, so it does not represent the effect of climate change [
16]. Similar approaches to pavement protection from negative frost effect are implemented in Alaska (USA), Iceland, Denmark and Norway [
17]. Neither of these methods considers the amount of frost heave.
Only a few cold countries (such as Finland, Sweden and Quebec (Canada)) calculate the thickness of the frost resistant pavement structure according to allowable frost heave, which depends on road category/type and climate zone (
Table 1 and
Table 2). Through this method a predicted (calculated) frost heave is compared with allowable frost heave, and the thickness of pavement structure is adjusted to meet this criterion. In Finland, frost heave calculation is based on segregation potential of subgrade soil, freezing index and specific local conditions. The segregation potential describes the degree of frost heave in the subgrade. It refers to the ratio between the rate of frost heave and the temperature gradient affecting at the frost line [
18]. In Finland and Quebec, the SSR model for frost heave calculation is used [
19,
20]. In Sweden, frost heave is designed using PMS Object design software. The calculation is based on classical heat transfer equations and assesses materials’ properties and water migration. The climate data are used from the closest road weather station (RWS) [
21].
3. Data Analysis of Road Weather Stations
RWSs have been operating for more than 45 years. Initially, usage has been related to the need to assess road quality during winter and to optimize winter maintenance, i.e., to reduce delays, accidents, etc. [
24]. One of the first simple stations that were contacted via the telephone network for icy road warnings was installed in Sweden in 1972 [
25]. Today, RWSs are a part of different road weather information systems (RWISs) in approximately 25 countries.
An RWS is a weather (meteorological) station installed adjacent to the road at a selected location. It provides real-time, accurate and local-specific road surface conditions and weather data. It consists of various types of sensors that make it possible to obtain information on:
air temperature;
relative air humidity;
type and amount of precipitation;
wind direction and speed;
pavement surface temperature;
temperature at different pavement depths;
surface condition, etc.
Since the initiation of the use of RWS on the road network it has dramatically changed, i.e., from simple stations that could be connected via the telephone network for icy road warnings to a more sophisticated and modern Internet-based technology. Nowadays, RWSs automatically collect and directly transmit data. The periodicity of data transmission depends on country policy and weather conditions. Commonly, basic data related to road conditions are available to all road users. Therefore, some RWSs provide weather forecasts [
10].
Road Administrations from Finland, Estonia, Latvia and Lithuania provide RWS data to an international project called Balticroads (see
www.balticroads.net), which provides the latest information from RWSs and road cameras from all countries participating in the project.
The number of installed RWSs in the country depends on many things: financial state of road sector, density of road network, density of population, population, traffic volume, country’s area and other criteria [
26]. The number of RWSs in some countries is given in
Table 3. It is emphasized that the data could now be slightly discrepant because of the continuous expansion of RWSs and for other reasons.
The concept of mapping and zoning considering RWS data was developed in order to represent all road networks and identify areas that show similar climatic characteristics under given weather conditions [
27,
28,
29]. The first commercial thermal map in the UK was produced for the A9 Highland region of Scotland in 1984 [
27].
RWS data are used not only for maintenance planning, but also for pavement design and load restriction during spring [
30]. RWSs can represent actual frost depth in road location. However, most RWSs do not provide temperatures at different pavement depths. The number of RWSs measuring temperatures at different depths is shown against these depths in
Table 3.
4. Design Approach of the Frost Resistant Pavement Thickness Based on RWS Data
The experience in foreign countries shows that pavements are protected from failures caused by frost by ensuring sufficient thickness of the frost resistant pavement structure. This keeps frost from penetrating or limits its penetration into the frost-susceptible subgrade, preventing significant frost defects from developing.
Generally, the thickness of the frost resistant pavement structure is selected without analysis of actual frost penetration into the pavement. The reason for this is a lack of frost depth data and a difficulty in predicting how deep the frost will penetrate into the pavement. Besides, the frost data collected from meteorological stations are not appropriate for the thickness calculation of the frost resistant pavement structure because stations are typically constructed in open terrain where snow is not removed during winter. This leads to different thermal transmission to the soil compared with the pavement structure from which snow is removed. For example, in Lithuania the frost depth reaches 30–60 cm according to data from meteorological stations. Occasionally it can reach 80 to 90 cm [
31]. However, according to RWS data, in most stations frost depth reaches more than 140 cm. The maximum frost depth (179 cm) was determined in winter 2012–2013 in Šilagalys. Consequently, RWS data are more relevant to the thickness calculation of the frost resistant pavement structure than meteorological station data.
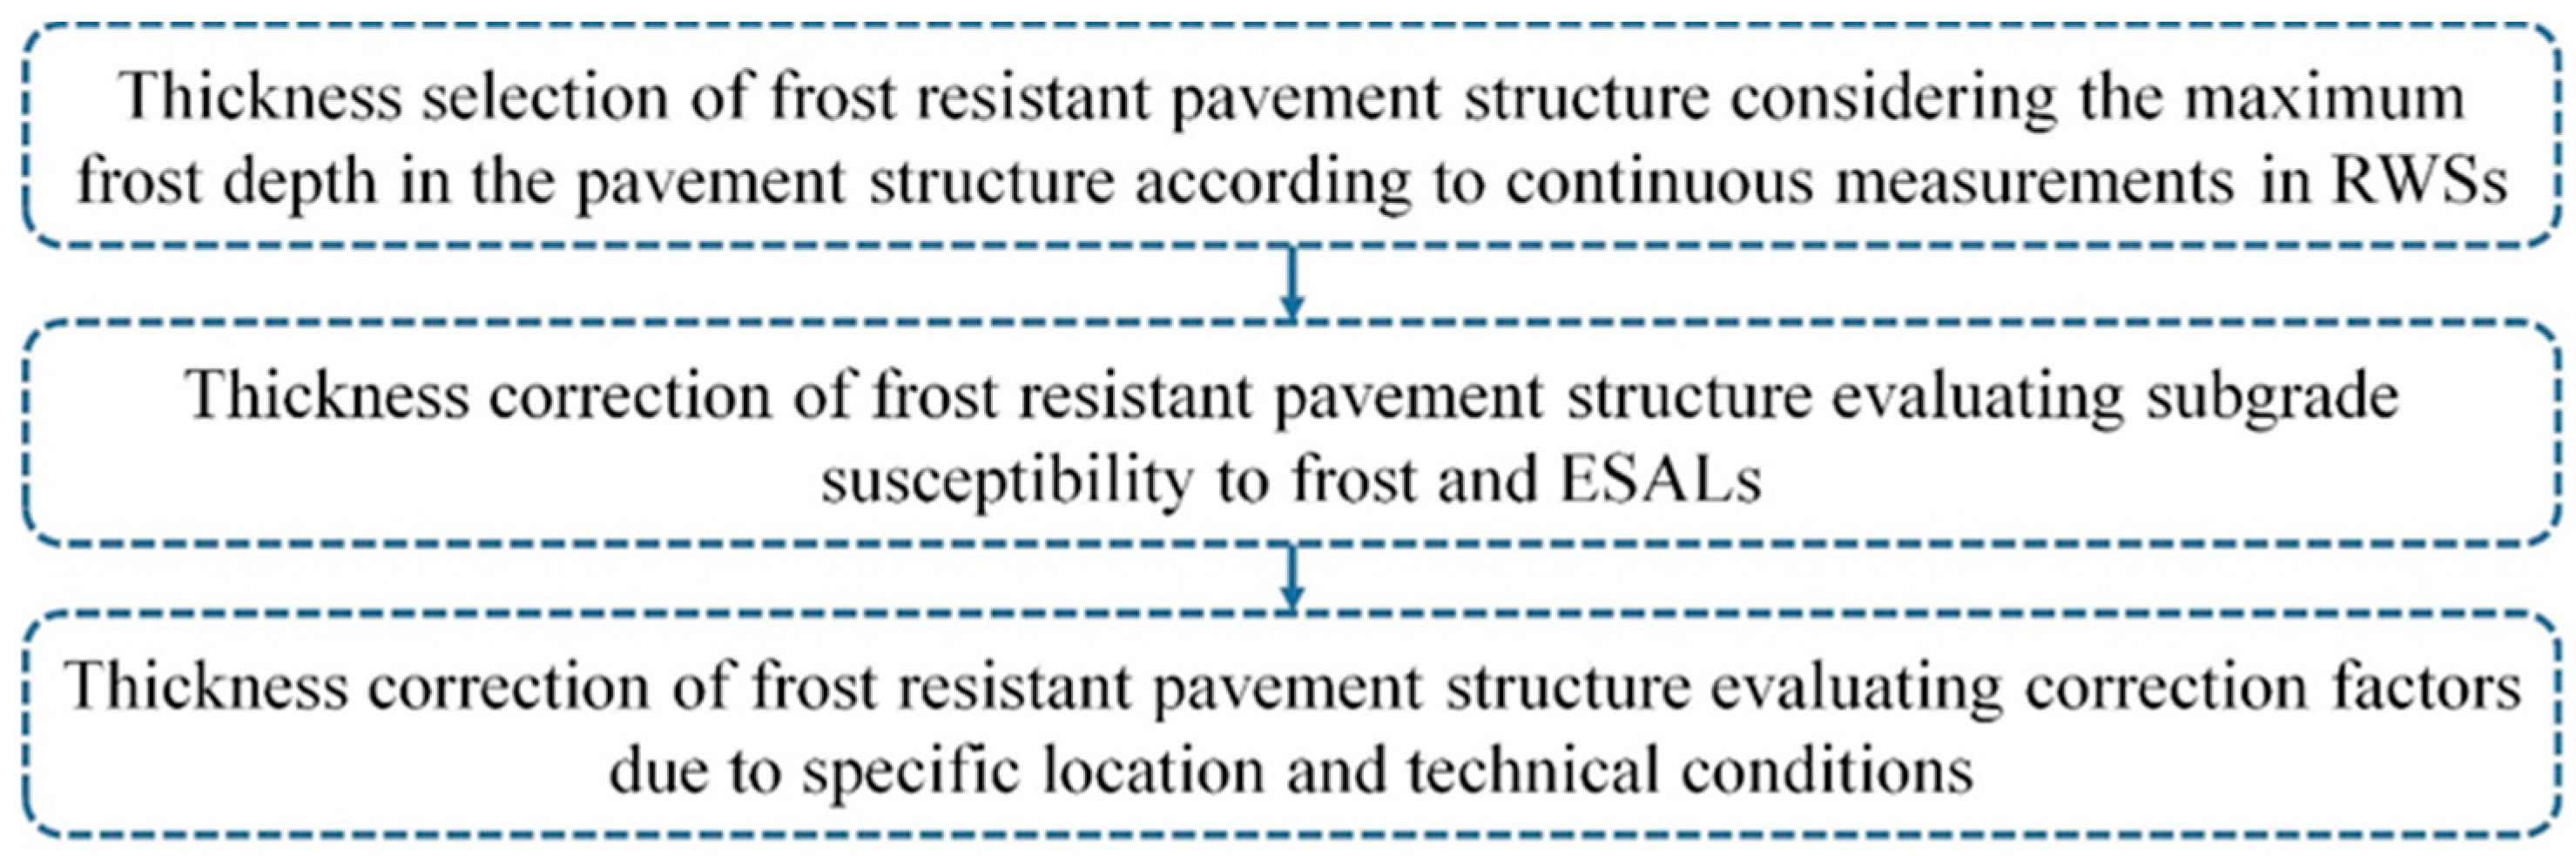
The principle of frost resistant pavement thickness calculation based on RWS data is presented in
Figure 1. First, the thickness of frost resistant pavement structure is selected on the basis of the maximum frost depth in the pavement structure according to measurements in RWS. The maximum frost depth is assumed as the maximum depth in the pavement structure at the road location where the temperature is 0 °C. It is noted that the maximum frost depth has to be determined by RWS data. According to the World Meteorological Organization, the weather trends for the last 30 years are assessed. If the records pertaining to the last 30 years are not available, the most recent 10-year period may be used. Thus, RWS data have to be analysed with reference to no less than the most recent 10-year, preferably 30-year, period. Second, the thickness of the frost resistant pavement is corrected after evaluating both subgrade susceptibility to frost and the number of ESALs. The selected maximum frost depth is multiplied by the coefficient that evaluates subgrade susceptibility to frost and the number of ESALs. Third, the thickness of the frost resistant pavement structure is corrected after evaluating correction factors due to the specific location and technical conditions. The thickness of the frost resistant pavement is slightly reduced or increased depending on the specific location and technical conditions. This design approach was applied in Lithuania.
4.1. Maximum Frost Depth Based on RWS Data
In Lithuania, RWSs started to be installed in 1999 [
26]. Temperature sensors were installed at the pavement surface as well as at different pavement depths. In 2012, temperature sensors were set at other depths. The depths at which temperature was measured until 2012 and since then are represented in
Table 4.
The maximum frost depth in RWSs was calculated interpolating depths at which the measured temperatures are the closest to 0 °C. The analysis of maximum frost depth revealed data reliability. The data collected until 2012 are not appropriate for frost calculation because temperature sensors were installed at inadequate depths, i.e., frost penetrated to depths that exceeded the limits within which sensors could record. Thus, the maximum frost depth was calculated only for 2012–2015.
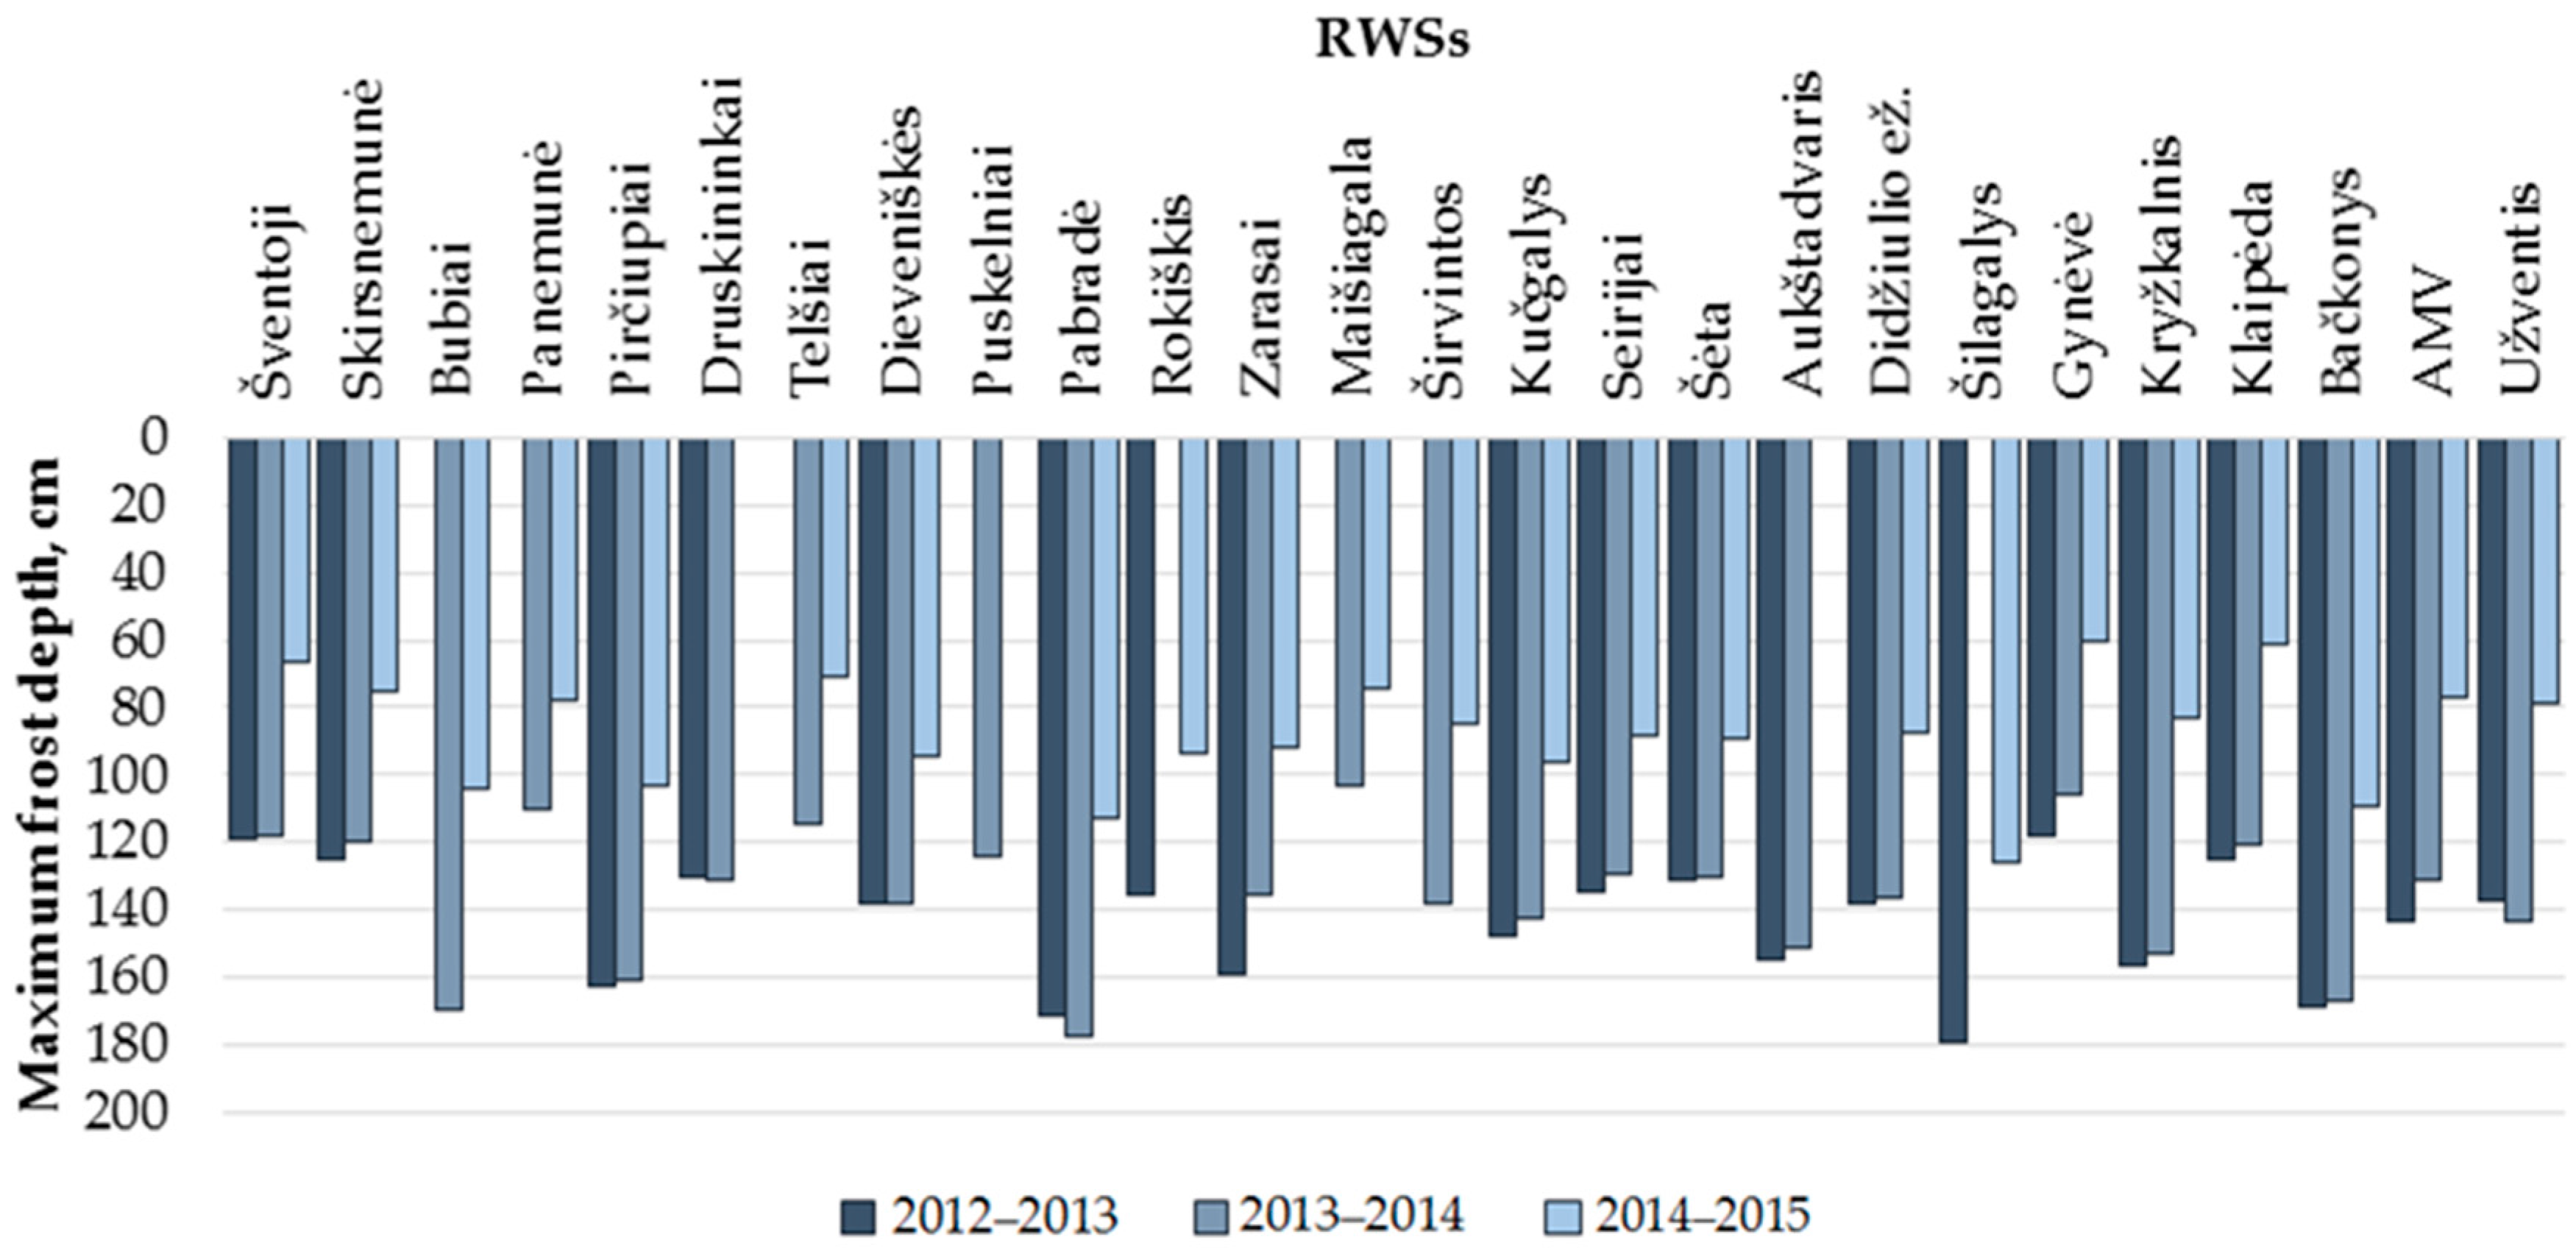
The analysis of maximum frost depth during 2012–2015 (
Figure 2) revealed the most severe winters. The maximum frost depth was 179.1 cm (Šilagalys) in 2012–2013 and 177.5 cm (Pabradė) in 2013–2014. The winter in 2014–2015 was light, because the maximum frost depth hardly reached 129.7 cm (Čiulėnai). The use of this kind of data results in incorrect comprehension of the maximum frost depth. Hence, the data of 2014–2015 were not used for Lithuanian mapping according to the maximum frost depth.
After statistical analysis of 2012–2014 data from 26 RWSs, Lithuanian territory was mapped according to the maximum frost depth. The isolines were smoothed using the Kriging method. Spatial prediction using Kriging involves both the semivariogram model of the spatial process and the use of this model in solving the Kriging system at a specified set of spatial points, resulting in predicted values and associated standard error. The magnitude of the semivariance between points depends on the distance between the points. A smaller distance yields a smaller semivariance, and a larger distance results in a larger semivariance. The plot of the semivariances as a function of distance from a point is referred to as a semivariogram. There, the spherical semivariogram model was used.
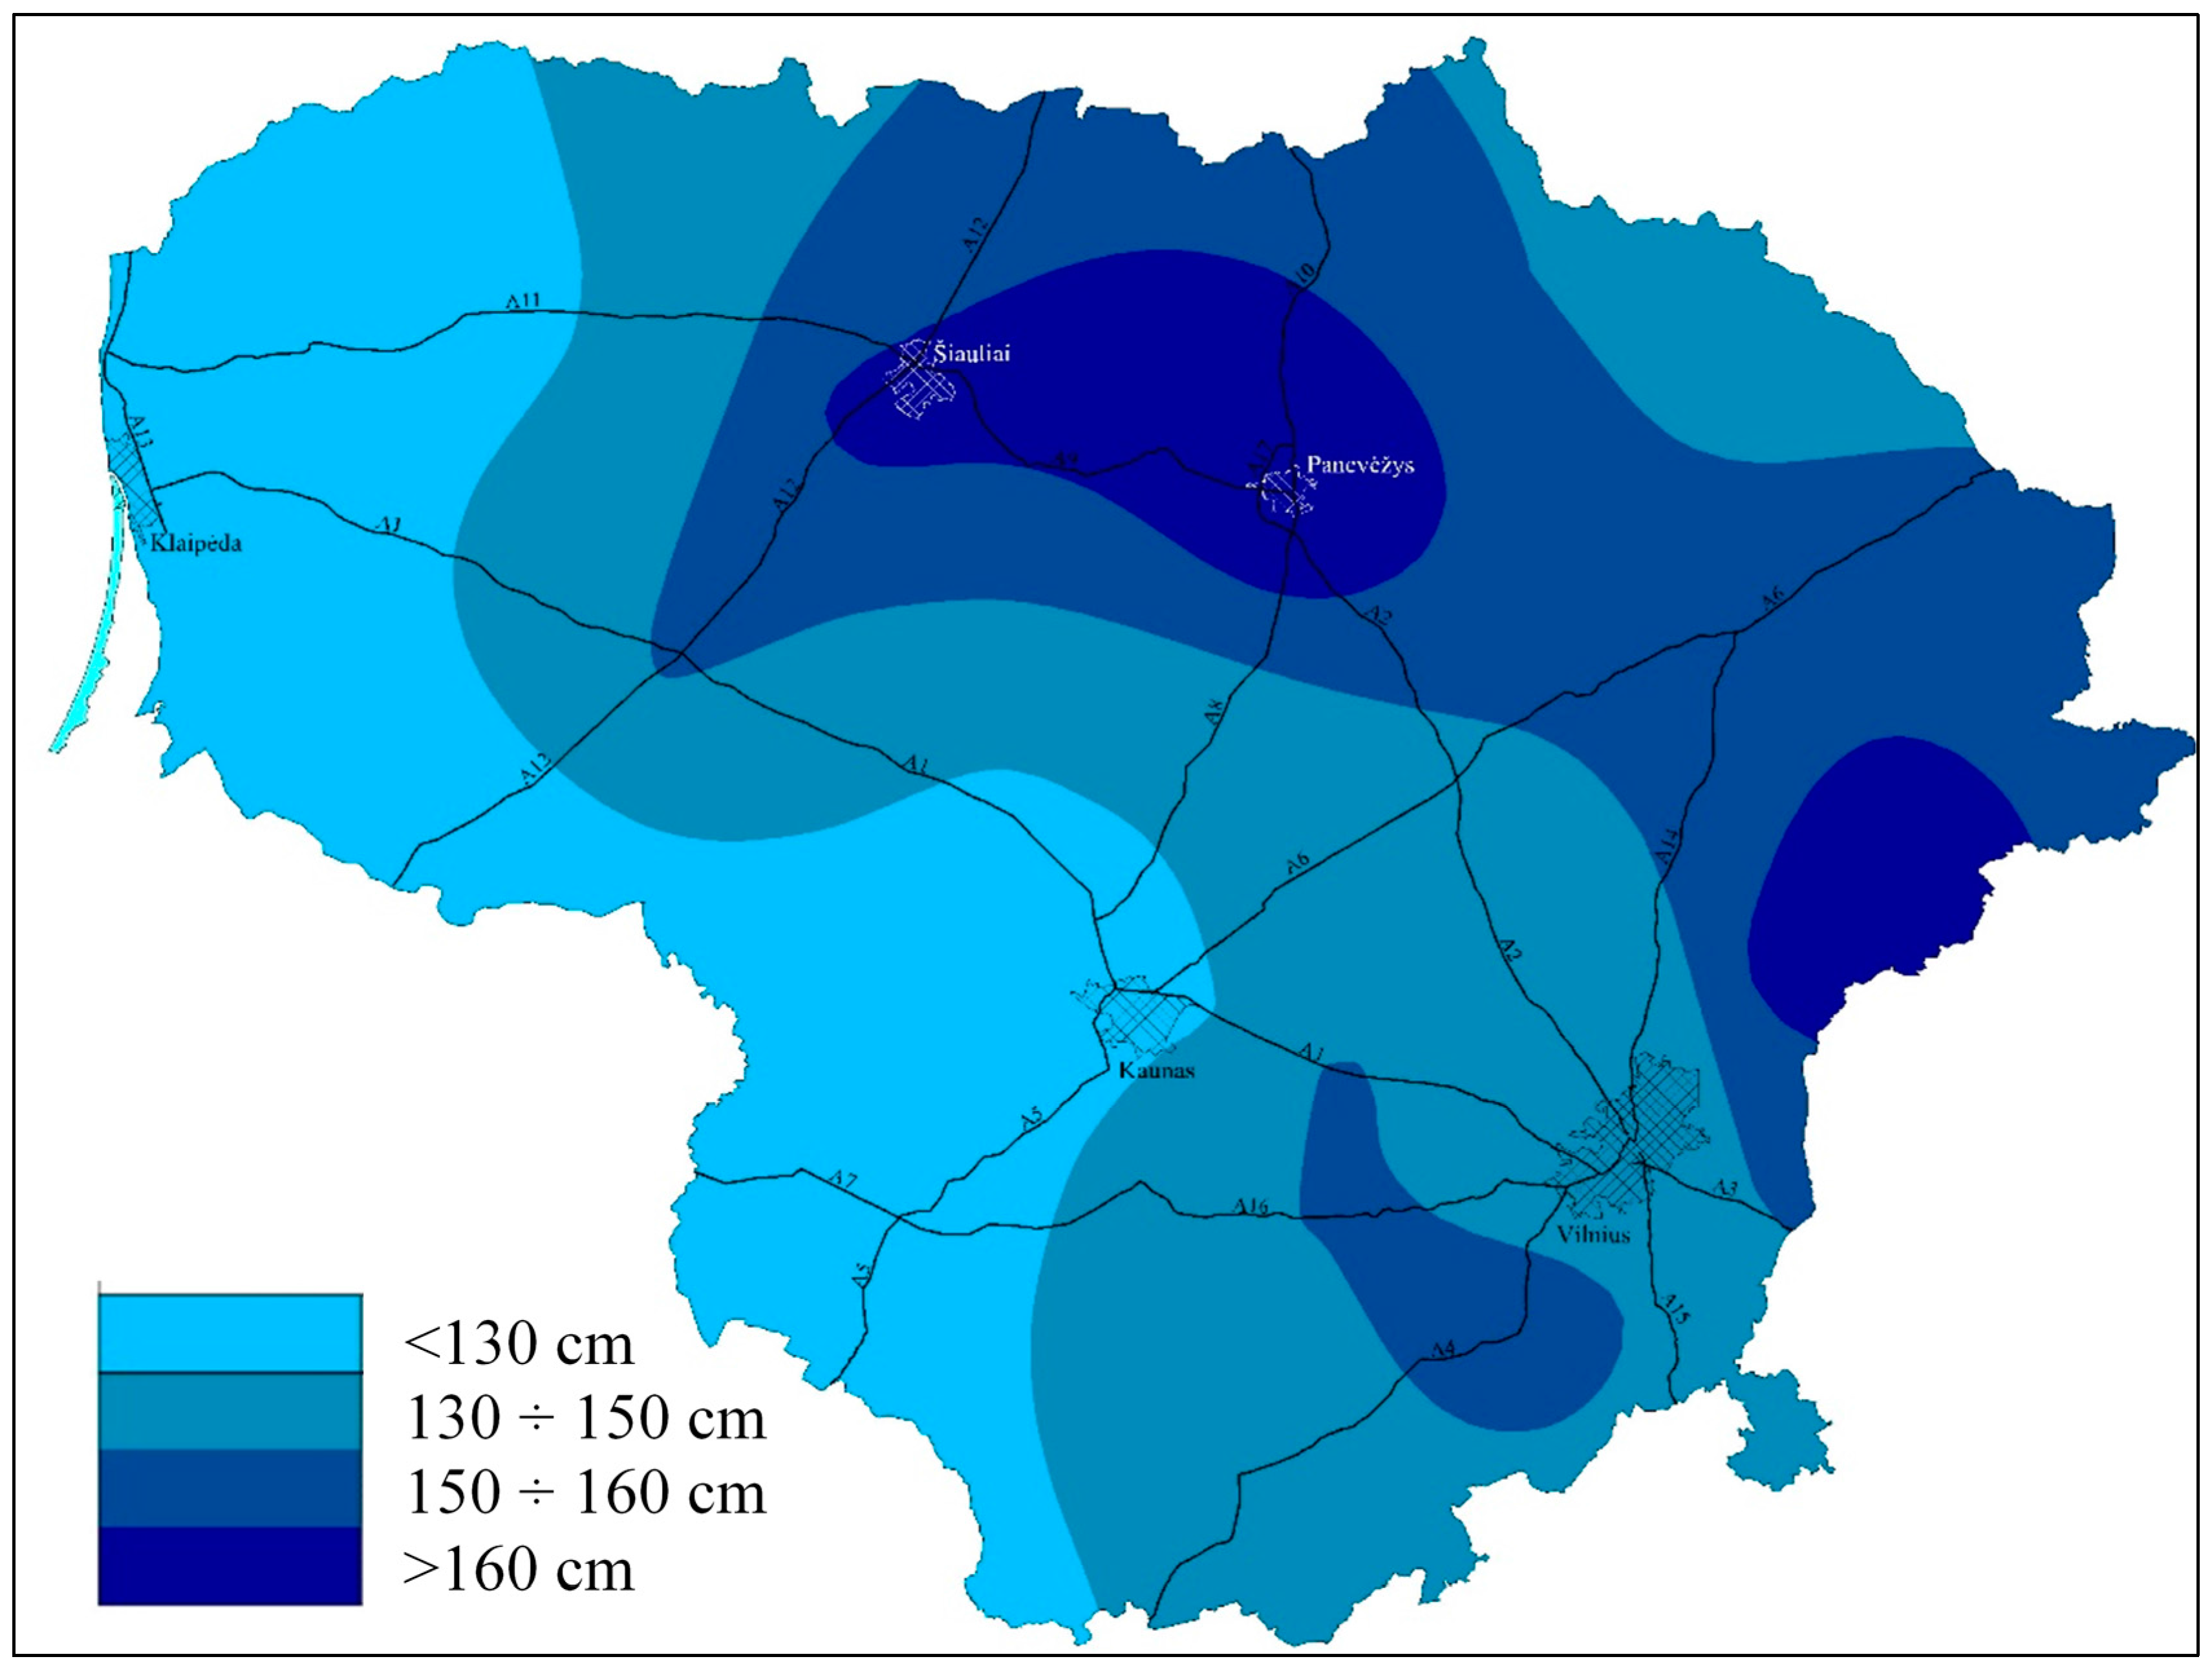
The maximum frost depth in 2012–2014 varied from 110.4 cm (Panemunė) to 179.1 cm (Šilagalys). The lowest maximum frost depths (<130 cm) were determined along the Baltic Sea and the south-west of Lithuania, whereas the highest maximum frost depths (>160 cm) were observed in the Šiauliai and Panevėžys region of Midstream Lithuanian Lowland, and in the Zarasai and Pabradė region of eastern Lithuania. On the basis of these trends, Lithuania was divided into four zones (
Figure 3):
<130 cm—frost depth is below 130 cm;
130/150 cm—frost depth is between 130 cm and 150 cm;
150/160 cm—frost depth is between 150 cm and 160 cm;
>160 cm—frost depth is above 160 cm.
4.2. Coefficient Evaluating Subgrade Susceptibility to Frost and Number of ESALs
The thickness of the frost resistant pavement structure depends on frost depth. However, the construction of pavement structure that is equal to or thicker than frost depth independently from road significance is uneconomical, especially in low-volume roads where higher roughness is allowable. The allowable roughness depends on the road significance. For instance, in Lithuania, International Roughness Index (IRI) should be less than 1.5 m/km and 3.5 m/km at the main and regional roads, respectively. That is why there is a need to use a coefficient that reduces the thickness of the frost resistant pavement structure depending on the subgrade susceptibility to frost and the number of ESALs.
Poland has defined reasonable values for this coefficient. It varies from 0.40 to 0.85 depending on subgrade susceptibility to frost and pavement class, which is determined by the number of ESALs. There are seven pavement classes (KR1–KR7). The coefficient at KR6 and KR7 is the same and depends only on subgrade susceptibility to frost. The number of ESALs varies between 22 million and 52 million at the 6th pavement class, and it is higher than 52 million at the seventh pavement class [
16].
Lithuania has adapted these coefficients to the thickness calculation of the frost resistant pavement; these are shown in
Table 5. The pavement class is usually determined by the number of ESALs. The coefficient varies from 0.40 to 0.90 depending on the subgrade susceptibility to frost and the number of ESALs. The coefficients that are used from pavement class VII to pavement class I are the same as in Poland. The coefficient at the SV pavement class, which is characterized by the number of ESALs and equals at least 32 million, varies from 0.70 to 0.90 depending on the subgrade susceptibility to frost. Lithuania uses the same or even higher coefficients than does Poland at the same or lower number of ESALs because winters are more severe in Lithuania.
4.3. Thickness Correction of the Frost Resistant Pavement Structure Considering Correction Factors
In Germany, the thickness of the frost resistant pavement structure is corrected by evaluating the correction factors [
32]. This gives an opportunity to optimize the thickness of the frost resistant pavement structure assessing the influence of a specific location and technical conditions on frost depth. The good quality of existing pavements in Germany confirms the contribution of this approach to prevention of pavement failures caused by frost. Thus, the thickness correction of the frost resistant pavement structure considering correction factors is a reasonable part of the process that optimizes the thickness of the frost resistant pavement structure.
Lithuania has adapted Germany’s practice. The thickness of the frost resistant pavement structure is corrected on the basis of these correction factors:
frost zone according to freezing index;
local climatic variations;
water conditions in the subsoil;
vertical position of the road surface;
carriageway drainage/execution of boundary areas;
zone near the pavement, etc.
The correction values for each correction factor are given in
Table 6. The thickness that is used to correct the thickness of the frost resistant pavement structure is the sum of the corrective values by each of the correction factors. If the pavement structure is constructed under friendly local conditions, i.e., low freezing index, the southern part, embankment, drainage of carriageway and boundary areas using channels or drains and pipelines, and the pavement is not in the urban area, the thickness of the frost resistant pavement structure is not changed or is even reduced. Otherwise, the thickness of the frost resistant pavement structure is increased.
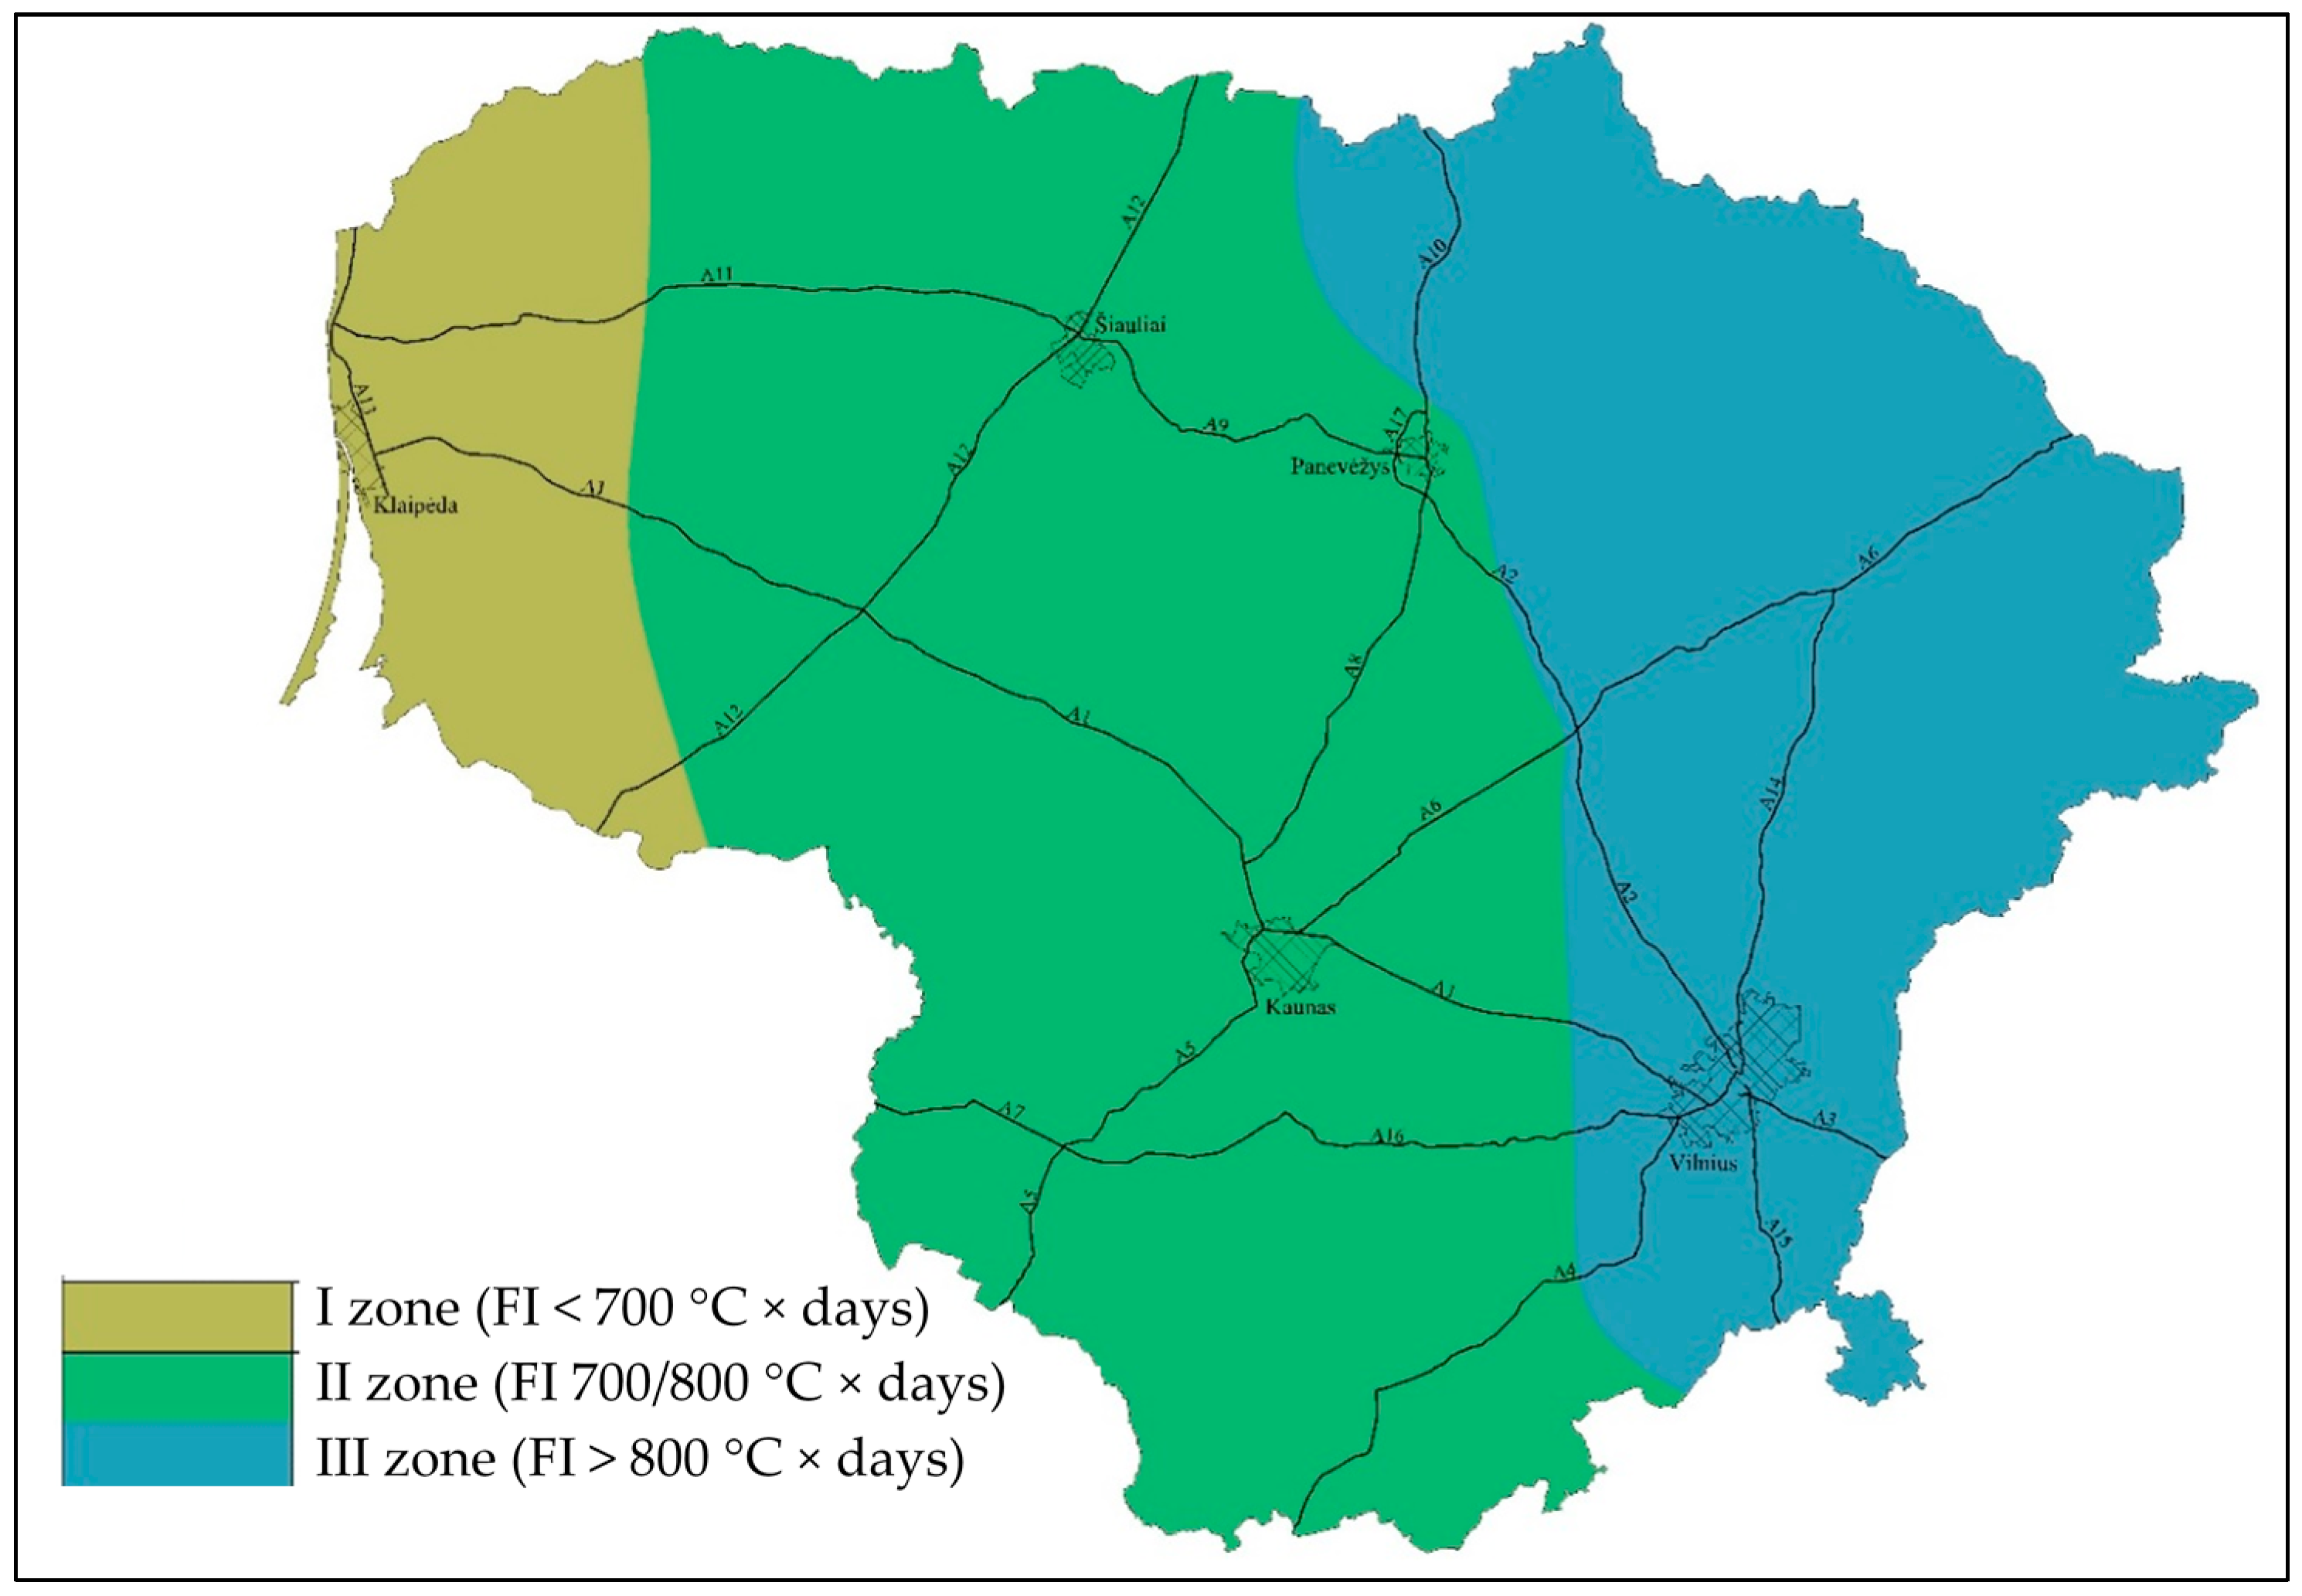
Frost zone at the project site depends on location and is selected according to
Figure 4. Lithuania was divided into three frost zones according to the average freezing index of the three coldest winters during the last 30 years on the basis of air temperature that was recorded in meteorological stations:
I zone—freezing index is below 700 °C × days;
II zone—freezing index is between 700 °C × days and 800 °C × days;
III zone—freezing index is above 800 °C × days.
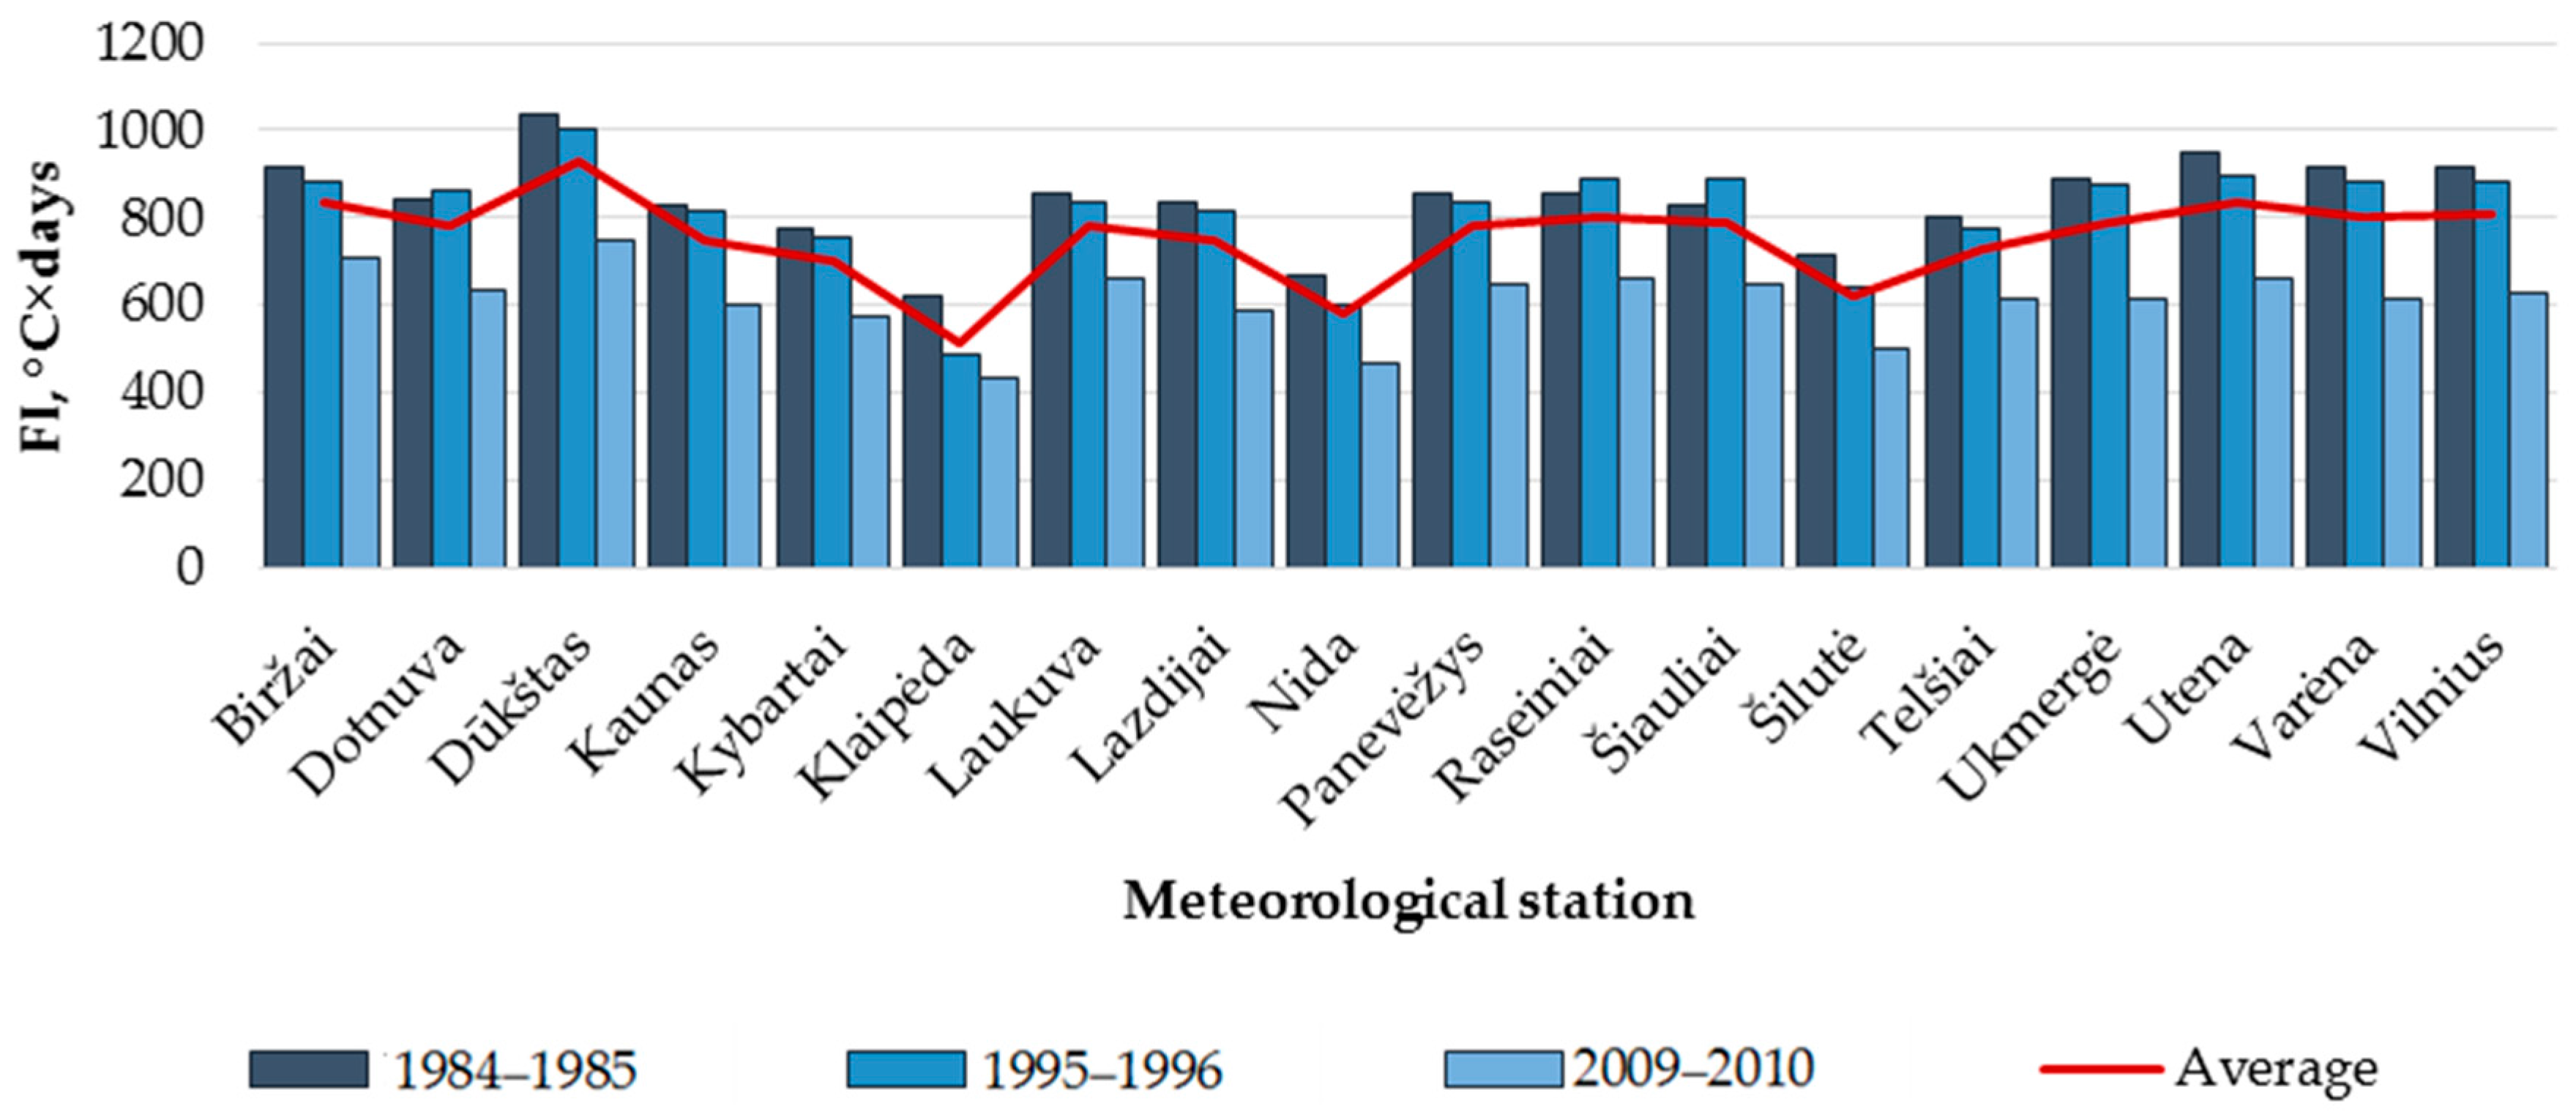
In Lithuania 18 meteorological stations are installed. The three coldest winters during the last 30 years were in 1984/1985, 1995/1996 and 2009/2010. The calculated freezing indexes in each winter at meteorological stations are shown in
Figure 5. The highest and the lowest average freezing index were 927.4 °C × days and 515.6 °C × days, respectively. The isolines were smoothed using the Kriging method with the spherical semivariogram model.
The first frost zone that is at least severe is along the Baltic Sea and in western Lithuania. The second frost zone is in the middle part of Lithuania. In the remaining part of Lithuania, i.e., in eastern Lithuania, is the third frost zone that is the most severe.
5. Results and Discussion
In regard to pavement structure performance, there are two main aspects: sufficient bearing capacity and sufficient frost resistance. The latter is more important in cold climate regions with many freeze–thaw cycles and deep penetration of frost (or freezing). Fundamental analysis has shown that both methods of frost depth calculation and methods of thickness calculation of the frost resistant pavement structure are based on empirical or semi-empirical state. In such methods, RWS data play a major role. There is a need to use historical data. It is preferable to use no less than a 30-year period. A 10-year period is appropriate if 30-year records are not available. The zoning of country territory according to the maximum frost depth leads to a simplified design approach of the frost resistant pavement thickness.
The design approach proposed in this paper was applied in Lithuania. The calculations of the initial thickness of the frost resistant pavement structure (without consideration of correction factors) showed that the initial thickness of the frost resistant pavement structure varies:
from 55 cm to 95 cm if the pavement is constructed on the subgrade of non-frost-susceptible soil and frost penetrates less than 130 cm;
from 80 cm to 120 cm if the pavement is constructed on the subgrade of the most frost-susceptible soil and frost penetrates less than 130 cm;
from 65 cm to 115 cm if the pavement is constructed on the subgrade of non-frost-susceptible soil and frost penetrates more than 160 cm
from 100 cm to 145 cm if the pavement is constructed on the subgrade of the most frost-susceptible soil and frost penetrates more than 160 cm.
There is a tendency for the initial thickness of the frost resistant pavement structure to increase as the number of ESALs grows and as the subgrade susceptibility to frost increases.
Typically, in Lithuania the initial thickness of frost resistant pavement structure is 55–90 cm depending on the soil susceptibility to frost and a number of ESALs. Thus, the determination of the initial pavement thickness of the frost resistant pavement structure according to Lithuanian normative documents results in significantly lower values in comparison with the suggested design approach. The difference tends to increase as the number of ESALs grows and as the subgrade susceptibility to frost increases. Thus, the suggested design approach is a reasonable solution to prevent pavement failures caused by frost, especially in roads located in the deep frost depth zone and those with a large number of ESALs. However, the real benefit of it can be evaluated only after a long-term analysis is carried out in the pavement structures designed by the suggested approach. These data will be published in the next paper after the first trial pavement structures are constructed.
The greatest benefit of the proposed approach would be on the highways, since they have the largest number of ESALs and constitute the main transport network of all roads. Their smooth pavement without any serious distresses can be achieved only with proper design. A frost resistant pavement structure that is too thin cannot guarantee this. Experience shows that the frost resistant pavement structure of 90 cm thickness, which is typical in Lithuanian highways, does not restrict the negative effect of frost. According to the suggested design approach, the initial thickness of the frost resistant pavement structure should be increased to 145 cm if frost depth is greater than 160 cm.
The increased thickness of the frost resistant pavement structure results in higher construction costs. A layer—which is the difference between the thickness of the pavement structure that is calculated based on the bearing capacity and the thickness of the frost resistant pavement structure—is constructed of non-frost-susceptible materials, which are quite expensive. The thickness of the pavement structure may be reduced by improving subgrade. The thickness of improved subgrade is assumed as a part of the pavement structure.
The thickness adjustment of the initial frost resistant pavement structure according to specific local conditions makes it possible to optimize the thickness of the frost resistant pavement structure. The thickness of the frost resistant pavement structure can be reduced or increased by 0–25 cm depending on the specific local conditions. This provides an opportunity to optimize the construction and maintenance costs, ensuring pavement resistance to negative frost effect.
6. Conclusions
The determination of frost resistant pavement thickness is an issue only in cold countries and is usually based on the freezing index calculation, frost depth calculation or frost heave calculation.
The analysis of RWS networks in each country represented their policy on the specific condition identification at road location. Denmark, the Netherlands, Belgium and Germany pay close attention to this. In most RWSs the temperatures at the pavement surface and at other depths of the pavement structure are measured. The lowest temperature sensor position varies from 150 cm (Canada) to 200 cm (Lithuania).
The maximum defined frost depth in Lithuanian roads according to RWSs varied from 110.4 cm to 179.1 cm. The region with the lowest maximum frost depths (<130 cm) is along the Baltic Sea and the south-west of Lithuania. The frost depth gradually increases as one goes further to the east. The highest maximum frost depths (>160 cm) are found in the region of Midstream Lithuanian Lowland and east of Lithuania.
The selected Kriging method with the spherical semivariogram model for isoline smoothing makes it possible to zone the Lithuanian territory according to existing RWS data with sufficient accuracy. After performing a statistical analysis of 2012–2014 data from 26 RWSs, Lithuanian territory was divided into four regions according to the maximum frost depth. The average thickness of the frost resistant pavement structure (without consideration of correction factors) varies from:
55 cm to 120 cm in the zone <130 cm;
60 cm to 130 cm in the zone between 130 cm and 150 cm;
60 cm to 140 cm in the zone between 150 cm and 160 cm;
65 cm to 145 cm in the zone >160 cm.
The thickness adjustment of the calculated initial frost resistant pavement structure optimizes the construction and maintenance costs, ensuring pavement resistance to the frost effect. In the proposed design approach, pavement thickness can be reduced or increased by 0–25 cm, depending on specific local conditions.
The frost index and the frost depth regions should be specified after each next cold period because accurate RWS data were available only from 2012–2015. If it is possible, data pertaining to the last 30 years should be used.
The represented frost zones according to the freezing index that is calculated on the basis of meteorological station data should be updated on the basis of the temperature at the pavement surface in RWSs as soon as the reliable measuring period is available (no less than 10 years).
The maximum frost depth in the frost resistant pavement structure design should be evaluated on the basis of RWS data because a significant difference between the frost depth in meteorological stations and RWSs was determined.


