
Investigation of Strategic Changes Using Patent Co-Inventor Network Analysis: The Case of Samsung Electronics


Abstract
:1. Introduction
2. Theoretical Background
2.1. Important R&D Projects from a Human Resource Perspective
2.2. Patent Co-Inventor Network Analysis
3. Method
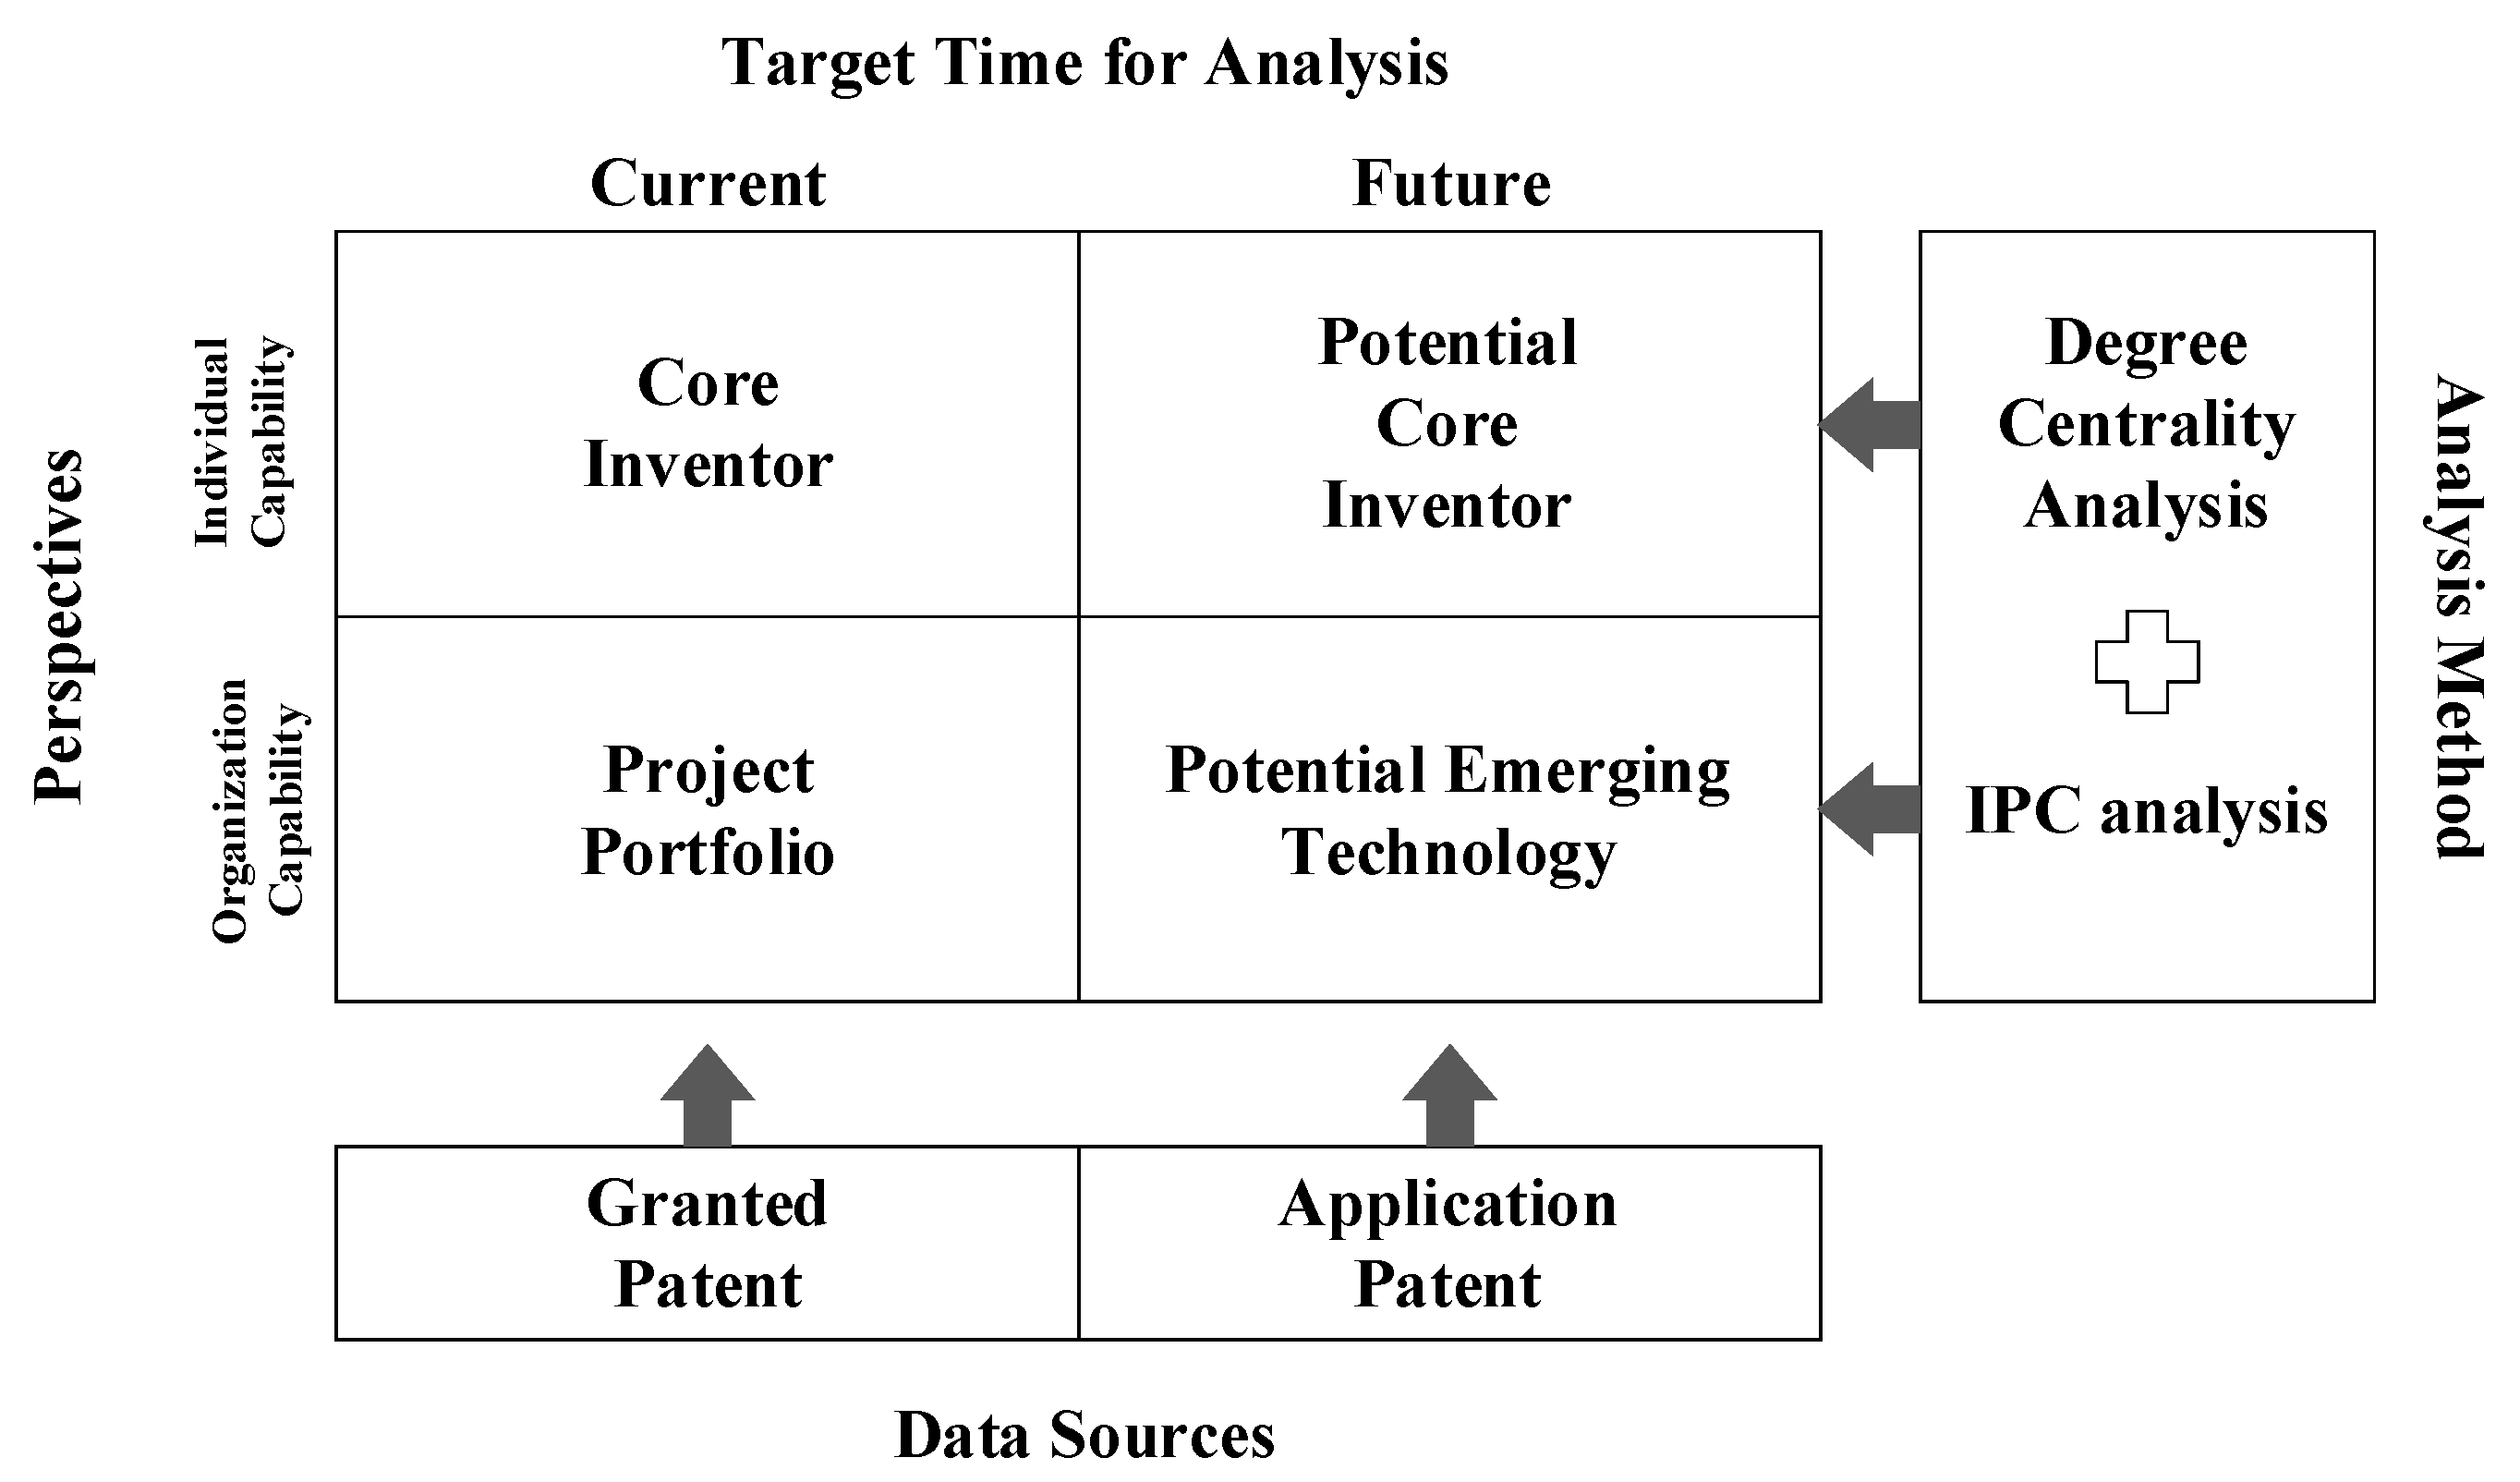
3.1. Procedure
- (1)
- Collection of patent set;
- (2)
- Analyzing patent co-inventor network;
- (3)
- Analyzing key R&D personnel.
3.2. Metrics
4. Empirical Analysis: Samsung Electronics
4.1. Data
4.2. Analysis of Granted Patents
4.3. Analysis of Patent applications
4.4. Discussion
- In the case of granted patents, the results show the tendency that if inventors have a high betweenness centrality, they have a high R&D leadership. Because betweenness centrality is high when the inventor is linked to many other inventors, there is a high possibility that the inventor is at the center of the R&D projects and the leader of the R&D group. This kind of inventor has a high potential to be promoted to an executive in the organization or to move to another R&D department as a core researcher.
- In the case of patent applications, the proposed method helps to find organization R&D effort with the hidden information which is not extracted for IPC codes. Considering the number of inventors arranged on each IPC code, Samsung Electronics have allocated many researchers to R&D projects related to user interface technologies to construct the patent portfolio for preparing patent suit against Apple. However, it appears that the inventors related to material technology have a relatively high degree and betweenness centrality. This means that Samsung Electronics’ strategy to build a patent portfolio for user interface is just to apply for many patents with many small-sized R&D teams, on the other hand, they prepare core capabilities related to material technology with a few big-sized R&D teams for supporting current business or preparing emerging business.
- Finally, the preparation for future direction is also captured by the proposed method. In an analysis of patent applications, the inventor who has high degree but relatively low betweenness centrality is identified. He works for emerging technologies related to carbon material, inorganic material, and thermoelectric element. This fact shows that Samsung Electronics has constructed small size, but active R&D teams for preparing future technology and has crafted various patent portfolios. We think these are the strategic directions of Samsung Electronics.
5. Conclusions
Acknowledgments
Author Contributions
Conflicts of Interest
References
- Barney, J. Firm resources and sustained competitive advantage. J. Manag. 1991, 17, 99–120. [Google Scholar]
- Andrews, K.R.; David, D.K. The Concept of Corporate Strategy; Richard D Irwin: New York, NY, USA, 1987. [Google Scholar]
- Wernerfelt, B. A resource-based view of the firm. Strateg. Manag. J. 1984, 5, 171–180. [Google Scholar]
- Bohn, R.E. Measuring and managing technological knowledge. Sloan Manag. Rev. 1994, 36, 61. [Google Scholar]
- Ernst, H. Patent information for strategic technology management. World Pat. Inf. 2003, 25, 233–242. [Google Scholar] [CrossRef]
- Del Canto, J.G.; Gonzalez, I.S. A resource-based analysis of the factors determining a firm’s R&D activities. Res. Policy 1999, 28, 891–905. [Google Scholar]
- Roussel, P.A.; Saad, K.N.; Erickson, T.J. Third Generation R&D: Managing the Link to Corporate Strategy; Harvard Business Press: Brighton, MA, USA, 1991. [Google Scholar]
- Allen, T.J.; Katz, R. Age, education and the technical ladder. IEEE Trans. Eng. Manag. 1992, 39, 237–245. [Google Scholar] [CrossRef]
- Jung, S.; Imm, K.-Y. The patent activities of Korea and Taiwan: A comparative case study of patent statistics. World Pat. Inf. 2002, 24, 303–311. [Google Scholar] [CrossRef]
- Schoenecker, T.; Swanson, L. Indicators of firm technological capability: Validity and performance implications. IEEE Trans. Eng. Manag. 2002, 49, 36–44. [Google Scholar] [CrossRef]
- Chakrabarti, A.K. Competition in high technology: Analysis of patents of US, Japan, UK, France, West Germany, and Canada. IEEE Trans. Eng. Manag. 1991, 38, 78–84. [Google Scholar] [CrossRef]
- Park, H.; Yoon, J.; Kim, K. Identification and evaluation of corporations for merger and acquisition strategies using patent information and text mining. Scientometrics 2013, 97, 883–909. [Google Scholar] [CrossRef]
- Scherer, F.M. The propensity to patent. Int. J. Ind. Organ. 1983, 1, 107–128. [Google Scholar] [CrossRef]
- Armstrong, M. A Handbook of Human Resource Management Practice; Kogan Page: London, UK, 2001. [Google Scholar]
- Price, A. Human Resource Management in a Business Context; Cengage Learning EMEA: London, UK, 2004. [Google Scholar]
- Moehrle, M.G.; Walter, L.; Geritz, A.; Müller, S. Patent-based inventor profiles as a basis for human resource decisions in research and development. R&D Manag. 2005, 35, 513–524. [Google Scholar]
- Kim, Y.; Cha, J. Career orientations of R&D professionals in korea. R&D Manag. 2000, 30, 121–138. [Google Scholar]
- Hendriks, M.; Voeten, B.; Kroep, L. Human resource allocation in a multi-project R&D environment: Resource capacity allocation and project portfolio planning in practice. Int. J. Proj. Manag. 1999, 17, 181–188. [Google Scholar]
- Huemann, M.; Keegan, A.; Turner, J.R. Human resource management in the project-oriented company: A review. Int. J. Proj. Manag. 2007, 25, 315–323. [Google Scholar] [CrossRef]
- Acedo, F.J.; Barroso, C.; Casanueva, C.; Galán, J.L. Co-authorship in management and organizational studies: An empirical and network analysis. J. Manag. Stud. 2006, 43, 957–983. [Google Scholar] [CrossRef]
- Hamel, G.; Prahalad, C.K. Strategic Intent; Harvard Business School Publishing Corporation: Boston, MA, USA, 2005; Volume 83, p. 14. [Google Scholar]
- Legge, K. What is human resource management? In Human Resource Management; Springer: Berlin, Germany, 1995; pp. 62–95. [Google Scholar]
- Storey, J. Human Resource Management: A Critical Text; Cengage Learning EMEA: London, UK, 2007. [Google Scholar]
- Argyres, N.S.; Silverman, B.S. R&D, organization structure, and the development of corporate technological knowledge. Strateg. Manag. J. 2004, 25, 929–958. [Google Scholar]
- Han, Y.-J.; Park, Y. Patent network analysis of inter-industrial knowledge flows: The case of korea between traditional and emerging industries. World Pat. Inf. 2006, 28, 235–247. [Google Scholar] [CrossRef]
- Chao-Chih, H.; Chun-Chieh, W. The use of social network analysis in knowledge diffusion research from patent data. In Proceedings of the International Conference on Advances in Social Network Analysis and Mining (ASONAM ’09), Athens, Greece, 20–22 July 2009; pp. 393–398.
- Cantner, U.; Graf, H. The network of innovators in Jena: An application of social network analysis. Res. Policy 2006, 35, 463–480. [Google Scholar] [CrossRef]
- Vidgen, R.; Henneberg, S.; Naudé, P. What sort of community is the European Conference on Information Systems? A social network analysis 1993–2005. Eur. J. Inf. Syst. 2007, 16, 5–19. [Google Scholar] [CrossRef]
- Lobo, J.; Strumsky, D. Metropolitan patenting, inventor agglomeration and social networks: A tale of two effects. J. Urban Econ. 2008, 63, 871–884. [Google Scholar] [CrossRef]
- Sternitzke, C.; Bartkowski, A.; Schramm, R. Visualizing patent statistics by means of social network analysis tools. World Pat. Inf. 2008, 30, 115–131. [Google Scholar] [CrossRef]
- Lei, X.-P.; Zhao, Z.-Y.; Zhang, X.; Chen, D.-Z.; Huang, M.-H.; Zheng, J.; Liu, R.-S.; Zhang, J.; Zhao, Y.-H. Technological collaboration patterns in solar cell industry based on patent inventors and assignees analysis. Scientometrics 2013, 96, 427–441. [Google Scholar] [CrossRef]
- Chang, S.-B.; Lai, K.-K.; Chang, S.-M. Exploring technology diffusion and classification of business methods: Using the patent citation network. Technol. Forecast. Soc. Chang. 2009, 76, 107–117. [Google Scholar] [CrossRef]
- Wang, J.-C.; Chiang, C.-H.; Lin, S.-W. Network structure of innovation: Can brokerage or closure predict patent quality? Scientometrics 2010, 84, 735–748. [Google Scholar] [CrossRef]
- Abbasi, A.; Altmann, J. On the correlation between research performance and social network analysis measures applied to research collaboration networks. In Proceedings of the 44th Hawaii International Conference on System Sciences (HICSS), Kauai, HI, USA, 4–7 January 2011.
- Csardi, G.; Nepusz, T. The igraph software package for complex network research. Int. J. Complex Syst. 2006, 1695, 1–9. [Google Scholar]
- R Core Development Team. R: A Language and Environment for Statistical Computing, The R Foundation for Statistical Computing: Vienna, Austria, 2011.
- Popp, D.; Juhl, T.; Johnson, D.K. Time in purgatory: Examining the grant lag for us patent applications. Top. Econ. Anal. Policy 2004, 4, 1–45. [Google Scholar] [CrossRef]
- Diestel, R. Graph Theory; Springer: Berlin, Germany, 2005. [Google Scholar]
- Carrington, P.J. Models and Methods in Social Network Analysis; Cambridge University Press: Cambridge, UK, 2005. [Google Scholar]
- Freeman, L.C. Centrality in social networks conceptual clarification. Soc. Netw. 1978, 1, 215–239. [Google Scholar] [CrossRef]
- Freeman, L.C.; Roeder, D.; Mulholland, R.R. Centrality in social networks: II. Experimental results. Soc. Netw. 1979, 2, 119–141. [Google Scholar] [CrossRef]
- Napolitano, G.; Sirilli, G. The patent system and the exploitation of inventions: Results of a statistical survey conducted in Italy. Technovation 1990, 10, 5–16. [Google Scholar] [CrossRef]
- Hall, B.H.; Jaffe, A.B.; Trajtenberg, M. The NBER Patent Citation Data File: Lessons, Insights and Methodological Tools; National Bureau of Economic Research: Cambridge, MA, USA, 2001. [Google Scholar]


| Category | Description | Related Works |
|---|---|---|
| Knowledge Transfer | To analyze how technology knowledge of patents transfers between R&D groups, based on a citation network with inventor information | Han and Park [25], |
| Chao-Chih and Chun-Chieh [26] | ||
| Research Collaboration | To analyze how research groups are formulated and collaborated by using a co-inventor network | Cantner and Graf [27], |
| Vidgen et al. [28], | ||
| Lobo and Strumsky [29], | ||
| Sternitzke et al. [30], | ||
| Lei et al. [31] | ||
| Research Performance | To analyze how important a patent is in an area of technology by using citation-network analysis | Chang et al. [32], |
| Wang et al. [33], | ||
| Abbasi and Altmann [34] |
| Degree Type | Organizational Implications |
|---|---|
| High degree centrality |
|
| High betwenness centrality |
|
| Publication Date | Type | Application Date | Number of Patents | Number of Inventors | Number of IPC Types |
|---|---|---|---|---|---|
| January 2010~December 2014 | Grant (B1, B2, S1) | January 2008~December 2014 | 18,045 | 11,975 | 4259 |
| Application (A1, A9) | January 2010~December 2014 | 19,877 | 13,348 | 4826 |
| Density | Degree | Betweenness Centrality | |
|---|---|---|---|
| Mean | 0.0002 | 5.285 | 24,950 |
| Standard Deviation | 4.66 | 101,505 |
| IPC | Number of Inventors | Technology for IPC | Business Area |
|---|---|---|---|
| H04W4/00 | 4819 | Wireless channel access | Wireless Network Solution |
| G06K9/00 | 2798 | User Interface related methods | Smart Phone |
| G11C16/04 | 2736 | Read-only memories | Memory |
| H01L21/00 | 2725 | Manufacture or treatment of semiconductor or solid state devices | |
| H01L21/336 | 2507 | ||
| H01L23/48 | 2316 | Semiconductor or other solid state | |
| H01L29/66 | 2024 | ||
| G09G5/00 | 1769 | Circuits for visual indicators | TV Appliance |
| H01L33/00 | 1756 | Semiconductor devices for light emission | LED |
| H01L27/108 | 1691 | A plurality of semiconductors or other solid-state | Memory |
| G06F15/16 | 1620 | Digital computers in general | Personal Computer |
| H04B7/00 | 1525 | Radio transmission systems | Wireless Network Solution |
| H04N7/12 | 1492 | Television systems | TV Appliance |
| G06F13/00 | 1361 | Interconnection of circuit units | Memory System LSI |
| H04W36/00 | 1337 | Handoff or reselecting arrangements | Wireless Network Solution |
| H04W72/00 | 1334 | Management of wireless resources or wireless traffic | |
| H01L29/78 | 1322 | Semiconductor devices | Memory |
| H03M13/00 | 1293 | Electronics data decoding | Base technology |
| H04L29/06 | 1217 | Circuits or systems | Base technology |
| H01L21/8258 | 1202 | Semiconductor or solid state devices | Memory |
| Inventor Name (Resource URL) | Degree | Betweenness Centrality | Current Position | Technology Area |
|---|---|---|---|---|
| Jung-Hwan KIM | 52 | 2,517,903.782 | N/A | N/A (Because of name ambiguity such as inventors having same name, it is hard to distinguish a specific inventor.) |
| Ki-Hyun HWANG | 32 | 1,682,745.153 | Vice President | Memory |
| Sung Tae KIM | 36 | 1,314,883.601 | Vice President | LED |
| Kyoung Lae CHO | 37 | 1,303,646.368 | N/A | Flash Memory |
| Yun-Je OH | 58 | 1,284,607.899 | Vice President | Image Processing |
| Bruno Clerckx (http://goo.gl/1cw3hz) | 41 | 1,254,201.867 | Lecturer at Imperial College | Wireless Communication |
| Sung Jin KIM (http://goo.gl/jSVYlT) | 37 | 1,250,645.616 | Master | Communication (LTE) |
| Jae-Hee CHO (http://goo.gl/WnzKZG) | 53 | 1,115,631.863 | Professor at Chonbuk National University | Optoelectronics |
| Density | Degree | Betweenness Centrality | |
|---|---|---|---|
| Mean | 0.000149143 | 4.649 | 17,393 |
| Standard Deviation | 12.86 | 8,618,822,950 |
| IPC | Number of Inventors | Technology for IPC | Business Area |
|---|---|---|---|
| H04W72/04 | 3352 | Wireless channel access | Wireless Network Solution |
| G06F3/041 | 2796 | User Interface related methods | Smart Phone |
| G06F3/0488 | 2326 | ||
| G06F3/01 | 2308 | ||
| G06F3/0481 | 2162 | ||
| G06F3/0484 | 2099 | ||
| H04L29/06 | 2030 | System On Chips | System LSI |
| H01L29/78 | 1815 | Semiconductor devices | Memory |
| H04N5/232 | 1802 | Television systems | TV Appliance |
| H01L29/66 | 1626 | Semiconductor devices | Memory |
| G09G5/00 | 1479 | Imaging Unit | Smart Phone Imaging Device |
| G06F17/30 | 1395 | Computing equipment | Set Products |
| G06F3/0482 | 1357 | User Interaction with computing equipment | Smart Phone TV Appliance |
| H04L29/08 | 1353 | System On Chips | System LSI |
| G06K9/00 | 1251 | Recognizing patterns (i.e., characters) | Smart Phone |
| H04L5/00 | 1209 | System On Chips | System LSI |
| H01L21/02 | 1197 | Solid State Devices | Memory |
| H04N13/00 | 1137 | Television systems | TV Appliance |
| H01F38/14 | 1109 | Electronic Devices | Set Products |
| H02J7/00 | 1104 | Batteries | Smart Phone |
| Inventor Name | Degree | Betweenness Centrality | Technology Area |
|---|---|---|---|
| Sang Ho PARK | 25 | 2,558,598.32 | Optics Thin Film (Laudry Machine) |
| Hyun-jin KIM (http://goo.gl/OXWSdU) | 31 | 2,355,259.44 | Battery |
| Sung-Ho CHOI | 19 | 2,005,281.401 | Wireless Communication |
| Do-Hyun KIM | 13 | 1,944,638.685 | Optics Thin Film |
| Eun-Hui BAE | 12 | 1,768,819.409 | Wireless Communication |
| Inventor Name | Degree | Betweenness Centrality | Technology Area |
|---|---|---|---|
| Jae-young CHOI | 53 | 1,115,306 | Carbon material, thermoelectric elements, inorganic material |
| Chang-soo LEE (http://goo.gl/OXWSdU) | 33 | 455,627.5 | Transferring data |
| Hyeong-sik CHO | 33 | 564,297.8 | Fibre optic devices, structural combinations of lighting devices |
| Boon Loong Ng (http://goo.gl/se4A7F) | 31 | 115,543.2 | LTE, LTE-Advanced |
| Chi-Woo LIM | 31 | 593,338 | Wireless communication |
© 2016 by the authors; licensee MDPI, Basel, Switzerland. This article is an open access article distributed under the terms and conditions of the Creative Commons Attribution (CC-BY) license (http://creativecommons.org/licenses/by/4.0/).
Share and Cite
Choi, S.; Park, H. Investigation of Strategic Changes Using Patent Co-Inventor Network Analysis: The Case of Samsung Electronics. Sustainability 2016, 8, 1315. https://doi.org/10.3390/su8121315
Choi S, Park H. Investigation of Strategic Changes Using Patent Co-Inventor Network Analysis: The Case of Samsung Electronics. Sustainability. 2016; 8(12):1315. https://doi.org/10.3390/su8121315
Chicago/Turabian StyleChoi, Sungchul, and Hyunseok Park. 2016. "Investigation of Strategic Changes Using Patent Co-Inventor Network Analysis: The Case of Samsung Electronics" Sustainability 8, no. 12: 1315. https://doi.org/10.3390/su8121315