Article

Assessing the Challenges in Successful Implementation and Adoption of Crop Insurance in Thailand

Asian Institute of Technology (AIT), Pathumthani 12120, Thailand
*
Author to whom correspondence should be addressed.
Sustainability 2016, 8(12), 1306; https://doi.org/10.3390/su8121306
Submission received: 6 September 2016 / Revised: 4 November 2016 / Accepted: 5 December 2016 / Published: 13 December 2016
(This article belongs to the Section Sustainable Agriculture)

Abstract

:
The purpose of this paper is to assess the gaps in the adoption of crop insurance in Thailand and suggest possible solutions relating to policy support and framework, implementation mechanisms, technology adoption, and awareness amongst farmers. The methodology includes a literature review, interaction with officials, rice experts and insurance experts, and discussion with farmers. A study was undertaken at province level to assess the impact of using rainfall index as a threshold. Additionally, focused group discussions (FGD) were conducted with rice farmers at the village level. Key issues targeted in the FGD were to understand the behavior and practices during droughts, impact of drought on crop yield, methods already in use to reduce the impact, such as plantation of drought-resistant rice, and the adoption of crop insurance. Data availability is a challenge and has led to withdrawal of Weather Index Insurance (WII) in 2015. WII have threshold levels based on historical rainfall. Adoption of coping mechanisms, such as drought-resistant rice and irrigation increases the chances of adverse selection. In absence of ground based weather data, a combination of satellite agriculture drought information can be used to make crop insurance more attractive as it would help in reducing basis risk and improving insurers and farmers’ confidence in the product. Discussion with farmers, insurance companies, and the Bank of Agriculture and Agricultural Cooperatives (BAAC) in Thailand suggested low awareness among farmers about the potential benefits of weather index insurance products. Relatively low compensation is also an obstacle. Proper marketing and awareness raising campaigns should also accompany the introduction of index-based insurance products.

1. Introduction

Drought is one of the most devastating natural disasters as it continues to impact the ecosystems and livelihoods for a considerable duration of time, sometimes for years. Although it appears to be less dramatic than disasters like floods, typhoon, tsunamis and earthquakes, the slow-onset climate impacts of drought has damaging effects on large areas and in some cases across country boundaries. The indirect effects of drought on the lives of individuals associated with it pushes the farmers further into poverty [1], leading to farmer suicides (e.g., India) and, at times, political unrest (e.g., Thailand) [2]. According to International Disaster Database, more than 1.31 billion people have been affected in the Asia-Pacific region by 123 drought events causing damage of about US $53 billion over the last three decades [3].
Drought risk reduction strategies, like crop insurance, are gaining significance as it reduces climate-related risk associated with farmers and, in effect, their level of exposure. Traditionally, indemnity insurance has been used, where payouts are explicitly based on measured losses for specific clients [4]. Index-based insurance is now being increasingly adopted as it is based on a verifiable and independent measurement of a variable that impacts crop development. Additionally, it has been recognized to potentially reduce insurance premiums and make insurance affordable to more farmers [5,6]. Examining the effectiveness of index-based insurance products in the presence of basis risk (the difference between the insured quantity and the underlying risk) indicate mixed results and suggest careful construction of index-based insurance products that can reduce exposure to basis risk [7]. Weather index-based crop insurance is most widely used and is continuously evolving. Globally, many index insurance initiatives have been launched, of which some were successful in scaling up (e.g., India, Kenya, and Ethiopia) [4], few failed to generate sufficient demand and were discontinued (e.g., Ukraine), and some are yet to reach a large number of beneficiaries [7,8]. Investment decisions by a sample of farmers in India indicate that insurance provision might have little effect on total agriculture investment, but it influences subsequent riskier production decisions, such as crop choice and usage of agricultural inputs [9]. In Asia, countries like China, India, and Thailand are at different phases of adapting index-based crop insurance with varying level of government support and private sector engagement [2]. This paper focuses on the experience in Thailand.
Thailand has a cultivated area of about 41.53% and agriculture contributes to 11.64% of GDP. It has a long-term average precipitation of 1622 mm/year with 51.79% of water withdrawal by the agricultural sector [10]. The country faces drought situation almost every year where the agricultural sector is often the first to be affected as a result of production declines, especially in rice crops [11].
According to the Land Development Department of Thailand, areas of permanent drought in Thailand still cover about 40% of total agricultural areas. Considering the large population of Thailand being vulnerable to drought over the years (Table 1), understanding the vulnerability and exposure serves as the key input to develop and implement appropriate, cost-effective risk reduction and prevention measures.
Thailand experienced one of the worst droughts in more than a decade in 2015. Off-season drought, in the middle of rainy season impacted 25 provinces of Thailand reducing the water level in reservoirs to a minimum of 4%, with maximum reduction in reservoirs water level from 2014 to 2015 in the east region [13] (Table 2). According to Thailand’s National Disaster Warning Centre, water rationing took place in almost a third of the country as El Niño fueled the drought [14]. In 2016, the Department of Disaster Preparation and Mitigation (DDPM) declared 14 provinces continuing to be severely affected by droughts [15].
Thailand has in place a number of drought coping mechanisms such as triggering artificial rainmaking, mobilizing equipment like water pumps at the provincial level [16], budget allocation for drilling wells, farmers using moderate drought-resistant rice and irrigation. Thailand’s 33.76% of cultivated area is equipped for irrigation and 78.88% of the equipped area is actually irrigated [10]. Recurrent droughts in the last few years has increased farmers’ migration, sale of livestock assets, borrowing, and use of social networks [16]. While drought insurance and subsidies from the government exist, agriculture insurance is gaining significance for transferring risk and protecting small farmers [17].
The aim of this paper is to assess the gaps in adoption of crop insurance in Thailand and suggest possible solutions relating to policy support and framework, implementation mechanisms, technology adoption, and awareness amongst farmers.

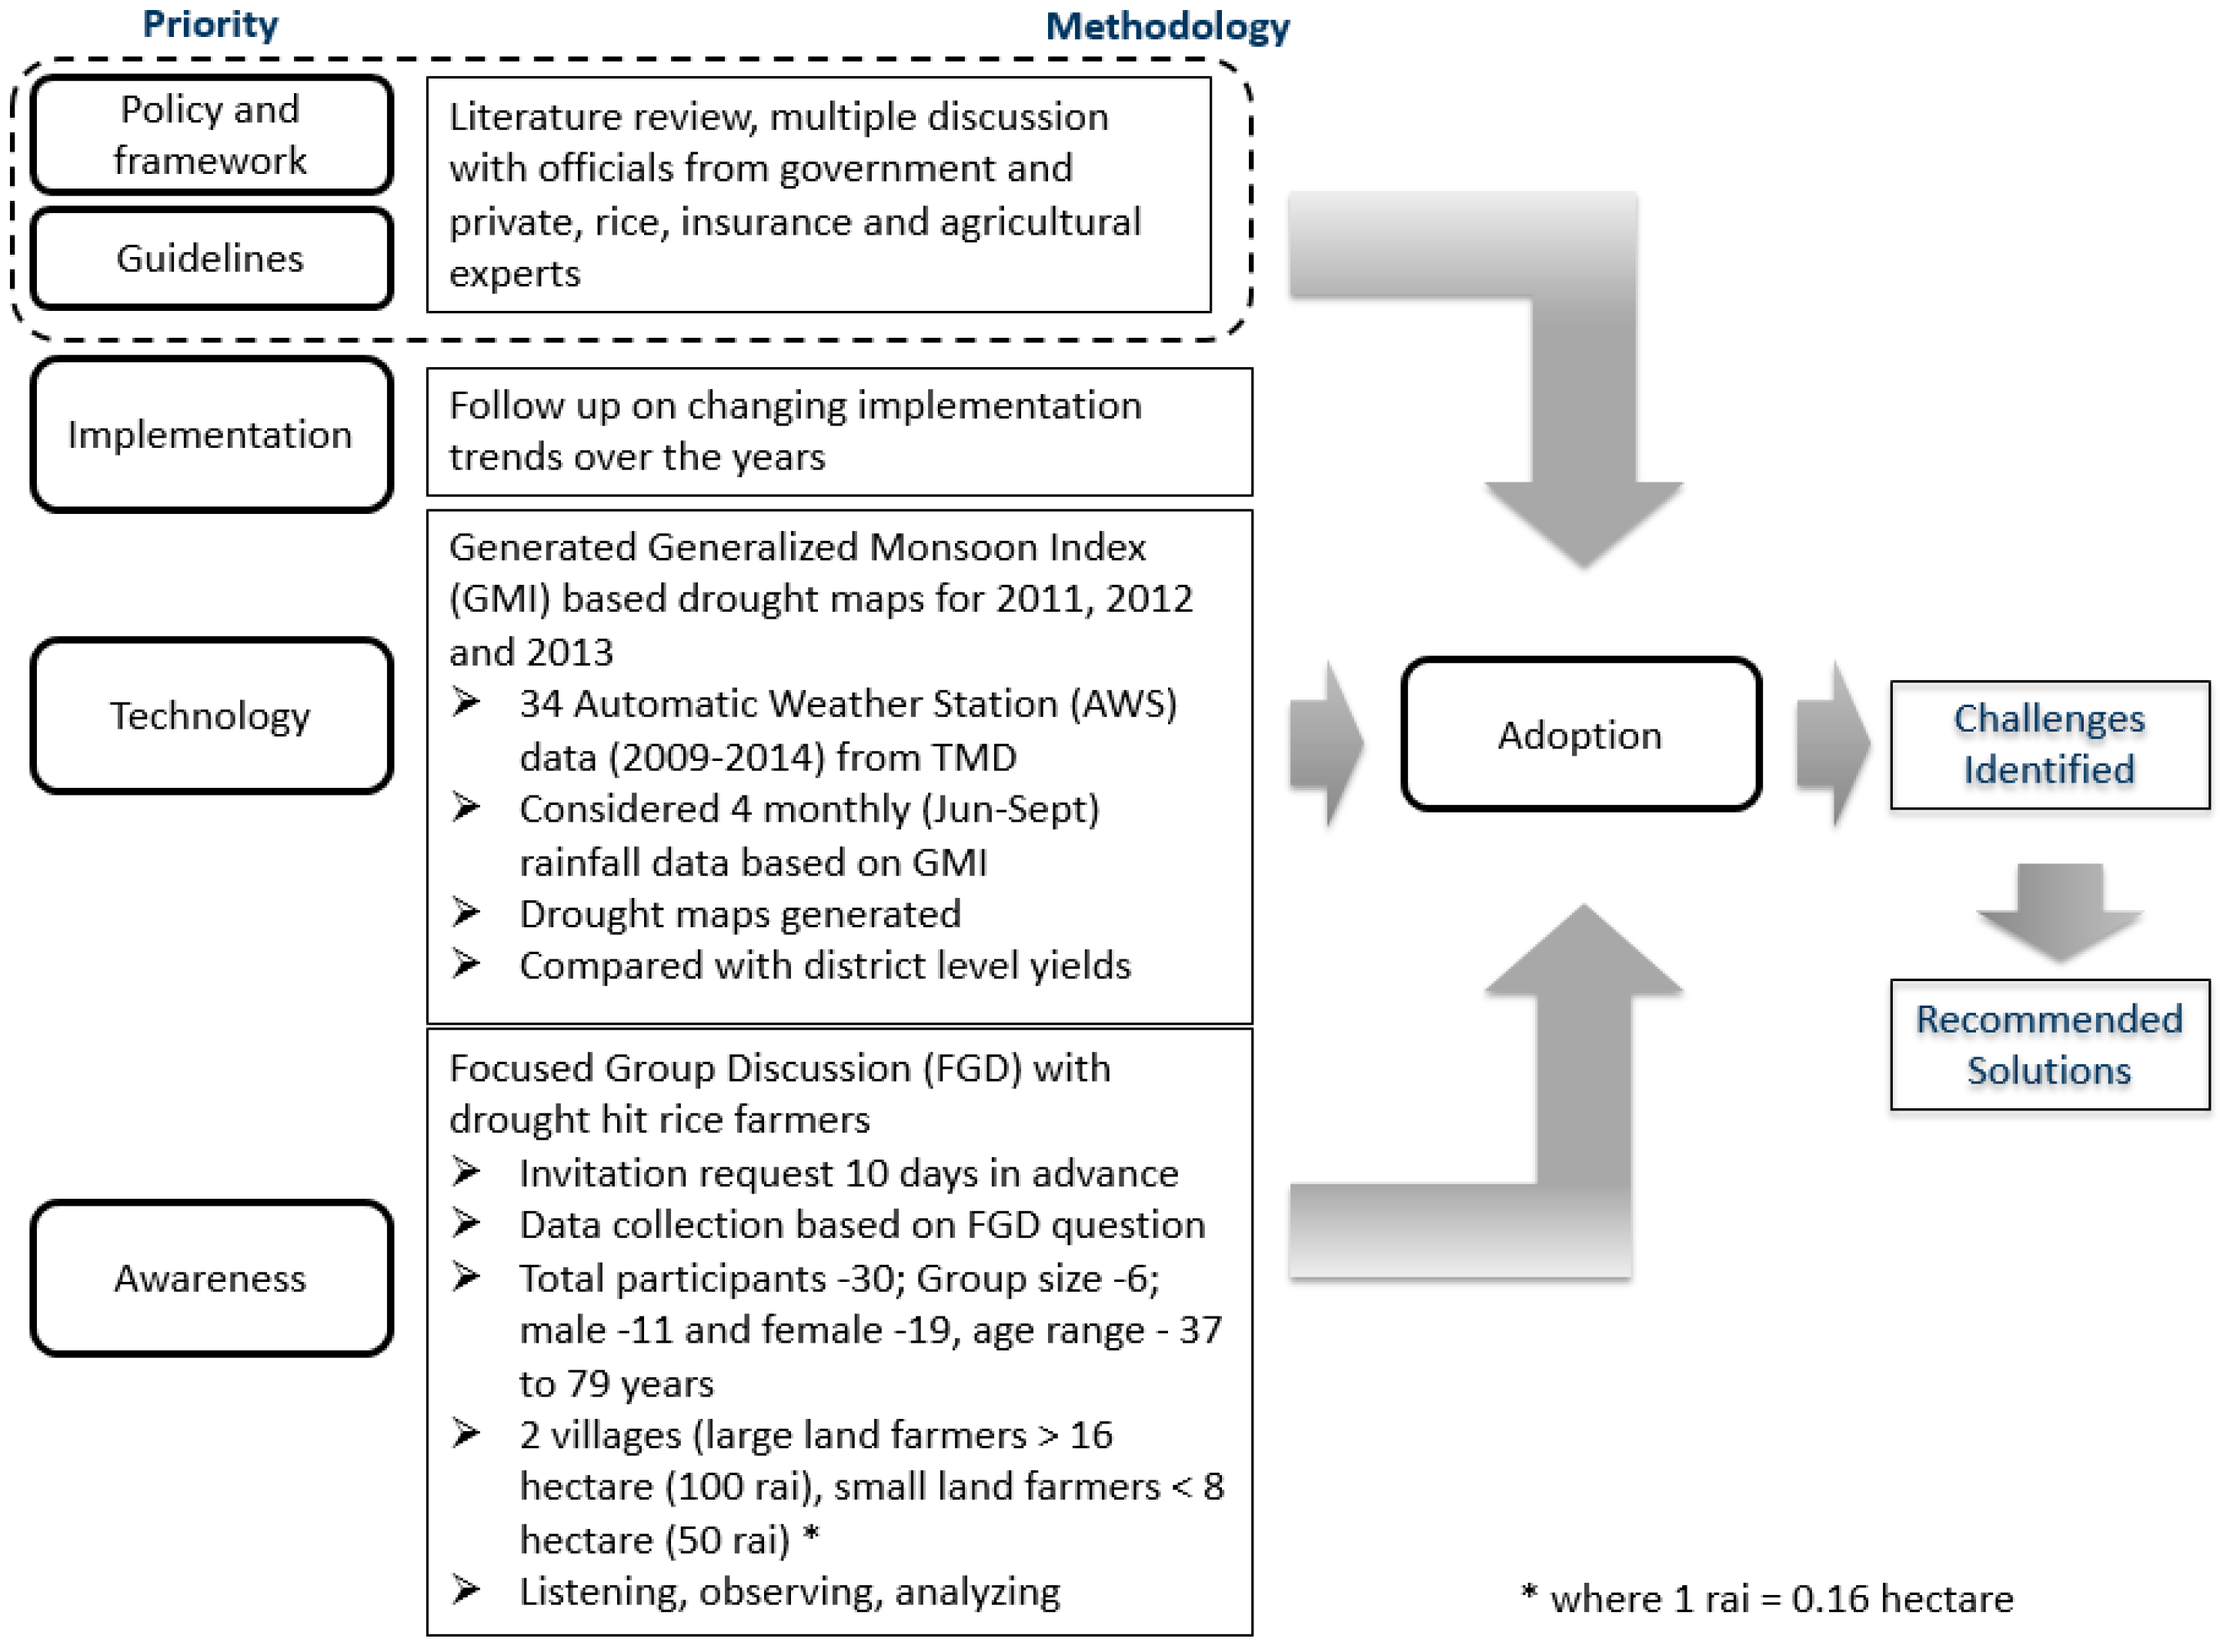
2. Methodology: Analyzing Gaps and Improving Weather Index Insurance (WII) Framework

The methodology included a literature review, interviews, and discussions with officials from government and private sectors, as well as rice and insurance experts. A study was undertaken at province level to assess the impact of using rainfall index as a threshold. Focused group discussions (FGD) were conducted to understand the awareness of rice farmers at village level.
Northeast Thailand has about 9.3 million ha of agricultural land with rice as the main crop. Khon Kaen, the second largest province in Northeast Thailand was considered for the study (Figure 1). Province and district level analysis was done by evaluating the Generalized Monsoon Index (GMI). GMI is an agro-meteorological index developed in 1982 [18]. The Thai Meteorological Department (TMD) uses GMI to monitor and assess the impact of rainfall on agriculture at the country level and, accordingly, has been considered for assessing the drought areas at the province level in this study. The value of GMI, measured in mm, is calculated from the monthly rainfall during the southwest monsoon season (GMIsw). The southwest monsoon season starts from mid-May and culminates around mid-October. According to TMD, the GMI in Thailand is calculated using the amount of rainfall from June to September, which is the rain fed growing season influenced by the southwest monsoon. The plantation starts in the early days of the rainy season and the highest water requirement for crop is in the flowering/reproductive stage.
The GMIsw is defined as follows:
G M I s w   =   w 6 P 6   +   w 7 P 7   + w 8 P 8   +   w 9 P 9
where w and P are the weighting factor and the monthly rainfall, respectively. The numbers 6, 7, 8, and 9 are the southwest monsoon months of June, July, August, and September, respectively. The weighting factors for the monthly rainfall are 0.125, 0.125, 0.5, and 0.25, respectively, which are based on crop coefficients of rice and corresponds to the crop water requirement at different growth stages [18,19]. It is then transformed to percentile rank (GMIpct) in an ascending order by making use of the values of GMI to get the ranging number, followed by calculation of GMIpct using the following equation:
G M I p c t =   r   ×   100   / ( n + 1 )
where r is the GMI range and n is the total number of years.
GMIpct rank was classified into levels of drought impacts based on the standard classification by TMD [19], 0–20 as severe drought, >20–30 as drought, >30–40 as minor drought, and >40 as normal crop condition. GMI based drought maps were generated using GIS software ArcMap 10 (ESRI, Redlands, CA, USA) for 2011, 2012, and 2013, using data from automatic weather station (AWS) (2009–2014) located at 34 locations in the Khon Kaen province.
FGD was conducted with rice farmers of similar background and experience to understand their perception and awareness of crop insurance and related challenges (Figure 2). The purpose of this FGD was to gather qualitative information. Rice farmers were invited at two locations in Ban Nong Phue and Ban Takut Khon villages from Nong Ruea and Sida districts, respectively, and the same discussion was carried out at both the villages. The advantage of considering two sets of discussion was to understand the difference in perception based on the size of the agriculture land and existing water infrastructure (irrigation). Small groups of six participants were formed to get better depth of response from each participants. Key issues targeted in the questionnaire were behavior and practices during droughts, impact of drought on crop yield, methods already in use to reduce the impact such as plantation of drought resistant rice and adoption of crop insurance. Thirty farmers comprising of a mix of males and females in the age range between 37 and 79 years were engaged. Amongst them, 30% of farmers had access to some water infrastructure (irrigation) facilities, like channels, ponds, or wells.

3. Policy and Frameworks of Crop Insurance

Crop insurance is a very unique business which has traditionally been implemented by the public sector with heavy subsidies from governments. Subsidies can improve affordability, but not necessarily equity, as some farmers may be over-subsidized, while others may not be able to achieve required risk coverage. To enhance affordability there would be a need to increase subsidies, which then increases the budgetary burden. Striking a balance between solvency, affordability, and equity is a challenge [20]. Since the 1990s, there has been a general trend of government’s promoting the private sector to take enhanced role in agriculture insurance. There are three possible frameworks for crop insurance (Table 3) and countries have been adopting these frameworks based on local conditions.
Each of these approaches vary in the level of government control and private sector engagement for any specific scheme. For instance:
The national agriculture insurance scheme generally has a monopoly agriculture insurance body where the entity is responsible for loss adjustment and has high level of government premium subsidy and reinsurance support; e.g., China.
In commercial competition with a high level of control, the policy design and premium rating criteria are controlled by the government and the insurer is obligated to offer crop insurance to all farmers and regions in order to qualify for the premium subsidies; e.g., Thailand.
In commercially-competitive situations with low levels of control, the private insurer is free to choose the crop/region/peril/premium rate they charge and the government role is to subsidize premiums only; e.g., India.
The public and private sector involvement in crop insurance has gained importance as a means to balance the traditional solvency concerns and equity and affordability expectations. It also helps to expand the risk coverage and increase market penetration [23].
An ideal situation would be to have a market-driven competitive agricultural insurance industry offering services with regulatory oversight to protect consumers and ensure a level playing field. However, such a situation is not easy to achieve. Currently, Thailand has adopted a framework that involves both public and private sectors. There exists policies, such as the Government Disaster Relief Programme (public), rice insurance with premium subsidy from the government (public-private), and also industry WII products.

3.1. Government Disaster Relief Programme

The Government Disaster Relief Programme is operated by the Ministry of Agriculture in Thailand. The programme provides financial compensation for losses caused by drought and floods and has laid down specific criteria (Table 4) for crops, fisheries, and livestock. This study particularly focuses on rice-related relief compensation and insurance.
The government disaster relief compensation has been working for a period of nine years (2005–2013). In these years, a cumulative compensation of $2362.17 million USD was paid to farmers affected, including payouts against rice, field crop, horticulture and others. The maximum payouts against rice was $292,610 USD for the 2011 floods (Figure 3).
The rate of support from the government was eventually reduced in 2013, as there were insufficient funds for the next cycle of agricultural production costs. This would perhaps have reduced farmer’s confidence. During this period, the Thailand Ministry of Finance launched a crop insurance model to reduce the amount of compensation. The government considered it more economical and efficient to pay the premium subsidies, if sustainable, rather than paying off compensations. This government compensation scheme has been working in parallel with the existing crop insurance schemes (public private partnerships) of the BAAC that has seven private insurance providers offering services, and a weather index insurance program that started in 2009, but was withdrawn in 2015 due to insufficient weather data.

3.2. Rice Insurance with Premium Subsidies from the Government

The rice insurance project with subsidies from the government started in 2011 with varying budget allocations to support the farmers affected from natural disasters every year. The premium was set at 129.47 baht/rai ($23.43 USD/hectare) including the tax and stamp duties. A flat premium was applied throughout Thailand of which 69.47 baht ($12.57 USD) was subsidized by the government and 60 baht ($10.86 USD) came from the farmer’s contribution. In addition, there was a discount of 10 baht/rai ($1.81 USD/hectare) for the BAAC clients only [2].
A high percentage of loss ratio in the initial years (2011–2012) was observed due to high concentration of insurance in risky areas. This led to further classification of risk at five levels (lowest–highest) based on the provincial crop average damage statistics of 2005–2012 available with the Department of Agricultural Extension. The rates of premium were then set by the Ministry of Finance ranging between 129.47 and 510.39 THB per rai ($23.4–$92.4 USD/hectare) based on the level of risk (Table 5). The indemnity payments for the rice insurance program is based on the official loss assessment criterion that does not cover areas where numbers of farmers affected are small. This is because there is no official declaration of disaster area for that particular small area and then no loss assessment for indemnity in that area is carried out. Insured farmers in those small affected areas do not receive indemnity, while their counterparts in larger affected area do. This shortfall of assessment has contributed to farmers’ perception that insurance does not really help in managing the risks.
The area insured and premiums declined after 2012 droughts, but it further improved in 2015 with three additional private insurers in the market. Recently, in September 2016, the Office of Insurance Commission (OIC) in Thailand indicated that 4.16 million hectares of rice farms have been covered under free crop insurance scheme for 2016–2017 season. Under this scheme, government and BAAC would share the premium charges at 60% and 40%, respectively, entitled for BAAC customers only [25]. As the crop insurance sector is undergoing a transition, it is very important for the government to develop a systematic framework (e.g., policy, guidelines) of loss assessment for national crop insurance.

3.3. Weather Index Insurance (WII) by Public Private Sector

Over the years, Thailand has had several crop insurance programs. During 1978–1990, a multi-peril crop insurance (MPCI) program covering cotton, maize, and soybean was implemented, but was closed down due to high administrative costs and loss adjustments. The WII pilot was later developed in 2006 with the support from World Bank. In 2008, BAAC signed an agreement with the Japan Bank for International Cooperation (JBIC) for developing weather index insurance products in Thailand. In 2009, the rice WII scheme was pilot tested by Sompo Japan Nipponkoa in Thailand [26]. It was expanded further in 2010 as both organization agreed to jointly develop WII program for rice using rainfall deficits as the payment threshold (Table 6). The premium rate remained at 4.64% over the years with a change in indemnity rate 2012 onwards. Earlier, indemnity was paid based on two classifications with 40% in case of severe droughts and 15% in case of drought. This was later changed to three classification with indemnity of 5% for early drought (1–31 July) and 40% for drought and severe drought (1 August–30 September).
Existing farmer clients of BAAC that produce rice in the areas defined near the weather station are eligible to join the scheme. Although the area insured has increased over the years, insurers fail to attain their target of revenue and profit. Disaster risk in agriculture is sometimes catastrophic (for instance 2012 droughts) and exceeds the financial capacity of the insurer. Regular occurrences of drought and a high loss ratio over the years indicate high risk and challenges that need to be addressed to improve the performance of the insurance program.

4. Technological Aspects of Weather Index Insurance (WII)

4.1. Data

Crop insurance products are highly dependent on the availability of credible historical and current weather data. WII requires an extended period of historical weather data from meteorological stations and yield data from agricultural organizations in order to determine the relationship, which can help in designing products that reflect actual damage and losses based on weather parameters. Correlations between rainfall and yield is a direct means for establishing the relationship which, in turn, can assist in development of insurance products. Absence of data is a critical problem and has been the reason for withdrawal of WII from the market in 2015. Maintenance of weather stations in order to have access to appropriate data is a key requirement.
Data collected by insurance companies are collected for particular purposes only, and are related to the coverage of the insurance premiums, which may not be sharable or publically available. Information collected at the local level would be most useful as it would include small magnitude/high frequency events. However, the coverage of such databases are limited.
The importance of collecting and making available interoperable agricultural and weather data, together with guidelines for sharing it is critical for developing evidence-based insurance programs. It is necessary to (i) develop core set of agricultural statistics with required domains and themes; (ii) ensure the collection, sharing and analysis of component wise disaggregated data (e.g., district level yield data) to increase knowledge and understanding of the underlying risks; and (iii) use nationally reliable and internationally comparable agriculture and weather data.

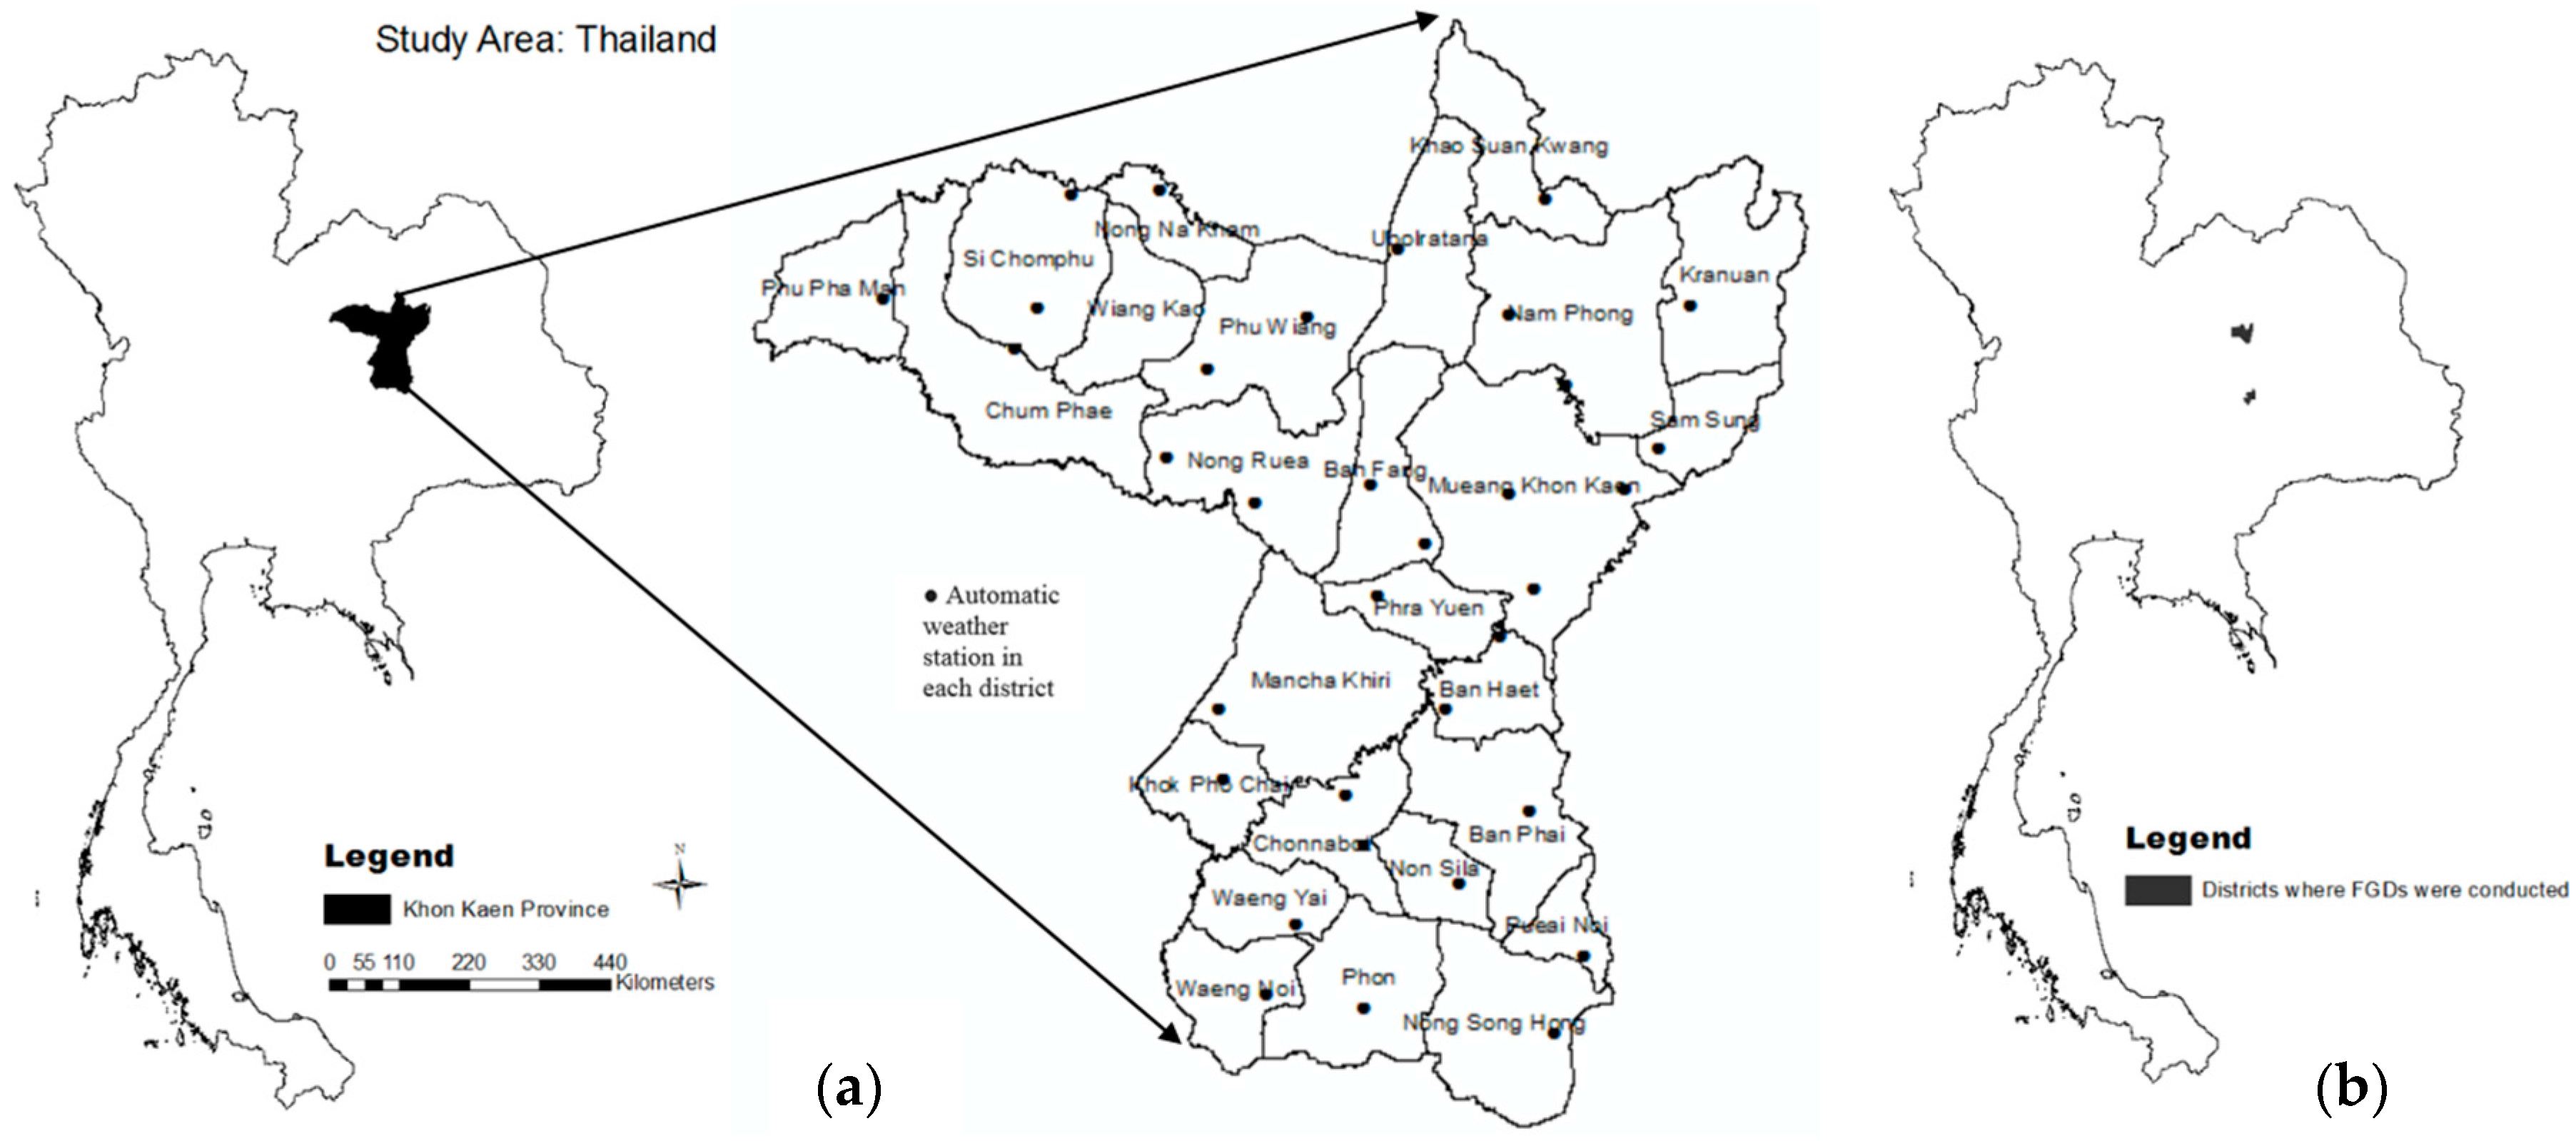
4.2. Weather Station Locations

In the WII program, the farmer has the privilege to choose the nearest neighbor weather stations when applying for the purchase of the insurance policy. There is no standard distance up to which a weather station is representative. Farms at a distance greater than 20 km from the weather station are also eligible for the insurance policy with the same level of premium for farmers at 5 km from the weather station. Additionally, weather stations far from the farms do not truly reflect the rainfall occurred and raise issues of basis risk in the area. This leads to unfair payouts on one side or under-compensation of losses to others as observed in many other studies [28,29].

4.3. Data Analysis, Integrated Planning, and Implementation Phase for Crop Insurance

Generally, policy planning is done at the national level, while implementation is carried out at the farm level. There is a need to make them more coherent for better results. In practice, the scale of input decides the scale of analysis [30]. To pay indemnity at the farm/district level, correlation between rainfall and yield should be analyzed at the same level. Table 7 below, provides an overview of risk information scales and approaches for policy planning and project investment based with the aim of disaster assessment. The requirement of the authorities may vary depending on the level and scope of project. For instance, based on areas affected at the country, regional, or district level, the mapping scale and spatial resolution requirements would need to be changed.
Considering the diverse mapping scale of disaster risk information in Table 7, there is a need to integrate risk assessment from the planning to the implementation phase. For instance, drought assessment at the national level is not granular enough to be applicable for insurance purposes. Medium- and large-scale assessments are highly applicable for reducing basis risk and better estimation of WII premiums and indemnity payout. Taking this understanding further, district level AWS data was used to develop GMI-based drought maps and compared it with district level yields.

4.4. Rainfall Index as Threshold Indicates High Basis Risk

A study was undertaken to assess the impact of using rainfall index as a threshold. Khon Kaen, the second largest province in Northeast Thailand was considered, 27 year (1987–2014) province-level rainfall and major rice yield for the months of July, August, and September were analyzed. Major crop rice yield at the province level did not show good correlation with in-season rainfall (Table 8).
Further, GMI-based drought maps developed indicated 2011 as a normal year with few districts affected in the south of Khon Kaen. Year 2012 was a severe drought year affecting almost all districts while year 2013 was a mix of drought and non-drought (Figure 4). In 2012, drought has been validated by the disaster-related data obtained from Department of Disaster Prevention and Mitigation (DDPM), Thailand. The 2012 data suggested that 26 districts of Khon Kaen were affected by drought.
District-level analysis was performed at the next level. In absence of long term historical yield data at the district level, only three year yields (2011, 2012, and 2013) available from the Organization of Agricultural Economics (OAE) were plotted using GIS (ArcMap 10; ESRI, Redlands, CA, USA) and were further compared with GMI-based yearly drought maps (Figure 4). District-wise comparisons of the three year yield, drought, and claim data show that few districts, like Nam Phong, Mueang Khon Kaen, and Chum Phae had relatively good yield in 2012 despite drought conditions established using the GMI. This is an example of potential adverse selection in insurance.
Poor correlation suggests that, potentially, there are factors other than rainfall contributing to yield in the district. A part of it can be explained by weather parameters based on ground measurements or technical developments in agriculture, like using irrigation or drought-resistant rice varieties. Further investigation was carried out regarding other parameters that could have been responsible for better yield than expected in the region. Results indicated that rainfall alone may not serve as the best possible parameter. Another study by Agriculture Resources and Regional Planning, China also indicated that individual climatic factors did not significantly influence rice yields at any spatial scale or for any temporal comparison. It was difficult to project rice yield changes using only climatic factors like temperature, rainfall, and sunshine duration and further indicates that rice yield can have varying effects of different climate factors at different spatial scales [32].

4.5. Insurance Based on Classified Irrigated and Non-Irrigated Areas

Interview with rice experts in the region revealed that in case Khon Kaen, irrigation is only available for about 20% of the rice-growing area. Each land area has different effects on rice growth while water level requirements also differ. Studies carried out by the Ministry of Agriculture and Rice Department of Thailand, suggest that average water requirement for rice is 6.9 mm/day and 4.3 mm/day in dry season and rainy season, respectively. Another study mentions that the consumption of water in the rainy season was 4.0–6.0 mm/day and 5.0–9.0 mm/day in the dry season indicating a 25%–30% higher level of water requirement in dry seasons. Studies in Pathumthani and Angthong province indicate that the use of water supply through alternate wet and dry method reduces the water consumption by 78% and 81%, respectively (these studies were not published and, hence, are not available in the public domain) [33].
Discussion with rice experts in government offices and farmers in the region supported the presence of irrigation in these districts. The Nong Wai Irrigation Project in Nam Phong supplies water for the irrigated areas in Muang Khon Kaen and Nam Phong districts. On the other hand, Ubolrat Dam, the largest dam in the province 50 km Northwest of Khon Kaen, provides irrigation in the northwest districts. Nam Phong district, despite having a relatively low rainfall, has good yield as it is irrigated. However, it qualifies for claims against weather index insurance in drought year 2012 as the insurance does not take into account these details and is based on rainfall only. Interviews with rice experts and regional studies [33] suggest that the normal average quantity of water for irrigated rice cultivation is about 750 mm/rai, which is less than the normal rice requirement. Threshold water levels for irrigated areas need to be updated based on further study to avoid adverse selection and reduce basis risk. The claims discussed here present the private sector WII schemes only.

4.6. Information about Rice Varieties Used

Adapting drought-resistant rice varieties is another parameter that needs to be taken into account in Weather Index Insurance products. This could be another reason, apart from irrigation, for the low correlation between seasonal rainfall and major rice yield (Khon Kaen Province).
In recent years, technological innovations have enabled the development of different rice varieties at local and international level. International Rice Research Institute (IRRI) has developed drought-resistant rice varieties that have been introduced to the farmers for plantation in various countries. Sahbhagi Dhan in India, Sookha Dhan in Nepal, BRRI Dhan in Bangladesh, and 5411 variety in the Philippines are examples of drought-resistant varieties [34,35]. These drought-resistant varieties have an average yield advantage over the drought-susceptible rice of about 0.8–1.2 tons per hectare under drought.
Further discussion with the OAE revealed that drought-resistant rice varieties were being used in Khon Kaen and other provinces of Thailand. Amongst various varieties being used, RD6 and Khao Doc Mali-105 (both drought resistant) are dominating, accounting for more than 90% of rice in Khon Kaen (Table 9). In the drought year of 2012, 94.46% rice variety cultivated in Khon Kaen was drought-resistant.
RD6 is a popular glutinous rice variety developed from Kho Doc Mali 150. It is photo-period sensitive, moderately drought-tolerant, not suitable for dry seasons, but has a very good soft aromatic cooking quality [37]. Experts suggest that these moderately drought-resistant varieties produce lower yield but can stand and survive the delay in rainfall. Rice experts and farmers suggest that the quality and demand of both RD6 and RD15 are at par with Kho Doc Mali but at a higher price (Table 10).
Evidence form rice farmers in Bangladesh indicate that farmers are generally unwilling to adopt drought-resistant rice varieties independent of insurance. This is mostly because of yield penalties under non-drought or irrigated conditions. However, when bundled with insurance, farmers’ valuation of the variety increases [39]. Considering the existence of WII and drought-resistant rice in Thailand, it would be useful to investigate the possibility of bundling WII with drought-resistant rice. Insurance companies implementing weather index schemes in the region have threshold levels based on historical rainfall, which pays off in case the actual rainfall is below the threshold for normal rice. However, in cases where drought-resistant rice is being used in the same region, it increases the chances of adverse selection. The insurer is unable to differentiate between drought-resistant and non-drought resistant rice growing farms. Rice experts suggest that drought-resistant rice varieties use an average of 6.9 ± 1.5 mm/day or 718 mm/year of water during the rainy season, but for a shorter period of time (average lifetime of 100 days, requiring an average water supply for 86 days). Drought-resistant rice varieties and their impact on the threshold weather level for insurance payments would be useful for insurance companies to reduce adverse selection and is an important area for further study.

5. Farmers Awareness and Adoption for Crop Insurance

FGD was conducted with predominantly rice-growing farmers in two villages, Ban Nong Phue and Ban Takut Khon in Nong Ruea and Sida districts, respectively (Table 11). Nong Ruea district farmers had small farm size (<8 hectare approx.) located near Ubolrat dam, whereas Sida district farmers had comparatively larger farm size (>16 hectare approx.) with no dam nearby. The same discussion was carried out at both the villages. The advantage of considering two sets of discussions was to understand the difference in perception based on the size of the agriculture land and existing water infrastructure (irrigation).
Systematic sampling approach was used as the participants were from a limited area (village). The participants were numbered consecutively on a list for determining the sampling interval by dividing the sampling population by the desired sample size (N/n). The first sample unit was selected at random and succeeding units were formed according to the sampling interval. Small groups of six participants were formed to obtain a better depth of response from each participant. Key issues targeted in the questionnaire were behavior and practices during droughts, impact of drought on crop yield, use of drought-resistant rice, and adoption of crop insurance.
Key reflections on the FDG indicated a mixed responses regarding the understanding of weather index insurance. Rice farmers with large fields (>16 hectare approx.), acknowledged the awareness but did not show interest in buying insurance. This was particularly because of the perception that insurance has high premiums and low payouts. Such farmers have been growing rice for years during rainfall season and do not grow a second crop due to lack of irrigation facilities. The farmers have a practice of holding the water during the rainy season, and saving water in ponds for use during drought or low rainfall periods. The farmers wait for rainfall every year and sow rice depending on the rainfall. Depending on rainfall conditions, viz., whether it is sufficient during the season (July–September), delayed or low, the farmers get a yield of approximately 800 kg/rai, 600 kg/rai, and 400 kg/rai, respectively.
Farmers with smaller farm lands (<8 hectare approx.) are affected more by drought, as it continues year after year. Unlike large farmland farmers, they do not have rice for subsistence in the event of low or delayed rainfalls. Such farmers try different alternatives to sustain themselves during the drought periods. Small farmers in Nong Ruea district use water from channels or grow other crops, like corn and cassava. Small farmers realize the importance of crop insurance more in terms of payouts as they have fewer source of income.
In general, the farmers expressed the need for crop insurance, supply of drought-resistant seeds, and the development of irrigation and water resources to address the drought challenges. None of them in the community have purchased crop insurance and have relied mainly on government compensation post-disaster. Although small-scale farmers suggest that crop insurance could be an added support other than the government disaster relief program, there is hesitation to buy the insurance due to high premium cost. Most of them raised the issue of affordability and were unwilling to pay the premiums and believe it should be fully subsidized by the government. Most of them were aware of crop insurance but do not fully understand the methods of compensation. Additionally, the farmers growing rice for years are reluctant to move to other crops that require less water compared to rice. Educating the farmers regarding alternate crops in the area would also improve their decision-making in the future. Although the FGD has limited participants, it gives an idea of farmers’ behavior and practices to address drought. There was a lack of awareness, resistance to change, and perception of the low value proposition for crop insurance program.

6. Key Findings and the Way Forward

Weather index insurance has great potential to mitigate the impact of drought in Thailand. In Thailand, the program currently includes government support to farmers through compensation and subsidies supplemented by limited private sector product offerings for crop insurance. However, there is a clear need to develop the crop insurance market given the challenges in sustaining an attractive and effective subsidy-based mechanism.
One of the key challenges in the adoption of crop insurance in Thailand is the user and provider confidence in the product. Reducing basis risk is key to addressing this challenge and expand the market for index-based insurance. Lack of reliable and actionable data is a key deterrent in development of sustainable insurance product line and creating a perceptible value proposition. Some of the key steps required to be taken in this regard are:
Standardization and development of data collection and analysis infrastructure: Risk information requires the organization of a spatial data infrastructure, where basic geospatial data can be shared among different organizations involved in risk assessment based on established guidelines. There is a need to integrate information available from various sources into a national data infrastructure. Different public sector organizations collect agricultural, meteorological, and insurance-related data that are not available on the public domain. Strengthening cooperation mechanisms for data and information sharing amongst organizations involved would be very useful. Although ground level weather data is conveniently available, yield data at the district level is limited. Making relevant information available to decision-makers and insurance agencies would empower both government and the private sector to develop better insurance products and markets.
Automatic weather stations: Accurate and timely weather data hold the key to successful index insurance products. Single automatic weather stations on an average represent a district. This results in high basis risk and may not reflect the situation accurately. Deploying a large number of weather stations might not, in itself, solve the problem as a long time series of observations are required to assess the risk accurately. However, it would assist in improving the model over the years.
Satellite-based data: While the terrestrial data model is refined, an integration of yield, weather, and satellite data can improve efficiency in the short run.
Realistic modeling, taking into account critical agricultural factors showing the correlation of the index with actual yields, will contribute to the development of more valuable and sustainable products. Turvey and Mclaurin suggested that Normalized Differential Vegetation Index (NDVI) should not be widely applied unless calibrated using location specific data [40]. In areas where there is a high correlation between satellite data and crop yields (approximately 70%), satellite data could be used to target crop cutting experiments (CCEs) reducing the cost and making it time efficient [38]. This should be studied further to improve the loss assessment methods used for government rice insurance programs.
Further, satellite data can be used to interpolate between the gaps in the ground station network of weather data. This would increase the availability and reliability of data required to improve the index products.
Using GIS technology to facilitate informed decision-making and improve modeling is important. Disaster related risk maps exist at the country level, but detailed risk maps at the province or lower level could be generated and used by the government in order to estimate the premiums more accurately and also map the use of drought mitigation mechanisms. More advanced and comprehensive agriculture insurance models tailored to each agricultural region can be developed if GIS maps at a granular level for critical parameters are available. The larger the spatial scale, the more efficient the insurance will be in terms of reducing basis risk, thus enabling more customized products and, in turn, take up of index insurance.
Crop insurance experiences in various countries suggest looking for alternatives if the insurance does not scale up over a period of time. For instance, the World Bank team working on the National Agricultural Insurance Scheme (NAIS) project in India investigated the benefits of combining data sources to improve the timeliness and accuracy of data. The total claim payment of the proposed product would be the maximum of the two indices, one based on yield data and the other based on weather station data. Given that weather station data is quicker to obtain, under scenarios where a claim is payable, the claim payment due from the weather index would be paid at, or even before, harvest. Once the yield data becomes available, and if the area yield-indexed claim payment exceeds the weather-indexed claim payment, a “top-up” payment would be paid at the end of the season [41].
In the absence of ground-based weather data, a combination of satellite agriculture drought information can be used to operationalize crop insurance. Instead of using only a rainfall-based index, an agro-meteorological drought index that takes into account rainfall, as well as crop growth, can be considered. GMI is one such index used to assess country level drought situation by the Thai Meteorological Department in Thailand and has been used for the province and district level analysis in the study. This should further be used at higher scales in identifying the drought areas at province, district, or lower level. Multi-criteria decisions involving spatially identifying irrigated and non-irrigated areas, drought resistant rice variety areas, and alternate dry and wet management areas would help insurance companies to select appropriate target markets for offering crop insurance products. Having all of these details at a larger spatial scale will help the insurers to accurately identify farmers’ risk and price them accordingly. This would improve solvency. The government subsidies can also be better targeted using these classifications. Satellite-derived indices for monitoring vegetation, like NDVI, can be used to validate and if required inspect vegetation status prior to releasing claims. This would reduce the fear of farmers exploiting crop insurance [42]. Incorporating the GMI and a combination of satellite agriculture drought information would help to overcome some issues and improve accuracy. It would further help in reducing basis risk and improving insurers and farmers’ confidence in the product.
Bridge the gap between technology and farmers perception: The study also found that there are various coping mechanisms used by farmers to mitigate their individual risks, including buying crop insurance, adopting drought-tolerant rice, developing irrigation or adapting other agricultural innovations to mitigate drought. The insurance model should take into account these options to build new insurance products that are highly attractive.
Raise the awareness of farmers: Discussion with farmers, insurance company, and BAAC in Thailand suggested low awareness among farmers about the potential benefits of weather index insurance products. Relatively low compensation is also an obstacle. Proper marketing and awareness-raising campaigns should accompany any future introduction of index-based insurance.
A summary of challenges and solutions in the study classified in the areas of policy support and framework, implementation mechanisms, technology adoption, and increased awareness on crop insurance amongst farmers is provided in Table 12.

Acknowledgments

The research benefitted from valuable inputs and insights from various experts in different government and private organizations in terms of data, stimulating discussion and interviews. Our sincere thanks goes to the Rice Department of Thailand, Organization of Agricultural Economics in Khon Kaen and Bangkok, Land Development Department of Thailand, Bank of Agriculture and Agricultural Co-operatives (BAAC) and Sompo Japan Nipponkoa Insurance, Thailand for their kind contribution. Our sincere thanks go to Khon Kaen University for their support and sharing their in-depth knowledge in the research area. In particular, we are grateful to all the rice farmers for sharing their practices, knowledge and perception during the discussion process.

Author Contributions

Both authors have made substantial contributions in conceptualizing, discussions, writing and coming up with the recommendations.

Conflicts of Interest

The authors declare no conflict of interest.

References

  1. Shepherd, A.; Mitchell, T.; Lewis, K.; Lenhardt, A.J.; Lindsey, S.L.; Muir-Wood, R. The Geography of Poverty, Disasters and Climate Extremes in 2030. Available online: http://www.odi.org/sites/odi.org.uk/files/odi-assets/publications-opinion-files/8633.pdf (accessed on 25 October 2016).
  2. Sinha, S.; Tripathi, N.K. Assessment of crop insurance international practices, policies and technologies as risk mitigation tools in India and Thailand. Int. J. Adv. Res. 2014, 2, 769–788. [Google Scholar]
  3. UNESCAP. Regional Forum on Space Technology Applications for Drought Monitoring and Early Warning I. Conclusions and Recommendations. Available online: http://www.unescap.org/sites/default/files/Final%20Report-DroughtRWG%201-2Jul2014SriLanka.pdf (accessed on 2 April 2015).
  4. Greatrex, H.; Hansen, J.; Garvin, S.; Diro, R.; Blakeley, S.; Le Guen, M.; Rao, K.; Osgood, D. Scaling up Index Insurance for Smallholder Farmers: Recent Evidence and Insights; CCAFS Report No. 14; CGIAR Research Program on Climate Change, Agriculture and Food security (CCAFS): Copenhagen, Denmark, 2015; Available online: https://cgspace.cgiar.org/bitstream/handle/10568/53101/CCAFS_Report14.pdf (accessed on 25 October 2016).
  5. The World Bank. Weather Index Insurance for Agriculture: Guidance for Development Practitioners; Agriculture and Rural Development Discussion Paper; The World Bank: Washington, DC, USA, 2011; Available online: http://documents.worldbank.org/curated/en/590721468155130451/Weather-index-insurance-for-agriculture-guidance-for-development-practitioners (accessed on 14 December 2015).
  6. Hellmuth, M.E.; Osgood, D.E.; Hess, U.; Moorhead, A.; Bhojwani, H. (Eds.) Index Insurance and Climate Risk: Prospects for Development and Disaster Management; Climate and Society No. 2; International Research Institute for Climate and Society (IRI): Columbia University, New York, NY, USA, 2009; Available online: http://iri.columbia.edu/docs/publications/Climate%20and%20Society%20Issue%20Number%202.pdf (accessed on 23 March 2015).
  7. Barrett, C.B.; Barnett, B.J.; Carter, M.R.; Chantarat, S.; Hansen, J.W.; Mude, A.G.; Osgood, D.; Skees, J.R.; Turvey, C.G.; Ward, M.N. Poverty Traps and Climate Risk: Limitations and Opportunities of Indexbased Risk Financing; IRI Technical Report No. 07-03; International Research Institute for Climate and Society: Palisades, NY, USA, 2007; Available online: http://barrett.dyson.cornell.edu/Papers/WP_Poverty_IRItr0702.pdf (accessed on 14 May 2015).
  8. Hazell, P.; Anderson, J.; Balzer, N.; Hastrup Clemmensen, A.; Hess, U.; Rispoli, F. The Potential for Scale and Sustainability in Weather Index Insurance for Agriculture and Rural Livelihoods; International Fund for Agricultural Development and World Food Programme: Rome, Italy, 2010; Available online: https://www.ifad.org/documents/10180/32647150-6e8a-41f3-8642-404768cfc99f (accessed on 17 August 2016).
  9. Cole, S.; Giné, X.; Vickery, J. How Does Risk Management Influence Production Decisions? Evidence from a Field Experiment; Harvard Business School Working Paper, No. 13-080; Harvard Business School: Boston, MA, USA, 2013. [Google Scholar]
  10. Food and Agriculture Organization of the United Nations (FAO). Country Fact Sheet—Thailand. Available online: http://www.fao.org/nr/water/aquastat/data/cf/readPdf.html?f=THA-CF_eng.pdf (accessed on 20 March 2016).
  11. Thaiturapaisan, T. Thailand’s Drought Crisis: Understanding It without the Panic. Available online: https://www.scbeic.com/en/detail/product/2127 (accessed on 23 October 2016).
  12. Mapraneat, V. Drought Conditions and Management Strategies in Thailand, Disaster Prevention and Mitigation, Thailand. Available online: http://www.ais.unwater.org/ais/pluginfile.php/597/mod_page/content/79/Thailand.pdf (accessed on 7 March 2016).
  13. Thaiturapaisan, T.; Drought, A. Worrying Situation for Thai Agriculture. Available online: https://www.scbeic.com/en/detail/product/1429 (accessed on 15 July 2015).
  14. The Telegraph. Farmers Fight over Water as Thailand Suffers Worst Drought in 10 years. Available online: http://www.telegraph.co.uk/news/worldnews/asia/thailand/11739503/Farmers-fight-over-water-as-Thailand-suffers-worst-drought-in-10-years.html (assessed on 15 December 2015).
  15. National News Bureau of Thailand—Public Relations. Available online: http://thainews.prd.go.th (accessed on 9 March 2016).
  16. UNESCAP. Disasters without Borders, Regional Resilience for Sustainable Development, Asia-Pacific Disaster Report 2015. Available online: http://www.unescap.org/resources/asia-pacific-disaster-report-2015 (accessed on 20 December 2015).
  17. Sirimanne, S.; Srivastava, S.; Kim, S.E.; Li, H.M.D.; Firer, A.; Sinha, S. Building Resilience to Droughts: Scaling up Weather Insurance in China, India, and Thailand. In Proceedings of the 7th World Water Forum, Daegu, Korea, 12–17 April 2015; Available online: http://lib.icimod.org/record/30291/files/CaseStudy_4WWF.pdf (accessed on 15 October 2015).
  18. Sakamoto, C.; Achutuni, R.; Steyaert, L. User’s Guide. Development of AgroClimatic/Crop Condition Index Assessment Models; NOAA, Atmospheric Science Department, University of Missouri: Columbia, MO, USA, 1984. [Google Scholar]
  19. Ueangsawat, K.; Jintrawet, A. An Assessment of Future Climate Change and Water Condition in Upper Ping River Basin under A2 and B2 Scenarios during 2015–2074. Environ. Nat. Resour. J. 2014, 12, 22–43. [Google Scholar]
  20. Pérez-Blanco, C.D. Insurance Schemes in the Agriculture Sector to Address Climate Change Impacts. International Center for Climate Governance; ICCG Reflection No. 46/March 2016. Available online: http://www.iccgov.org/wp-content/uploads/2016/03/46_Insurance-schemes-in-the-agriculture-sector-to-address-climate-change-impacts_C.-D.-P%C3%A9rez-Blanco.pdf (accessed on 26 October 2016).
  21. Food and Agriculture Organization of the United Nations (FAO). Agricultural Insurance in Asia and the Pacific Region. Available online: http://www.fao.org/3/contents/46ed3d30-a8e3-5f4b-ae3d-5de34231b111/i2344e00.pdf (accessed on 26 January 2015).
  22. Mahul, O.; Stutley, C. Government Support to Agricultural Insurance: Challenges and Options for Developing Countries; The World Bank: Washington, DC, USA, 2010. [Google Scholar]
  23. Mysiak, J.; Pérez-Blanco, C.D. Partnerships for affordable and equitable disaster insurance. Nat. Hazards Earth Syst. Sci. Discuss. 2015, 3, 4797–4832. [Google Scholar] [CrossRef]
  24. Bank for Agriculture and Agricultural Cooperatives (BAAC). Challenges and Experiences towards Sustainable Rural Finance. Unpublished work. 2016. [Google Scholar]
  25. Bangkok Post. 26m Rai of Farmland Insured, Says OIC. Available online: http://www.bangkokpost.com/business/news/1076372/26m-rai-of-farmland-insured-says-oic (accessed on 5 September 2016).
  26. Thanad, J. Recent Developments of Crop Insurance in Thailand. Available online: http://www.oecd.org/insurance/insurance/49657525.pdf (assessed on 9 September 2012).
  27. Sompo Japan Nipponkoa; Bangkok, Thailand. Personal communication, 2015.
  28. Norton, M.T.; Turvey, C.; Osgood, D. Quantifying spatial basis risk for weather index insurance. J. Risk Financ. 2012, 14, 20–34. [Google Scholar] [CrossRef]
  29. Black, E.; Tarnavsky, E.; Maidment, R.; Greatrex, H.; Mookerjee, A.; Quaife, T.; Brown, M. The Use of Remotely Sensed Rainfall for Managing Drought Risk: A Case Study of Weather Index Insurance in Zambia. Remote Sens. 2016, 8. [Google Scholar] [CrossRef]
  30. Sinha, S. Disaster Information Management in Asia and the Pacific: Issues, Challenges and Opportunities. Working Paper; Regional Expert Group Meeting on Capacity Development for Disaster Information Management. Available online: http://www.unescap.org/sites/default/files/APDIM%20Draft%20Working%20Paper%20for%20EGM%2021-%2022%20OCT%202014_BKK%20(website).pdf (accessed on 15 January 2015).
  31. Van Westen, C.J. Remote Sensing and GIS for Natural Hazards Assessment and Disaster Risk Management. Available online: ftp://ftp.itc.nl/pub/westen/Multi_hazard_risk_course/Powerpoints/Background%20paper%20Spatial%20data%20for%20hazard%20and%20risk%20assessment.pdf (accessed on 10 December 2014).
  32. He, Y.; Cai, W.; Chen, J.; Zhou, Z.; Gao, M.; Liu, Y.; Zhang, L. How climatic factors changes statistically relate to rice yield at agro-subzone and nationwide level during the period 1961–2040. In Proceedings of the 5th International Conference on Agro-Geoinformatics, Tianjin, China, 18–20 July 2016.
  33. Rice Department of Thailand. Using Water in Rice Cultivation. Unpublished work. 2016. [Google Scholar]
  34. Dobermann, A. Transformative Technologies. Available online: http://irri.org/blogs/achim-dobermann-s-blog/transformative-technologies (accessed on 15 December 2013).
  35. Anantha, M.S.; Patel, D.; Quintana, M.; Swain, P.; Dwivedi, J.L.; Torres, R.O.; Verulkar, S.B.; Variar, M.; Mandal, N.P.; Kumar, A.; et al. Trait Combinations That Improve Rice Yield under Drought: Sahbhagi Dhan and New Drought-Tolerant Varieties in South Asia. Crop Sci. 2016, 56, 408–421. [Google Scholar] [CrossRef]
  36. Organization of Agricultural Economics (OAE); Bangkok, Thailand. Personal communication, 2016.
  37. Orachos, N.; Carl, P. Adoption of drought-tolerant rice in Thailand: Participatory varietal selection and implications for breeding programs. J. Dev. Agric. Econ. 2014, 6, 394–404. [Google Scholar] [CrossRef]
  38. Rice Knowledge Bank; Bangkok, Thailand. Personal communication, 2016.
  39. Ward, P.S.; Spielman, D.J.; Ortega, D.L.; Kumar, N.; Minocha, S. Demand for Complementary Financial and Technological Tools for Managing Drought Risk: Evidence from Rice Farmers in Bangladesh. Available online: http://reliefweb.int/sites/reliefweb.int/files/resources/ifpridp01430.pdf (accessed on 25 May 2016).
  40. McLaurin, M.K.; Turvey, C.G. Applicability of the Normalized Difference Vegetation Index in Index-Based Crop Insurance Design. Available online: http://journals.ametsoc.org/doi/pdf/10.1175/WCAS-D-11-00059.1 (accessed on 22 March 2015).
  41. The World Bank. Agricultural Data and Insurance—Innovations in Agricultural Data Development for Insurance. Available online: https://blogs.worldbank.org/psd/files/agricultural-insurance-data-15sept2015.pdf (accessed on 22 March 2016).
  42. Prabhakar, S.V.R.K.; Bakar, A.A.; Claudio, C.P.B.; Hung, H.V.; Solomon, D.S. What Ails the Effectiveness of Crop Insurance? Emerging Bottom-up Issues and Solutions; Asia-Pacific Adaptation Network: Bangkok, Thailand, 2015. [Google Scholar]
Figure 1. Study area (a) Khon Kaen Province; and (b) districts where FGDs were conducted. Source: Authors.
Sustainability 08 01306 g001
Figure 2. Analyzing gaps and improving weather index insurance (WII) framework. Source: Authors.
Sustainability 08 01306 g002
Figure 3. Government disaster relief payouts (2005–2013).
Sustainability 08 01306 g003
Figure 4. District-wise yield and drought impact (using GMI) and private WII claims (2011–2013).
Sustainability 08 01306 g004
Table 1. Drought-related statistics of Thailand (2007–2013).
YearDrought Area (Provinces)Vulnerability
PeopleAgricultural Area (Hectare)Losses (US $)
20076616,754,980218,549.36,109,203.1
20086113,298,89584,983.83,200,888.5
20096217,353,35896,223.53,337,853.2
20106415,740,824277,914.343,598,997.7
20115516,560,561131,390.04,062,376.2
20125215,234,597240,628.012,297,552.2
2013589,066,185691,574.989,802,429.3
Source: Department of Disaster Prevention and Mitigation, Thailand [12].
Table 2. Reservoir water levels and useable water remaining across Thailand in June 2015.
RegionsChaophraya-ThajeenMaklongNorth-EasternEast
% Reduction in Reservoirs water level from 2014 to 2015−2%−6%−11%−21%
% Reduction in Useable water remaining from 2014 to 2015−13%−28%−24%−26%
% of Reservoir Capacity4%9%13%19%
Remaining days of water supply32128185190
Source: Economic Intelligence Center, Siam Commercial Bank, Thailand [13].
Table 3. Frameworks for crop insurance and adapting country examples.
Public SectorPrivate SectorPublic and Private Sector
Government has monopoly and intervenes to provide heavy subsidy and assumes the role of reinsurer.Insurance companies compete for business and purchase the reinsurance from international commercial reinsurers.Different forms varying on the level of government involvement.
High penetration as it is generally compulsoryLow to moderate penetrationHigh penetration
Well diversified portfoliosLow risk diversificationWell diversified portfolios
High fiscal costNo fiscal costReasonable fiscal cost
Adapting Country Examples
Bangladesh (Sadhurin Beema Corporation), Canada (10 provincial government crop insurance corporations), Cyprus (Agricultural Insurance Organization of the Ministry of Agriculture), Democratic People’s Republic of Korea (Korea National Insurance Corporation), Greece (Hellenic Agricultural Insurance Organization (ELGA), India (Agriculture Insurance Cooperation of India (AIC)), Iran (Government owned Agriculture Insurance Fund), Philippines (PCI), Sri Lanka (Agricultural and Agrarian Insurance Board)Argentina, Australia, Germany, Hungary, India, Malaysia, New Zealand, Philippines, South Africa, Lanka, Sweden, Thailand, The Netherlands, United States, VietnamChina, Indonesia, Japan, Mongolia, Pakistan, Republic of Korea, Thailand, United States, Vietnam
Source: Authors [7,21,22].
Table 4. Criteria of the Government Disaster Relief Programme for agricultural compensation.
Crop DetailsRegularSpecial Announcement (Cabinet Resolution as of November 2010)Special Announcement (Cabinet Resolution as of August 2011)Ministry of Finance (Regulation 2013)
(US $/Hectare)
Rice109.7379.7402.2201.4
Field Crop151.5528.7570.1207.8
Horticulture165.1888.3922.7305.9
Others51.9444.2461.4-
Source: Ministry of Agriculture and Cooperatives, 2013 [24].
Table 5. Trends and developments in rice insurance with subsidies from the government, Thailand (2011–2015).
Details20112012201320142015
Cabinet Resolution3 May26 June20 August24 June28 April
InsurersPool of 8 companies with Dhipaya Insurer as the key insurerNational Catastrophe Insurance Fund was established
  • Thaivivat Insurance
  • Dhipaya Insurance
  • Chaophaya Insurance
  • Thaivivat Insurance
  • Dhipaya Insurance
  • Chaophaya Insurance
  • The Viriyah Insurance
  • Thaivivat Insurance
  • Dhipaya Insurance
  • Chaophaya Insurance
  • The Viriyah Insurance
  • ++3 new insurance companies
CharacteristicsRice farmers who register with Department of Agricultural ExtensionInsurance must be done within 45 days from planting date-
Premium Rate129.47 THB/Rai ($23.4 USD/hectare) *129.47–510.39 THB/Rai ($23.4–$92.4 USD/hectare) *
Perils coveredDrought, flood, storm or typhoon, cold, hail and fireDrought, flood, storm or typhoon, cold, hail, fire, pest and disease
Compensation RatesFirst 60 days—606 THB/rai ($109.6 USD/hectare) and from 61st day to 1400 THB/rai ($253.4 USD/hectare)Multi-Peril Compensation—1111 THB/rai ($201.1 USD/hectare)
And Pest and disease Compensation—555 THB/rai ($100.5 USD/hectare)
Waiting Period7 Days (from the starting of insurance, no compensation is paid)
ConditionsAll district areasSelective area based on level of risk
Area Insured (Hectare)169,460.96139,590.4819.2132,907.8241,931.56
Premiums (US $)3,960,2403,262,21012,47010,435,94017,815,860
Compensation (US $)21,938,151.27,425,313.6902.13Not availableNot Available
Source: Challenges and Experiences towards Sustainable Rural Finance, Bank of Agriculture and Agricultural Cooperatives (BAAC), Thailand [24]; * where 1 Rai = 0.16 hectare and 1 Thai Baht = $0.029 USD (currency conversion as on 31 August 2016).
Table 6. Trends and developments in Weather Index Insurance (WII), Thailand (2009–2014).
InsurerSompo Japan Insurance (Thailand) Company Limited
Details2009 (Pilot)20102011201220132014
Premium Rate4.64% of insured premium
Indemnity Rate40% of insured amount in case of severe drought and 15% in case of drought5% for early drought (1–31 July) and 40% for drought and severe drought (1 August–30 September)
Operation Areas5 districts of Khon Kaen provinceAll 25 district of Khon KaenExpanded to additional 4 provincesExpanded to additional 4 provinces to a total of 99 ProvincesExpanded to additional 8 provinces to a total of 17
Number of weather stations534140235235388
Insured2761158617384928634320
Sum Insured (US $)287,158466,3202,074,950291,450955,5501,640,820
Area Insured (Hectare)917.281286.4572484026364526.4
Premium (US $)Pilot test, no payment21,637.2596,277.6813,523.2844,337.5276,134.05
Indemnity (US $)3436.504089.00Early Drought $12,412 USD (359 farmers)Early Drought $6003 USD (206 farmers)Early Drought $49,445 USD (1322 farmers)
Drought $7395 USD (168 farmers)Drought $3958.5 USD (91 farmers)Drought $12,963 USD (192 farmers)
Severe Drought $26,100 USD (207 farmers) Severe Drought $14,369.5 USD (125 farmers)
Total Indemnity (US $) $45,907 USD (734 farmers)$9961.5 USD (297 farmers)$76,777.5 USD (1369 farmers)
Loss Ratio15.88%4.24%339.47%22.47%100.85%
Source: BAAC and Sompo Japan Nipponkoa, Thailand [24,27].
Table 7. Scales of disaster assessment, with an indication of basic mapping units and the optimal scale for drought and floods.
ScaleLevelMapping Scale (Million)Spatial ResolutionArea Covered (km2)DroughtFloods
GlobalGlobal<1:51–5 km148 million***
Very SmallContinental/large countries1–515–20 million*****
SmallNational0.1–10.1–1 km30–600 million******
RegionalProvincial0.05–0.1100 m1000–10,000*****
MediumMunicipal0.025–0.0510 m100*****
LargeCommunity>0.0251–5 m10****
Applicability (preferred scale for disaster assessment): (*** = highly applicable; ** = moderately applicable; * = less applicable). Source: Adapted from Remote sensing and GIS for Natural Hazards Assessment and Disaster Risk Management [31].
Table 8. Province level major rice yield and seasonal rainfall, 27 years (1987–2014).
Province Level Rice YieldCorrelation Coefficient (R)Coefficient of Determination (R2)
Total September Rainfall0.2120.045
Total August-September Rainfall0.1390.019
Total July-August-September Rainfall0.1300.017
Table 9. Percentage of different rice varieties cultivated in the Khon Kaen province of Thailand (2009–2014).
Year% of Rice Variety (Wet Season Only)% of Rice Variety (Dry and Wet Seasons)
RD6Kho Doc Mali 105RD15Photoperiod SensitivePhotoperiod InsensitiveRD10Phitsanulok 1, 2Chai Nat 1Others
200972.0122.261.140.890.87--0.572.26
201070.6422.651.140.891.84--0.572.27
201170.0823.880.770.781.81--0.382.30
201269.3725.090.591.551.30--0.102.00
201369.9724.730.561.021.53--0.112.08
2014----7.8025.5628.5431.666.44
Source: Organization of Agricultural Economics (OAE), Thailand [36].
Table 10. Characteristics of Thailand major rice varieties (wet season).
DetailsRD6Khao Dawk Mali (KDML-105)RD15
Started197719591978
LocationNorth and NortheastNortheast and Upper NorthNorth East
ResistanceDrought ResistantDrought ResistantDrought Resistant
CharacteristicsFragrant, chewy, GlutinousFragrant, Soft, Non-GlutinousFragrant, Soft, Glutinous
Maturity21 November25 November10 November
Approximate Production666 kg/hectare363 kg/hectare560 kg/hectare
QualityHighHighHigh
DemandDomesticPremium ExportDomestic
Source: Rice Knowledge Bank, Thailand [38].
Table 11. Focused group discussion with farmers predominantly growing rice in Northeast Thailand.
Focused Group Discussion with Rice Farmers; Number of Participants—30; Group Size—6; Average Age—60 Years; No. of Males—11; No. of Females—19; * Approx. Land Area in Rai, Where 1 Rai = 0.16 Hectare
QuestionsDetailed Comments Based onTotal Farmers (30)
Large land farmers (Approx. >16 Hectare) *Small land farmers (Approx. < 8 Hectare) *Frequency of Drought in 15 years
1. What is the frequency of drought occurrence in last 10 years?Drought occurred 8–9 times, the general practice is to wait for rainfallAbout 13 farmers claim it as “many times”<5≤10Many timesNo comments
9813
2. What is the general practice? Some claim using water from channel, grow other plants like corn, along with some being unemployed with no source of income. Some also suggest presence of government support but insufficient.Wait for RainGrow other cropsUse other sources of waterNo comments
14754
3. What do you think should be done to support farmers in case of droughts?Need dam and channelNeed water supplement and resources.
4. Was your rice ever damaged because of less or delayed rainfall?Yes, many times almost every yearYes, heavy damage, no production in 2015
5. What else do you grow instead of rice in case of low rainfall predictions or drought situations?Six large land farmers suggest growing only rice for years15 farmers suggested growing nothing because water is not enough, 1 farmer grew sugarcane, 1 grew cassava, and 3 indicated growing less water consuming plants provided by the governmentGrow nothingSugarcane/CassavaOther plants provided by GovernmentNo comments
15234
6. Did you ever grow cassava or mung bean on the land you grew rice before?NeverA farmer shared his experience of growing Cassava (5 rai~0.8 hectare) as it requires less water and its soil nutrients also support the growth of rice in the next season.
7. Have you ever planted drought resistant rice like RD6 and KDML-150?Never grown RD6A combination of KDML-150 and RD6 is grown
8. What is the preferred rice for you to grow in this area? Do you keep changing the rice variety?Have been using KDML-150 for years and do not prefer to changeSome farmers prefer to change rice variety whereas some do not, some preferred using KDML-150 while others would like to use RD6 and RD10 but need seeds (unavailable)Variety RiceKDML-150RD6/RD10Need Drought Resistant Rice
3881
9. What is the water requirement of drought resistant rice?50%–70% of the normal (approx.)Need less water, RD10 grows in 3 months, and some farmers were unaware as they claim, have never grown drought resistant rice
10. How is the yield of drought resistant rice as compared to normal rice, what about price and demand? What do you prefer? Why?Some farmers prefer normal rice as grown every year and have good price
-
To have product in time, need resistant rice seed
-
some prefer normal rice as grown every time and have good price
-
no idea, never grown drought resistant rice
-
Resistant rice use less water as compared normal rice and has low price
Prefer normal ricePrefer drought resistant riceWhy?No comments
83 8
11. What do you understand by crop insurance? Do you want to have one?Don’t want, need government subsidized premiumNeed crop insurance as it gives good price, some do not understand, some find government compensation easy and are not interested in insurance, need government subsidized premiumWantDon’t wantWhy?No comments
88 14
12. Do you understand the difference between weather index insurance and yield-based insurance? 3 farmers indicated that weather is unreliableUnderstandDon’t UnderstandOther commentsNo comments
13935
13. What is your preference in terms of buying drought resistant rice variety and buying crop insurance?Prefer resistance rice and not buy crop insurance
-
Buy crop insurance,
-
Some prefer drought resistant rice,
-
Not require both
Crop insuranceDrought resistant riceBothNo comments
101226
14. What are the sources of irrigation in your farm land?Rainfall is the only sourceApart from only rainfall some farmers had access to channel, ponds, wellsOnly RainfallDam/ChannelPonds/WellNo comments
2172
15. Is there any other hazard that impacts your crop growth other than drought? If yes, what are they?InsectRice disease, insects, soil qualityInsectsRice diseaseSoil qualityOther comments
1681
16. Any other comments? Need to develop water resources and need good rice seed
Table 12. Identified challenges and solutions for an effective crop insurance. Source: Authors.
PriorityChallenges Solutions
Policy, Framework and GuidelinesExisting but less attractive to farmers
Need to integrate information available from various government sources into a national data infrastructure
Standardization and improvement in data collection
Crop insurance should be mandatory and linked to credit (for example as in India)
Making relevant information available to decision makers and insurance agencies would empower both government and private sector to develop better insurance products and markets
TechnologyDistrict level yield data unavailable
More than 30 percent weather data unavailable in 2015 (non-working weather stations)
High Basis Risk
Only rainfall based index used
Weather index insurance does not consider the relevance of distance between farm and weather station
Regular weather station maintenance
Deploy more weather stations
Develop GMI based drought maps
Classify irrigated non-irrigated areas
Classify drought resistant rice areas
Identify areas with alternate wet and dry water management
Post drought validation based on NDVI
Integrating yield, weather and satellite data and reduce basis risk
Bridge the gap between technology and farming practices
AwarenessLow awareness among farmers about potential benefits of crop insurance and drought resistant rice
Low confidence in crop insurance
Reluctant to choose non-rice crop
Low irrigation in northeast part of Thailand
Proper marketing and awareness raising campaigns regarding insurance
Need awareness regarding drought resistant rice and other crops that require less water for an improved decision making

