1. Introduction
With the adoption of reform and opening-up policy in the early 1980s, economic development became the primary task across China. Accordingly, GDP and its growth speed are deemed the two most important measures on economic development for both the Central Government and local governments. Meanwhile, China’s Central Government potentially set out a special promotion system for local officials, in which officials from regions with greater GDP and rapider growth speed will have more opportunities to be promoted. Stimulated by this promotion system, officials from all provinces exert themselves to compete for various resources, including foreign direct investment (FDI) and rural surplus labor, to expand their GDP for the possible promote of their own. The provincial competition makes 31 provinces just like 31 giant companies in China’s market. Undoubtedly, these unusual systems have kept China the rapidest growing economy in the world for 20 years.
Along with the rapid economic growth, environmental issues have increasingly become serious due to the excessive energy usage and pollution emission. However, most policy makers fail to pay substantial attention to the environmental issues for a long time, even the Central Government. Actually, as the highest institution on pollution prevention and control, the State Environment Protection Administration (SEPA), in China was always treated as an affiliated division to the Ministry of Urban and Rural Construction before 2008, without real power to protect the nationwide environment. At the provincial level, these imbalanced systems between the economic development and environmental protection are completely the same to the Central Government. When facing the environmental regulations issued by SEPA, each province almost consistently carries out the policy of “first pollution, then treatment”, and the mode of “high input, high output and high emissions” throughout the industrial field, especially in the southeast coastal provinces. That is to say, the whole economic development system in each province has to be artificially divided into industrial production sub-system and pollution treatment sub-system, and almost all officials may pay more attention to the industrial production sub-system than to the pollution treatment sub-system.
Since China’s entry into WTO in 2002, China’s Central Government further deepened the reform and opening-up policy. The new entry of large scale FDI triggered a new round of inter-provincial competition on economic development. To prevent China from becoming the “pollution heaven” of developed countries, the Central Government issued a series of environmental policies (see
Appendix A) in order to achieve the transformation from the “high input, high output and high emissions” mode to the “low input, high output and low emissions” mode. In addition, the Central Government requires increasing more investment in pollution treatment, which rose from 101.49 billion Yuan in 2000, accounting for 1.13% of GDP, to 951.65 billion Yuan, or 1.67%, in 2013. However, China SEPA was not accordingly upgraded to the Ministry of Environmental Protection (MEP) until 2008, which, to some extent, weakened the implementation of those environmental polices. According to the World Bank Standard, China’s GDP per capita rose from $950 to $7500 since 2000; contrarily, the energy and environmental issue has been further highlighted. From 2000 to 2013, total energy consumption (coal equivalent) of China has risen from 1.4 billion tons to 4.1 billion tons, and emissions of major pollutants, such as waste water, waste gas and industrial solid waste, respectively, rose from 41.52 billion tons, 13.8 trillion cubic meters, and 820 million tons to 69.54 billion tons, 66.9 trillion cubic meters and 3300 million tons. The interim assessment for the “12th Five-Year” plan published at the beginning of 2014 [
1] showed that half of the mandatory indicators on energy saving and pollutant emission still seriously lag behind the initial criteria on the pollution treatment set in 2011. This means that, compared with the obvious positive effects of economic reform from 2000, the pushing of the Chinese Central Government’s environmental policy from the new century seems to fail.
Further analysis found that industrial pollution is the main source of environmental pollution in China. From 2000 to 2013, gross industrial output value accounts for about 40% of GDP on average, while the proportion of industrial energy consumption in the country’s total energy consumption is more than 62.6%. In 2013, industrial waste water emissions and industrial SO
2 emission were 20.98 billion tons and 18.352 million tons, respectively, accounting for 30.2% of the national total emissions of waste water, and 89.8% of the national total emissions of SO
2 [
2]. Thus, taking industrial development as example, this paper examines the effectiveness of the environmental policy pushed by China’s Central Government, which will be extremely significant for the World Factory to achieve green development.
The remainder of this study is organized as follows.
Section 2 reviews the related literature.
Section 3 outlines the methodology developed in this paper. The data and variables are described in
Section 4.
Section 5 presents the evaluation results and discussion. Finally,
Section 6 concludes this paper.
2. Literature Review: China’s Regional Environmental Efficiency Analysis Based on DEA
Productivity analysis, an important tool of policy effect analysis, can be used to test and analyze the efficiency of inter-regional industrial system, especially to identify the reasons for ineffectiveness of industrial system. It is conducive to both the assessment of the current policy and the formulation of the future policy. In recent years, the environmental efficiency evaluation based on DEA is widely favored by environmental economists interested in China’s environmental performance, due to its unique advantage on the efficiency evaluation for homogeneous decision making units (DMUs) with multi inputs and outputs. In these early studies, traditional DEA models are adopted to measure the environmental efficiency, emphatically discussed the treatment of pollutants, i.e., undesired outputs (Zhou et al., 2008) [
3]. To access the provincial energy efficiency in China, Shi et al. (2010) [
4] proposed a traditional DEA method, which includes energy consumption and undesired output, simultaneously. Bian and Yang (2010) [
5] presented a DEA model with Shannon’s entropy for measuring the aggregated ecological efficiency by using China’s statistics data in 2007. Wang et al. (2013a) [
6] established several DEA window analysis models to measure the environmental efficiency at China’s provincial level from 2000 to 2008. Wu et al. (2014) [
7] developed a novel DEA-based method to evaluate the environmental efficiency of Chinese industry, treating the total emitted pollutants (undesired output) as the fixed value.
As stated by Wang et al. (2013b) [
8], most early studies on China’s environmental efficiency with DEA model are limited to radial method, in which all inputs variables can only be contracted proportionally or all outputs variables can only be expanded proportionally. To get more accurate efficiencies, Wang et al. (2013b) [
8] developed a non-radial DEA method to dynamically analyze the environmental efficiency of 30 provinces in China over the period 1997–2010. Meng et al. (2013) [
9] improved a non-radial DEA approaches to measure the environmental performance in China during 1998–2009, which can make a static and dynamic analysis, simultaneously. Bian et al. (2013) [
10] proposes a novel non-radial DEA-based method to access China’s provincial energy efficiencies, which can further estimate potential slack in both inputs and outputs. Additionally, considering the weak disposability of undesired outputs, Wang et al. (2013c) [
11] proposed a non-radial range-adjusted measure model to evaluate the ecological efficiency of China. At the same time, another type of DEA-based non-radial approach, namely slacks-based measures (SBM), began to attract the interest of environmental economists, since SBM model directly uses the slacks of both inputs and outputs to measure DMU efficiency, and, accordingly, accounts for the possible reduction of inputs and undesired outputs. Therefore, Zhang and Choi (2013) [
12] introduced SBM efficiency in DEA (SBM-DEA) to analyze China’s environmental efficiency during 2001–2010. Wang and Feng (2015) [
13] developed a novel SBM-based method to explore the sources of technological inefficiency and productivity growth in China during 2003–2011. Bi et al. (2015) [
14] employed a SBM-DEA-based environmental efficiency index to probe 30 provinces’ environmental performance in Chinese industry during 2001–2009. Similar to Wang et al. (2013c) [
11], Sueyoshi and Yuan (2015) [
15] incorporated the natural disposability and managerial disposability to measure the China’s provincial performance.
The traditional DEA model, no matter racial base or non-radial base, always treats the provincial industrial production system as a “black box”. Generally, the “black box” DEA model without considering the intermediate process production is regarded as one of the advantages of DEA method. However, due to the complexity of industrial system, ignoring intermediate outputs will not be helpful for identifying the real source of DMUs’ inefficiency. The network DEA, originally proposed by Färe and Grosskopf (1996) [
16], has solved this problem to a certain extent by introducing intermediate outputs within the complex production system. Wu et al. (2014) [
17] divided China’s whole economic system into three sub-systems, namely resource saving and pollution reducing (RSPR), waste reusing and resource recycling (WRRR) and pollution controlling and waste disposing (PCWD), and found that the efficiency of RSPR system was obviously lower. To further characterize the internal relations of the industrial system, Wu et al. (2015a) [
18] proposed the two-stage DEA additive efficiency model to evaluate the efficiency of China’s provincial industrial production and pollutant treatment by dividing the entire production system into production subsystem and waste disposal subsystem. Wu et al. (2017) [
19] further developed a novel two-stage DEA model for sustainable production system. In Wu et al. (2017) [
19], not only the production waste is treated as intermediate undesired output, but also the recyclable material treated by waste disposal sub-system can then be put into the pre-production sub-system, in order to save the input of the production sub-system. Further, Bian et al. (2015) [
20] and Wu et al. (2015b) [
21] introduced the two-stage model to evaluate the efficiency of the provincial production sub-system and emission reduction sub-system.
Clearly, the two-stage DEA models mentioned above open the “black box” by dividing the whole system into two sub-systems, which will be helpful for identifying the real reason for inefficiency or ineffectiveness of the whole system. However, these two-stage DEA efficiency analyses have generally ignored a basic fact that, for a long time, China’s local government priorities industrial production while neglecting pollution treatment. The fact implies that unlike the equal relationship between the two stages shown in the current DEA models, there is a certain leader–follower relationship within China’s industrial production sub-system and pollution treatment sub-system. To this end, this paper, based on Li et al. (2012) [
22] and Liang et al. (2008) [
23], proposes a novel two-stage DEA model with non-cooperative game considering the intermediate undesired output and subordinate relationship between industrial production sub-system and pollution treatment sub-system. Using the novel two-stage DEA model, this paper carries out the efficiency analysis for the two sub-systems using production and environmental data of 30 provinces in China, and finally to evaluate the effectiveness of the Central Government’s environment policy. The contribution of this paper lies in: (1) In this paper, we first notice the leader–follower relationship between the industrial production stage and the pollution treatment stage in China’s industrial system, building the novel DEA model with non-cooperative game to analyze the environmental efficiency, and further expand the evaluation of the environmental policy pushed by the Central Government; (2) Empirical analysis results show that, although generally the environmental policies of the Central Government could not really solve the internal contradiction in the economic and environmental system, they indirectly promote the diffusion of environmental control technology among the Eastern, Central and Western areas, which is conducive to the coordinated development among areas.
4. Data and Variables
Since entry into the WTO in 2002, China has faced the big dilemma that large scale FDI flushed into China’s market with potential severe environment pollution. Therefore, from 2003, China’s Central Government issued a series of environment polices to promote balanced development between economy system and environment system (see
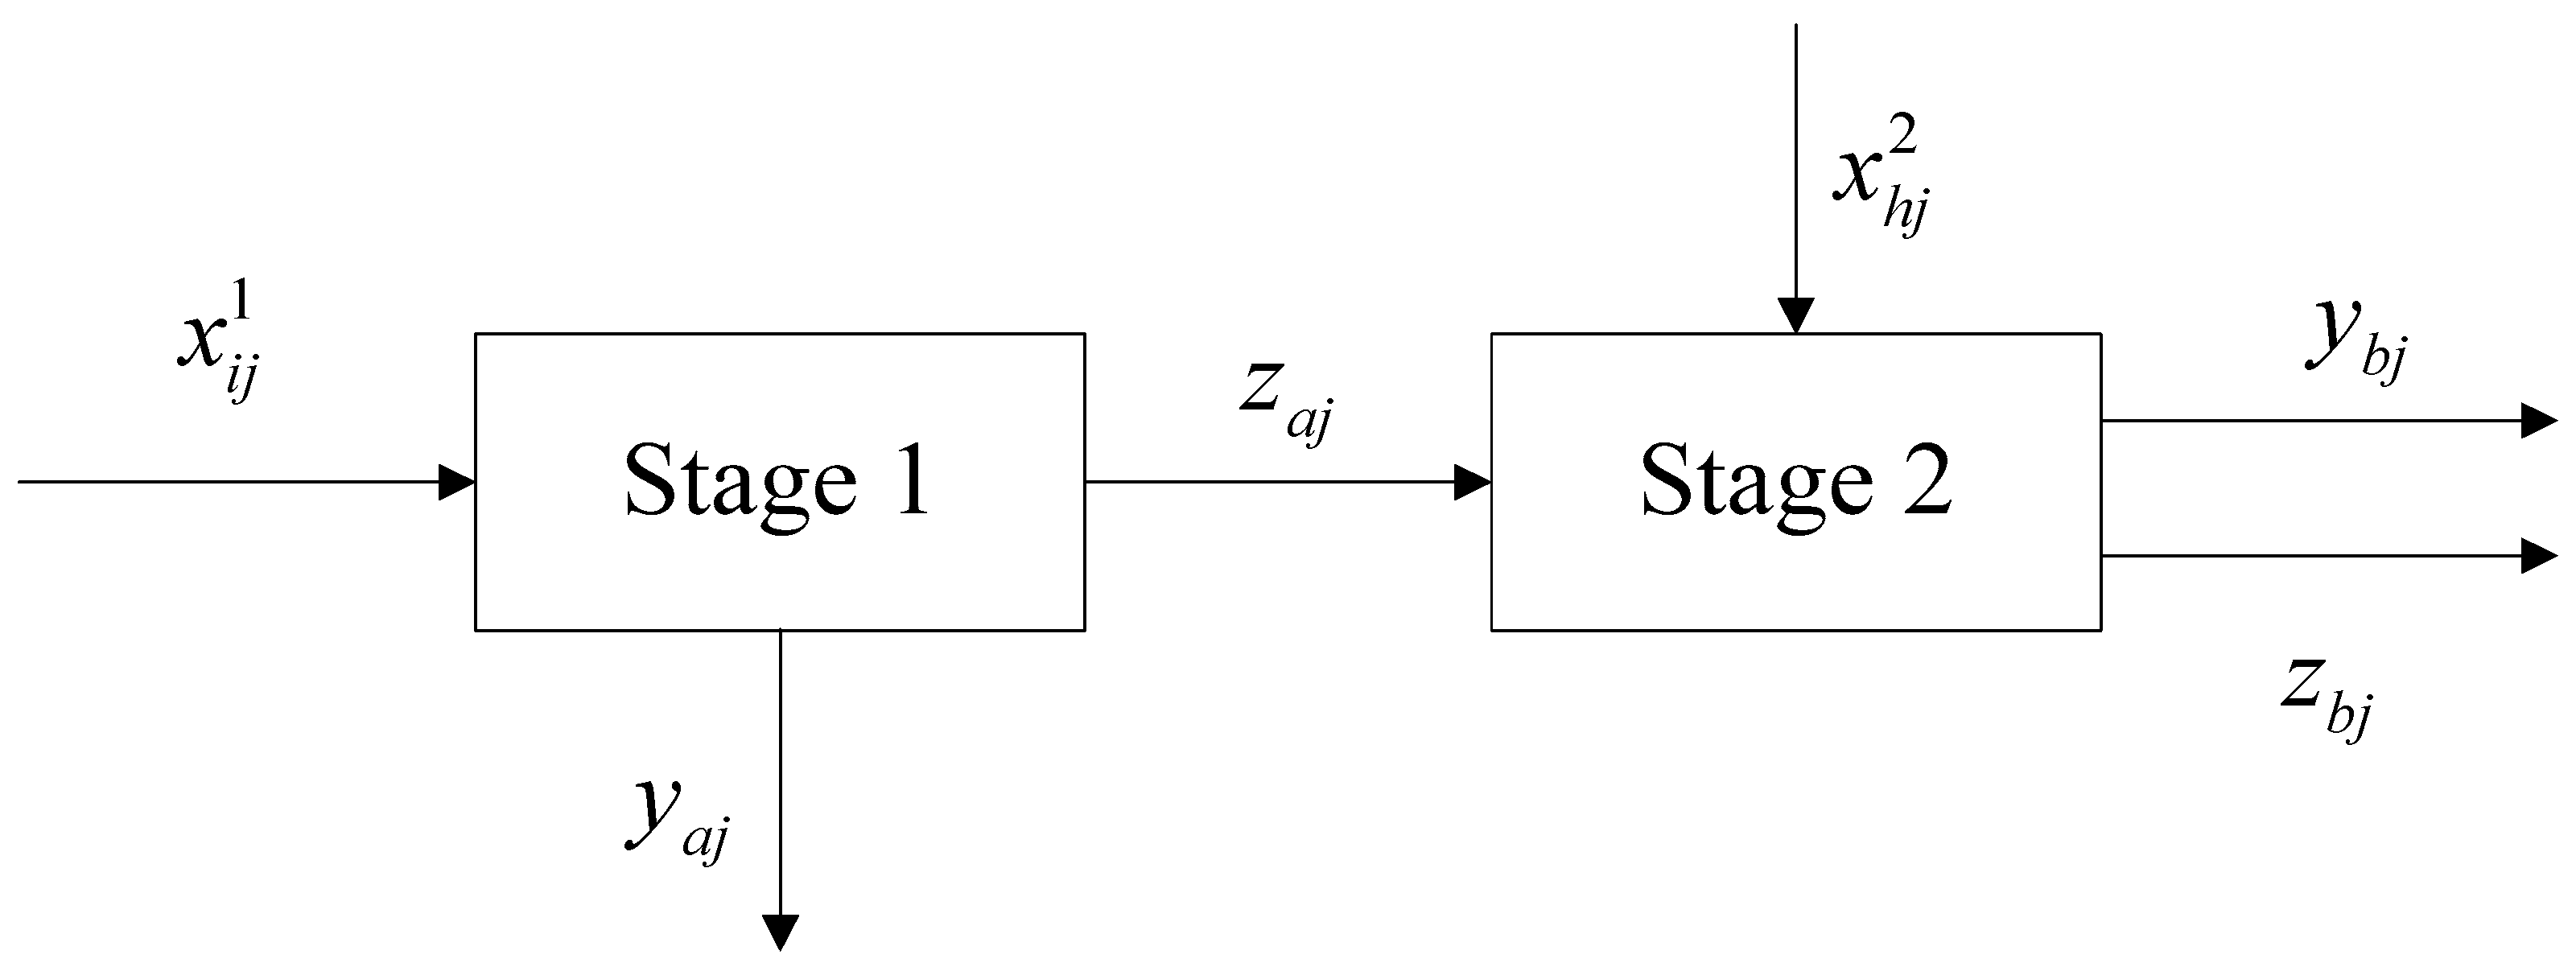
Appendix A). To check the effectiveness of such environment policy, we collect the economic data and environmental data of 30 provinces and municipalities in China during 2003–2012. In this paper, the provincial economic process is divided into two stages, the industrial production sub-system (Stage 1) and the pollution treatment sub-system (Stage 2), as shown in
Figure 1. Industrial production sub-system consumes a certain amount of resources (such as labor, capital, energy and water resources) to produce the desirable output (such as GDP) as well as undesirable output (such as a variety of pollutant emissions). Pollution treatment sub-system mainly aims at dealing with undesirable outputs produced by the industrial production subsystem, which consumes a certain amount of resources (such as investment of pollution treatment) to make all kinds of pollutants into recyclable resources or to meet national discharge standards. The descriptive statistics of 30 observations are reported in
Table 1.
All data are from “China Environmental Statistics Yearbook” (2004–2013) [
26], “China Statistical Yearbook” (2004–2013) [
27] and Statistical Yearbook of the related provinces and cities (2004–2013) [
28]. Indicators related to price factors, such as investment of industrial pollution treatment and GDP are calculated according to the relevant price index in 2003 as the base year for the deflator.
In order to facilitate the regional analysis, according to Bian et al. (2015) [
20], 30 samples are designated as the Eastern, Central and Western areas, as shown in
Table 2. The Eastern are includes coastal provinces and municipalities, which is China’s most developed areas and has the highest degree of industrialization, and its industrial GDP accounted for 2/3 in the whole country. The Central region is composed of 10 inland provinces, mainly in agriculture and low-end processing and manufacturing. The Western are is the least developed region in China, with the lowest degree of industrialization.
5. Result Analysis
5.1. Comparison of Pollution Treatment Efficiency in the Two Models
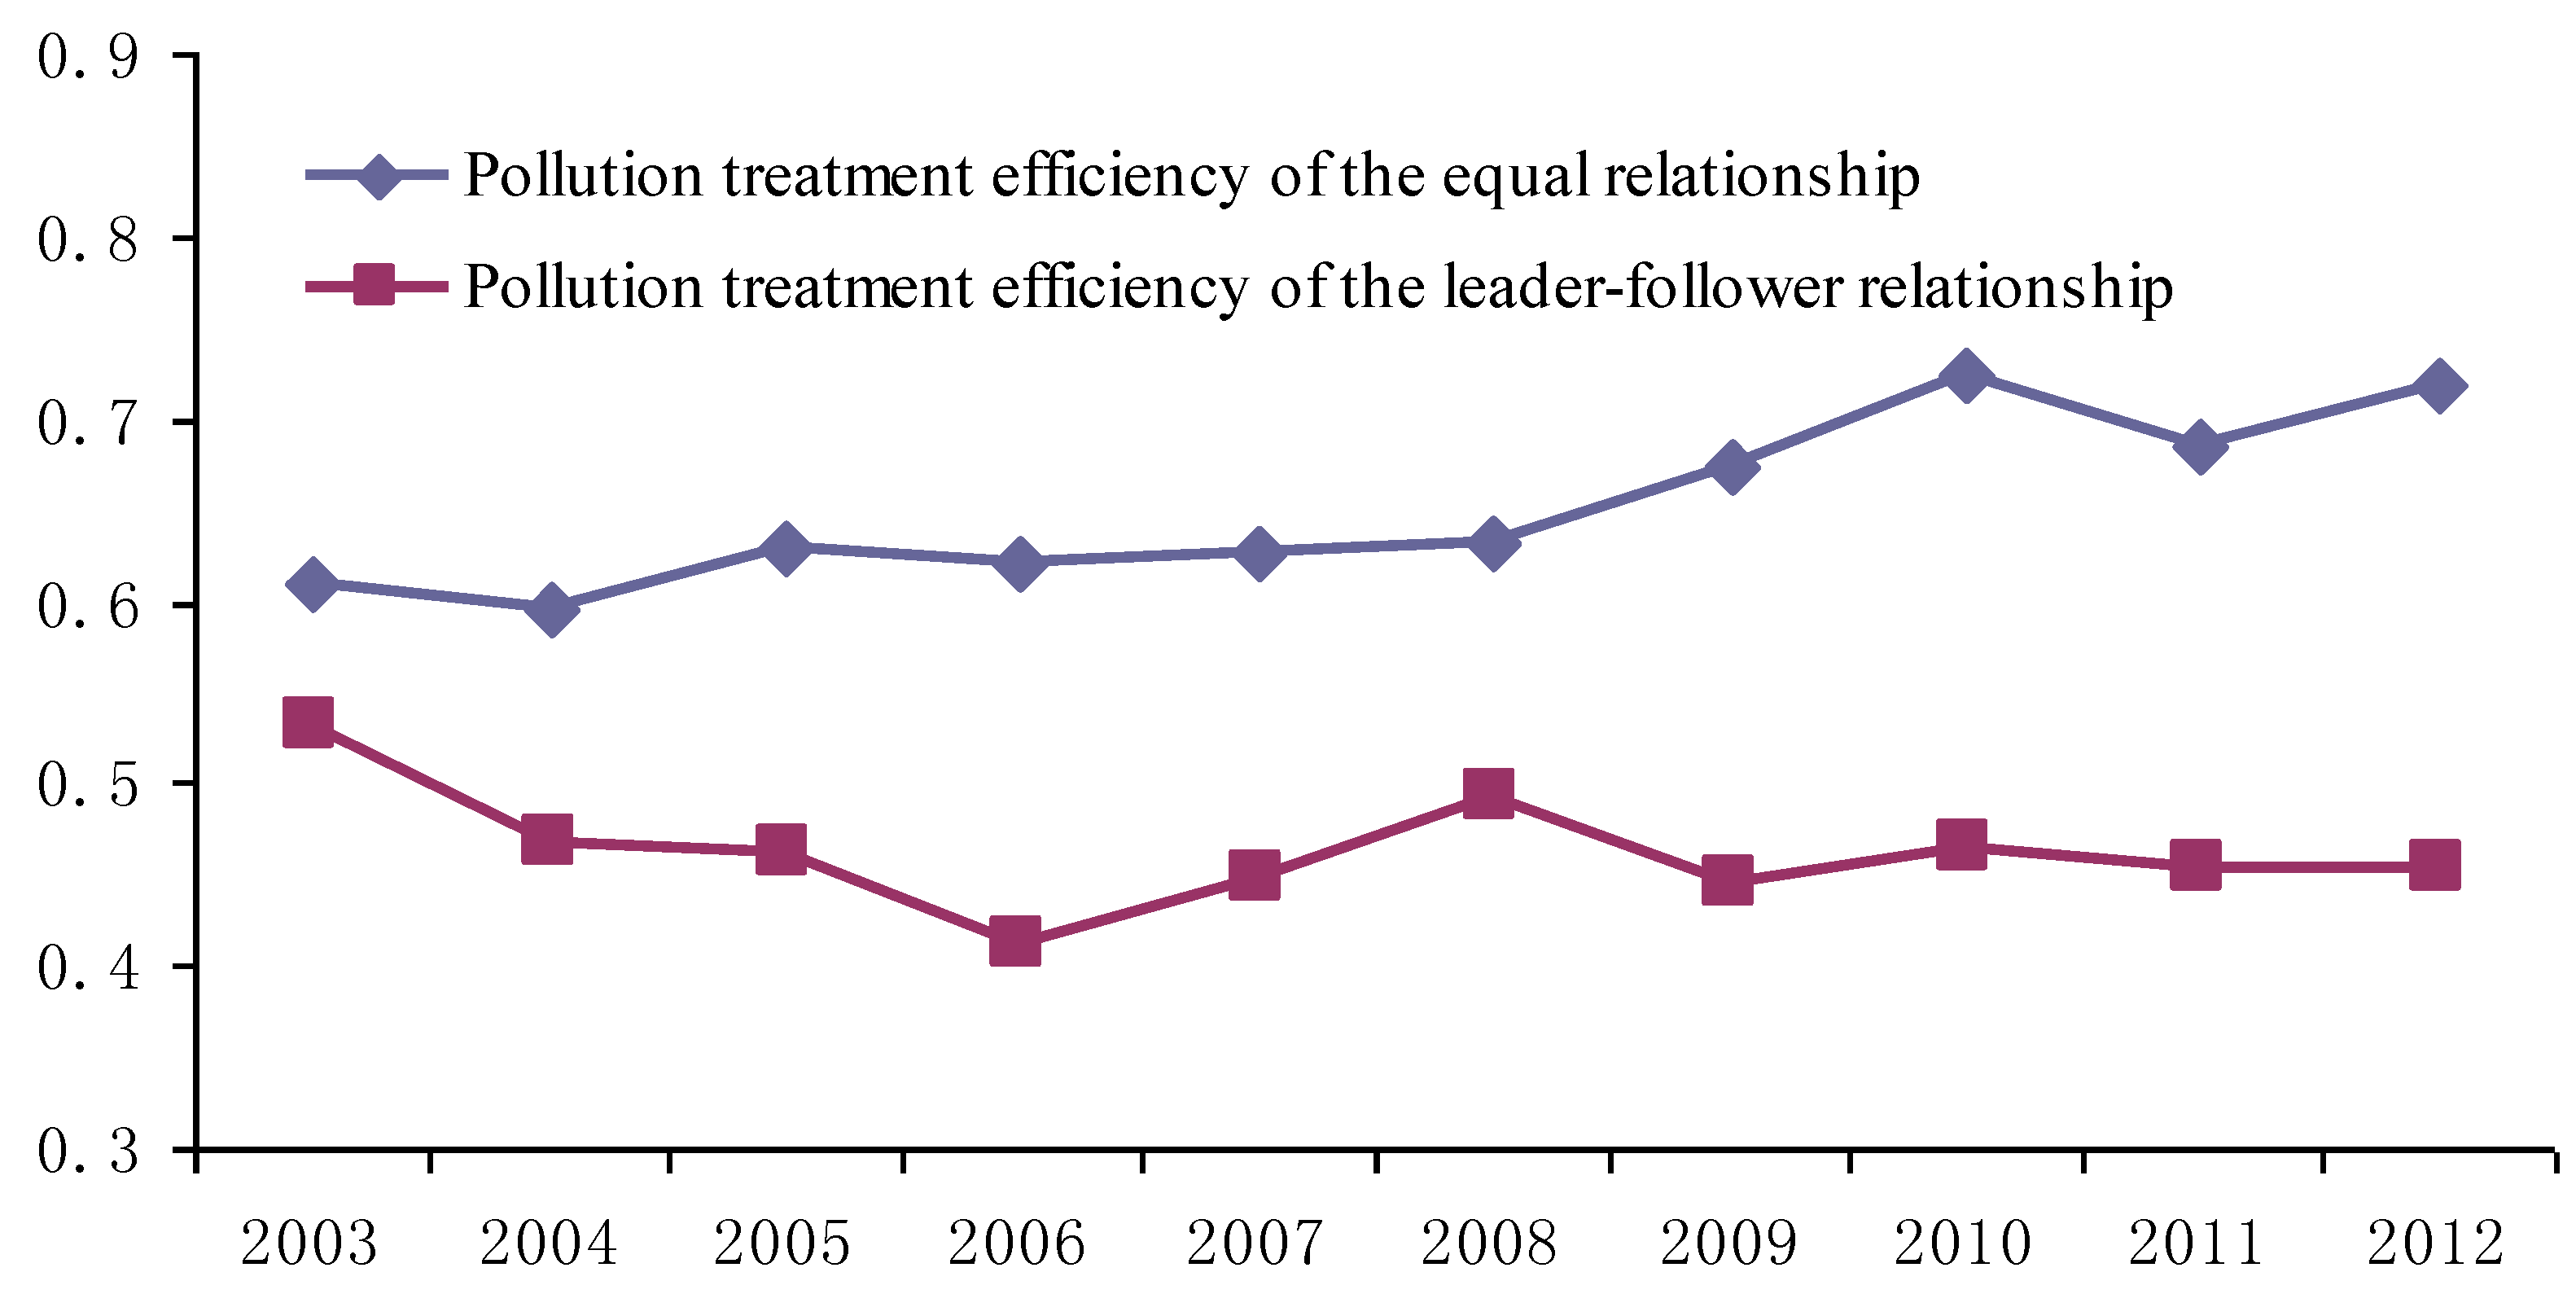
The traditional two-stage SBM-DEA model treats the two stages independently, while in this paper, the non-cooperative game SBM-DEA model considers the potential leader–follower relationship between the two stages. In Models (2)–(4), the efficiency of industry production stage (Stage 1) will first be optimized, and then the efficiency of pollution treatment stage (Stage 2) can be optimized by keeping the efficiency of Stage 1 unchanged. Comparing the traditional SBM model with non-cooperative game SBM model, we can find that the efficiency of Stage 1 will keep the same, while the efficiency of Stage 2 is different, as illustrated in
Figure 2.
Figure 2 shows that the pollution treatment efficiency in our model is obviously lower than that in the traditional “black box” model, in which the stage of pollution treatment is evaluated independently. Even compared with results considering two-stage with equal relationship in Wu et al. (2015a) [
18], Bian et al. (2015) [
20] and Wu et al. (2015b) [
21], the pollution treatment efficiency in our model is still relatively lower. Moreover, these two trends are opposite to each other, meaning that the pollution treatment efficiency became worse.
The possible reason lies in two aspects: the new model used and the reality in China. Firstly, the two-stage DEA model with non-cooperative game in this paper firstly optimizes the efficiency of the first stage (industrial production sub-system), then, to optimize the efficiency of the second stage (pollution treatment sub-system), keeping the first stage’s efficiency unchanged. That is to say, the optimization of the second stage will suffer additional constraint conditions than that in traditional DEA model. More constraint conditions will undoubtedly narrow the feasible region, which lead to the lower efficiency in this paper than that in traditional DEA model. Secondly, the Central Government in China launched a new round of investment to stimulate the economic growth after 2008, including “Four Thousand Billion” and “Ten Industrial Revitalization Planning”. To fend off the Asian financial crisis, this huge investment planning is mainly used to expand the industrial capacity and to boost employment, excluding the development of cleaner production technology. In spite that the Ministry of Environmental Protection (MEP) also increases the investment of industrial pollution treatment during the same period, the amount is very small relative to the scale of investment in economic growth. What is worse, the investment from MEP focuses on increasing the waste treatment facilities, rather than on R&D for pollution abatement.
Figure 2 also shows that ignoring the leader–follower relationship between the industrial production sub-system and the pollution treatment sub-system will lead to overestimation of both the efficiency of pollution treatment stage and the overall efficiency of the whole industrial system. Compared with the traditional model, the pollution treatment efficiency in this paper is more accurate and more realistic. Therefore, it is believed that such the non-cooperative game SBM-DEA model can provide more accurate decision information for decision makers, and, accordingly, help to find the main sources of the inefficiency that arises from the internal stages within the whole industrial system.
5.2. Comparison between Pollution Treatment Efficiency and Industrial Production Efficiency
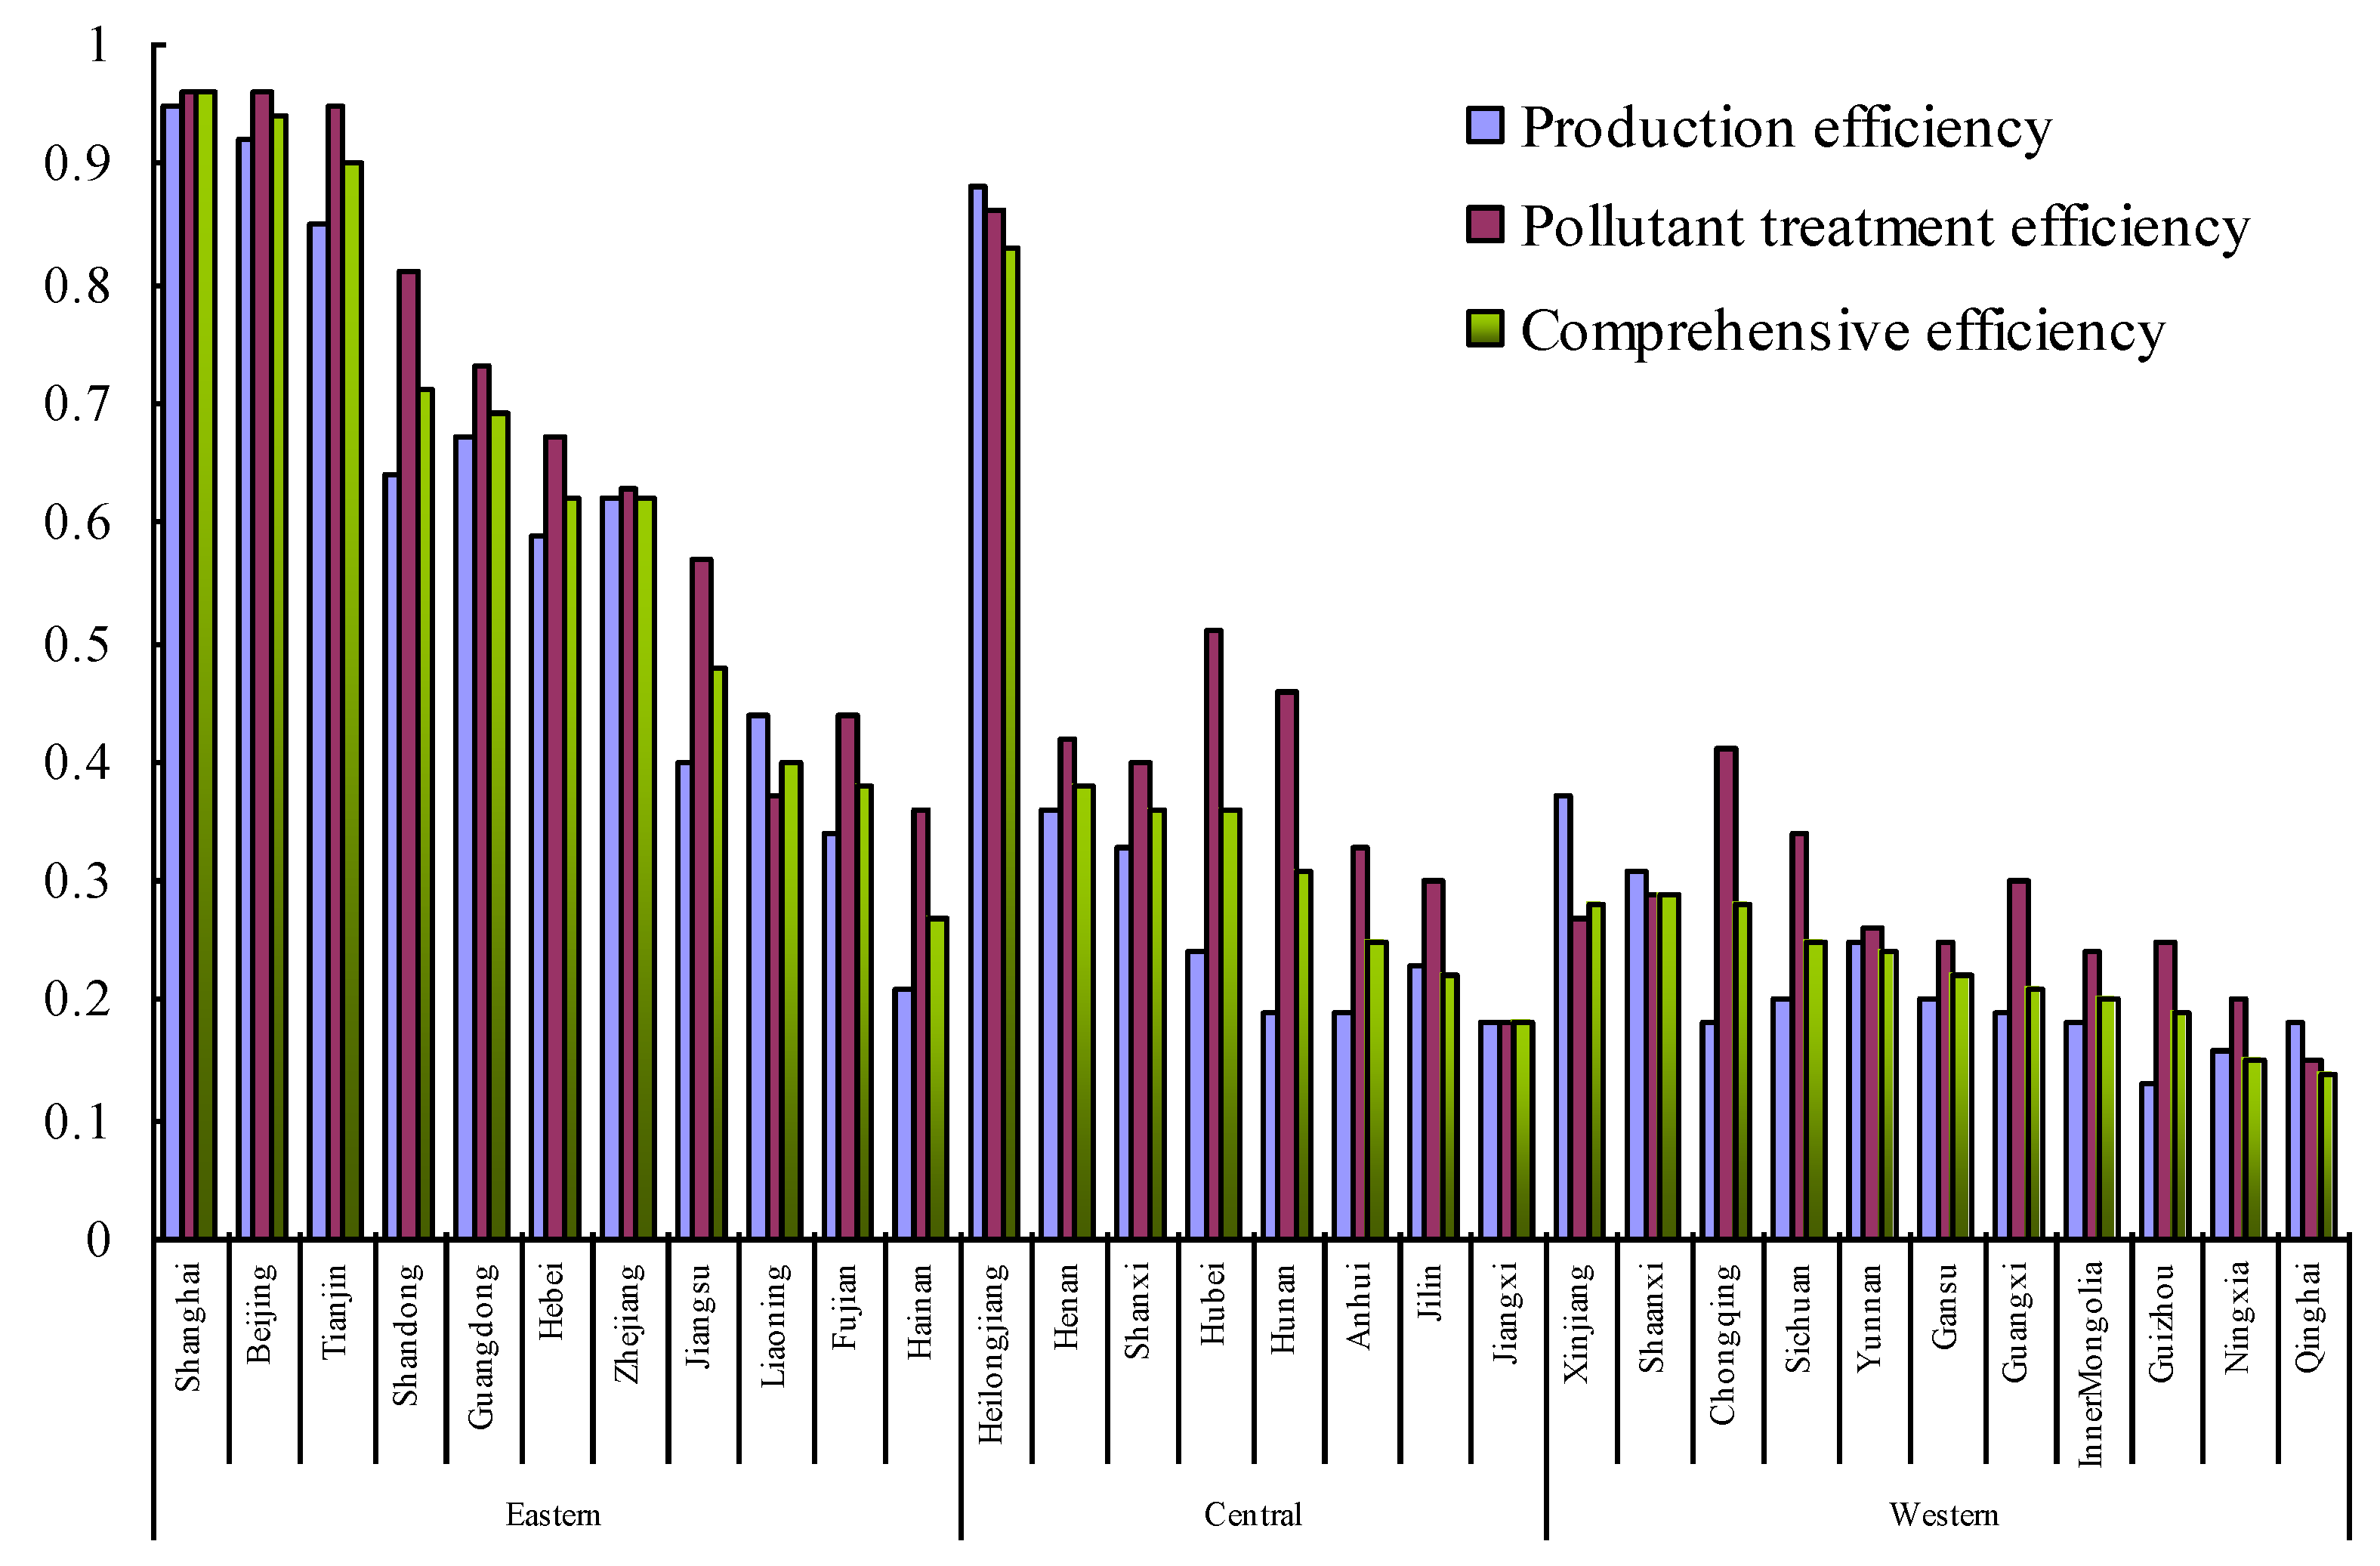
Comparing the three types of efficiency in the study period of various provinces and cities, it is found in
Figure 3 that except for five provinces (Liaoning, Heilongjiang, Shaanxi, Qinghai, and Xinjiang), the other provinces see their pollution treatment efficiency higher than their industry production efficiency. This result is outstanding because the non-cooperative game model considering the leader–follower relationship in this paper first optimizes the industry production efficiency, and then optimizes the pollution treatment efficiency. Theoretically, industry production efficiency should not be less than the pollution treatment efficiency. However, the results of this paper show that the pollution treatment efficiency is higher than the industry production efficiency, meaning that the Central Government’s environmental regulation policy has a better policy effect, compared with its industrial development policy.
Our findings are contrary to the conclusions of Wu et al. (2015a) [
18] and Bian et al. (2015) [
20], but support the view of Zhang and Choi (2013) [
12] and Wu et al. (2014) [
17]. In Wu et al. (2015a) [
18] and Bian et al. (2015) [
20], two-stage DEA models are also used to evaluate the efficiencies of production sub-system/stage and disposal sub-system/abatement stage. Unlike the leader–follower relationship in this paper, the two sub-systems/stages in their studies are treated equally, and their results showed that regional industrial systems exhibit much higher average efficiency in the production sub-system/stage than that at the disposal sub-system/abatement stage.
According to values of comprehensive efficiency, we can also identify the coordination between industry and environment in different provinces. The average comprehensive efficiency in some provinces and municipalities is more than 0.90, such as Shanghai, Beijing, and Tianjin. These provinces have both higher pollution treatment efficiency and higher production efficiency, meaning that their industrial production and the environmental protection are coordinated good. For Heilongjiang, Shandong, Guangdong, Hebei, and Zhejiang, the average comprehensive efficiency ranges between 0.60 and 0.89, indicating relatively coordinated. The average efficiency values of the remaining 22 provinces are below 0.50, meaning that industrial production and environmental protection are poorly coordinated.
More than 70% of provinces in China are badly coordinated, which deserves close attention from the provincial policy makers. Note that the poorly coordinated provinces mainly locate in the Central and Western areas, where industry is historically undeveloped. For these areas, if their policy makers blindly pursue industrial growth, they are bound to fail in environmental protection. The reasons lie in that, on the one hand, they need to face plenty of industrial competitions from the East developed area, while, on the other hand, they must obey the same environmental regulations from the Central Government, simultaneously. Therefore, they need to rebalance the industrial strategy and environmental protection, and try to seek a localized and differentiated strategy to achieve green development, such as developing high technology-intensive industry or high value-added service.
5.3. Time Trends and Spatial Distribution of Two Types of Efficiency
Using the calculation results of Models (2)–(4), we can be further obtain the efficiency of the Eastern, the Central and the Western areas of the each year, as well as the national average industry production efficiency and pollution treatment efficiency, as shown in
Figure 4,
Figure 5 and
Figure 6.
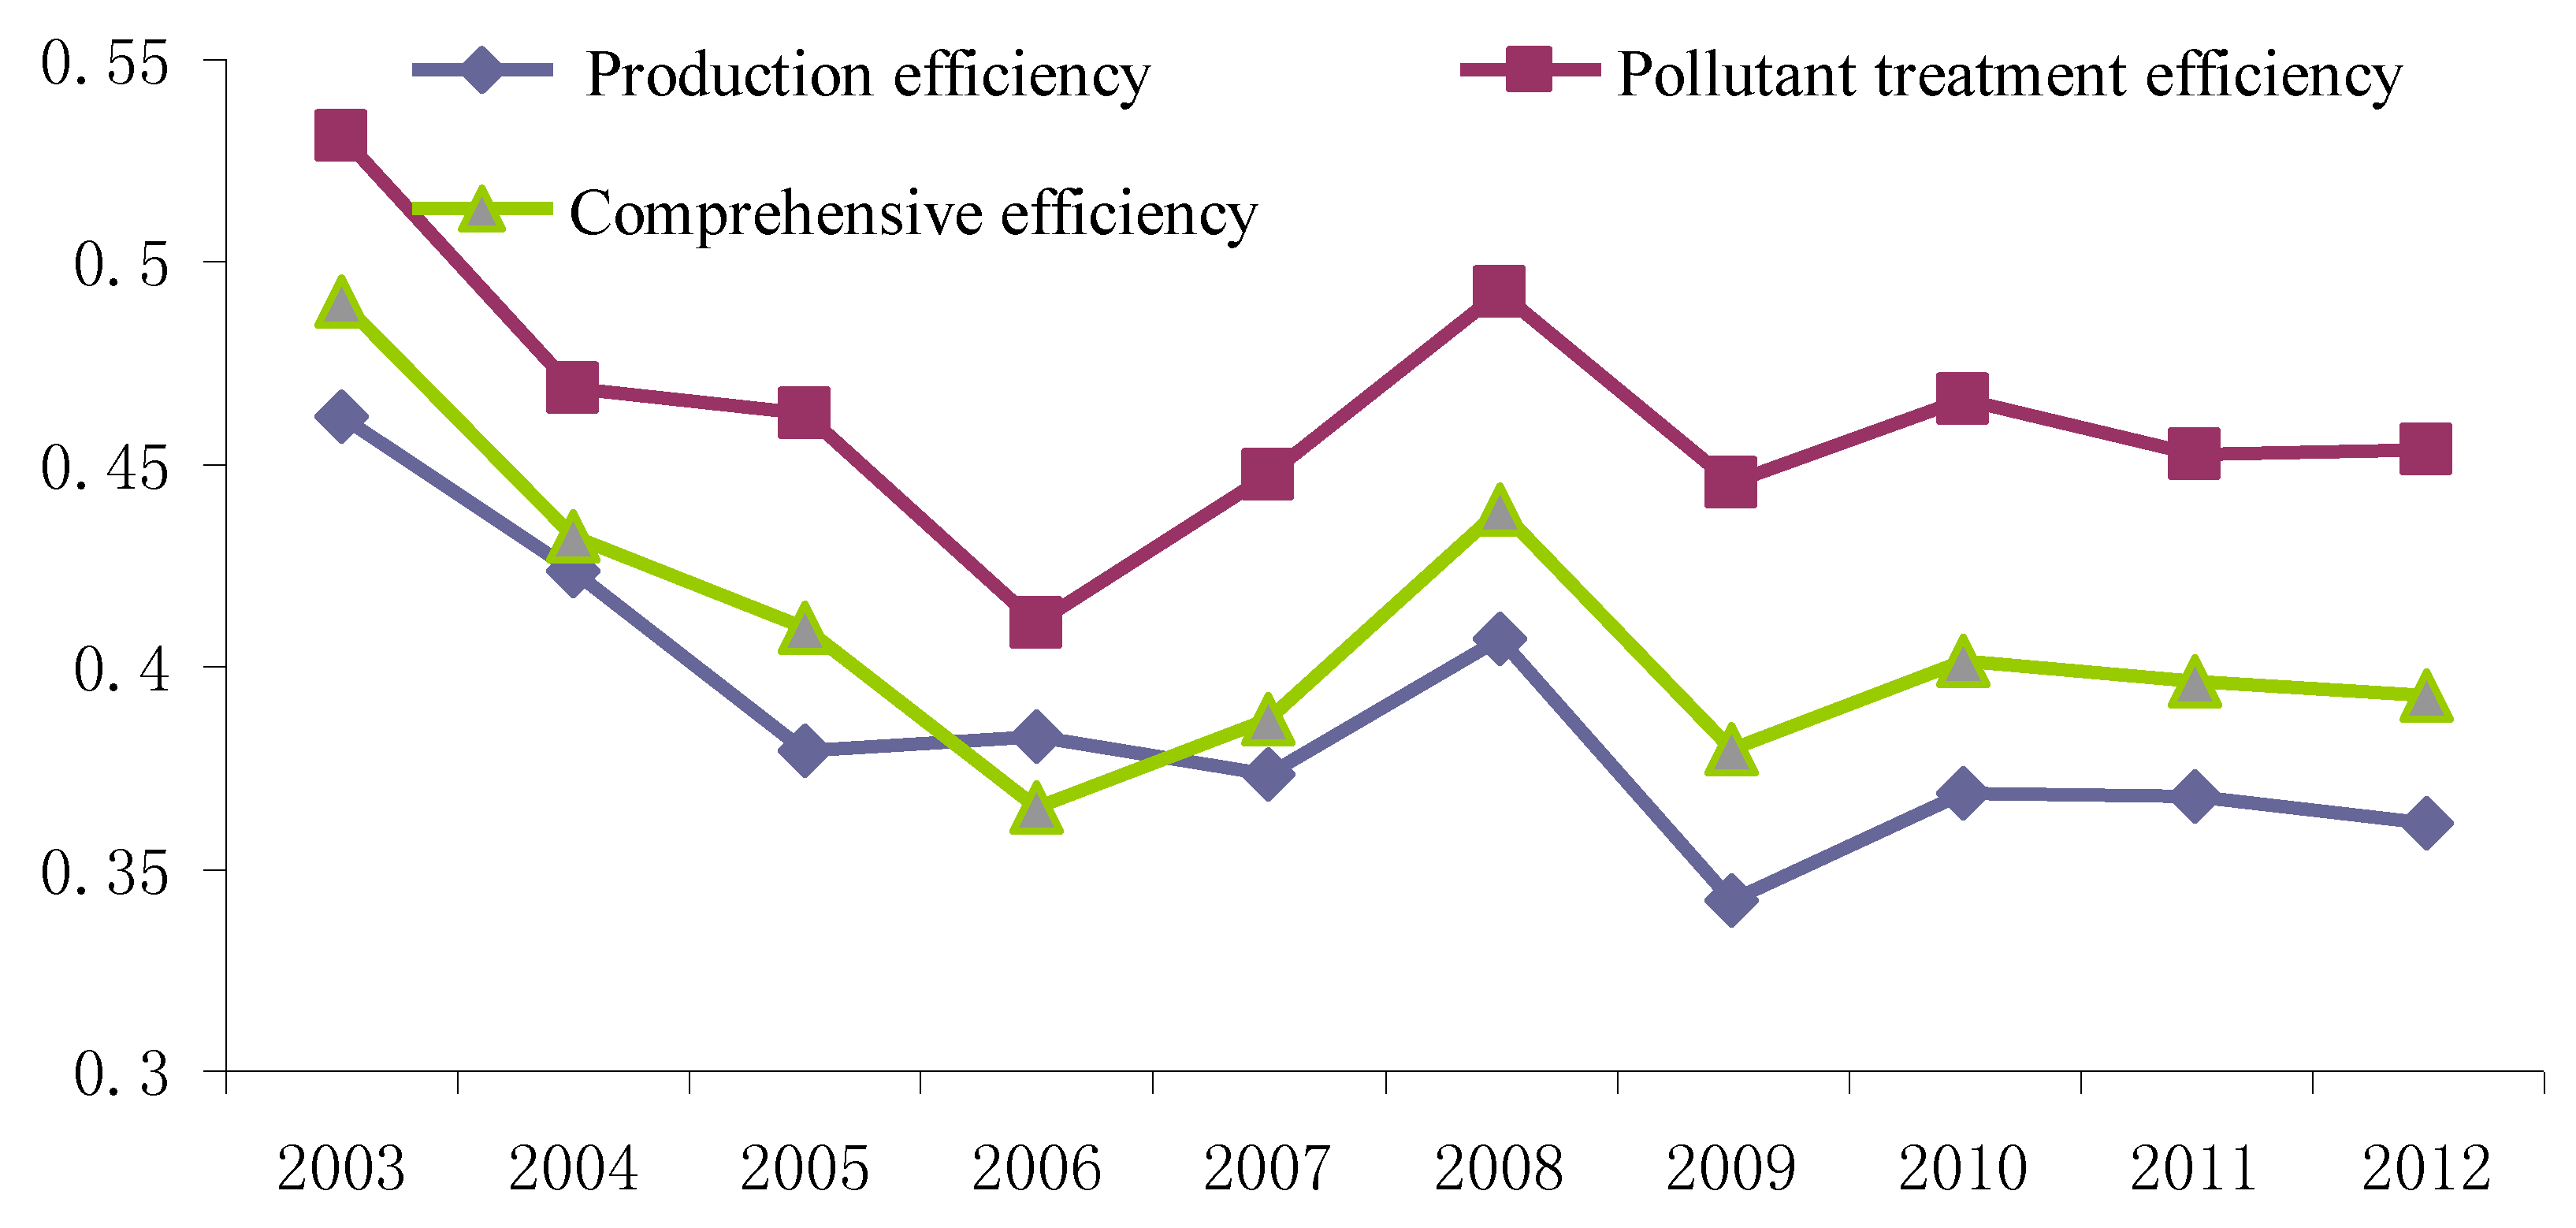
Figure 4 shows that, in general, the national average of three kinds of efficiency is significantly lower, consistently showing the overall decline trend. Moreover, the national average pollution treatment efficiency is generally high, the industry production efficiency is the lowest, and the comprehensive efficiency locates between the two kinds of subsystem efficiency. In terms of efficiency change trend, this paper shows an opposite change trend to Shi et al. (2010) [
4], Meng et al. (2013) [
9] and Wang et al. (2013a, 2013b) [
6,
8]. However, since Wang et al. (2013c) [
11] only evaluated the trend from 2006 to 2010, the findings in this paper partly support their results regarding both production efficiency and emission efficiency. At least, there exists two main differences in these two researches: (1) three kinds of efficiencies in this paper are quite lower than those in Shi et al. (2010) [
4], Meng et al. (2013) [
9] and Wang et al. (2013a, 2013b, 2013c) [
6,
8,
11]; and (2) in Wang et al. (2013c) [
11], the production efficiency is much higher than pollution emission efficiency, while the industrial production efficiency is the lowest in this paper. These differences can be mainly attributed to different DEA technology and the two-stage leader–follower relationship treated in this paper.
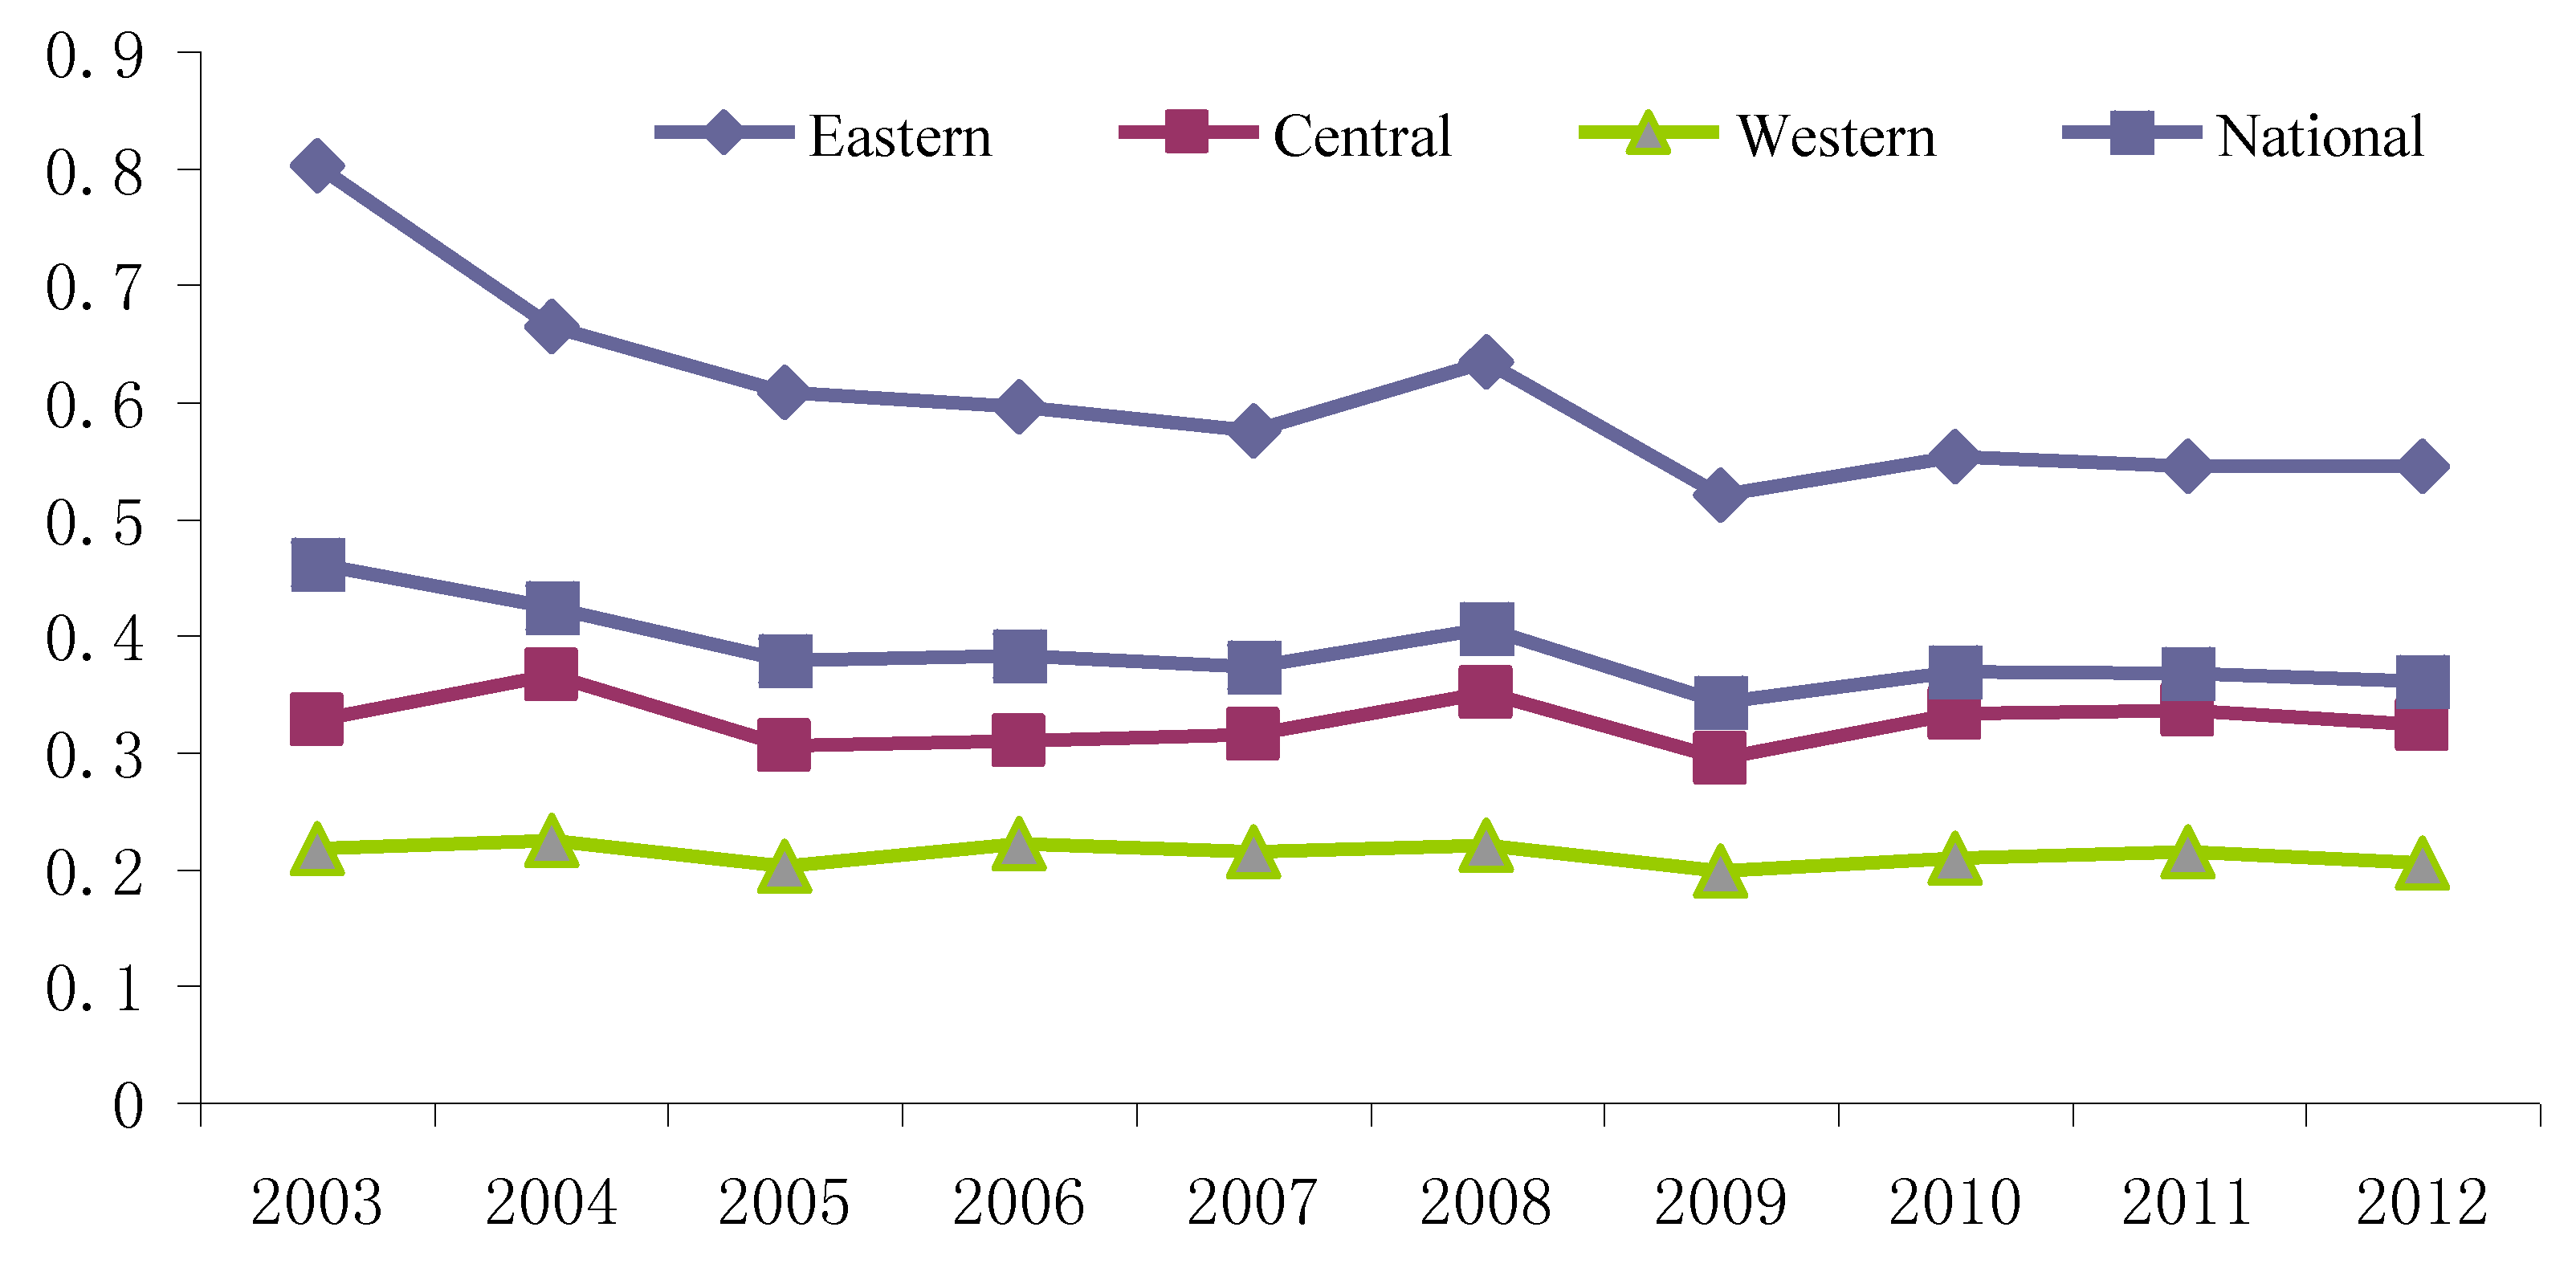
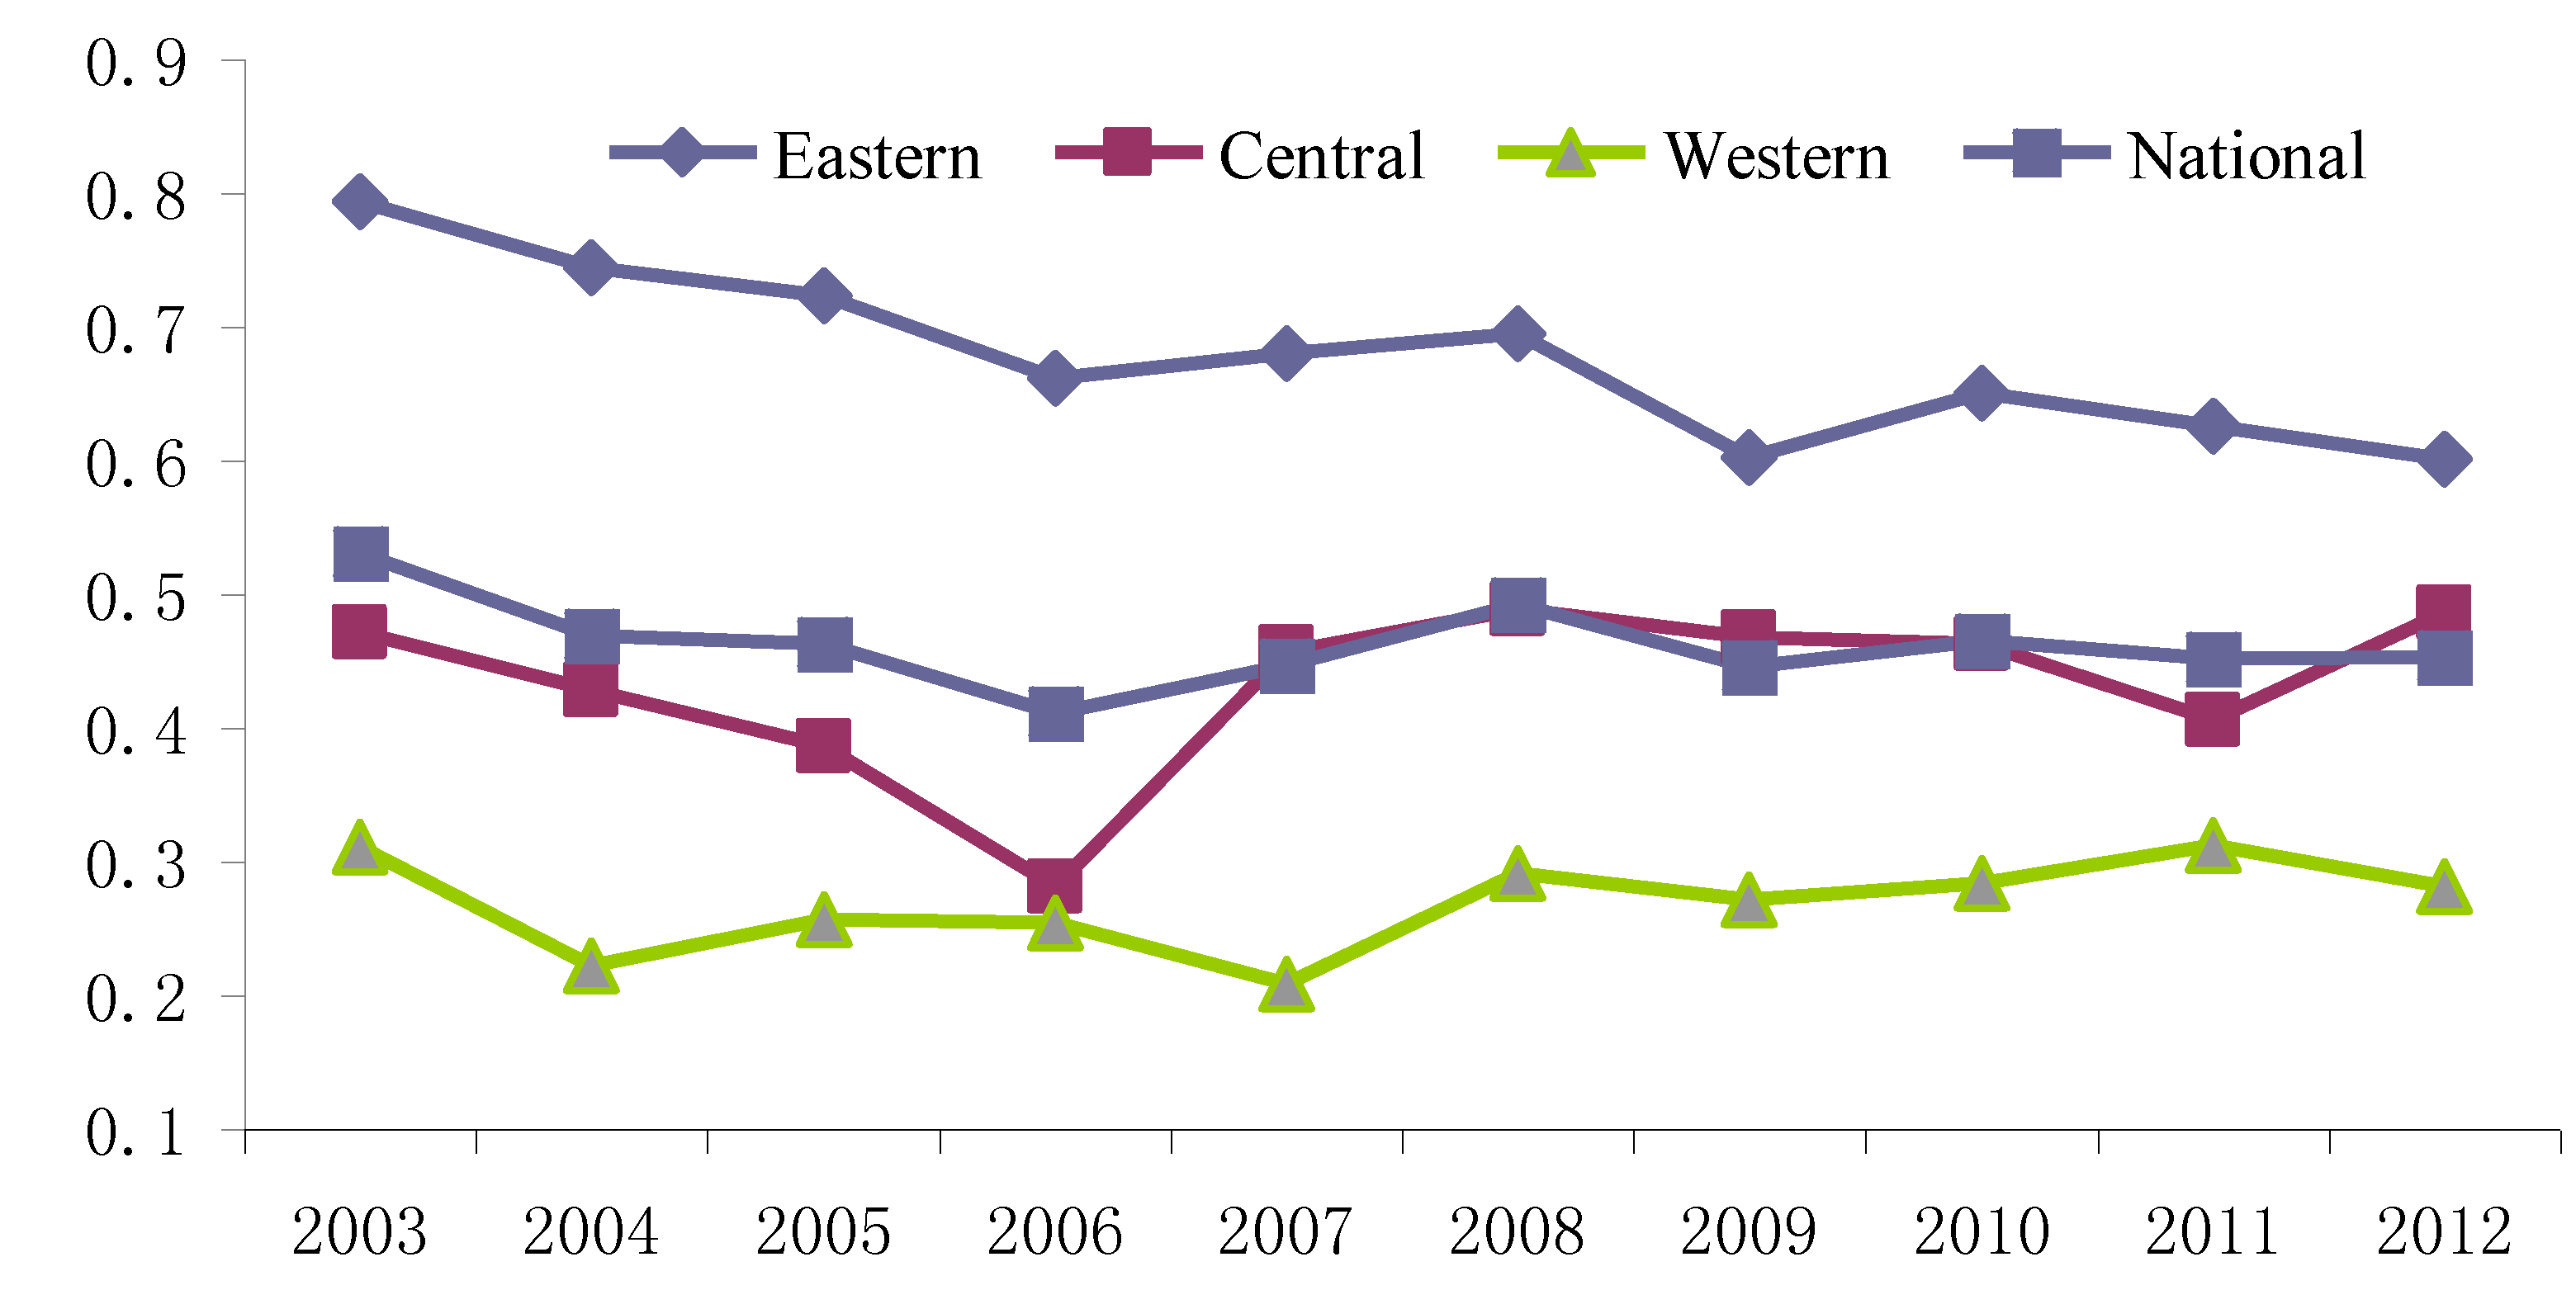
Figure 5 and
Figure 6 show that, during the evaluation period, in terms of both pollution treatment efficiency and industrial production efficiency, efficiency of the Eastern area was significantly higher than that of the Central and the Western areas, but its downward trend is very obvious as well. However, the efficiency of the Central and Western areas remains relatively stable, which together results in a slight downward trend in overall national average comprehensive efficiency. On the contrary, with traditional “black box” DEA model, the environmental efficiency in China in Wang et al. (2013a, 2013b) [
6,
8] experienced an increasing process over the study period. Even with the equal relationship in two-stage DEA model, Wu et al. (2015b) [
21] also concludes that the integrated efficiency of energy saving and emission reduction of China was relatively stable from 2006 to 2010. The comparison mentioned above shows that the two-stage DEA model with non-cooperation game can provide more detailed information for decision makers.
In addition, compared with the pollution treatment efficiency, the industrial production efficiency of the Eastern shows a more dramatic downtrend, especially after 2008. As we know, the economic growth after China’s entry into WTO mainly depends on the fiscal investment, exports and consumption expanding, which is always called “triga” in China. However, due to the Asian financial crisis from 2008, the international consumption market has been shrinking, which influences China’s export greatly. Therefore, the Central Government has to expand the huge fiscal investment in infrastructure projects and the heavy chemical industries among provinces. For any province, it is almost impossible to quickly convert such huge investment into real productivity, which unfortunately results in a sharp downtrend in industrial production efficiency.
Contrarily, despite the industrial production efficiency in the Central and the Western areas being at a low and stable level, the pollution treatment efficiency in these areas shows a slight uptrend. These results show that when the national industrial production efficiency fell sharply, its pollution treatment efficiency has been stably rising, especially after 2006. This finding completely confirms the conclusion in Wu et al. (2015b) [
21] in term of pollution treatment efficiency. Actually, since the beginning of 2006, China’s Central Government introduced a series of environmental laws and regulations, such as the “Renewable Energy Law”, “Energy Conservation Law”, “Water Pollution Prevention Law” and others; especially the formal establishment of the Ministry of Environmental Protection (MEP) in 2008, further strengthen the efforts of the national pollutant treatment, which has greatly promoted the pollution treatment efficiency at the province level. It is hard to image what would happen if the Central Government only launched a new stimulation on economic growth without strengthening the environmental protection.
5.4. The Source of Inefficiency for Industrial Production Sub-System and Pollution Treatment Sub-System
With the SBM model, the inefficiency value of the input/output variables can be calculated and their sources of the inefficiency can be identified with Models (2)–(5).
Table 3 shows the inefficiency of the industrial production sub-system and pollution treatment sub-system of three areas in China.
In
Table 3, the inefficiency values of the desired output in the industrial production sub-system and the pollution treatment sub-system are small, where the inefficiency value of industrial GDP in the industry stage (
) is 0 for the Eastern, Central and Western reasons. On the contrary, inefficiency values of inputs and undesired outputs are large, as Wang and Feng (2015) [
13] stated. This phenomenon fully indicates that the low efficiency of the industrial production is mainly caused by the inefficiency of inputs and undesired outputs, such as excessive resource investment and backward production technology. Similarly, in the sub-system of pollution treatment, the over investment in industrial pollution (
), pollutant abatement facilities (
), as well as the amount of SO
2 generated (
) is relatively large, while the amount of industrial solid waste generated (
) and industrial waste water emissions (
) are small. This phenomenon indicates that, on the one hand, compared with the final emission meeting the emission standard, the total investment in the sub-system of pollution treatment is relatively surplus, while, on the other hand, the structure of pollution treatment investment is not balanced. Specifically speaking, industrial solid waste and industrial waste water can be treated well, but effective treatment of SO
2 lacks seriously. In recent years, with increasing haze in China, Chinese government hungers for more investment in controlling air pollution, i.e., PM
2.5 and PM
10, which partly supports the view of Bi et al. (2015) [
14]. Finally, in term of areas, this situation is generally more serious in the Central and Western than in the Eastern, confirming the findings in
Section 5.2. The Central and Western areas see less coordination between their economic development and environmental protection.
5.5. Technology Gap Analysis
To further analyze the reasons for the differences between industrial production efficiency and pollution treatment efficiency in the Eastern, Central and Western regions, this paper also conducts technology gap analysis. Based on Donnell (2008) [
29], 30 provinces and municipalities are first divided into three groups, namely the East, the Central and the West, as shown in
Table 2. In each group, we can define the group-frontier and then get the group technical efficiency (
). For all regions, 30 provinces and municipalities can also identify a meta-frontier, which can be used to compute a meta technical efficiency (
). For each province and municipality (
), technology gap ratio (TGR) can be defined as
(
), representing the distance between the group-frontier and the meta-frontier, and
. Greater values of TGR mean that the group-frontier is closer to the meta-frontier, and, therefore, the difference between the group frontier technique and the meta frontier technique is smaller.
Table 4 and
Table 5, respectively, display the efficiency of the industrial production sub-system and the pollution treatment sub-system in the Eastern, Central and Western areas under the meta-frontier and group-frontier as well as the technical gap among them. It can be seen that, for both industrial production efficiency and pollution treatment efficiency, the TGR of the Eastern area is much greater than that of the Central and Western areas; meanwhile, that of the Central area is significantly better than that of the Western area, indicating that the technical differences among the Eastern, Central and Western areas are distinctive. Among them, the TGR values for the two kinds of efficiency in the Eastern are are both close to 1, meaning that the technical level of the Eastern represents the highest one in the country. Therefore, the Central and Western areas still need to further introduce advanced technology, and strive to undertake industrial transfer from the Eastern area to promote industrial and technological upgrading in the future.
Further comparison of the TGR between the two kinds of sub-system shows that, concerning the pollution treatment sub-system, the average value of TGR for the Central area is quite close to that of the Eastern area, while concerning the industry production sub-system the difference is quite distinctive. It can be implied that, unlike the dramatic difference of industry production technology between the two areas, difference of pollution treatment technology between them is not obvious.
In addition, it should be noted that during the study period, for the Eastern area, the technical gap of the two sub-systems remains relatively stable, while for the Central and Western areas, it shows a clear uptrend, especially after 2006. Moreover, the rising speed in the trend of the pollution treatment sub-system is obviously faster than that of the industrial production sub-system. The results means that during 2003 to 2012, on the one hand, advanced industrial production technology and pollution treatment technology continue to be promoted and popularized all over the country, while, on the other hand, thanks to the Central Government’s environmental policy, the promotion and application of pollution treatment technology is significantly faster than the transferring of industrial production technology based on market behavior. It can be noted that although the environmental policies of the Central Government could not completely solve the contradictions between the economic development and environmental protection, they indirectly promote the diffusion of technology of pollution treatment, which is conducive to the coordinated development among the Eastern, Central and Western areas.
6. Conclusions and Policy Recommendations
Since the adoption of the reform and opening-up policy in the 1980s, stimulating inter-provincial economic competition has always been one of the most important strategies to promote economic growth for China’ Central Government. Unfortunately, due to the local governments’ excessive preference on economic development, many environment protection policies pushed by the Central Government seem to have backfired at the province level for a long time. Even after China’s entry into WTO, such a situation sees little change when facing a possible “pollution heaven”. For provincial policy makers, the mode of “first pollution, then treatment” is potentially supported in many industries, and the leader–follower relationship between the economic production and environmental protection does exist. Therefore, when using the environmental efficiency to check the effectiveness of the Central Government’s environmental protection policies, we firstly need to divide the whole industrial system into industrial production sub-system and pollution treatment sub-system, and, accordingly, the priority should be given to the estimation of industry production efficiency prior to estimating the pollution treatment efficiency.
This paper firstly introduces non-cooperative game to characterize the leader–follower relationship between the industrial production sub-system and pollution treatment sub-system in each province, and then proposes a novel two-stage SBM-DEA model to evaluate the provincial efficiency of both industrial production and pollutant treatment with the data during 2003–2012, based on which effectiveness of the environmental protection policies pushed by the Central Government is assessed.
The main conclusions of this paper include: (1) The model in this paper can calculate the industrial production efficiency and pollution treatment efficiency more accurately, and can provide more reasonable and effective information for decision makers, to find out the main sources of the inefficiency that arise from the internal stages within the whole industrial system. Neglecting the leader–follower relationship between the industrial production sub-system and the pollution treatment sub-system, or treating the two sub-systems independently or equally as extant DEA model does, will often result in overestimating the efficiency of pollution treatment sub-system, finally misleading the policy makers; (2) During the study period, both the efficiencies of industrial production sub-system and pollution treatment sub-system are low, indicating a serious disharmony between the economic development and environmental protection in China. However, the pollution treatment efficiency is generally higher than the industrial production efficiency, which shows that the Central Government’s environmental policies have a good policy effect; (3) In term of time trend, despite the average downtrend of industrial production efficiency all over the country, there is a stable trend for pollution treatment efficiency, especially in the Central area after 2006; (4) The sources for inefficiencies of both industrial production and pollution treatment can be attributed to the excessive resources investment and backward cleaner production technology. For inefficiency of pollution treatment, air pollution needs to attract more attention from provincial policy makers; (5) There exist obvious technological differences among the Eastern, Central and Western areas, including the industrial production technology and pollution treatment technology. However, the difference of pollutant treatment technology among the three areas is less than that in the industrial production technology. Thanks to the Central Government’s environmental policy, the promotion and application of pollution treatment technology in three areas is significantly faster than the transferring of industrial technology based on market behavior; (6) The environmental policies of the Central Government may not completely solve the inherent contradiction between economy development and environment protection, because disharmony also exists between economy and environment in most Chinese provinces. However, these environment protection policies indirectly promote the diffusion of technology of pollutant treatment among regions, which is conducive to the coordinated development among the Eastern, Central and Western areas.
This paper provides new evidence for the disharmony between economy and environment for the China’s provincial government. We suggest that reasonably controlling investment scale of industry production and strengthening the R&D of cleaner production technology are key for the Chinese government to solve the disharmony of the economy and the environment in the future. However, air pollution treatment technology, especially SO2 pollution abatement technology should become the key R&D program for pollutant abatement. In addition, how to effectively motivate local governments to better perform the national environmental policy and how to reasonably promote local government to better implement differentiation development strategy are important challenges for the policy makers in the Central Government.


