Article

Imbalance in Spatial Accessibility to Primary and Secondary Schools in China: Guidance for Education Sustainability

1
School of Resource and Environmental Science, Wuhan University, 129Luoyu Road, Wuhan 430079, China
2
Key Laboratory of Geographic Information System, Ministry of Education, Wuhan University, 129Luoyu Road, Wuhan 430079, China
3
Collaborative Innovation Center for Geospatial Information Technology, Wuhan 430079, China
*
Authors to whom correspondence should be addressed.
Sustainability 2016, 8(12), 1236; https://doi.org/10.3390/su8121236
Submission received: 16 September 2016 / Revised: 9 November 2016 / Accepted: 23 November 2016 / Published: 28 November 2016
(This article belongs to the Section Sustainable Education and Approaches)

Abstract

:
Compulsory education is an important aspect of the societal development. Meanwhile, education equality safeguards the effectiveness of education systems and is an important part of social equality. This study analyzes the inequality of compulsory education from the perspective of imbalanced spatial distribution. Unlike previous studies that have measured the spatial distribution of education simply based on the spatial position of primary and secondary schools, we explore spatial accessibility based on the shortest travel distance from residents to schools, and then analyze the inequality of compulsory education through the distribution of spatial accessibility. We use 2873 Chinese counties as statistical units, and perform a statistical and graphical analysis of their spatial accessibility using the Theil index and spatial autocorrelation analyses. To analyze the differences in the spatial accessibility distribution on the national and regional levels, we use three partitioned modes: the terrain partitioned mode, the economic development partitioned mode, and the province-level partitioned mode. We then analyze the spatial agglomeration characteristics and distribution patterns of compulsory education accessibility through global autocorrelation, local autocorrelation, and hot-spot and cold-spot analysis. The results demonstrate an obvious imbalance in the distribution of spatial accessibility to compulsory education at the national level. Accessibility and equality in eastern and central regions are significantly better than those in the western region; both are significantly better in coastal regions than in inland regions; and equality alone is better in the municipalities, such as Shanghai, Tianjin, and Chongqing, than in other provinces and autonomous regions. The spatial pattern analysis shows significant global autocorrelation and obvious clusters. Counties in cold-spot areas (clusters of good spatial accessibility) are large in number but small in size. Cold-spot areas present a ring-shaped structure in space with Henan Province as the core. Counties in hot-spot areas (clusters of weak spatial accessibility) are not as numerous, but most are large in size; hot-spot areas are mainly in the northwest regions, characterized by complex terrain and severe economic difficulty. This study can provide significant information to aid policy making related to compulsory education sustainability in China and can facilitate research on the equality and sustainable development of compulsory education.

1. Introduction

Education is a vital “driving force” of development and it is required for the attainment of many social, economic, political, and cultural benefits. Education is correlated to employment [1,2], welfare gain [2], individual income [2,3], wage distribution [4,5], allocative efficiency [6,7], and health status [8,9]. Compulsory education has an important position in the education system. In China, compulsory education is universal and public for all teenagers of school age; teenagers must attend, and they have the right to education with equal quality. According to the Education Act, a balanced development of compulsory education is an important part of the modernization and democratization of education. Fundamentally, balanced compulsory education is a concept of equality, and it promotes the equal and just development of education. In addition to guaranteeing all citizens the right to education, the act considers the fairness of provisions on equity and the quality of education. Education equality facilitates not only economic growth but also social equity. Research on education inequality plays an essential role in characterizing the fairness and effectiveness of education systems, and in monitoring and evaluating the processes of educational development.
The inequality of education especially compulsory education has been widely studied. For example, Wail et al. [10] used the Gini coefficient of education to measure the relative inequality of education distribution. Meschi et al. [11] measured the inequality of education enrollment at different ages. Thomas et al. [12] used the Gini coefficient and the Theil index to compare the distribution of educational attainment. Ajala et al. [13] discussed the inequality of basic education accessibility in a state in Ethiopia using various data, such as the number of schools, enrollees, and teachers. Bennett [14] defined American education inequality by the enrollment of different age groups and gender. In China, many studies on this issue have also been conducted [15,16,17]. Zhou [18] used the Gini coefficient as an inequality measurement tool and explored education inequality through building a comprehensive index system of education. Wu [19] measured the nationwide education inequality in China using enrollment of individuals in the 9–15 years age group. Hannum [20]. used educational outcomes as education inequality indicators, and discussed the influence of geographical factors on education inequality in China. Xue et al. [21] discussed the driving force of Chinese education inequality, such as age and ethnic education policy. Some studies have focused on education financial fairness and basic education facility allocation [22,23,24,25,26].
These studies have two disadvantages. One is that only few of them considered the impact of geographical factors when discussing the inequality of compulsory education [27,28]. Notably, research from the geographical distribution perspective is the most direct and effective means to examine educational resource allocation. The other disadvantage is that the few studies that have considered geographical distribution still have faced issues related to scope, such as a significantly small study area [13,29,30,31]. Specifically, most of them are empirical explorations and use a street, a district, or a school as the study area. Given their case specificity, they can assist in educational facility allocation only within a small-scale area. Optimal allocation in a small-scale area is usually inconsistent with that in its large-scale counterpart; thus, the verification of its generalizability is required. Therefore, we perform the following improvements on the research methods and the scale of study area. (1) The inequality of compulsory education is measured from the perspective of geography rather than from social and economic means. The Theil index and spatial autocorrelation methods are used for the analysis; (2) We use county as the spatial unit and Mainland China as the study area. Three partitioned modes are used in this study: the terrain partitioned mode, composed of the east–middle–west regions; the economic development partitioned mode, composed of eight economic zones; and the province-level partitioned mode, composed of 31 provinces and municipalities. These partitioned modes can reflect the inequality characteristics of the spatial distribution of compulsory education on different scales and can assist in exploring the causes of this inequality. The analysis and resolution of the inequality of compulsory education at the national level can be performed accordingly.
The article is organized as follows. Section 1 introduces the inequality of compulsory education and presents the outline of the entire article. Section 2 discusses the study area, and the primary basis of data, and it introduces the two main research methods. Section 3 analyzes the spatial distribution differences using the three partitioned modes and then analyzes the spatial pattern of accessibility through global autocorrelation, partial autocorrelation, and the hot-spot and cold-spot analyses. Section 4 discusses the spatial analysis results, and identifies driving forces from the terrain, the level of economic development, and the existing compulsory education policy. Section 5 concludes and proposes specific policy recommendations based on the results and discussion.

2. Materials and Methods

2.1. Study Area and Data Preparation

Using a small spatial unit generally obtains more trustworthy results of accessibility. However, the process of calculation becomes complicated for two main reasons: one is that the statistic unit is significantly small, and the other is that the sources of geo-reference, demographic census, and economic data are not readily available. In this study, we use county as the statistical unit. The study area includes 31 provinces, minority nationality areas, and municipalities in China (excluding Hong Kong, Macao, and Taiwan regions, and the island chain area), resulting in a total of 2873 county-level units. The administrative boundaries of the 2873 counties are based on statistics from the 6th census in 2009. We also use population, terrain, economic development, and other data when discussing the influencing factors of compulsory education inequality.
In examining the spatial accessibility to primary and secondary schools, we consider the links between educational institutions and settlements using the travel-to-school aspect. This method is more effective than methods that consider only the spatial distribution of primary and secondary schools. Spatial accessibility is measured by the average of the shortest travel-to-school distance in each county. The locations of settlements, roads, and schools are used to generate data on accessibility to school. The community-based settlement distribution data together with the spatial distribution of primary and secondary school data, are collected using the Application Program Interface provided by the Baidu Map, the largest map service provider in China (http://map.baidu.com/) (the details of our program are provided in the Appendix). Road network data are downloaded from the Internet, including all city roads (including branches) with a higher level than their branches, and all the rural roads. The nearest neighbor and network analysis tool in ArcGIS software is used to construct origin–destination (OD) matrices. A set of OD matrices is applied on the network dataset to evaluate the travel-to-school distance. The spatial pattern of distribution is obtained using the Manhattan method of nearest neighbor analysis. We determine the statistics by county and then average the shortest travel distance to primary and secondary schools.
Population, topography, and economic data are used in the discussion. Population data are obtained from the 6th census in 2009; the population density is the population per unit area, obtained by the ratio of the total population and the respective unit area data. We refer to the division of the urban scale to divide the population density into five grades from very low to very high (Figure 1). Relief amplitude is obtained from the national 30-m digital elevation model (DEM) data. The DEM is created by the new generation of NASA’s earth observation satellite Terra and is also called the Advanced Spaceborne Thermal Emission and Reflection Radiometer Global DEM. Its resolution is 30 m. We use GDP data collected from the statistical yearbooks to represent the level of regional economic development.

2.2. Methodology

2.2.1. Disparity Analysis by Theil Index

In the analysis of compulsory education inequality, the differences among regions can visibly express such inequality. This study measures the inequality of compulsory education based on the unequal spatial accessibility to primary and secondary schools. The unequal accessibility can be measured through the statistical differences between different regions. The Theil index (T) is a commonly used indicator of statistical analysis and can measure regional disparities. As defined by Equation (1), the Theil index is subgroup additively decomposable and can be used to determine the sources of inequality. This index can deconstruct the overall differences into the within-region component ( T W R ) and the between-region component ( T B R ) [32]. Accordingly, the differences in the overall spatial accessibility of different partitioned modes can be observed. The impact and contribution of each county unit to such differences can also be investigated and revealed, thereby identifying the causes of the inequality. Notably, the Theil index has evolved from the concept of entropy in information theory. We calculate the Theil index of inequality using the following standard formulas:
T = 1 n i = 1 n y i y ¯ log ( y i y ¯ )
T B R = k = 1 K y k log y k n k / n ¯
T W R = k = 1 K y k ( i g k y k i y ¯ log y k i / y k 1 / n k ¯ )
where T is the overall Theil index, y i is the shortest travel-to-school distance of county i, n is the total number of counties, and y ¯ is the average travel-to-school distance of all n counties. T B R is the between-region component of the Theil index, and T W R is the within-region component (the weighted average of the between-terrain region, economic region, and province inequalities for each region). K is the number of groups, gk is the k-th group, and nk is the number of gk. y k i , and y k are the percentage shares of the total distance of county i and group k.

2.2.2. Spatial Analysis

Spatial autocorrelation refers to a lack of spatial independence and is an important concept in spatial statistics [33]. Spatial autocorrelation analysis combines statistics with geospatial information to analyze the aggregation and dispersion characteristics and the abnormalities of data in geographical space. The space agglomeration of the advantages and disadvantages can directly express the inequality of compulsory education. The results of spatial autocorrelation analysis have the advantage of in-depth inquiry of influential factors of inequality.
The spatial autocorrelation index based on space weight reflects the spatial patterns of compulsory education facilities through the spatial aggregation or dispersion of accessibility to primary and secondary schools. According to the size of the study area, spatial autocorrelation can be divided into global autocorrelation and local autocorrelation. The global indicator is used to detect the spatial pattern of the entire region. Specifically, a single value is used to reflect the extent of spatial autocorrelation. Meanwhile, the local index is used to calculate the relevance of property in each unit and the adjacent unit.
Spatial autocorrelation reflects attribute similarity and spatial contiguity [34]. Positive spatial autocorrelation indicates strong similarities between neighbors, whereas negative spatial autocorrelation indicates strong differences. If the samples are randomly distributed in space, then no spatial autocorrelation exists. The degree of the strength of positive and negative spatial autocorrelation can be determined using various spatial autocorrelation indices.
(1) Global autocorrelation
Global spatial autocorrelation is the overall trend of correlation among all samples in the entire study area. The commonly used indicator is global Moran’s I, with a value between −1 and 1. At a given level of significance, if Moran’s I is significantly positive, then significant clusters of good (poor) spatial accessibility to compulsory education exist. By contrast, when Moran’s I is significantly negative, then spatial differences exist between the sample and the surrounding area. The value closer to −1 means significant difference in the overall space; a value closer to 1 indicates few clusters in the overall space. Moran’s I = 0 indicates that spatially uncorrelated units exist. The formula is expressed as follows:
I = N S 0 × i = 1 N j = 1 N ω i j ( X i X ¯ ) ( X j X ¯ ) j = 1 N ( X i X ¯ ) 2
In the above equation, i ≠ j, N is the number of samples, X i is county i, X ¯ is the mean value of X ¯ , and ω i j is the spatial weight matrix between county i and j. If county i is adjacent to county j, then ω i j is 1; if county i is not adjacent to county j, then ω i j is 0. The results of Moran’s I statistic z test show that, if normality statistic Moran’s I index Z value is higher than the critical value of the normal distribution function at the 0.05 level of 1.96, then a clear positive correlation exists between the spatial distribution.
(2) Local autocorrelation
Global autocorrelation describes the study area as a comprehensive index. Positive and negative spatial autocorrelations may coexist in the overall space. Thus, the use of local spatial autocorrelation may reveal spatial variability.
Local analysis is based on the local Moran statistic, represented in the form of significance and cluster maps [35,36]. In this study, we use local Moran’s I index to measure the heterogeneity of the regional spatial features between unit i and j. The formula is expressed as follows:
I i = ( x i x ¯ ) i ( x i x ¯ 2 ) j W i j ( x i x ¯ )
In addition to local Moran’s I index, we also use the Getis-Ord Gi* model to verify whether statistically significant high values or low values exist in the area; these values are useful for analyzing the hot-spot and cold-spot areas [33]. For a space i, the model is expressed as follows:
G i * ( d ) = i = 1 n W i j ( d ) x i / i = 1 n x i
where x i is the county i; W i j is the spatial weight matrix between counties i and j. If county i is adjacent to county j, then W i j = 1; if county i is not adjacent to county j, then W i j is 0. If Gi* is significantly positive, then the value of counties around i is relatively high (above average value). Accordingly, these counties form a high-value cluster (hot-spot area). If Gi* is significantly negative, then the value of counties around i is below the average value. Consequently, they form a low-value cluster (cold-spot area).

3. Results and Analyses

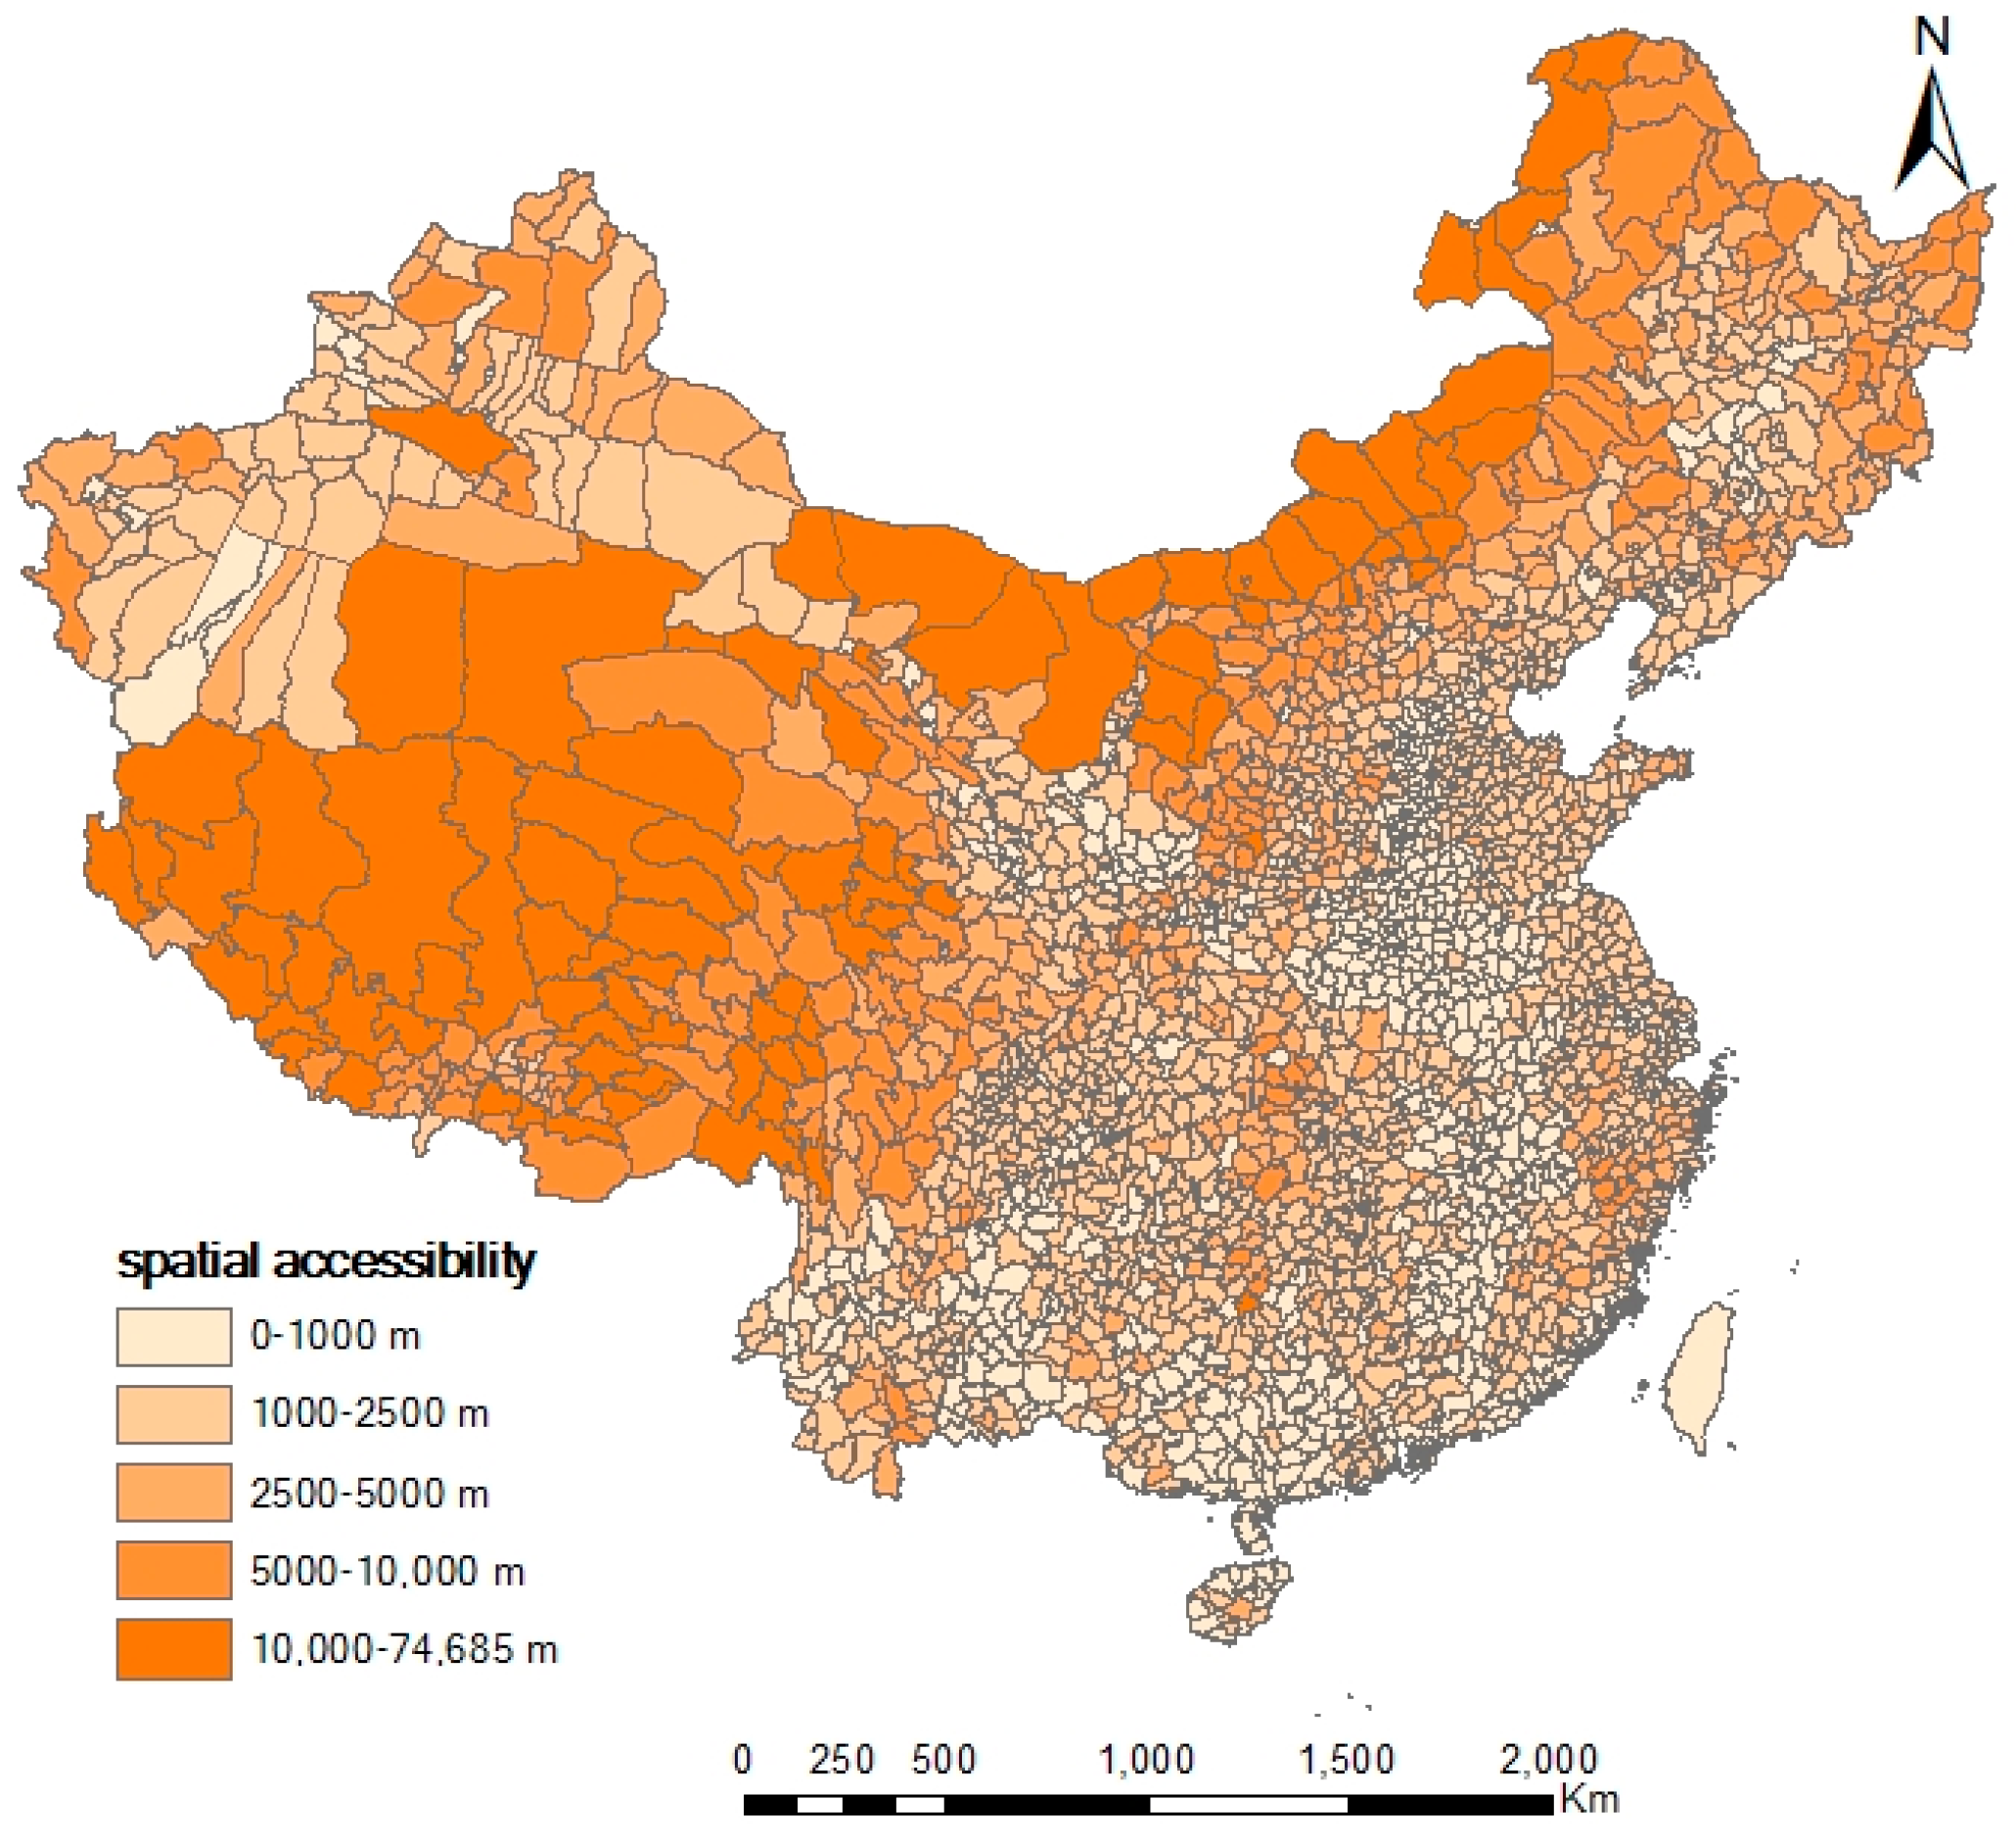
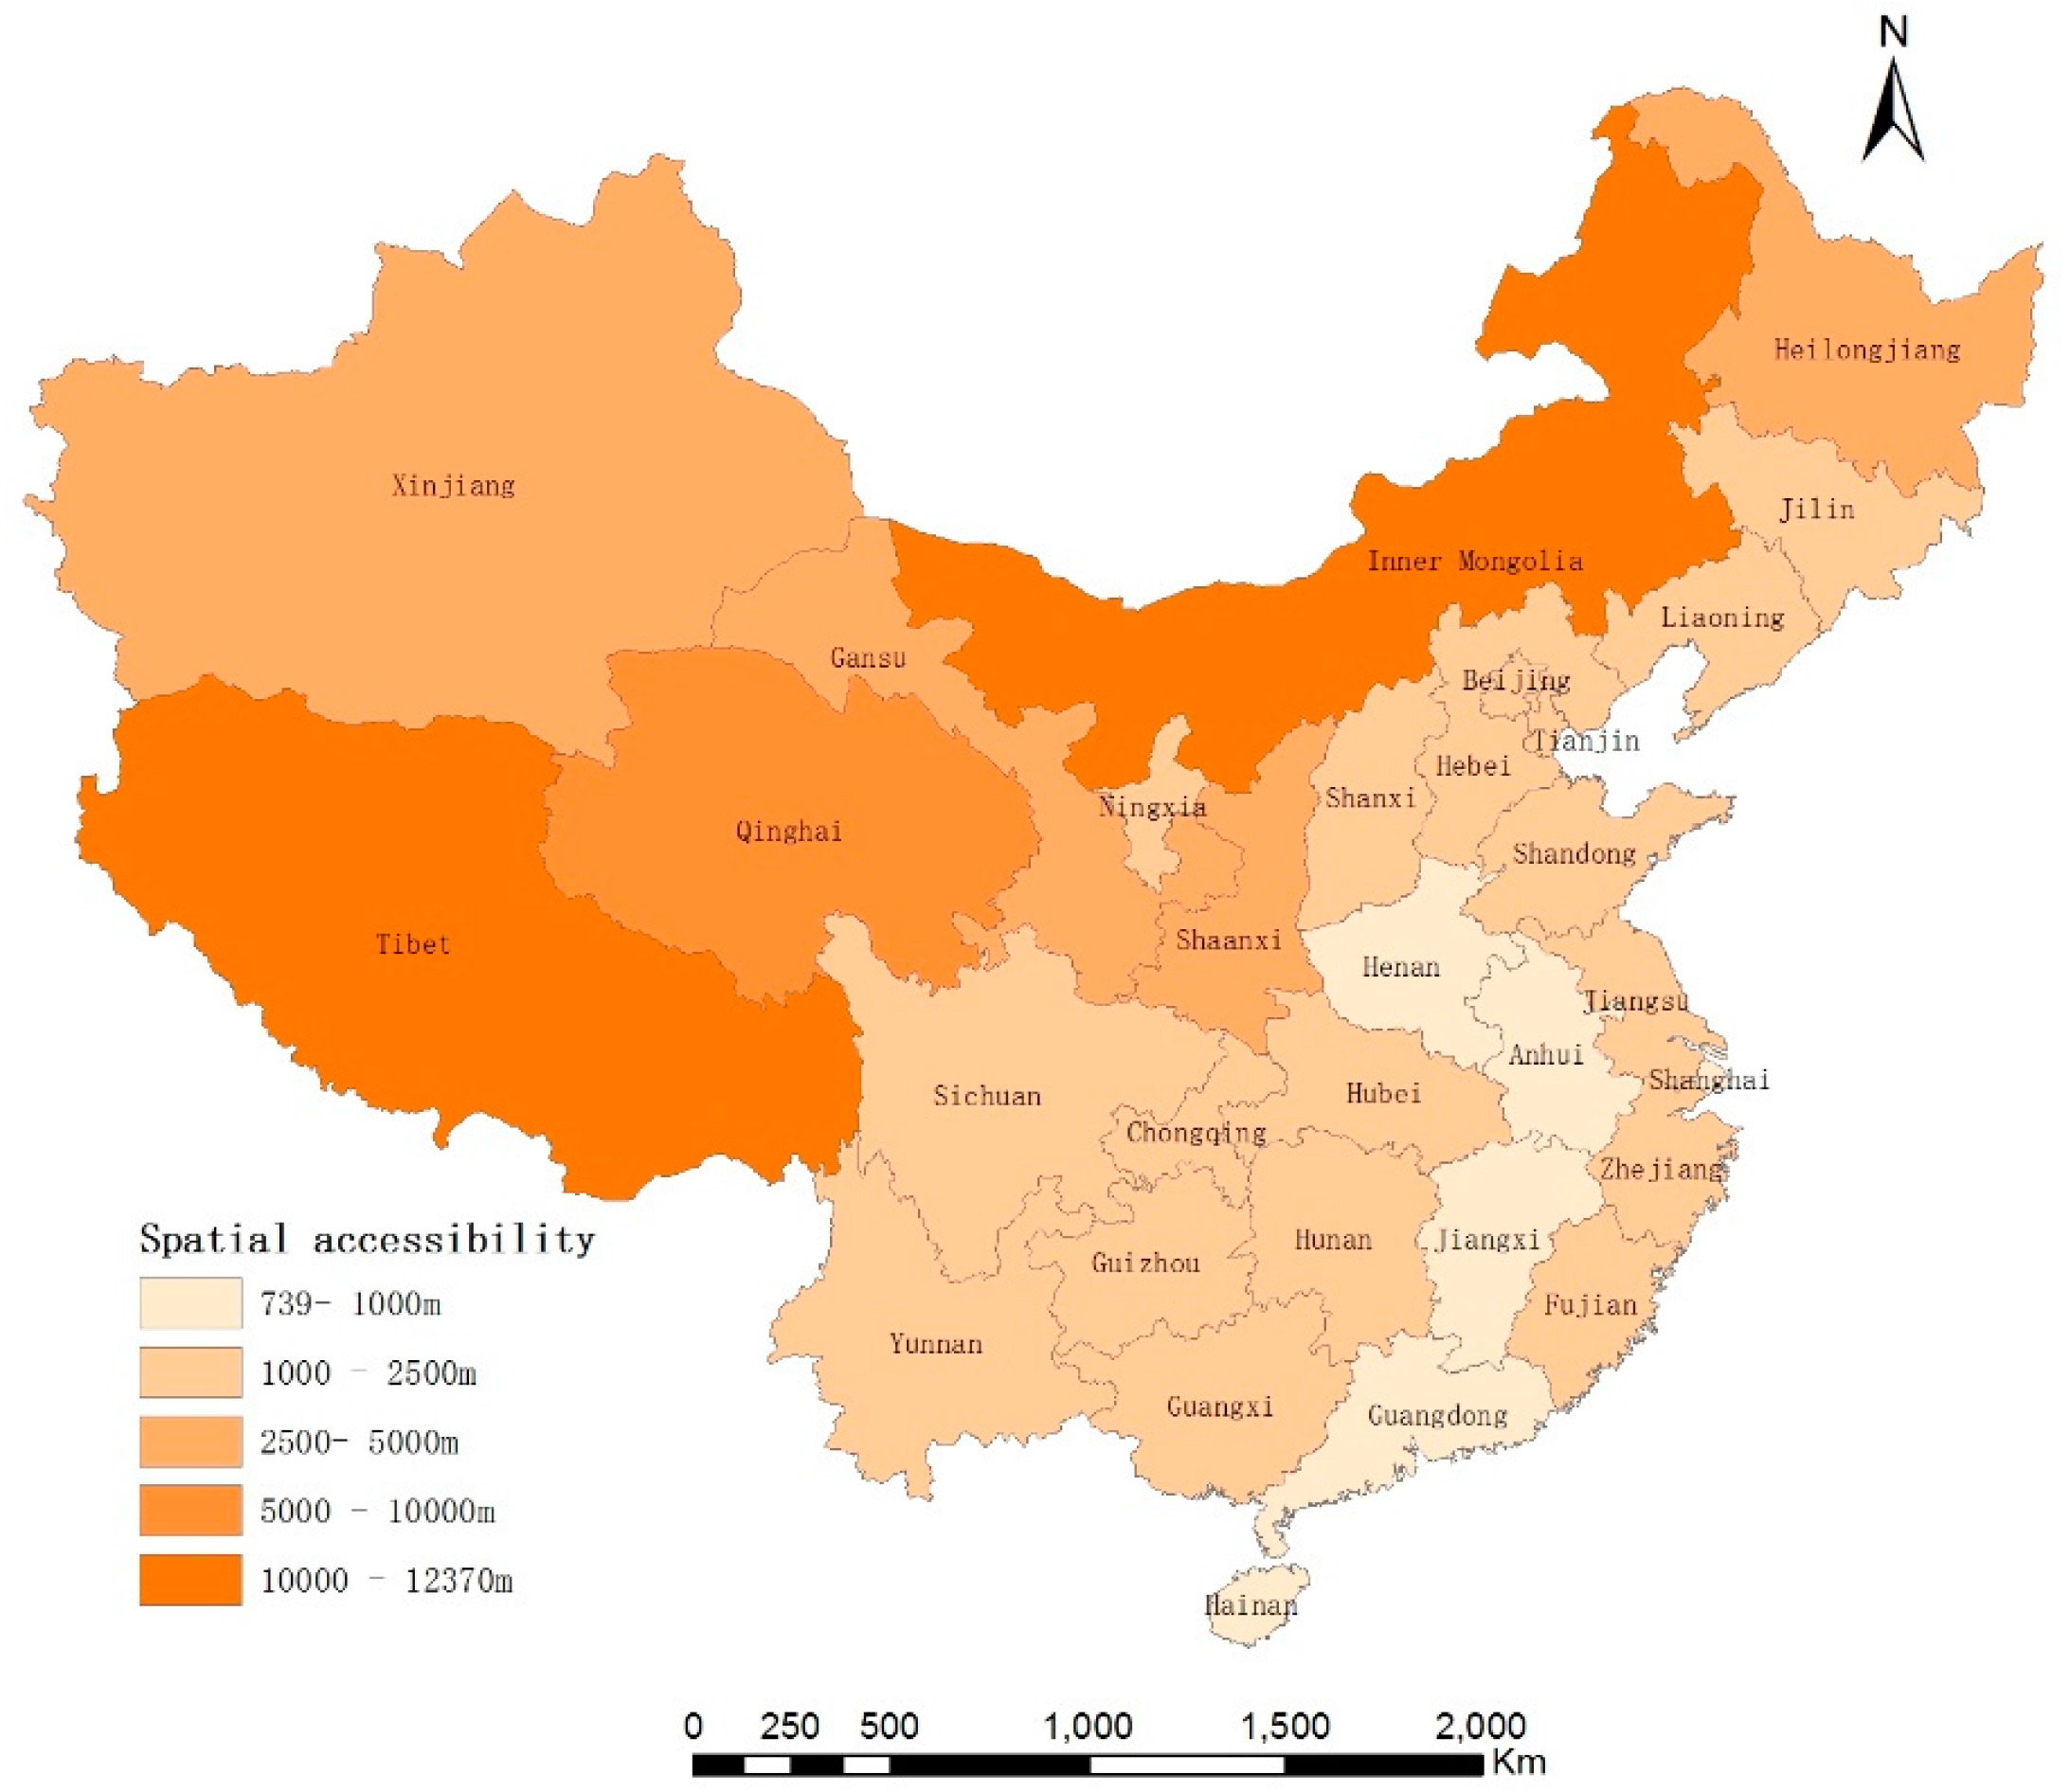
3.1. Overall National Scale

An obvious imbalance is found in the spatial accessibility to compulsory education facilities in Mainland China. The shortest travel-to-school distance (primary and secondary schools) varies from 212.42 m to 74,685 m. Overall, the spatial accessibility to compulsory education is worse in northwest and northeast China, and better in southeast China. The trend analysis reveals that the differences in spatial accessibility are obvious in the county scale; a substantially decreasing trend in the travel-to-school distance from west to east and from north to south exists (Figure 2 and Figure 3).
Further statistical analysis on the regional scale is conducted. To consider the topography, economic development, and administrative jurisdiction, we propose three corresponding partitioned modes that are common in China: the terrain partitioned mode (eastern, central, and western China), the economic development partitioned mode (eight economic zones), and the province-level partitioned mode (31 provinces and municipalities). All these partitioned modes are key dimensions of inequality in China.

3.1.1. Terrain Partitioned Mode (Eastern, Central, and Western China)

In the terrain partitioned mode (eastern China, including Beijing, Tianjin, Hebei, Liaoning, Shanghai, Jiangsu, Zhejiang, Fujian, Shandong, Guangdong, and Hainan; Central China, including Shanxi, Jilin, Heilongjiang, Anhui, Jiangxi, Henan, Hubei, and Hunan; and western China, including Chongqing, Sichuan, Guizhou, Yunnan, Guangxi, Tibet, Qinghai, Xinjiang, Gansu, Shaanxi, Ningxia, and Inner Mongolia) [37], the counties with the best accessibility are distributed in eastern and central China, and those with the worst accessibility are concentrated in western China. The shortest average travel-to-school distance of the western provinces is 4093.59 m, and the average distances are 1695.91 m and 1315.16 m for central and eastern China (Table 1). The maximum Theil index lies in western China, and the internal differences in eastern and central China are less than the average value on the national scale.

3.1.2. Economic Development Partitioned Mode (Eight Economic Zones)

The economic development partitioned mode is derived from eight economic zones identified in “Strategies and Coordinate Development Policy” published by the Development Research Center of the State Council The eight economic zones are partitioned into the northeast region, eastern coastal areas, southern coastal areas, northern coastal areas, the middle reaches of the Yellow River region, the middle reaches of the Yangtze River region, the southwest region, and the northwest region. Specifically, these are the northeast region, including Liaoning, Jilin, and Heilongjiang; northern coastal areas, including Beijing, Tianjin, Hebei, and Shandong; eastern coastal areas, including Shanghai, Zhejiang, and Jiangsu; southern coastal areas, including Fujian, Guangdong, and Hainan; the middle reaches of the Yellow River region, including Shaanxi, Shanxi, Henan, and Inner Mongolia; the middle reaches of the Yangtze River region, including Hubei, Hunan, Jiangxi, and Anhui; the southwest region, including Guangxi, Yunnan, Guizhou, Sichuan, and Chongqing; and the northwest region, including Gansu, Qinghai, Ningxia (average enrollment), Tibet, and Xinjiang. As shown in Table 2, The northwest region and middle Yellow river region have the longest travel-to-school distance. Specifically, the northwest region has an average distance of more than 5000 m. The south coast, east coast, north coast, and middle Yangtze River regions have the shortest average travel-to-school distance (all with a distance within 1500 m). The Theil index of the northwest region and the middle Yellow river region is positive, and the difference in the two regions is higher than the national average difference index. On the contrary, the internal differences of the remaining six regions are negative.

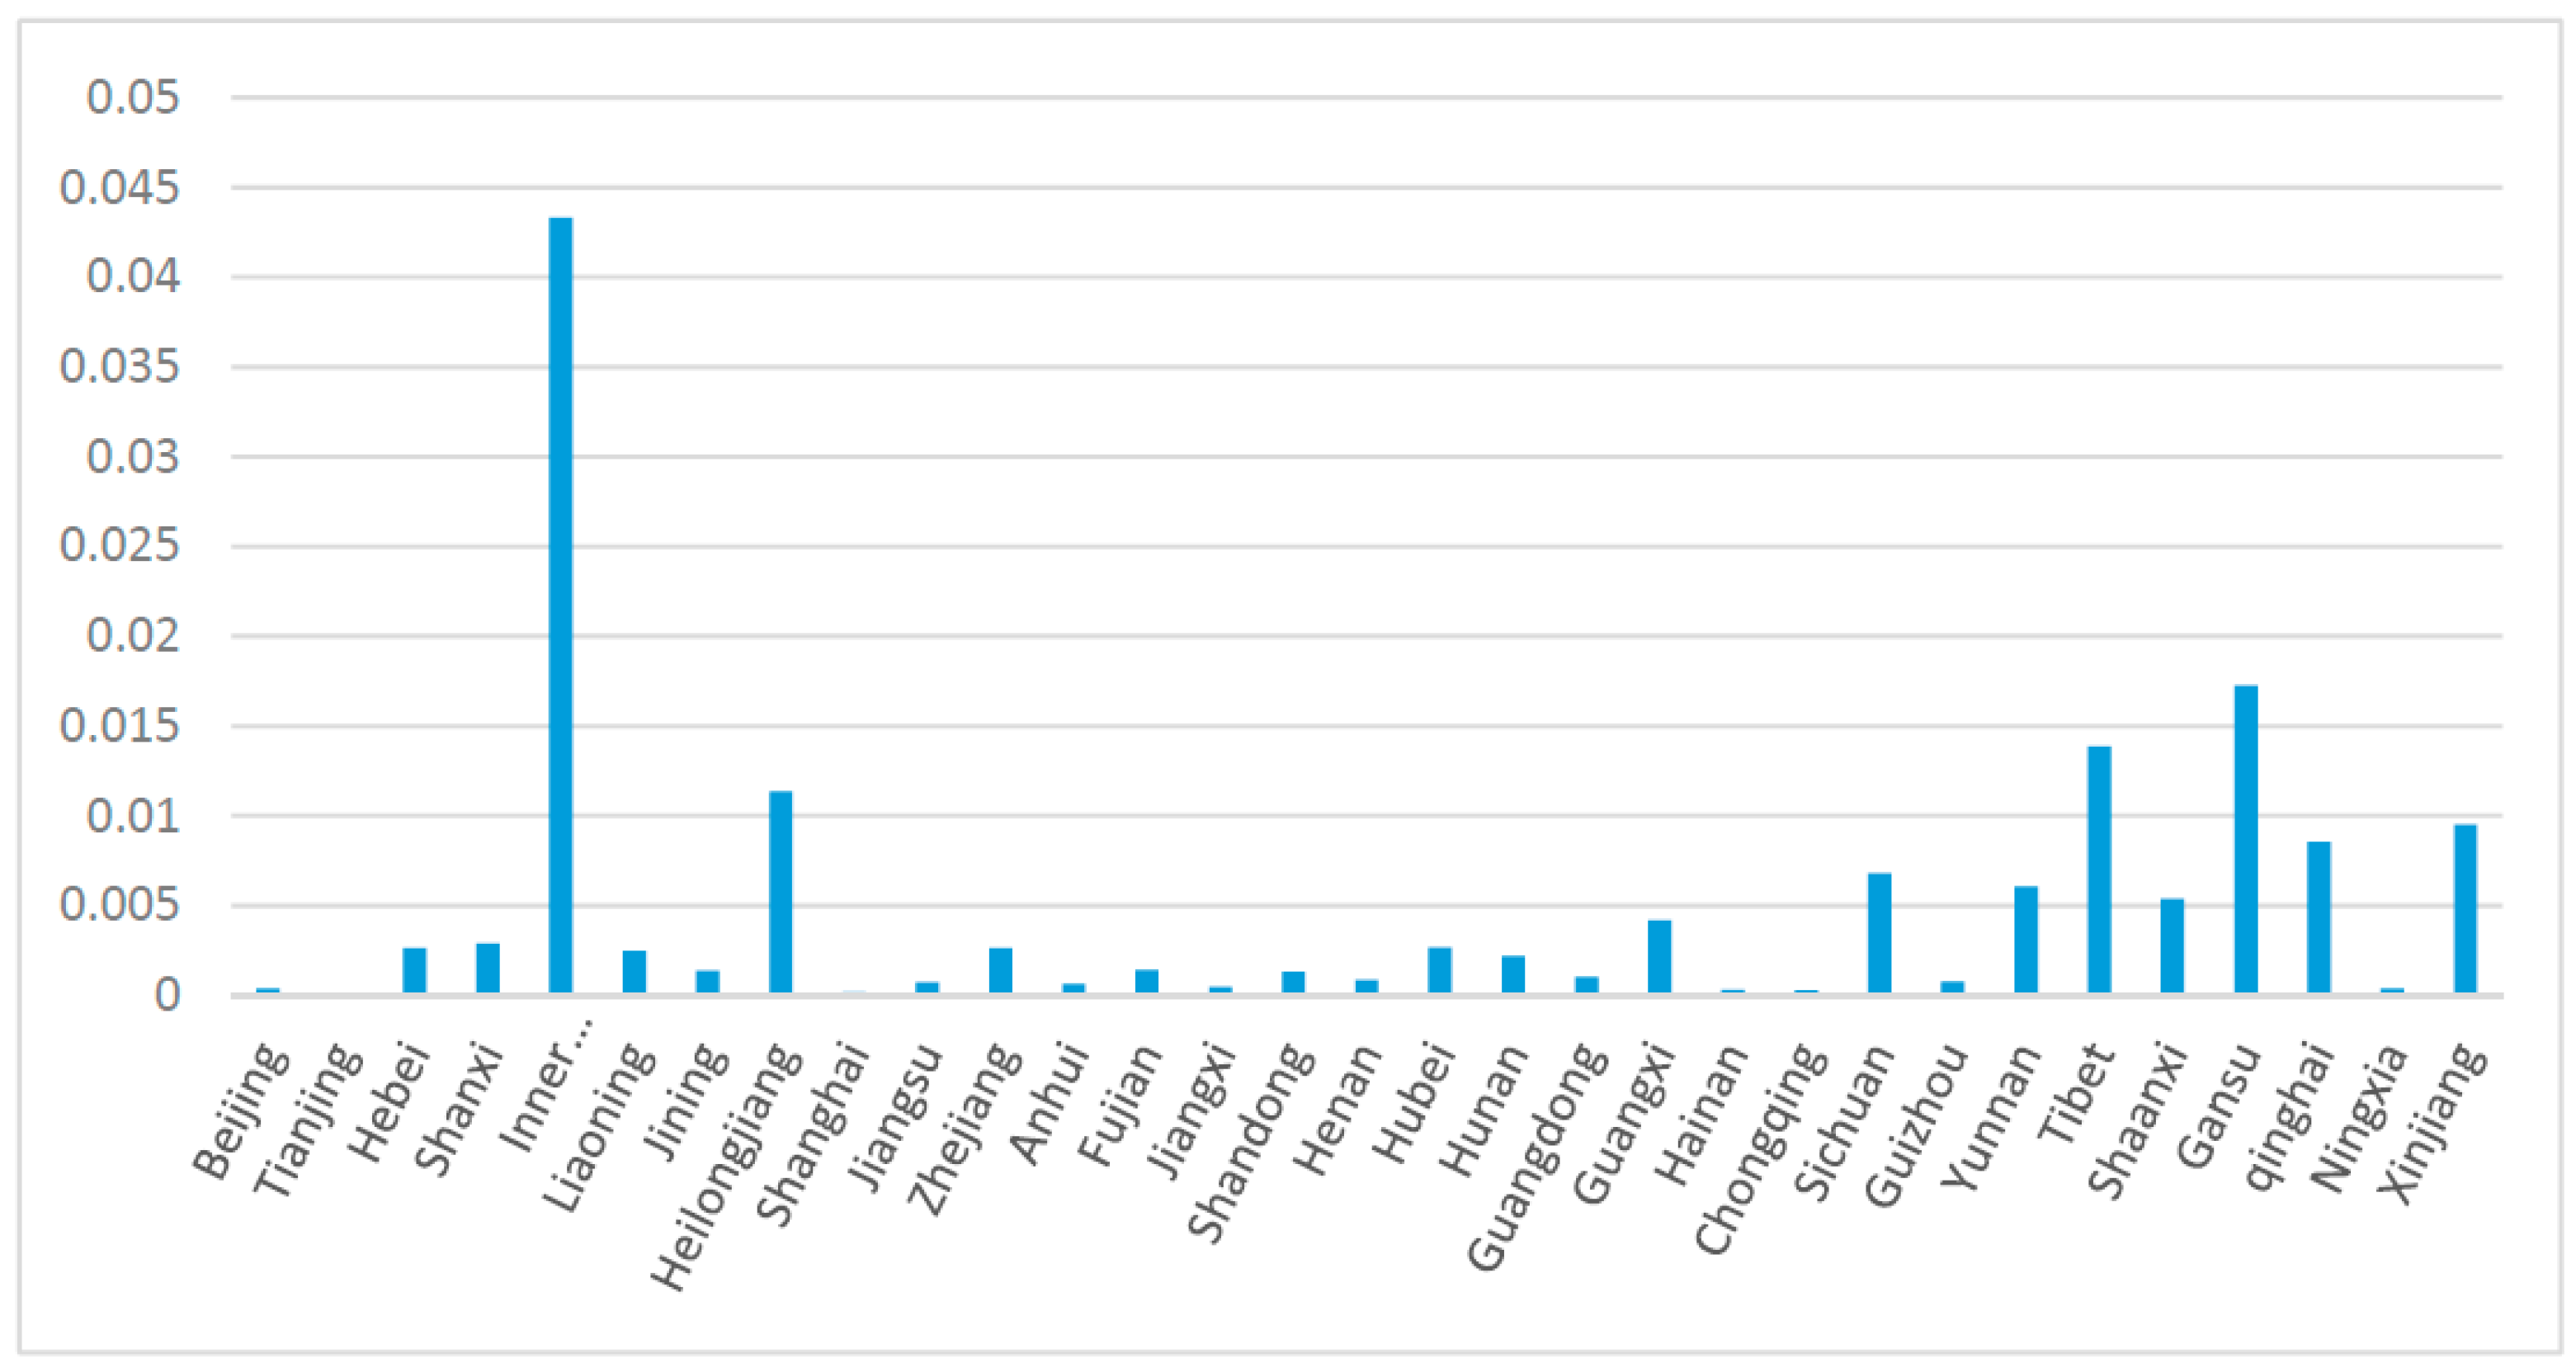
3.1.3. Province-Level Partitioned Mode (31 Provinces and Municipalities)

Spatial accessibility to compulsory education is divided into five grades by provinces: worst, poor, moderate, good, and best. (Figure 4) The worst accessibility occurs in provinces of Tibet Autonomous Region and Inner Mongolia Autonomous Region that lie in western and northern China. The shortest average travel-to-school distance in these provinces is larger than 10,000 m. Qinghai Province has poor accessibility with an average distance of larger than 5000 m. The provinces with moderate accessibility are Xinjiang Uygur Autonomous Region, Gansu Province, Shaanxi Province, and Heilongjiang Province, with the average distances from 2500 m to 5000 m. Many municipalities and provinces are found to have good accessibility. Specifically, three municipalities (Beijing, Tianjin, and Chongqing) and 13 provinces (Jilin, Liaoning, Hebei, Shanxi, and Shandong among others) have an average distance ranging from 1000 m to 2500 m. The provinces with the best accessibility (with the shortest travel distances) include Henan, Jiangxi, Guangdong, Hainan, and Shanghai City.
The Theil index disparity analysis (Figure 5) shows that Inner Mongolia, Gansu, Tibet, and Heilongjiang Provinces have the largest internal differences. Moreover, Tianjin, Shanghai, and Chongqing Provinces have the smallest internal differences.

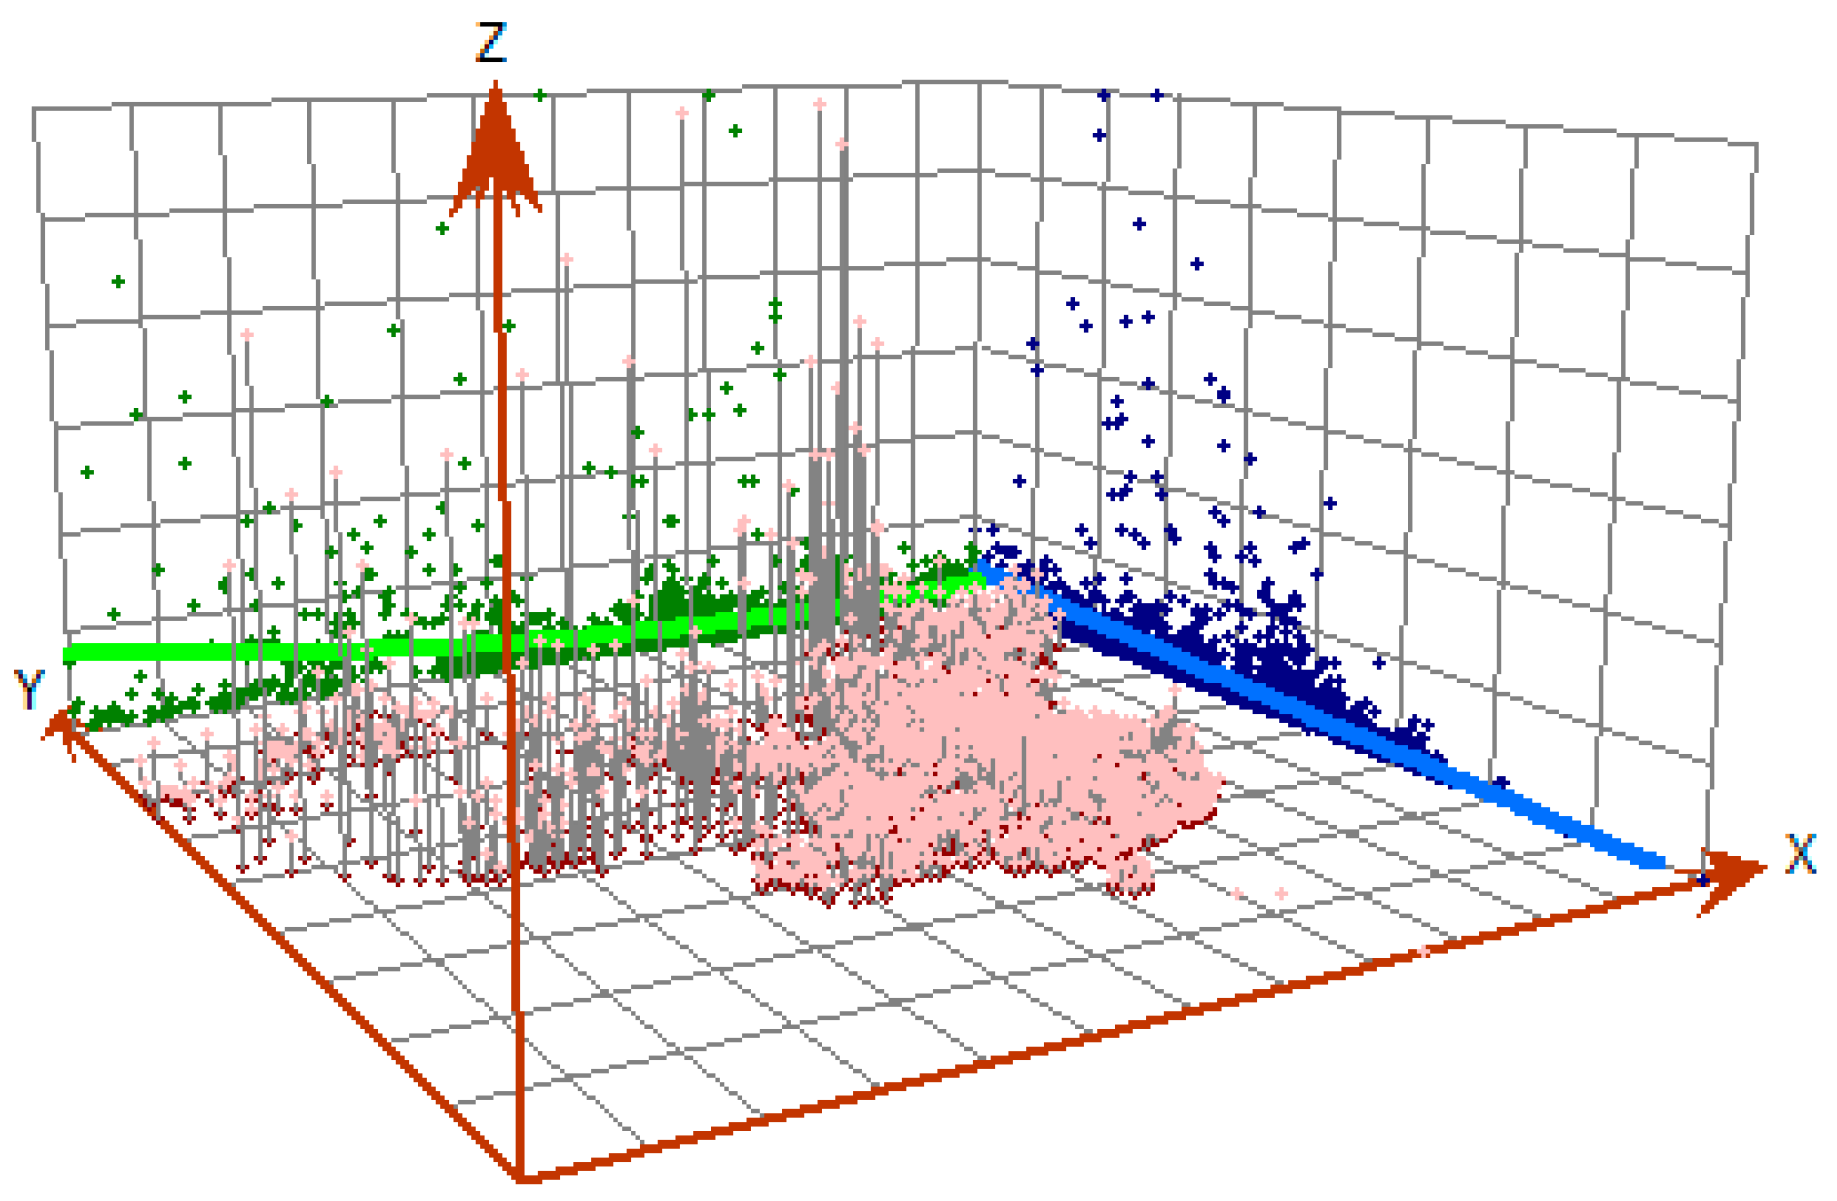
3.2. Spatial Pattern Analysis

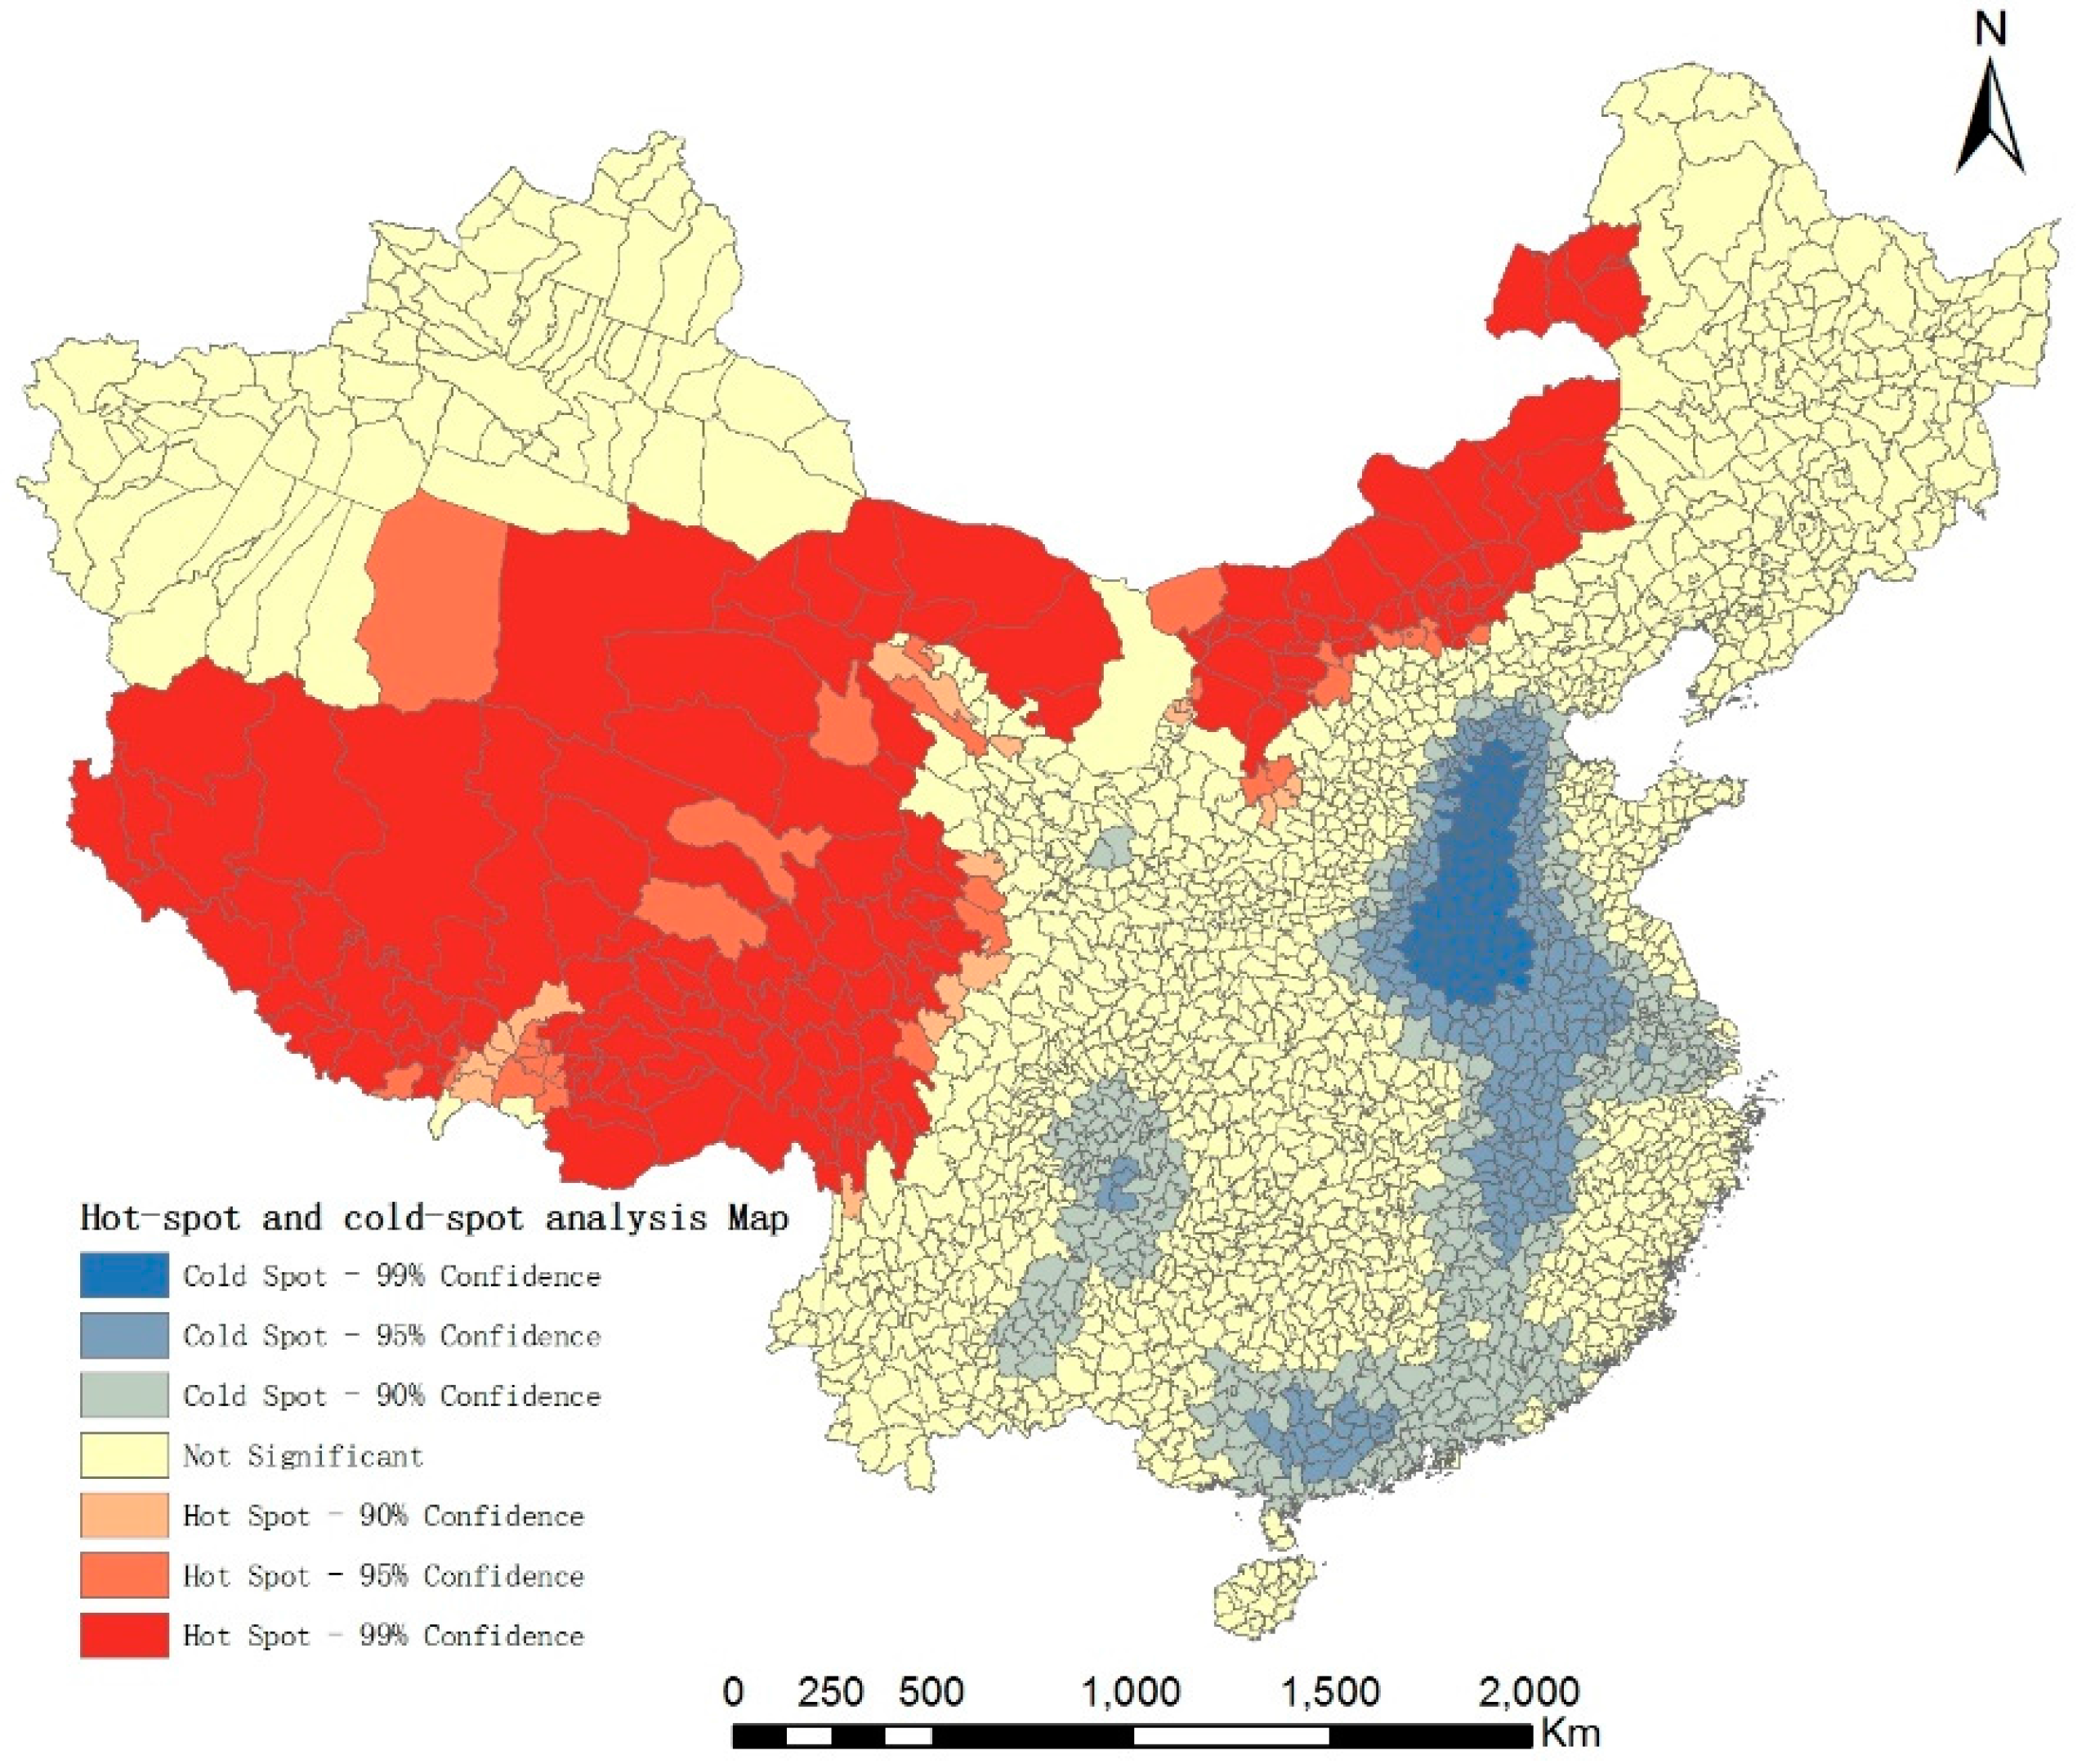
3.2.1. Global Autocorrelation

The global spatial autocorrelation analysis shows that Moran’s I index is 0.38, the z score is 101.14, and the p value is less than 0.000001; thus, a significant positive correlation exists. The statistical analysis of the shortest travel-to-school distance at each county unit in the entire study area presents significant agglomeration. The counties have similar accessibility concentrated in space, and the possibility of this agglomeration being randomly generated is significantly small. The global autocorrelation results demonstrate inequality of compulsory education in the study area.

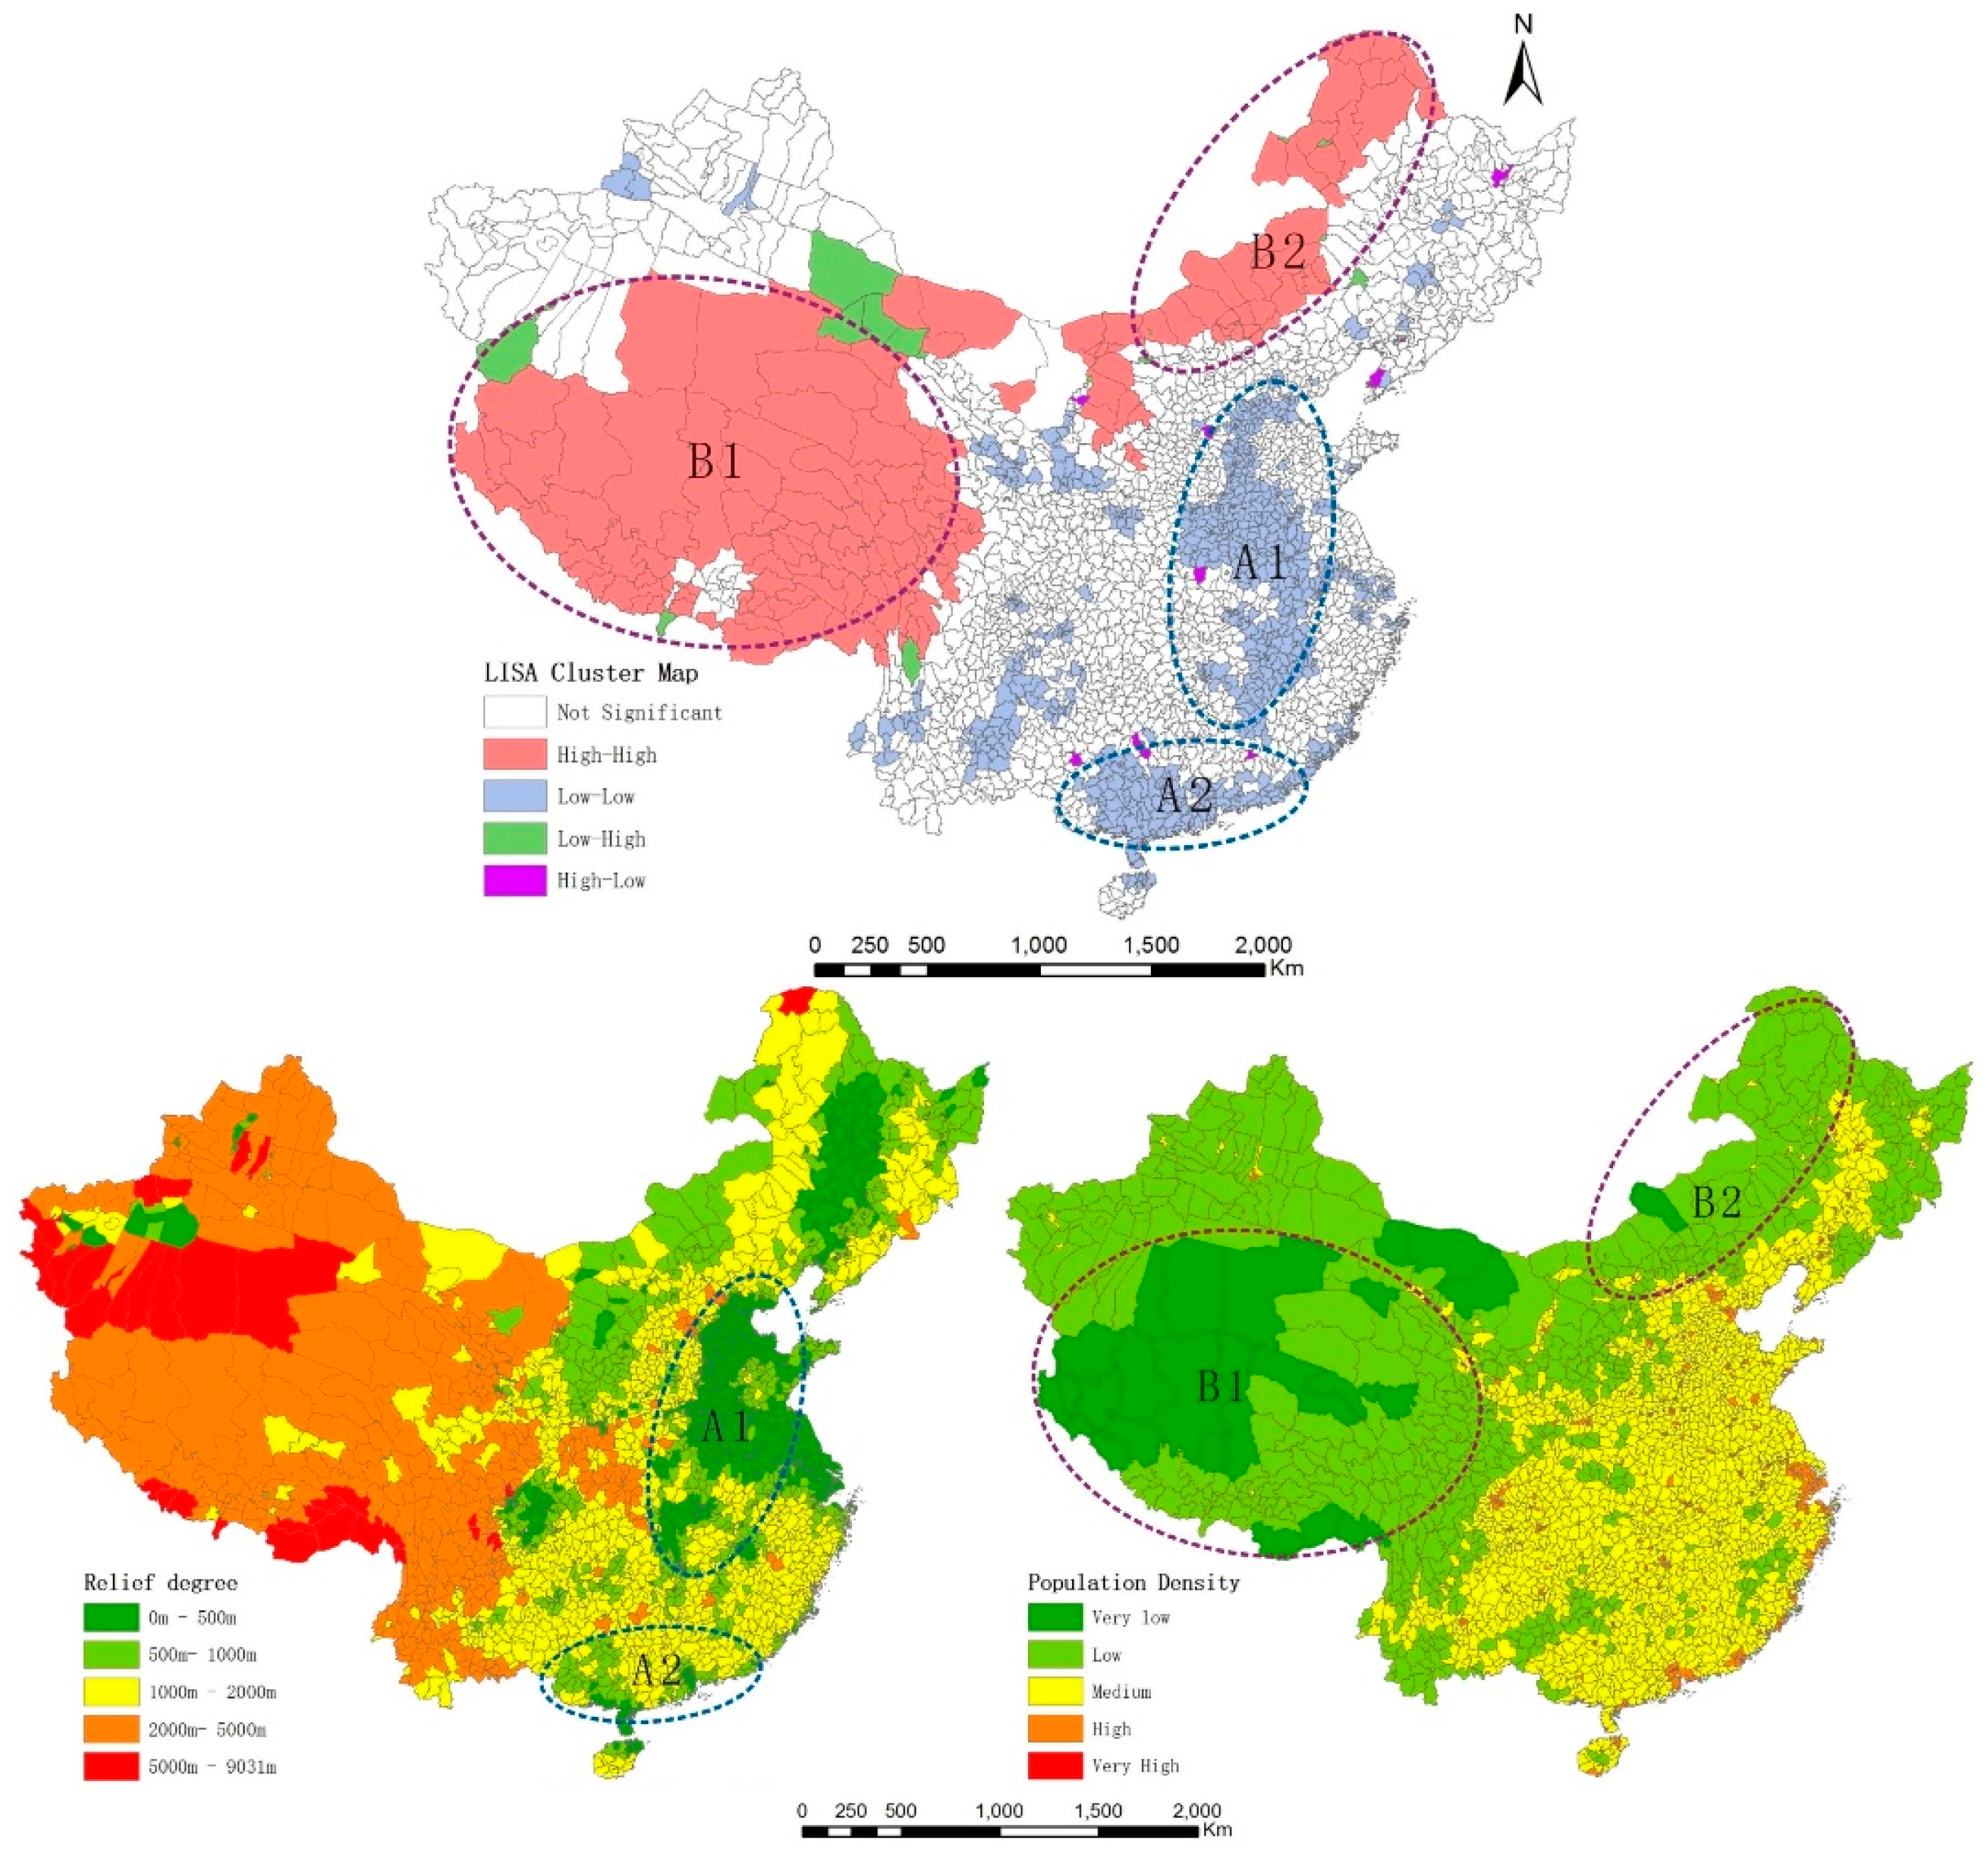
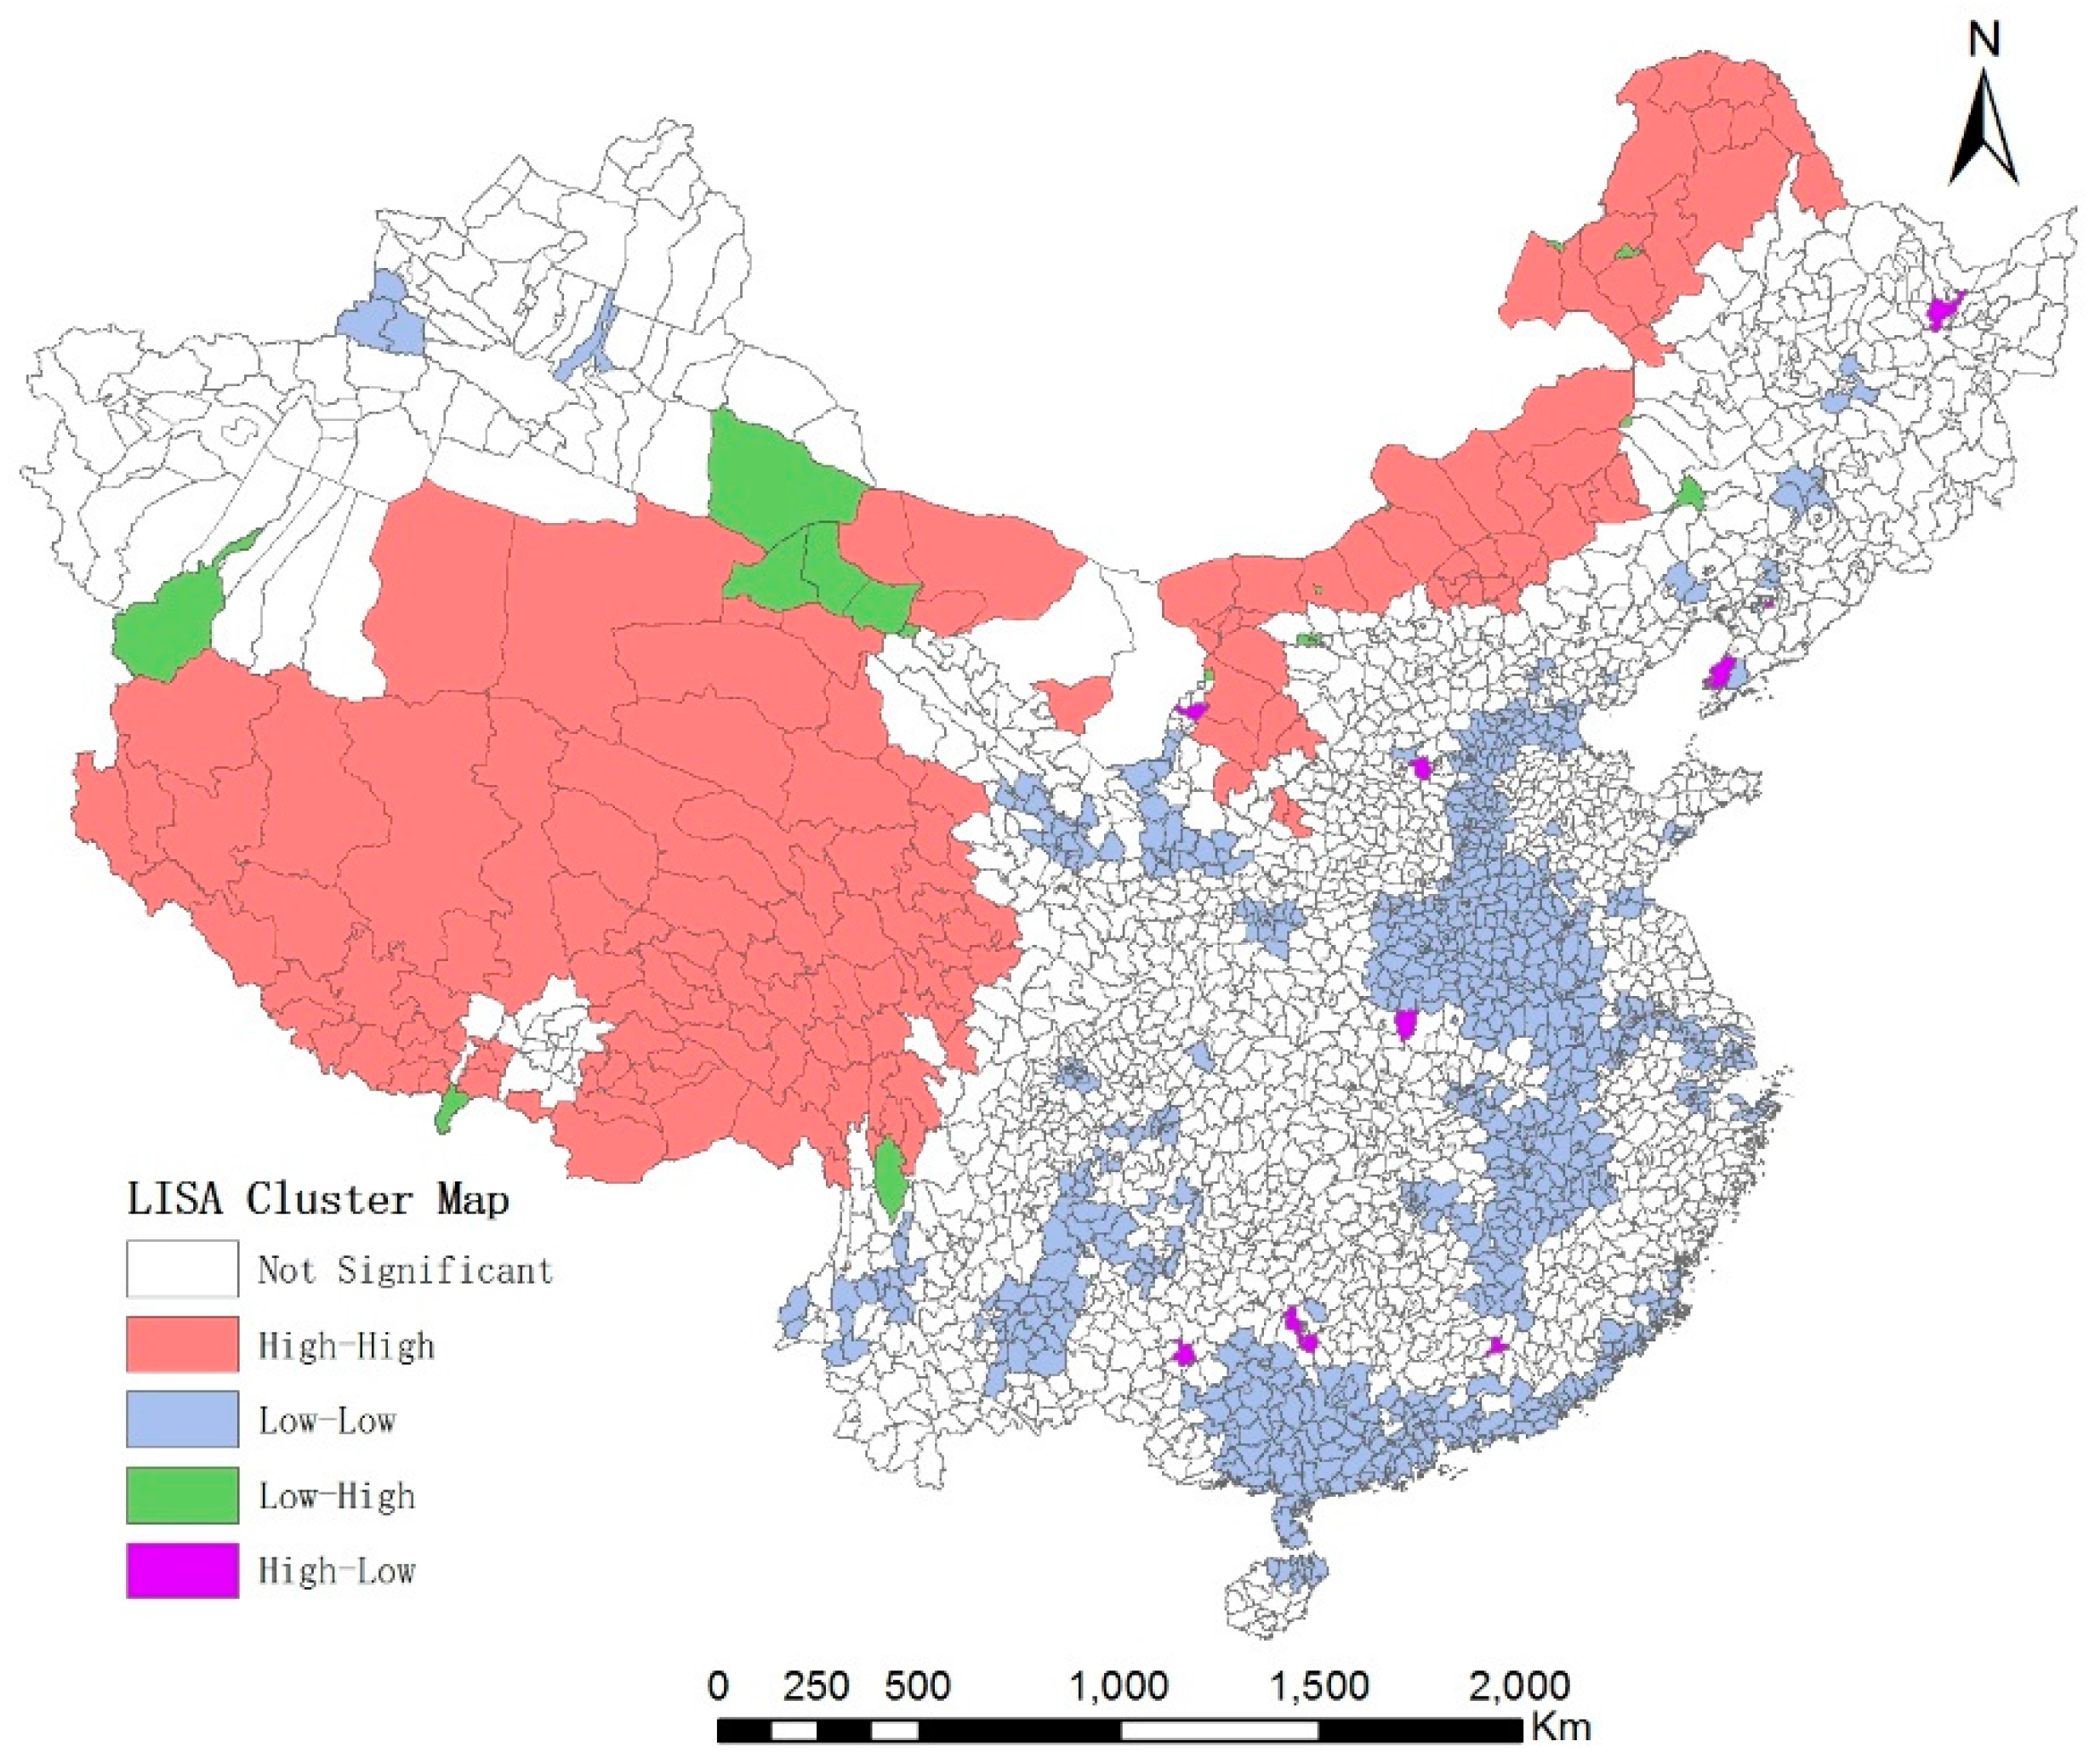
3.2.2. Local Autocorrelation

(1) Scatter Diagram
The scatter diagram defines the normalized value of the variable for all observations (z) as the horizontal axis, and the vertical axis corresponds to the spatial lag vectors (Wz) for all values of variable z. The scatter plot represents the relationship between z and Wz. The Moran scatter diagram shows that most of the county is located in the high–high (HH) quadrant (the first quadrant); a small part of the county is located in the high–low (HL), low–high (LH), and low–low (LL) quadrants; and most of these points are concentrated in the vicinity of the origin. More points in the HH quadrant indicate a smaller overall difference in spatial accessibility on the county scale. The first and third quadrants represent positive spatial autocorrelation, thereby indicating spatial homogeneity. On the contrary, the second and fourth quadrants show negative spatial autocorrelation, thereby indicating heterogeneity.
(2) Local Indicators of Spatial Association (LISA) Cluster Map
LISA is an indicator that measures the degree and significance of similarity (positive correlation) and dissimilarity (negative correlation) of a spatial unit with its surrounding units. According to Equation (2), we use the GeoDA software to calculate the LISA value of the travel-to-school distance of each county in Mainland China. Based on a z test (p value less than 0.05), the LISA cluster map is drawn (Figure 6).
The HH-type distribution is significant in Tibet, most of Qinghai, northwestern Heilongjiang, northwestern Sichuan, Ruoqiang County, and Qiemo County in Xinjiang. Western Gansu and Shanxi counties are observed in a slight HH-type distribution. The counties with an HH-type distribution have long travel-to-school distance similar to their surrounding counties. The regions with this type of distribution also have a poor overall accessibility to compulsory education.
The LL-type distribution occurs in the majority of counties (31.6% of the total). Specifically, the vast majority of Henan and Shanghai, most of Jiangxi, southern Hebei, north-central Guizhou, the east and west fringes of Yunnan, Guangdong Province, southern Guangxi Zhuang Autonomous Region, the coastal part of Fujian, and northern Hainan have an LL-type distribution. Such a distribution slightly occurs in the provinces of Tianjin, Jiangsu, Zhejiang, and Gansu. The counties with LL-type distribution have a short travel-to-school distance, similar to their surrounding counties. The regions with this type of distribution have good overall accessibility to compulsory education.
A total of 18 counties belong to the LH-type distribution. These counties are Hami City (1581.67 m) and Hotan County (836.29 m) in Xinjiang; Dunhuang City (1410.39 m), Guazhou County (1711.85 m), Jiayuguan City (706.74 m), and Yumen City (2379.06 m) in Gansu Province; Shangri-La County (918.01 m) in Yunnan Province; Manzhouli City (802.97 m), Hailar District (776.29 m), Holingol City (1014.97 m), Kailu County (1771.29 m), Erenhot City (811.92 m), Bayan Obo Mine (996.38 m), Haibo Bay District (722.82 m), Jining District (1348.40 m), Jiuyuan District (1814.98 m), and Hondlon District (582.82 m) in Inner Mongolia Autonomous Region; and Yadong County (1801.16 m) in Tibet. These counties have short travel-to-school distance, which results in good accessibility to compulsory education. By contrast, their surrounding counties have a long travel-to-school distance, indicating poor spatial accessibility. Therefore, the regions with an LH-type distribution differ significantly from their surrounding areas. These regions are also counties with developed education in a specific region because of their outstanding spatial accessibility to compulsory education. We call these counties “recessed inequality points”.
The counties (districts) with an HL-type distribution are relatively scarce, numbering 10 in total: Tangyuan County (4198 m) in Heilongjiang Province; Gongchangling District (3412.41 m) and Wafangdian City (2429.28 m) in Liaoning Province; Zaoyang City (2427.73 m) in Hubei Province; Yangshuo (2478.52 m), Donglan (3078.16 m), and Lingui County (2434.36 m) in Guangxi Province; Shouyang County (2955.08 m) in Shanxi Province; Pingluo County (2513.20 m) in Ningxia Hui Autonomous Region; and Dingnan County (2614.49 m) in Jiangxi Province. These counties have a long travel-to-school distance, which results in poor accessibility to compulsory education. However, their surrounding counties have a short travel-to-school distance, indicating good spatial accessibility. Thus, the regions with an HL-type distribution differ significantly from their surrounding areas. They also are usually counties with undeveloped education in the specific region because of their lagging spatial accessibility to compulsory education. We call these counties “raised inequality points”. The rest of the counties are non-significant areas in the local spatial autocorrelation analysis.
(3) Hot-spot and cold-spot analysis
1. In Figure 7, the cold-spot areas (clusters of good spatial accessibility) in the entire study area present a ring-shaped structure in the space with Henan Province as the core. These areas extend from Henan Province to eastern and southern China, intersecting in Guangdong Province, and then pass some counties in Hubei, Hunan, and Jiangxi Provinces. A small cold-spot area with a 90% confidence level is also observed in Sichuan Province. All these cold-spot areas play a leading role in compulsory education in China. Meanwhile, the hot-spot areas (clusters of poor spatial accessibility) comprise counties mainly from Inner Mongolia, Tibet, and most of Qinghai Province. A few other less significant counties are distributed around the core hot-spot area. These cold-spot areas are lagging in terms of the development of compulsory education at the national level. They must be prioritized for improvement to develop a balanced compulsory education.
2. In terms of the distribution of spatial accessibility to compulsory education, counties in central and southern China have a distinct advantage over those in western and northern China. The reason is that cold-spot areas are located in central and southern China, whereas hot-spot areas are uniformly distributed in northern and western China.
3. The number of counties with hot-spot confidence higher than 99% is 150, and the majority of them have a large area. Therefore, hot-spot areas are widely distributed. A total of 78 counties have cold-spot confidence higher than 99%, and most of these counties have a small area. Thus, cold-spot areas are small only in size.

4. Discussions

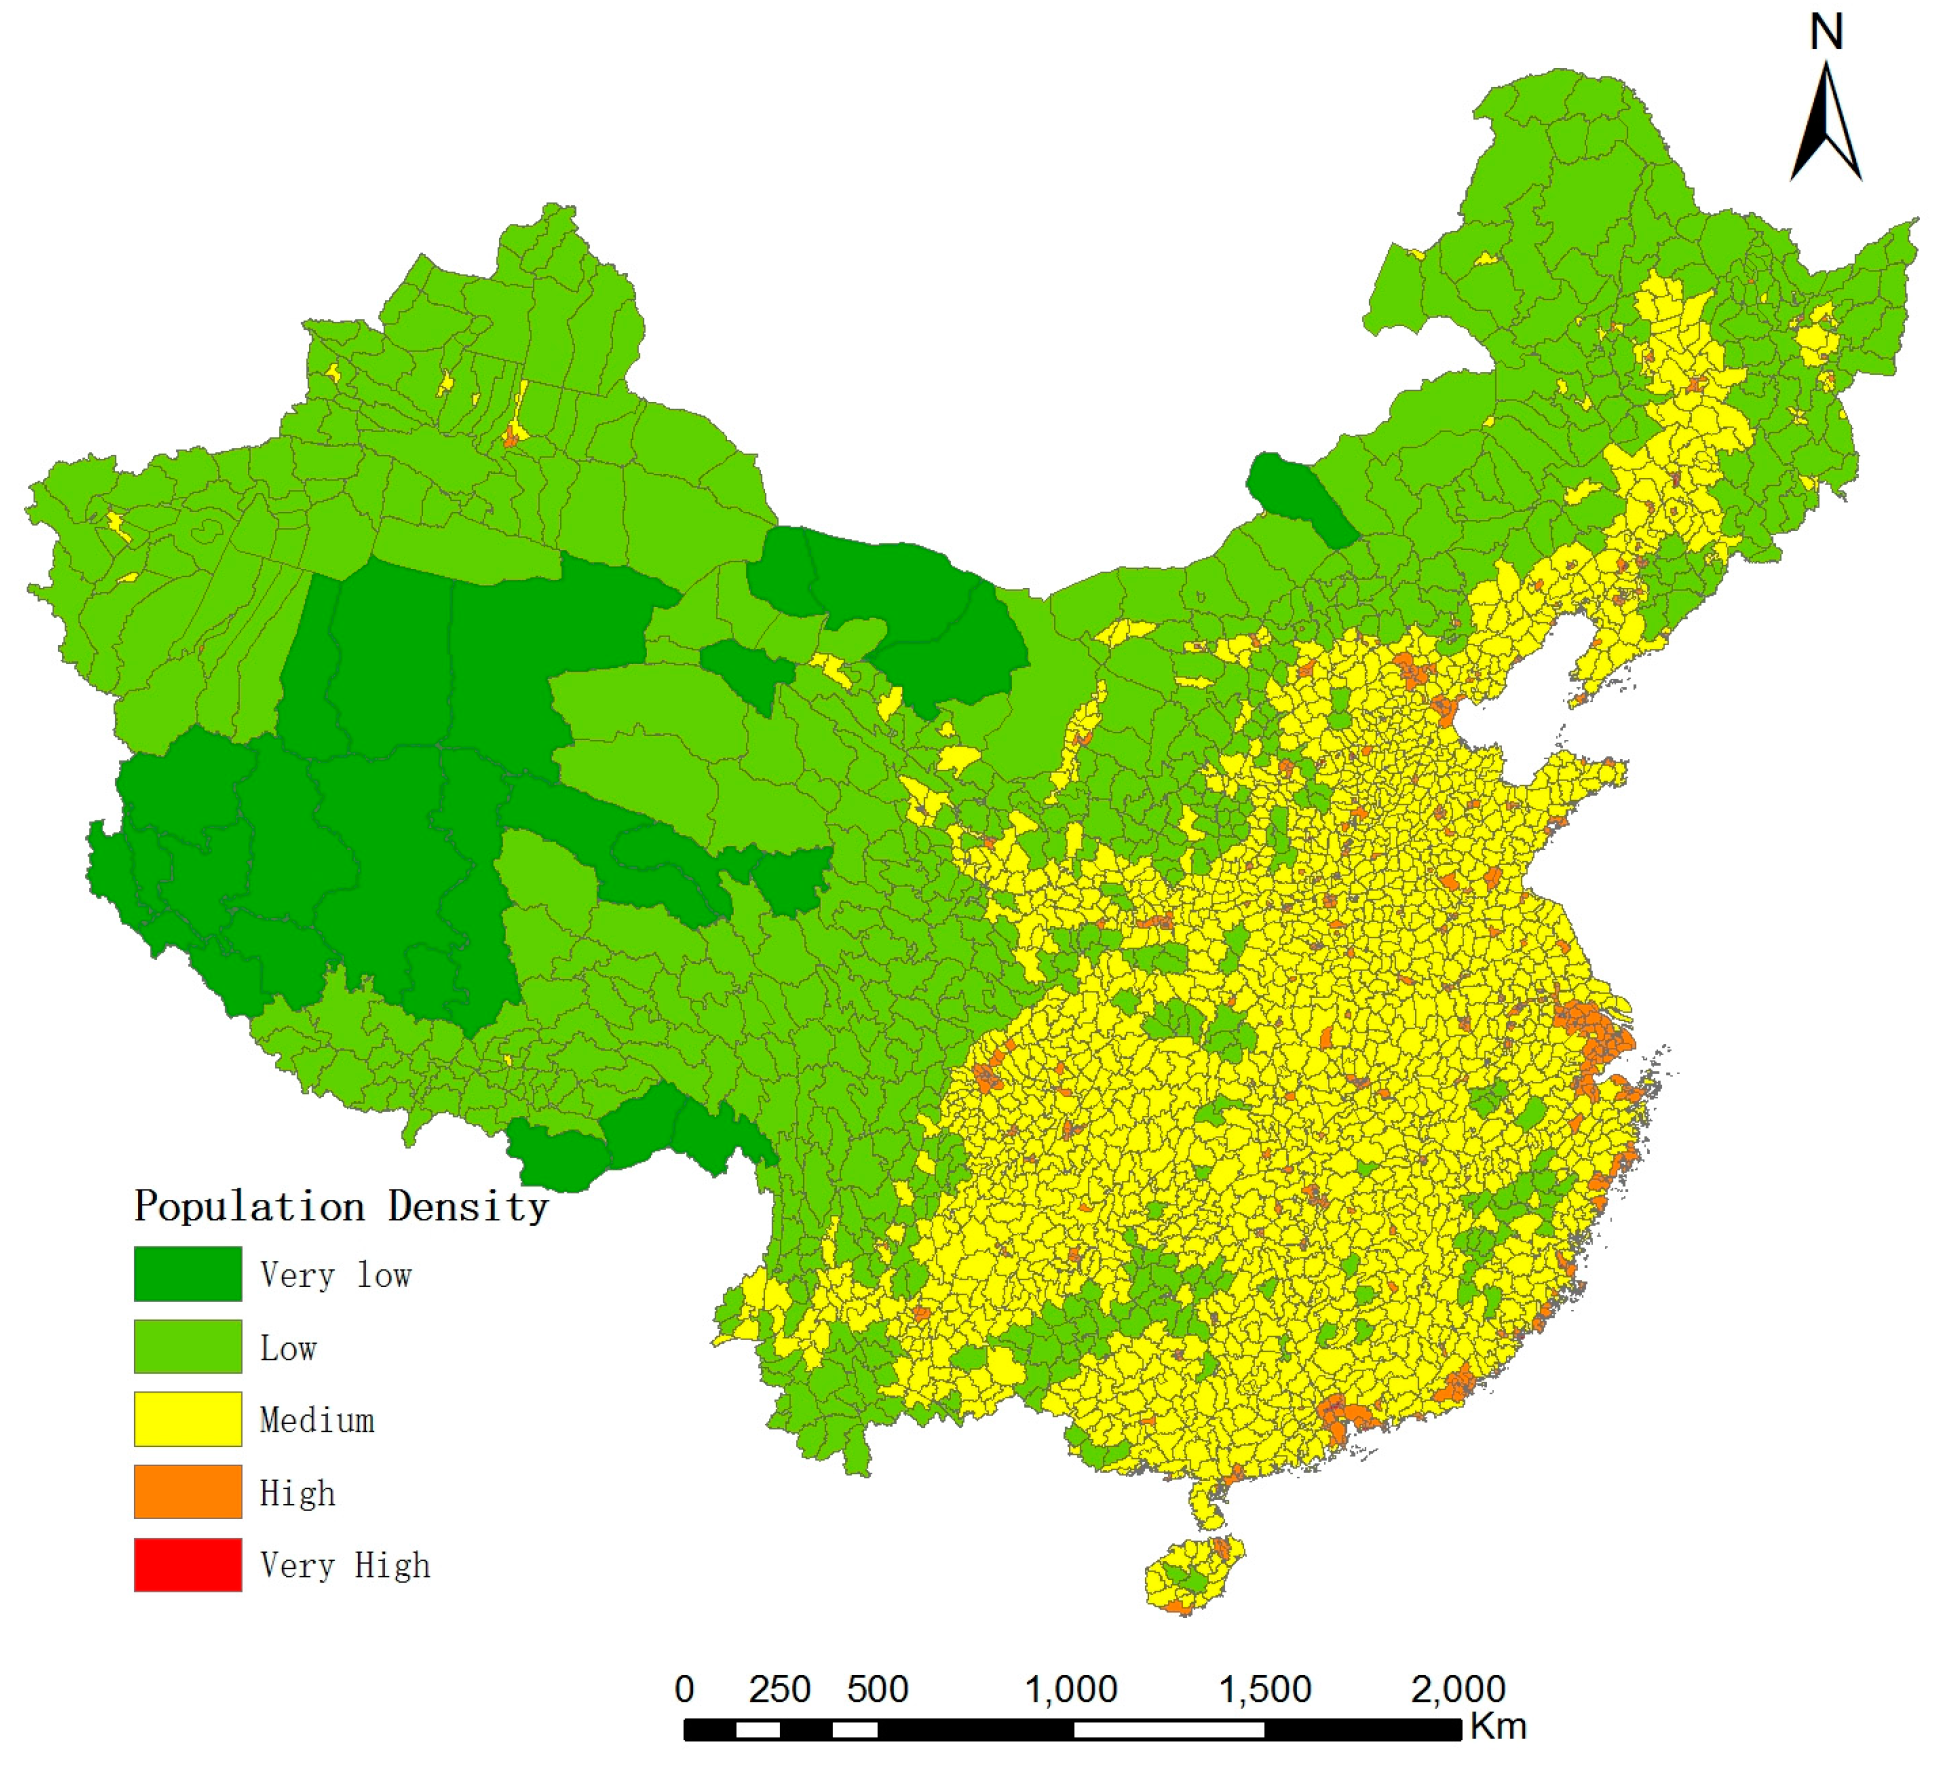
4.1. Spatial Distribution

The three regionally partitioned modes have their own distinct trends. In the terrain partitioned mode, eastern and central China are far superior to western China in terms of the analysis of the merits of spatial accessibility and the internal difference in spatial accessibility. In the economic development partitioned mode, areas with better accessibility to compulsory education are concentrated in the south coast, east coast, north coast, and middle Yangtze River regions; the shortest travel-to-school distance in these areas is significantly lower than that in other regions. These results are verified against relationships with the terrain, long-standing development strategies, and economic development of China. The western area has complex terrain, and its overall topography relief is larger than in the southeastern areas with flat terrain plains. These terrain situations significantly influence the distribution of settlements and the way to school. Since the reform and opening strategies, the eastern coastal areas dominate economic development, thereby marginalizing the other areas. This situation further results in an uneven economic development status. These strategies and the economic development have significant effects on the education resource allocation. In the province-level partitioned mode, the minimum internal differences (which mean the most balanced distribution of compulsory education facilities) are found in Shanghai, Chongqing, and Tianjin. Notably, the three cities are under direct control of the Central Government. They have a large population density and important economic, political, and cultural position in the country. This result indicates that the administration also influences the balanced distribution of compulsory education.
Five provinces (autonomous regions) belonging to the province-level partitioned mode have the maximum average shortest travel-to-school distance and the maximum Theil index. These provinces are Tibet, Inner Mongolia, Xinjiang, Heilongjiang, and Gansu. Therefore, these five provinces have the poorest accessibility to compulsory education and the worst regional balance. These results are related to the topography, population density, and degree of economic development of the provinces. These provinces must be prioritized for improvement to achieve balanced compulsory education at the national level.

4.2. Spatial Pattern

We explore the relationship among cluster, population, topography, and economic development data (as auxiliary data).
The nationwide LL cluster (cluster of counties with developed education) matches well with the nationwide relief degree of land surface (RDLS) (Figure 8). The first representative region “A1” in the figure is the plain area in central China: the average RDLS values in this area are from 0 m to 200 m; the main ringed provinces include Hebei, Henan, Jiangsu, Shanghai, and Jiangxi. The level of economic development of the region is also relatively high, especially in coastal regions such as Shanghai and Jiangsu. The second typical area is the Pearl River Delta region (region “A2” in Figure 8). This region mainly includes the Guangdong domain, extending into southern to northern Hainan. The RDLS values of this region are from 0 m to 500 m, a relatively flat range. This area is one of the leading areas of economic development in China, and it has a high population density. Meanwhile, the nationwide HH cluster (cluster of counties with undeveloped education) is more significantly similar to the nationwide population density (Figure 8). The two most significant regions are Tibet and Inner Mongolia (region “B1” and “B2” in Figure 8). Tibet has a complicated terrain and the largest RDLS. Tibet is also the poorest province in China, with its GDP among the lowest among all provincial administrative regions in the country. The second representative region is the Inner Mongolia region. The population density is concentrated in Hohhot and other relatively developed cities. Other areas are mainly sparsely populated, and they are the HH clusters in the education accessibility analysis. However, the economic development of Inner Mongolia is insignificantly lagging compared with the national level. The GDP ranking of this region is in the middle ranges for the country. The reason is that some counties in this area have the strongest economy in China.
Abnormal areas in the spatial pattern analysis include LH abnormal areas and HL abnormal areas. We statistically represent the economic development status and the location situation. LH areas are relatively developed regional counties, such as Hami City in Xinjiang; Dunhuang City, Jiayuguan City, and Yumen City in Gansu Province; and Manzhouli City and Hailar District in Inner Mongolia Autonomous Region. All these counties are relatively rich in the region and have dominated the top GDP rankings. Other counties with an LH-type distribution are Shangri-La County, Erenhot City, Kailu County, Bayan Obo Mine, Haibo Bay District, Jining District, Jiuyuan District, and Hondlon District. All of these counties are directly under the jurisdiction of municipal districts, and are concentrated areas of economy, politics, and culture. However, counties with an HL-type distribution are lagging in terms of accessibility to compulsory education. The accessibility of Dingnan County in Jiangxi Province, and Donglan County and Yangshuo County in Guangxi Province is relative to their economic development. Hence, these counties have low GDP rankings at the national level. The education accessibility of most counties is consistent with their GDP ranking. Only a few counties show accessibility that is inconsistent with their GDP ranking; these counties may have placed less emphasis on education.

5. Conclusions

The present analysis of compulsory education inequality can provide significant information to aid policy making for compulsory education in China, and can facilitate research on the equality and sustainable development of compulsory education. The main conclusions of this study are as follows:
(1) Obvious inequality is observed in the space accessibility to compulsory education in Mainland China. The overall trend and differences in space accessibility are clear on a county scale; specifically, accessibility decreases from west to east and from north to south. In the terrain partitioned mode, compulsory education facility distribution is obviously better in the eastern and central regions than in the western region; in the economic development partitioned mode, the education distribution is significantly better in the eastern coastal areas and in southern and northern counties than in the southwest, northwest, and other inland areas; in the province-level partitioned mode, the average shortest travel-to-school distance is found in Henan, Jiangxi, Guangdong, Hainan, and Shanghai Provinces. The longest travel-to-school distances are found in the provinces of Tibet and Inner Mongolia Autonomous Region.
(2) The Theil index shows different internal inequalities. In the terrain partitioned mode, the internal differences are much smaller in eastern and central China than in western China. Thus, the distribution of compulsory education is more balanced in eastern and central China that in western China. In the economic development partitioned mode, the maximum coefficient of the internal difference (the severest education inequality) occurs in middle Yellow River region; the minimum coefficient is observed in the southwestern region, the middle Yangtze River region, and the southern coastal region. In the province-level partitioned mode, the severest education inequality occurs in the northern provinces, such as Inner Mongolia, Gansu, Tibet, and Heilongjiang; provinces with slight education inequality include Shanghai, Chongqing, Tianjin, and some municipalities.
(3) The autocorrelation of spatial accessibility to compulsory education is significant, and obvious clusters are found. Cold-spot areas (clusters of good spatial accessibility) are numerous but small in size. These areas create a ring-shaped structure with Henan Province as the core. They are significantly distributed from Henan Province to eastern and southern China, intersecting in Guangdong Province, and passing some counties in Hubei, Hunan and Jiangxi Provinces. Hot-spot areas (clusters of weak spatial accessibility) are widely distributed, mainly in the northwest regions characterized by complex terrain and severe economic difficulty, including the provinces of Inner Mongolia, Tibet, and Qinghai.
(4) The spatial pattern analysis shows that a few abnormal counties show good (weak) spatial accessibility to compulsory education, whereas the surrounding counties have weak (good) accessibility. These abnormal counties are regional raised points or recessed points. The results for the abnormal areas are caused by a combination of economic and policy-based factors. These counties must be prioritized for improvement to ease the overall and local spatial inequality of compulsory education.
(5) We propose recommendations to policy makers for the purpose of gradually easing the inequality of compulsory education in Mainland China. Considering the topography, economy, and education policies in the country, policy makers must narrow the economic imbalance between coastal and inland areas to realize the aim of common prosperity as early as possible; construct and adjust educational facilities according to terrain; rationally allocate educational facilities and settlements to attain better education accessibility; improve the awareness of compulsory education in remote areas; and implement appropriate and effective education policies according to the actual situation of each area. For counties in hot-spot areas, policy makers must emphasize educational resources and education funding, and seek unified planning of regional education facilities considering residential distribution. We also suggest that policy makers extract the appropriate education policies and measures in cold-spot areas (such as Henan Province), and then apply these policies and measures in other provinces; strengthen the role of radiation in the regional recessed-point counties, which have significantly better accessibility than the surrounding counties; and improve the compulsory education status of the raised-point counties, which is obviously weaker than that of the surrounding areas.

Acknowledgments

This research was financially supported by the Special Fund of Ministry of Land and Resources of China in the Public Interest (ID 201511001).

Author Contributions

Yuan Gao and Yaolin Liu conceived and designed the experiments; Qingsong He and Lingyu Zhang helped in data analysis; Haofeng Wang and Enxiang Cai helped in language correction; and Yuan Gao and Yaolin Liu wrote the paper.

Conflicts of Interest

The authors declare no conflict of interest. The funding sponsors had no role in the design of the study; in the collection, analyses, or interpretation of data; in the writing of the manuscript, and in the decision to publish the results.

References

  1. Zhang, L.; Huang, J.; Rozelle, S. Employment, emerging labor markets, and the role of education in rural china. China Econ. Rev. 2002, 13, 313–328. [Google Scholar] [CrossRef]
  2. Oreopoulos, P. The compelling effects of compulsory schooling: Evidence from Canada. Can. J. Econ. 2006, 39, 22–52. [Google Scholar] [CrossRef]
  3. Acemoglu, D.; Angrist, J. How large are human-capital externalities? Evidence from compulsory-schooling laws. Nber Macroecon. Annu. 2000, 15, 9–59. [Google Scholar] [CrossRef]
  4. Hanushek, E.A.; Wößmann, L. The role of education quality in economic growth (Part I). Educ. Stud. 2007, 100, 86–116. [Google Scholar]
  5. Brunello, G.; Fort, M.; Weber, G. Changes in compulsory schooling, education and the distribution of wages in Europe. Econ. J. 2009, 119, 516–539. [Google Scholar] [CrossRef]
  6. Huffman, W.E. Decision making: The role of education. Am. J. Agric. Econ. 1974, 56, 85–97. [Google Scholar] [CrossRef]
  7. Yang, D.T. Education and allocative efficiency: Household income growth during rural reforms in China. J. Dev. Econ. 2004, 74, 137–162. [Google Scholar] [CrossRef]
  8. Albouy, V.; Lequien, L. Does compulsory education lower mortality? J. Health Econ. 2009, 28, 155–168. [Google Scholar] [CrossRef] [PubMed]
  9. Llerasmuney, A. The relationship between education and adult mortality in the United States. Gen. Inf. 2005, 72, 189–221. [Google Scholar]
  10. Wail, B.; Hanchane, S.; Kamal, A. A new data set of educational inequality in the world, 1950–2010: Gini index of education by age group. SSRN Electr. J. 2011, 104, 184–198. [Google Scholar] [CrossRef]
  11. Meschi, E.; Scervini, F. A new dataset on educational inequality. Empir. Econ. 2014, 47, 695–716. [Google Scholar] [CrossRef]
  12. Thomas, V.; Wang, Y.; Fan, X. A New Dataset on Inequality in Education: Gini and Theil Indices of Schooling for 140 Countries 1960–2000; The World Bank: Washington, DC, USA, 2002. [Google Scholar]
  13. Ajala, O.A.; Asres, K. Accessibility in equality to basic education in Amhara Region, Ethiopia. Ethiop. J. Educ. Sci. 2008. [Google Scholar] [CrossRef]
  14. Bennett, D.L. Educational inequality in the United States: Methodology and historical estimation of education Gini coefficients. Cent. Coll. Affordabil. Product. 2011. [Google Scholar] [CrossRef]
  15. Wu, H. Educational justice policy: Problem and solution. J. Northeast Norm. Univ. Philos. Soc. Sci. 2007, 2, 151–155. (In Chinese) [Google Scholar]
  16. Zhai, B. Demonstrative analysis on the equilibrium development of Chinese basic education. Educ. Res. 2007, 7, 22–30. (In Chinese) [Google Scholar]
  17. Hu, Y.Z. The Compulsory education policy choice from the perspective of the theory on equalization of basic public services. TsingHua J. Educ. 2009, 30, 66–72. [Google Scholar]
  18. Zhou, J.Y. A Construction of educational equity indicator system in China. Educ. Sci. 2006, 1, 13–15. (In Chinese) [Google Scholar]
  19. Wu, X. Economic transition, school expansion and educational inequality in China, 1990–2000. Res. Soc. Stratif. Mobil. 2010, 28, 91–108. [Google Scholar] [CrossRef]
  20. Hannum, E. Poverty and basic education in rural China: Villages, households, and girls’ and boys’ enrollment. Comp. Educ. Rev. 2003, 47, 141–159. [Google Scholar] [CrossRef]
  21. Xue, L.R.; Shi, T. Inequality in Chinese education. J. Contemp. China. 2001, 10, 107–124. [Google Scholar]
  22. Liang, X.F.; Qiao, T.W. Urban equity of compulsory education—Empirical data from a city. Manag. World. 2006, 4, 48–56. (In Chinese) [Google Scholar]
  23. National Education Supervision. State educational supervision report 2005—Balanced development of compulsory education: Public education resources disposition status. Educ. Dev. 2006, 9, 1–8. (In Chinese) [Google Scholar]
  24. Tsang, M.C.; Ding, Y.Q. Resource utilization and disparities in compulsory education in China. Econ. Educ. Rev. 2005, 2, 34–40. (In Chinese) [Google Scholar]
  25. Xue, H.P.; Wang, R. Education production function and the equity of compulsory education. Educ. Res. 2010, 1, 9–17. (In Chinese) [Google Scholar]
  26. Zhong, X.M.; Zhao, H.L. The equity of compulsory education in China: In the perspective of resources allocation. J Shanghai Univ. Financ. Econ. 2009, 6, 89–96. (In Chinese) [Google Scholar]
  27. Hannum, E.; Wang, M. Geography and educational inequality in china. China Econ. Rev. 2006, 17, 253–265. [Google Scholar] [CrossRef]
  28. Ogunyemi, S.A.; Muibi, K.H.; Eguaroje, O.E.; Fabiyi, O.O.; Halilu, A.S. A geospatial approach to evaluation of accessibility to secondary educational institution in Ogun State, Nigeria. IOP Conf. Ser. Earth Environ. Sci. 2014. [Google Scholar] [CrossRef]
  29. Han, Y.H.; Lu, Y.Q. Accessibility assessment and planning of public service facilities for education: A Case study on senior high schools in Yizheng City. Sci. Geogr. Sin. 2012, 7, 822–827. (In Chinese) [Google Scholar]
  30. Hu, S.Q.; Xu, J.G.; Zhang, X.; Cao, H.J. Temporal accessibility based educational facilities even development evaluation: Huai’an new city planning example. Planners 2012, 1, 70–75. (In Chinese) [Google Scholar]
  31. Kong, Y.F.; Li, X.J.; Zhang, X.F. Analysis of spatial accessibility for school redistricting in rural China: A case study of the secondary schools in Gongyi City, Henan Province. J. Remote Sens. 2008, 5, 800–809. (In Chinese) [Google Scholar]
  32. Akita, T. Decomposing regional income inequality in china and Indonesia using two-stage nested Theil decomposition method. Ann. Reg. Sci. 2003, 37, 55–77. [Google Scholar] [CrossRef]
  33. Ord, J.K.; Getis, A. Local spatial autocorrelation statistics: Distributional Issues and an Application. Geogr. Anal. 1995, 27, 286–306. [Google Scholar] [CrossRef]
  34. Legendre, P. Spatial autocorrelation: Trouble or new paradigm? Ecology 1993, 74, 1659–1673. [Google Scholar] [CrossRef]
  35. Anselin, L. Local indicators of spatial association—Lisa. Geogr. Anal. 1995, 27, 93–115. [Google Scholar] [CrossRef]
  36. Anselin, L.; Syabri, I.; Kho, Y. Geoda: An introduction to spatial data analysis. Geogr. Anal. 2005, 38, 5–22. [Google Scholar] [CrossRef]
  37. Pan, S.R. Physical Geography; Higher Education Press: Beijing, China, 1985. [Google Scholar]
Figure 1. Population density in study area.
Sustainability 08 01236 g001
Figure 2. Spatial accessibility in overall national scale.
Sustainability 08 01236 g002
Figure 3. The trend analysis of overall national scale.
Sustainability 08 01236 g003
Figure 4. Spatial accessibility to compulsory education set in grades in Province-level partitioned mode.
Sustainability 08 01236 g004
Figure 5. Theil index of spatial accessibility in Province-level partitioned mode.
Sustainability 08 01236 g005
Figure 6. LISA Cluster Map of spatial accessibility to compulsory education.
Sustainability 08 01236 g006
Figure 7. Hot-spot and cold-spot analysis Map of spatial accessibility to compulsory education.
Sustainability 08 01236 g007
Figure 8. The relationship among cluster of spatial accessibility, the relief degree and population density.
Sustainability 08 01236 g008
Table 1. Statistic data and Theil index of spatial accessibility in Terrain partitioned mode.
Spatial Accessibility (m)Eastern ChinaCentral ChinaWestern China
Average1315.161695.914093.59
Maximum2171.222854.4512,369.19
Minimum796.24739.181091.25
Theil index−0.04−0.020.22
Table 2. Statistic data and Theil index of spatial accessibility in Economic development partitioned mode.
Spatial Accessibility (m)Northern Coastal AreasThe Middle Reaches of the Yellow River RegionNortheast RegionEastern Coastal AreasThe Middle Reaches of the Yangtze River RegionSouthern Coastal AreasSouthwest RegionNorthwest Region
Average1344.324450.592149.351369.751434.491105.851571.445301.52
Maximum1599.7812,036.992854.452171.212079.701496.722413.3112,369.19
Minimum1014.34739.181662.68796.24849.13906.351091.251184.77
Theil index−0.01660.110919−0.00141−0.00792−0.01689−0.01203−0.017670.119914

