1. Introduction
Taiwan’s rivers are short and run fast, have difficultly storing water, and are unable to effectively form underground water from retained rainwater. The inadequacy of renewable water resources causes over-pumping of underground water and other unsustainable means of using water, leading to waste and shortages owing to non-uniform water resource distribution [
1]. Extreme weather that has been caused by climate change in recent years has greatly affected Taiwan’s water resources. The impact is increasing. For example, as the number of days of rainfall declines and the heaviness of rainfall in a single day increases, rainfall in the wet season (May–October) has come to account for 70 percent of all annual rainfall, even reaching 90 percent in southern Taiwan. Heavy rain and the rise in sea level, accompanied by typhoons, frequently result in severe flooding in low-lying areas along the southern cost, causing significant losses of agricultural products. These effects increase the difficulty of water resource use and management in Taiwan. Therefore, although Taiwan’s rainfall is 2.6 times the global average, Taiwan ranks 19th on the world’s water shortage list [
2].
Because of the lack of awareness of water consumption and water shortage in people’s everyday life, previous consumption and mismanagement have had a very serious impact on water resources. If humankind is at the top of the food chain, and water is at the very bottom, then water contributes to each bite of food and each sip of a drink. When the bottom level of the food chain is unstable, then the top level is likely to suffer [
3]. The primary consumer of water resources is the individual. An individual cannot live everyday life without using water. Therefore, Allan proposed the concept of “virtual water” as the total quantity of water that an individual effectively consumes across all products [
3]. Hoekstra proposed the term “water footprint” [
4]. An individual’s water footprint affects the water footprints of products, cities, and even a nation. The water footprint is the basic amount of water consumed. Water footprint studies have focused on countries or single crops, livestock, or products [
5,
6], and corresponding footprints have been used to elucidate the effectiveness of national policies, agricultural improvements, and corporate water-saving strategies. Lee and Lee attempted to examine the usage of water resources in cities and counties in Taiwan using blue water footprint calculations. However, individuals’ water footprints have not been investigated [
7]. An individual water footprint involves direct and indirect water usage that is associated with personal habits [
8]. More can be understood about the prevailing lifestyle in a region by observing individual water consumption, and better suggestions concerning the sustainability and management of water resources can be proposed.
In relation to Taiwan’s water resources and related issues, Yunlin County faces more water resource-related difficulties than any other county in Taiwan. Yunlin County is a very important county for agriculture. However, 13 out of 20 townships in this county are located on areas of land subsidence. Coastal townships cover an area of severe land subsidence that floods during every typhoon. Kouhu Township’s Cheng Long Wetland is naturally low-lying. Additionally, years of the over-pumping of underground water, and salt water intrusion caused by Typhoon Wayne and Typhoon Abby in 1986 and Typhoon Herb in 1996, led to the formation of an abandoned wetland. The impact of this wetland on the region’s industry has been substantial, because Yunlin County’s extraction of underground water—which has led to the improper use of water resources—is inseparable from the water usage habits of the residents. Therefore, this study involves a sampling survey of each township in Yunlin County to understand individuals’ water demand, and uses the “water footprint calculator” [
8] to calculate the average individual’s water footprint in Yunlin County. Variations among townships are considered to elucidate the relationship between the socio-economic background and water footprint of an individual. This study also examines whether townships with significantly different individual water footprints also vary in the characteristics of their industries, to elucidate variations in individual water usage among rural and urban regions with various types of industry.
1.1. Concept of Water Footprint
Over the past decades, socio-economic damages have been increasing due to the over-concentration of people and properties in hazardous areas, making many of today’s human settlements become potential disaster hotspots [
9,
10]. This tendency will persist unless disaster risk governance becomes part of urban planning and governance. Therefore, governments at all levels must incorporate resilience into their daily decision–making about urban development and governance [
9]. The potential climate change risk is changing dramatically with time, location, exposure, vulnerability, and resilience [
10]. As a result, one of the basic assumptions of the risk society is that change in risk perception can lead to change in trust perception, both of which inform and stimulate the need for flexible and innovative planning theories and practices to deal with the uncertainties of the future. City plans have thus become extraordinarily critical tools of the risk society for coping with risk in general and climate change risk in particular [
11].
On March 22 of each year, the United Nations promotes “World Water Day”. In 2015, the theme of the day was “Water and Sustainable Development”, which elucidated the relationship between water resources, health, industry, energy, food, and other aspects of human life. In that year, the UN comprehensively reviewed with a focus on sustainable development. They considered seven major topics around water resources, one of which was “Water as Food”. The United Nations warned that if countries around the world do not take any action, then the world will plunge into a water crisis, and the first to suffer will be those countries that are already suffering from drought. Many countries are seriously wasting water resources, and if this trend continues, by 2025, two-thirds of the global population will be living in countries with water shortages, and by 2030, the world’s availability of freshwater resources will be 40% lower than it is today. Global population growth and urbanization have caused the rate of growth of water demand to be double that of the population. Increases in urban populations will result in a lack of water resources and water shortages. The global population is projected to reach nine billion by 2050, of which 69% will live in metropolitan areas; this proportion substantially exceeds the current 50%. Global water demand will increase by 55% to that year, causing water resource shortages and burdening the environment [
12].
The main purpose of the concept of the water footprint is to quantify the environmental burden imposed by individuals’ demand for water. The first water footprints were based on the concept of “Virtual Water” proposed by Professor John Anthony Allan in the early 1990s. Later, in 2002, Professor Arjen Y. Hoekstra proposed the term “Water Footprint” [
13]. Allan believed that since water resources are essential to food production, they are contained within various agricultural products [
3]. The water that is contained within an agricultural product can be reversely transacted simultaneously with the transaction process. Water resources that are contained within agricultural products are known as virtual water resources. For example, 1 kg of wheat contains 1 cubic meter of the virtual water resource; and importing 1 ton of wheat is the equivalent of importing 1000 cubic meters of water resources.
Chapagain and Hoekstra [
14] argued that not only the amount of water that is used directly in production process, but also the amount of water that is indirectly used should be included in the calculation of the total water consumption associated with a population’s activities in a given region. Restated, the impact of water use on the environment can be elucidated by calculating the amount of virtual water used, which is the sum of the amount of a region’s directly used and the amounts of its indirectly used water. This calculation relates to the concept of the water footprint. The water footprint is calculated by the “bottom-up” method, in which the direct and indirect water used to manufacture each product and to perform each activity are summed. Water footprint can also be calculated using the “top-down” method using input–output model projections. However, when a water footprint is calculated, the lack of relevant information is frequently limiting, and the amount of virtual water that is used upward or downward throughout a product’s life cycle cannot be determined [
7].
Ecologically, the use of water resources exerts environmental pressure that depends on the amount used. The amount used is essential information for reference in water resource management. The development of a water footprint has followed that of the ecological footprint and the carbon footprint, and no complete or consistent calculation methods are currently used internationally [
15]. Currently, the two internationally used calculation types are as follows. One is given by the ISO14045 water footprint standard, proposed by the International Organization for Standardization (ISO). This method uses life cycle analysis to assess the water supply and drainage that are required during the production of a product, production process, and packing process, along with water footprint-based approaches for various regional environments or under various socio-economic conditions. The other type of calculation is based on the Water Footprint Network (WFN).
According to “The Water Footprint Assessment Manual-Setting the Global Standard”, published by the WFN in 2011, water footprint calculations do not include traditional water consumption, but do include direct and indirect freshwater use. The manual separates water resources into three types, which are blue water, green water, and grey water; so, the Blue Water Footprint, the Green Water Footprint, and the Grey Water Footprint can all be calculated. The Blue Water Footprint corresponds to surface water and groundwater; the Green Water Footprint corresponds to rainfall reserves from the soil (present only in agricultural and forestry products); and the Grey Water Footprint refers to the freshwater that is required to absorb pollution under existing water quality standards. Calculations of water footprint do not include non-consumptive water use (return water) [
16], which can be further explored.
A country’s total water footprint calculation should include blue, green, and grey water footprints, according to Equation (1) (unit: liter or kg) [
16]:
Currently, most research regarding water footprint focuses on national or regional levels, resulting in limited city or county-level water footprint information. Moreover, there are very few personal water footprint studies in Taiwan. This case study can therefore serve as a pilot study.
1.2. Calculation of an Individual’s Water Footprint
The calculation of an individual’s water footprint includes the daily internal water and virtual water consumption by an individual. Not only is water consumed in the process of drinking water, coffee, and bathing or hand-washing, it is consumed in the processes upon which coffee-drinking, for example, depend—such as cultivation, harvesting, processing, packaging, and transportation. This idea is captured by the concept of virtual water. For example, making a hamburger consumes approximately 2400 L of water, and the water footprint for the manufacture of a cotton shirt may be as high as 2500–2900 L. These numbers seem huge because many other raw materials or semi-finished products are considered in the “cradle to grave” analysis of the final product of interest. Additionally, the manufacturing of these things consumes much water. For example, a hamburger contains patties, vegetables, eggs, and perhaps cheese; therefore, making a hamburger requires approximately 2400 L of water [
17]. Moreover, the amount of water implicit in the meat production process is much higher than that in the production of other crops [
18,
19].
Economic growth and personal wealth are changing our diets from traditional starch-based to meat and dairy-based. Accordingly, the demand for water is increased, because producing 2 kg of rice requires approximately 3500 L of water; producing 1 kg of meat requires 15,000 L of water, and producing a cup of coffee requires 140 L of water [
20]. In the past 30 years, such a dietary change has had a great impact on water use, which is likely to continue into the middle of the 21st century [
18,
19]. The global population is increasing at the same time as the aforementioned change in eating habits, and is expected to increase food demand by 50% by 2030 (70% by 2050), while the demand for hydroelectric and other renewable energy sources will increase by 60%. These problems are all interrelated; for example, increasing agricultural production will increase water and energy consumption, which will result in serious competition between areas where the water is needed [
20].
Reducing food waste will help in the long-term management of water resources. It is estimated that 21% of our freshwater use goes towards growing food that is wasted. If all of the wasted food were grown in one place in the US, it would cover approximately 80 million acres of farmland, or over three-quarters of the state of California. Furthermore, growing the food on this wasteful farm would use up all of the water used in California, Texas, and Ohio [
21]. Wasting food not only causes huge economic losses and environmental costs, it also wastes extensive water resources [
22]. The solution to water resource and food security problems is changes in human behavior.
“Water” is involved in all production processes; water is required for all forms of agriculture, and is required to manufacture food. Agriculture and food production consume 70% of the world’s available water resources. To satisfy the daily food requirements of an individual, production processes that consume 3000 L of water are required. Every year, one-third (up to 1.8 billion tons) of all food is wasted globally, resulting in economic losses of $750 billion and huge environmental costs. Food waste uses nearly 1.4 billion hectares of land, equivalent to 28% of the world’s agricultural land area. Therefore, the United Nations asserts that we need to face the importance of this problem, and points out many ways of saving water to allow everyone to enjoy adequate nutrition and food at the same time [
23], such as the following:
- (1)
Adopting a healthy and sustainable diet
- (2)
Purchasing products with low water consumption
- (3)
Reducing food waste
- (4)
Improving production techniques to reduce water use
Therefore, an individual’s water footprint can be calculated from water resource consumption across all areas of the individual. An individual’s water footprint generally comprises components in the following three categories. (1) Food (includes the growth, transportation, and preparation of various types of food); (2) other household water use (includes sanitation, bathing, laundry, gardening, irrigation, and maintenance), and (3) water use implicit in the production of all products. This category involves the most difficult calculations, because too many variables are involved in the production, transportation, and marketing of products [
24]. If everyone begins to change their lifestyle and consumption behaviors, understand the water footprint of each foodstuff and adjust their eating and water use habits accordingly, and stop wasting food, then not only can the world be fed, huge amounts of water resources will be saved, and the goal of sustainable water resource use will be met.
3. Results
After questionnaires were collected and the answered encoded, the answers were input into the water footprint calculator, and the mean (direct) everyday water use per capita, virtual (indirect) water use, and water footprint results were obtained (
Table 1). The calculation of everyday water use (direct) was based mainly on answers from interviewees to questions about the amount of water they used in doing laundry, bathing, flushing the toilet, washing the car, and taking care of fish and plants. Virtual (indirect) water use is obtained from information about an individual’s type of diet and amount of food eaten, pets, and the “hidden” water used in other consumption. The water consumed by omnivorous people greatly exceeds that used by vegetarians, because the production of livestock and meat consumes more water. Jalava et al. [
18] noted that if an individual’s eating habits can be changed from meat-heavy to the healthy diet that is recommended by the World Health Organization, the global green water footprint would be reduced by 23%, and the global blue water footprint would be reduced by 16%. The total amount of water used in everyday life and the amount of virtual water used is the individual’s daily water footprint.
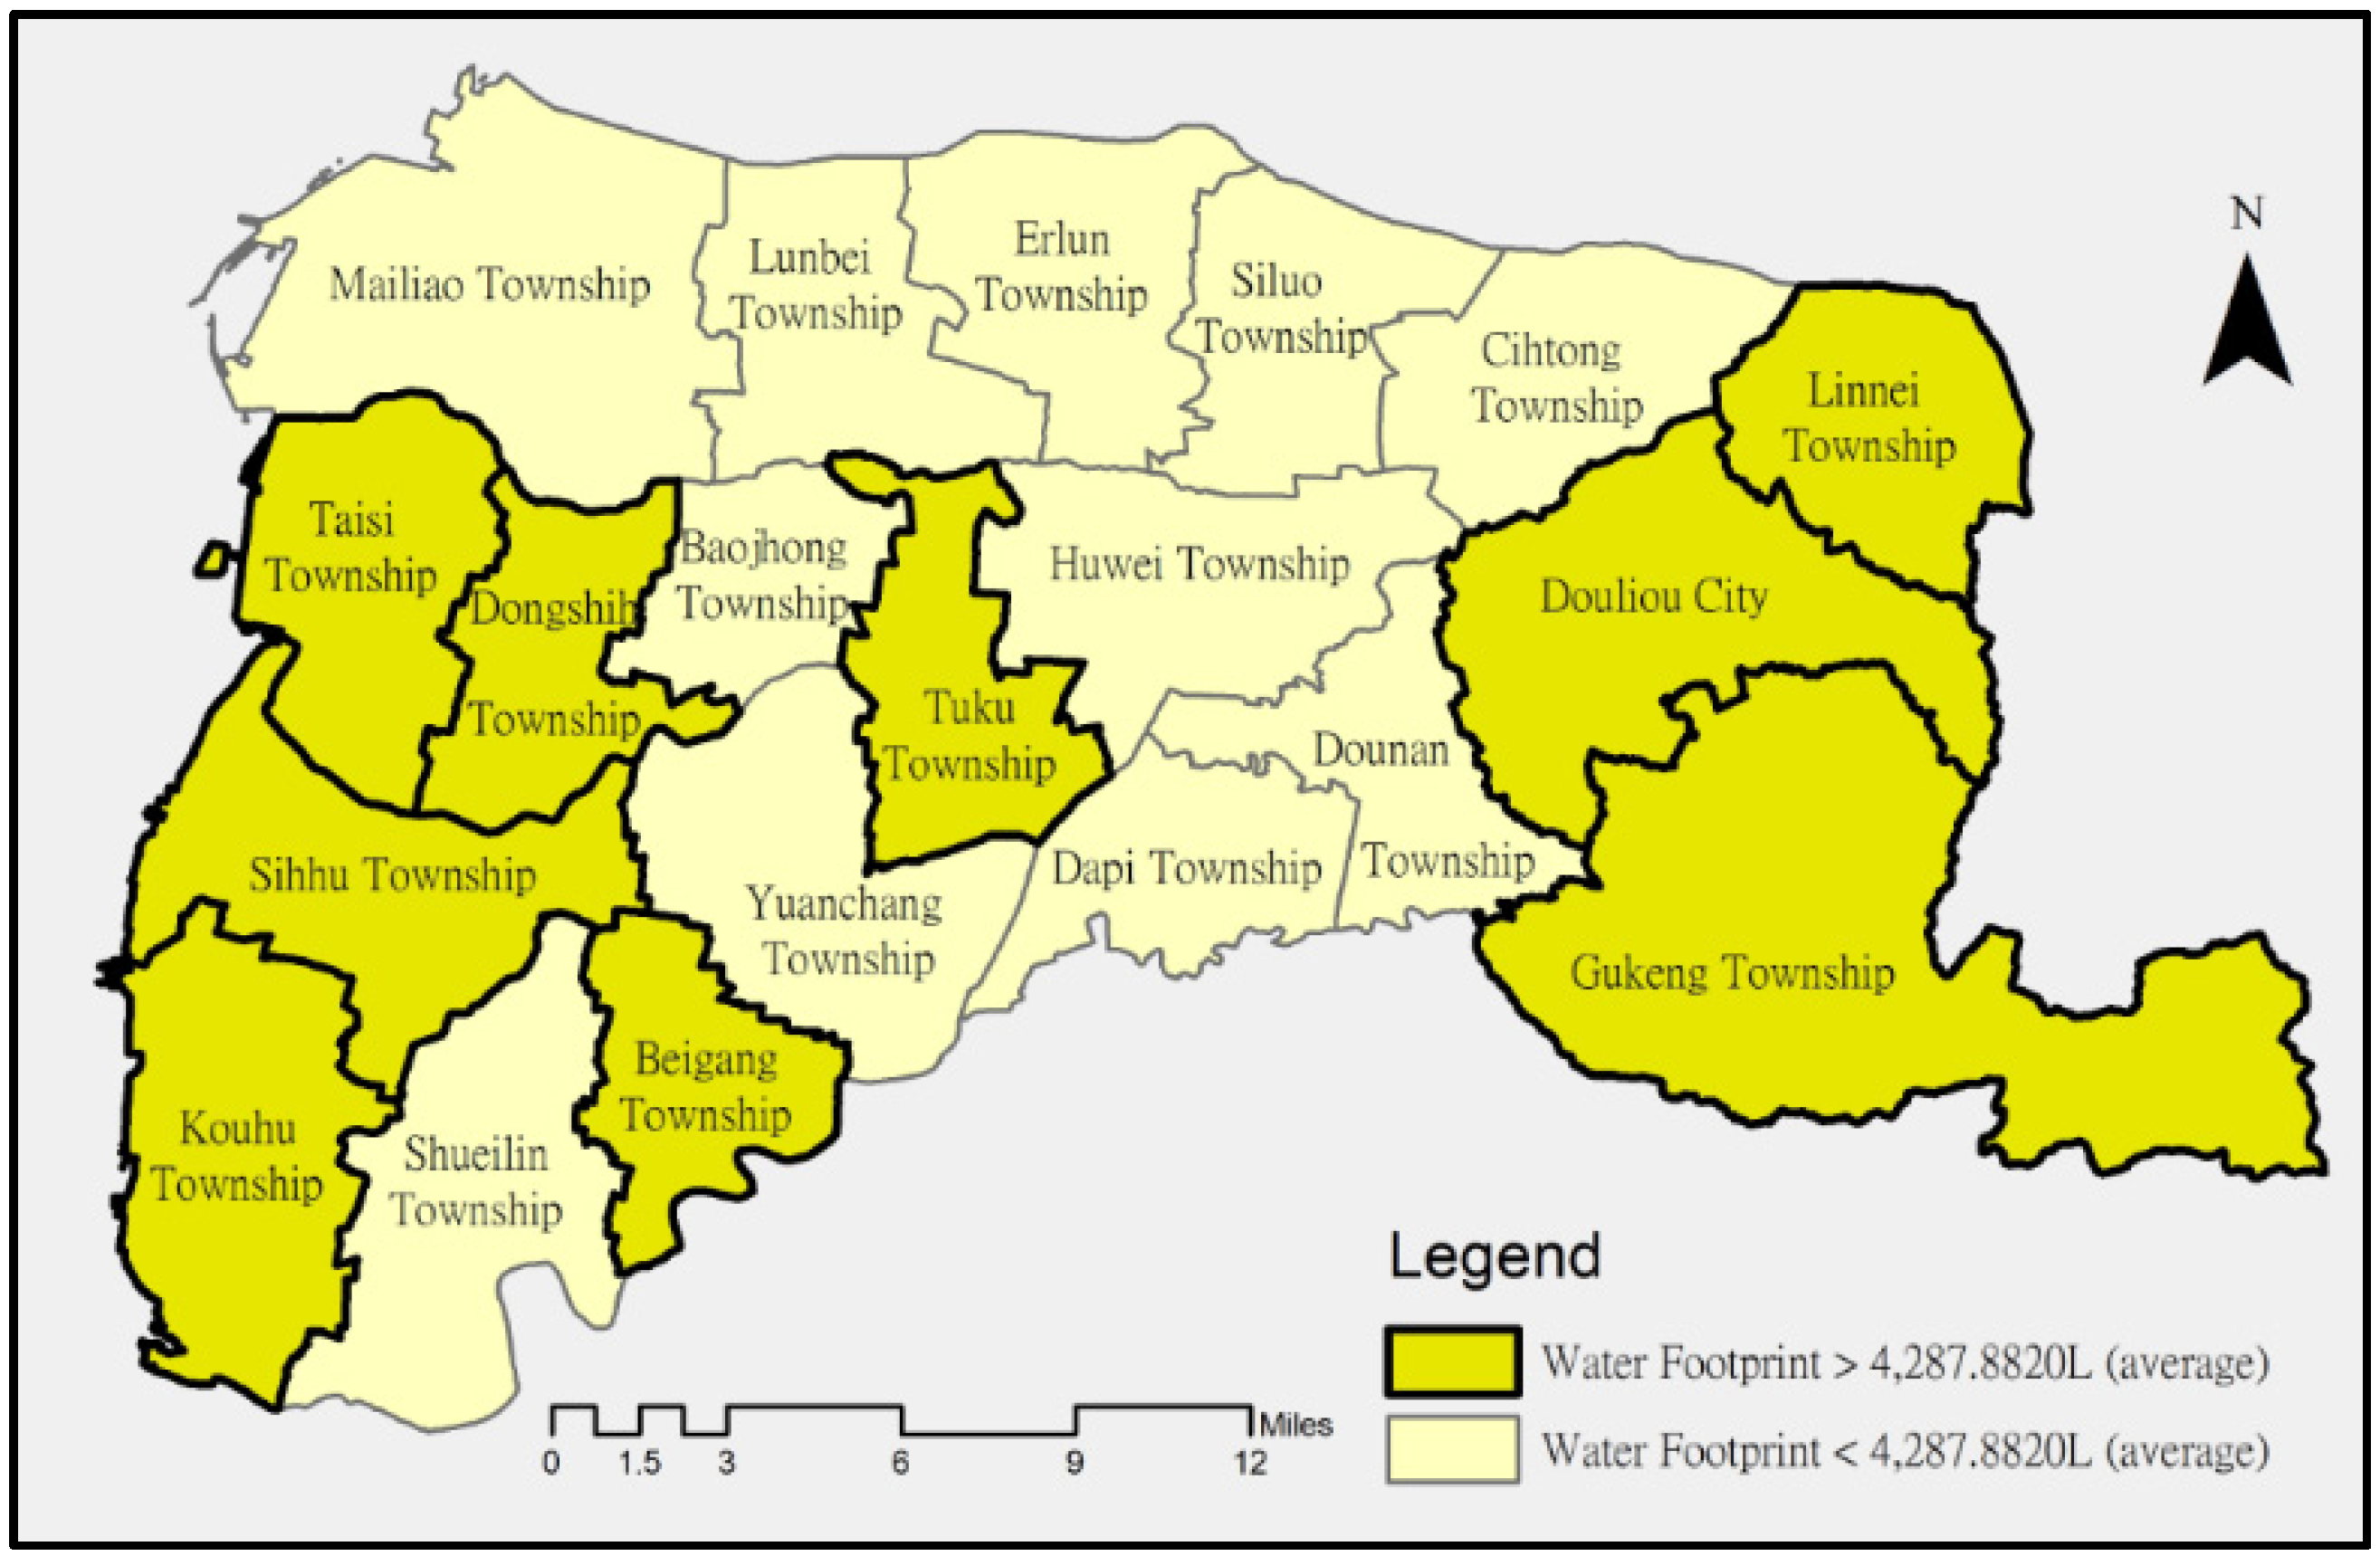
The five townships with the highest daily mean water footprints per capita are Gukeng Township (5506.26 L/person), Linnei Township (5247.27 L/person), Taixi Township (5137.86 L/person), Dongshi Township (4967.56 L/person), and Kouhu Township (4759.00 L/person), most of which are located in mountainous and coastal areas. The daily water footprint per capita in Yunlin County is 4287.88 L. In the county, Douliu City, Beigang Township, Gukeng Township, Tuku Township, Kouhu Township, Sihu Township, Taixi Township, Linnei Township, and Dongshi Township have larger footprints than the county’s average, while Huwei Township, Xiluo Township, Dounan Township, Mailiao Township, Citong Township, Erlun Township, Yuanchang Township, Shuilin Township, Lunbei Township, Dapi Township, and Baozhong Township have smaller footprints than the county’s average (
Figure 1).
Taiwan’s average blue water footprint per capita in 2011 was 784 cubic meters (or 2147.95 L per person per day). The average blue water footprint per capita globally is 163 cubic meters (or 446.58 L per person per day) [
15]. In Yunlin County, pressure on water resources is greater than in the rest of Taiwan and the rest of the world.
One-way analysis of variance (one-way ANOVA) of individuals’ daily water footprints and socio-economic backgrounds revealed that gender, occupation, age, education level, and annual income did not affect individual water footprints in Yunlin, indicating that the water footprint is unrelated to socio-economic background. The average water fee per household per year in Taiwan (9.24 NTD/m
3) is the third lowest in Asia. Furthermore, the average water fee in Europe is 2.3–9.4 times that in Taiwan [
27]. The low water fee in Taiwan can explain why the average blue water footprint (784 m
3) in Taiwan is much higher than the world average (163 m
3) [
15]. This perhaps can explain why people in Taiwan use a large amount of water, regardless of their socio-economic status. Consequently, how to appropriately adjust the water fee and further reduce water consumption is a big challenge in the face of growing extreme weather events. One-way ANOVA was performed on both individual daily water footprints and the townships in Yunlin County. The results revealed that the relationship between the daily water footprints of townships in Yunlin County and individuals was significant (0.026,
p < 0.05), indicating that individual daily water footprints varied among townships. A post-test was performed.
Table 2 compares the results of the Games-Howell post hoc test on the daily water footprints of townships in Yunlin County and individuals:
The results of the Games-Howell post hoc tests reveal that an individual’s daily water footprint in Douliu City and Gukeng Township significantly exceeds that in Mailiao Township. Analyses of individual water footprint surveys revealed that the main variation was in virtual (indirect) water use (
Table 1). Individual virtual water use in Douliu City and Gukeng Township exceeded that in Mailiao Township. The calculation of virtual water use was based mainly on individuals’ dietary habits, elicited from the individual water footprint questionnaire. Jalava et al. [
18] suggested that dietary habits affect the amount of virtual water used by an individual. Douliu City is the county’s administrative center, and Gukeng is important for tourism. Both townships have well-developed living functions and food and beverage industries. In contrast, Mailiao is dominated by the naphtha cracking industry, and it has less-developed living functions. Its population has increased in recent years on account of work opportunities rather than improved living conditions. This fact may explain why individual virtual water use in Douliu City and Gukeng Township exceeds that in Mailiao Township. The location quotients of these three cities and townships are obtained as evidence of the difference among water footprints, industries, and living conditions (
Table 3).
Table 3 shows that the location quotients of the accommodation and food and beverage industries in Douliu City and Gukeng Township are significantly higher than those in Mailiao Township. The individual virtual water use in the aforementioned industries is larger than that in the other industries [
18,
19].
4. Conclusions and Suggestions
Coping with climate change in human settlements is a complex and multidisciplinary challenge that requires a “paradigm shift” toward transdisciplinary thinking [
11]. The increasing complexity and interconnectedness of issues in disaster risk governance demand much more flexible and innovative solutions that are pertinent and sensitive to local characteristics. Therefore, analytical capacity together with recognition of the local context is necessary [
28], as well as a capacity for transdisciplinary thinking and public–private partnership. This case study can provide such a paradigm shift and a solution regarding sustainable water management.
With respect to the current situation regarding water resources, since the wind is strong and rivers end in coastal areas, such areas lack water for irrigation and breeding, causing residents of Yunlin’s coastal areas to extract underground water for irrigation, breeding, and even domestic use [
25]. However, a comparison of average daily water footprints per capita (
Table 1) and daily water footprints among townships within the county using one-way ANOVA (
Table 2) reveals that regions with the largest individual water footprints are in the coastal areas, such as Kouhu Township and Taixi Township, and in mountainous areas, such as Gukeng Township, Mailiao Township, Douliu City, and Linnei Township. Individual water footprints vary significantly among Douliu City, Gukeng Township, and Mailiao Township. Individual water footprints in Douliu City and Gukeng Township exceed that in Mailiao Township. The mean daily water footprints per capita in Douliu City and Gukeng Township exceed that in Mailiao Township. The main variation is in virtual (indirect) water use. The aforementioned results show that residents’ water use habits are related to the city’s prevailing industry. In Douliu City and Gukeng Township, tertiary industries—especially accommodation and food and beverage industries—dominate, and have a higher location quotient in those locations than in Mailiao Township. In Mailiao Township, manufacturing—a secondary industry—dominates. Therefore, flourishing regions with tertiary industries exhibit higher virtual water consumption than regions with secondary industries.
Douliu City, Gukeng Township, and Mailiao Township all have different urban and rural development patterns. Douliu City is the capital of Yunlin County; its commercial and industrial areas are well developed, and it has active living functions. Hushan Reservoir is located at the intersection of Douliu City and Gukeng Township, causing the intersection to have relatively abundant water resources. Douliu City also has the county’s first sewage treatment plant (water recycling center), making residential water drainage more convenient. Therefore, Douliu City’s water supply and remediation services are more developed than in the two townships. Owing to commercial activities and its population concentration, Douliu City has more developed tertiary industries (especially accommodation and food and beverage industries) than the other townships. These industrial conditions and water resource-related advantages are likely to increase the water footprints of individuals in the city. The calculations of individuals’ mean daily water footprints (
Table 1) show that the virtual water footprint in Douliu City is high, and the virtual water footprint is related mainly to dietary habits. This finding is consistent with the development status of the accommodation and food and beverage industries in Douliu City.
Gukeng Township is the township with the most tourism in Yunlin County. It is also the source of the county’s water. Therefore, its industries are mostly agriculture (primary industry) and arts, entertainment, and recreation services, accommodation, food and beverage industries, and support services (tertiary industry). However, in the provision of tourism services, both individual direct and individual virtual water use are increased [
29]. The calculated average individual daily water footprint in Gukeng indicates that this region has higher direct or virtual water use than the other townships.
Mailiao Township is dominated by manufacturing (secondary industry), owing to the presence of Formosa Plastics Corp’s (FPC) sixth naphtha cracking complex. However, in Mailiao Township, the wind is strong and rivers end, and water is not used for household and agricultural purposes. Most water is consumed for industrial purpose. Water is directly delivered from the Ji Ji River Dam. Therefore, the location quotient of Mailiao Township (
Table 3) reveals that the fishing (mostly fish farming) (primary) industry there is well developed. In the absence of agricultural water resources, the over-pumping of underground water for breeding is inevitable. With respect to secondary industry, manufacturing is well developed and mainly affects the industrial water resources. Therefore, industrial development in Mailiao Township has little effect on the individual use of water. The calculations of average daily water footprint per capita indicate that the individual water footprint in Mailiao Township is smaller than in the other townships.
This study suggests that, with respect to individual water use habits, Douliu City and Gukeng Township should encourage individuals and households to conserve water to achieve the goal of “reusing water resources and wasting no food”. While improving individual water use habits in Mailiao Township, attention should be paid to the reuse and recycling of industrial waste water to prevent shortages of water for industrial use and to avoid the continuous over-pumping of underground water, to achieve the goal of sustainable water resource use.
Humans use the equivalent of 1.6 planets to provide the resources we consume and manage our waste. This indicates that currently it takes the Mother Earth one year and six months to regenerate what we consume in a year [
30]. This study explores the water footprint in Yunlin County, comparing the research results with global average reveals that residents in Yunlin County consume much larger water footprint than the world average, indicating that sustainable water management policies and strategies should be adopted.
Cities have to learn from the past and the present in order to make plans for the uncertainties of the future [
11]. This study presents only a preliminary calculation of the individual water footprint in Yunlin County, and compares townships in terms of individual water footprints and industry types in order to elucidate the relationship between individual water use and regional industries. Further research should be conducted on water resources in Yunlin County to examine relevant issues and strategies to preserve water resources in Yunlin County, from the perspectives of both individual behavior and industry. The “individual water footprint calculator” will need to be reviewed in the future (for example, individual daily water use habits must be captured more accurately, and questionnaires must be made easier to complete). The survey procedure can be enhanced, and supplementary methods should be adopted to make follow-up studies more effective.


