Article

Technical Performance and Environmental Effects of the Treated Effluent of Wastewater Treatment Plants in the Shenzhen Bay Catchment, China

1
Key Laboratory of Microorganism Application and Risk Control (MARC) of Shenzhen, Graduate School at Shenzhen, Tsinghua University, Shenzhen 518055, China
2
Shenzhen Urban Planning and Land Resource Research Center, Shenzhen 518034, China
*
Author to whom correspondence should be addressed.
Sustainability 2016, 8(10), 984; https://doi.org/10.3390/su8100984
Submission received: 24 July 2016 / Revised: 18 September 2016 / Accepted: 20 September 2016 / Published: 29 September 2016
(This article belongs to the Section Environmental Sustainability and Applications)

Abstract

:
Technical performance and effluent environmental impact of seven wastewater treatment plant (WWTPs) in the Shenzhen Bay Catchment, China were examined. All WWTPs had good performance in the removal of chemical oxygen demand, biochemical oxygen demand, and suspended solids, while total nitrogen and total phosphorus removal should be enhanced to improve the comprehensive pollutants removal loading rate. The effluent eutrophication effect from WWTPs was in the range of 0.0028–0.0092 kg/m3, and nitrate was the major contributor. The effluent greenhouse gas emission of WWTP1–7 was in the range of 3.23 × 10⁻⁵–8.70 × 10⁻⁵ kg·CO2/m3. The effluent eutrophication effects and greenhouse gas emission of WWTPs could be reduced by decreasing the effluent total nitrogen concentration. The ecological risk and healthy risk of heavy metals were low. Among examined heavy metals, lead contributed the most to the ecological risk while arsenic contributed most to the human health risk. The human health risk of microbial pollutants of WWTPs1–7 was in the range of 0.0024–0.0042 DALY (Disability Adjusted Life Years). Finally, an ecosystem-based WWTP framework was proposed to systematically include all environmental effects so as to support the sustainable development of WWTPs.

1. Introduction

Nowadays, water quality and safety has become one of the most concerning environmental issues. Wastewater treatments plants (WWTPs) are important facilities to reduce pollutants discharging into water bodies. However, WWTPs are also recognized as important sources of pollutants to aquatic environment [1,2,3,4], and may lead to serious secondary pollution or environmental impacts, such as greenhouse gas emission, eutrophication, and so on [5,6]. Therefore, WWTPs should maximize the pollutant removal and simultaneously minimize the effluent impact. Due to the worldwide shortage of water resources, the treated effluent from WWTPs are usually reused for agricultural irrigation, road washing, surface water augmentation, or other applications [7]. Correspondingly, water reuse requires a higher quality of the effluent for ensuring water safety, especially for controlling microbial contaminants, heavy metals, and some other pollutants that are pathogenic or toxic [8]. How the operating performance and effluent quality of WWTPs is evaluated so as to guide the operation or upgrading of WWTPs is essential for guaranteeing the safety of water and the environment.
Due to high water quality requirements and climate change, eutrophication and greenhouse gas (GHG) effects are two of the most highly concerning aspects among environmental impacts of WWTPs [6,9,10]. The effluent nitrogen, phosphorus, and organic compounds, such as chemical oxygen demands (COD), are the main pollutants leading to eutrophication [11]. These environmental impacts could be effectively reduced by enhancing nutrient removal to lower effluent pollutant concentration from WWTPs. The GHG emission from WWTPs include direct emission and indirect emission. Direct emission includes nitrous oxide (N2O) emission during biological nitrogen removal (both nitrification and denitrification processes), methane (CH4) emission during anaerobic treatment processes, and N2O emission due to aquatic denitrification of the discharged nitrogen in the treated effluent [12].
Recently, ecological risk has received a significant amount of attention [10]. Heavy metals are a type of toxic chemical which can induce ecological risk and impact human health. As heavy metals are non-biodegradable and will accumulate in the natural environment, a slight concentration of heavy metals, even at a trace levels, may cause serious health or ecological risk [13]. WWTPs are a prime source of aquatic heavy metals [14]. There are several pathways that heavy metals deriving from WWTPs affect ecological safety and human heath, including WWTPs discharging into surface water, reclaimed water used for irrigation, and landfill of sludge, etc. A number of studies have been devoted to revealing the ecological risk or human health caused by landfill of sludge, agricultural irrigation of reclaimed water, and contamination of underground water [15,16,17,18,19,20,21]. Although the treated effluent from WWTPs can be exposed to humans through different exposure pathways [22,23], few studies have focused on the health risk of heavy metals in WWTP effluent.
Microbial pollutants are an important parameter of WWTPs discharge and reclaimed water. Fecal coliform is the most commonly used indicator of microbial pollutants. However, it may be deficient to use fecal coliform as the only indicator [24]. Most fecal pathogens, including bacteria, viruses, and parasites, can be detected in the effluent of WWTPs [22]. Quantitative microbial risk assessment (QMRA) is a useful assessment method to quantify the health risk of microbial pollutants, and has been applied to drinking water, urban flood, or other water systems [25,26,27,28]. Only recently, there have been some studies trying to include QMRA in the evaluation of WWTP performance [23].
In this study, characteristics of influent and effluent of seven WWTPs, located in the Shenzhen Bay Catchment of China, were examined. Furthermore, the pollutant removal capacity, the effluent global warming and eutrophication effects, and heavy metals and microbial risks of the treated effluent from all WWTPs were evaluated. This study aimed to introduce a relatively comprehensive assessment of treated effluent from WWTPs by including environmental and human health effects to support sustainable design and operation of WWTPs. In addition, an ecosystem-based WWTP framework was proposed based on the above assessment.

2. Materials and Methods

Seven WWTPs in the Shenzhen Bay Catchment with different scales and treatment processes were examined, named as WWTP1–7. As shown in Table 1, the treatment capacity of seven WWTPs were in the range of 3–35 × 104 m3/day, and different treatment processes including AB/oxidation ditch, oxidation ditch, modified University of Cape Town (MUCT), A2O, and BIOSTYR were adapted in these WWTPs.
Data used in this study were collected from the monthly monitoring report of seven WWTPs during 2010–2014. Indicator parameters monitored included the influent flow rate, suspended solids (SS), chemical oxygen demand (COD), biochemical oxygen demand (BOD), ammonia nitrogen (NH4-N), total nitrogen (TN), total phosphorus (TP), heavy metals, and fecal coliforms. The average results of all parameters are shown in Table 2.
The evaluation of WWTPs composed of four indices, including technical performance, environmental impact, ecological risk, and human health risk. The technical performance included the removal capacity and removal efficiency of target pollutants, such as COD, BOD, SS, TN, and TP. Environmental impacts included eutrophication and global warming effects caused by the effluent. In this study, only direct N2O and CH4 emissions caused by the effluent were taken into consideration. The ecological risk was the toxic effect of the effluent discharged into the aquatic system. Human health risk comprised of risks caused by both effluent heavy metals and pathogens.

2.1. Technical Performance Assessment

Technical performance of WWTPs was characterized by the removed mass and removal efficiency of each pollutant. To compare the comprehensive removal capacity for all WWTPs, all pollutants were standardized to COD equivalent (CODeq) by the discharging pollution fee (DPF) method. The DPF values for COD, BOD, SS, TN, and TP were 1, 2, 2, 20, and 100, respectively [29].

2.2. The Effluent Environmental Impact Assessment

In this study, the effluent environmental impacts were presented only by eutrophication and global warming effects. One represented the effect on the water environment effect and the other on the atmosphere. According to the IPCC protocol, GHG emission from biogenic sources should not be considered, and CH4 produced during anaerobic processes, which was not applicable in those seven WWTPs. Therefore, N2O emission from biological nitrogen removal processes and the effluent TN were the main sources of GHG emissions. N2O emission was transformed into CO2 equivalents by the global warming potential (GWP), with GWP of 1 for CO2 and 298 for N2O.
The eutrophication effect of different pollutants was calculated by their eutrophication potential (EP) and standardized to the orthophosphate (PO4-P) equivalent, for PO4-P, NH4-N, NO3-N, and COD, the corresponding EP was 1, 0.33, 0.1, and 0.022, respectively [30]. Since nitrate nitrogen (NO3-N) was not monitored in those seven WWTPs, the effluent NO3-N concentration was calculated by subtracting NH4-N from TN.

2.3. Ecological Risk Assessment

Five heavy metals, namely, chromium (Cr), arsenic (AS), mercury (Hg), lead (Pb), and cadmium (Cd), were selected for the risk assessment. The assessment of the ecological risk of heavy metals was carried out using the RI (risk index) method proposed by [31], with the calculation equations as follows:
RI = i = 1 n E r i
E r i = T r i × C f i
C f i = C D i C r i
where T r i is the pollution index of single heavy metal; C f i is the concentration of individual heavy metals in the effluent; C r i is the reference value for heavy metals defined as Bn, as the effluent was discharged into marine water directly or indirectly, the threshold of heavy metal concentration of the third class marine water was chosen as the reference value, with the values for As, Cr, Hg, Cd, and Pb of 0.05 mg/L, 0.2 mg/L, 0.0005 mg/L, 0.010 mg/L, and 0.010 mg/L, respectively [32]. E r i is the monomial potential ecological risk factor and T r i is the heavy metal toxic response factor. The values for As, Cd, Cr, Pb, and Hg is 10, 30, 2, 5, and 40 [31]. Five categories of E r i and four classes of RI are shown in Table S1 [31].

2.4. Human Health Risk Assessment

The health risk of heavy metals and pathogens were both calculated by the QMRA method. There were four steps in QMRA, namely, hazard identification, exposure assessment, dose response assessment and risk characterization [26].
Actually, all pathogens that are excreted in feces could be potentially found in wastewater. However, the pathogens often included in QMRA are those of common concern in wastewater. Five reference pathogens were selected to represent bacteria, viruses, protozoa, namely, Escherichia coli, E. coli O157:H7, Campylobacter, Rotavirus and Protozoa, respectively. The reference ratio of pathogens to E. coli was 0.08 for E. coli O157:H7, 0.66 for Campylobacter, 5 × 10⁻⁶ for Rotavirus, and 10−6 for Protozoa, respectively [26,27]. Exposure pathways, volume ingested, frequency, and number of persons were based on Westrell et al. [19] and Harder et al. [23]. The microbial risk was estimated by using dose-response equations of either the β-Poisson model (Equation (4)) or the exponential type (Equation (5)) [26], reported values of parameters for the dose-response model were referred to [33]. The disease burden of microbial risk was expressed as Disability Adjusted Life Years (DALY) and was calculated by the literature-based method [33].
β -Poisson   model:   P ( Di ) = 1 [ 1 + d N 50 ( 2 1 α 1 ) ] α
Exponential   type:   Pi ( d ) = 1 exp ( rd )
where P(Di) is probability of infection at dose; d is exposure dose (CFU/mL); N50 is infecting dose (CFU/mL); α is parameter of probability function; r is the model parameter specific for each pathogen.
Five heavy metals, Cr, As, Hg, Pb, and Cd were selected for the risk assessment. There are three pathways that people may intake heavy metals, including oral intake, inhalation, and dermal absorption [34], where inhaled ingestion is not applicable to wastewater. Exposure pathways, frequency, and number of persons were based on the work of Westrell et al. [22] and Harder et al. [23]. Volume ingested and dose-response assessment were based on the modified method proposed by the U.S. Environmental Protection Agency (USEPA) [35], and values of parameters were derived from the default value from USEPA [35]. The oral and dermal intake dosage was estimated based on the following equations:
IDDingenstion = C w × IR × EF × ED × 10 3 BW × AT × ( 365   days year )
DADdermal = C w × K p × SA × t event × EF × ED × 10 6 BW × AT × ( 365 days / year )
where IDDingestion is the intake daily dose by ingestion (mg/kg·day); CW is the concentration of heavy metal in units of mg/L; IR is the ingestion rate in units of L/exposure; EF is the exposure frequency in units of times/year; ED is the exposure duration in units of years and is equal to 30 years; BW is body weight in units of kg and is equal to 70 kg (adults) and 15 kg (children); AT is the averaging time in units of years, for carcinogens, ATc is 70 years, and for non-carcinogens, ATnc is 30 years. DADdermal is the dermal absorbed dose in units of mg/kg·day; KP is the dermal permeability coefficient in units of cm/h and is taken from the USEPA; SA is the skin surface area available for contact in units of cm2 and is equal to 5700 cm2 (adults) and 2800 cm2 (children); tevent is the time spent on an event in units of h and is equal to 0.25 h/event.
Risk characterization was estimated by a dose-response assessment as follows:
CRingestion = IDDingestion × CSF
CRdermal = DADdermal × CSFdermal
CRtotal = CRingestion + CRdermal
where CR is the carcinogenic risk through either ingestion or dermal absorption; CSF is the cancer slope factor in units of mg/kg∙day; CSFdermal, which is adjusted by ABSGI (the fraction of contaminants absorbed in the gastrointestinal tract, dimensionless), is equal to CSF/ABSGI.
Non-carcinogenic risks are compared to the RfD (reference dose) to form the HQ (hazard quotient), as Equations (11)–(13). The RfD is the safe threshold of a specific chemical. The sum of the HQs is defined as the HI (total hazard index), and HI > 1 indicates the potential for an adverse effect on human health or the necessity for further examination.
HQingestion = IDDingestion/RfD
HQdermal = IDdermal/RfDdermal
HQtotal = HQingestion + HQdermal

3. Results and Discussion

3.1. Technical Performance in Removal of Pollutants

The essential target of a WWTP is to remove conventional pollutants, such as COD, BOD, SS, TN, and TP as much as possible. Therefore, the removal capacity of conventional pollutants when evaluating the operating performance of WWTPs is of primary concern. As the total mass of pollutants removed is mainly affected by the scale of the WWTP, the removed unit of kg·CODeq/m3 was adopted when comparing the technical performance of WWTPs.
The technical performance of WWTP1–7 is shown in Table 3. All WWTPs had good performance in the removal of COD, BOD, and SS, with the removal efficiency in the range of 89.44%–95.04%, 94.81%–97.39%, and 95.82%–97.88%, respectively. Except WWTP4, all other WWTPs had good performance in TP removal, and the TP removal efficiency was 83.61% for WWTP4, which was lower than 90.89%–97.26% of the other WWTPs. Compared with other pollutants, the removal efficiency of TN was relatively low for all WWTPs, with the removal efficiency in the range of 55.95%–75.84%. This phenomenon was the same as the results of Jin et al. [36] regaring the current state of WWTPs in China and that the most crucial problem in WWTPs is TN removal. Many factors affect the pollutants removal efficiency of WWTPs. However, a sufficient organic carbon source is the most important one for efficient TN removal, and the BOD/TN ratio recommended for TN removal was 4 [37]. However, for many WWTPs in China, a shortage of influent organics is a common problem [38]. The BOD/TN ratio of seven WWTPs was in the range of 1.92–3.52. In addition to the influent characteristics, treatment processes also affect the pollutant removal efficiency. Due to the good performance of simultaneous TN and TP removal, A2O has become the common treatment process with the proportion to all treatment processes of 39.53% [36]. Generally, WWTPs with A2O or MUCT processes had better comprehensive removal efficiency than other WWTPs in this study.
The removal loading rate varied significantly among different WWTPs. WWTP1 and WWTP4 removed more pollutants than other WWTPs, where the comprehensive pollutant removal loading rate was 2.64 kg·CODeq/m3∙day for WWTP1 and 2.62 kg·CODeq/m3∙day for WWTP4. Pollutant removal loading rate was determined by the influent pollutant concentration and its removal efficiency. A high comprehensive pollutant removal loading rate of WWTP1 mainly owed to its high removal efficiency of each pollutant, but a high comprehensive pollutant removal loading rate of WWTP4 was mainly due to the high influent concentration than other WWTPs and an acceptable removal efficiency. For all WWTPs, TN and TP removal contributed large proportions to the comprehensive removal loading rate, accounting for averaged proportions of 28% and 25%, respectively. Since TN and TP had higher DPF values than COD, BOD, and SS, better comprehensive pollutant removal loading rates could be achieved through enhancing the removal of TN and TP.

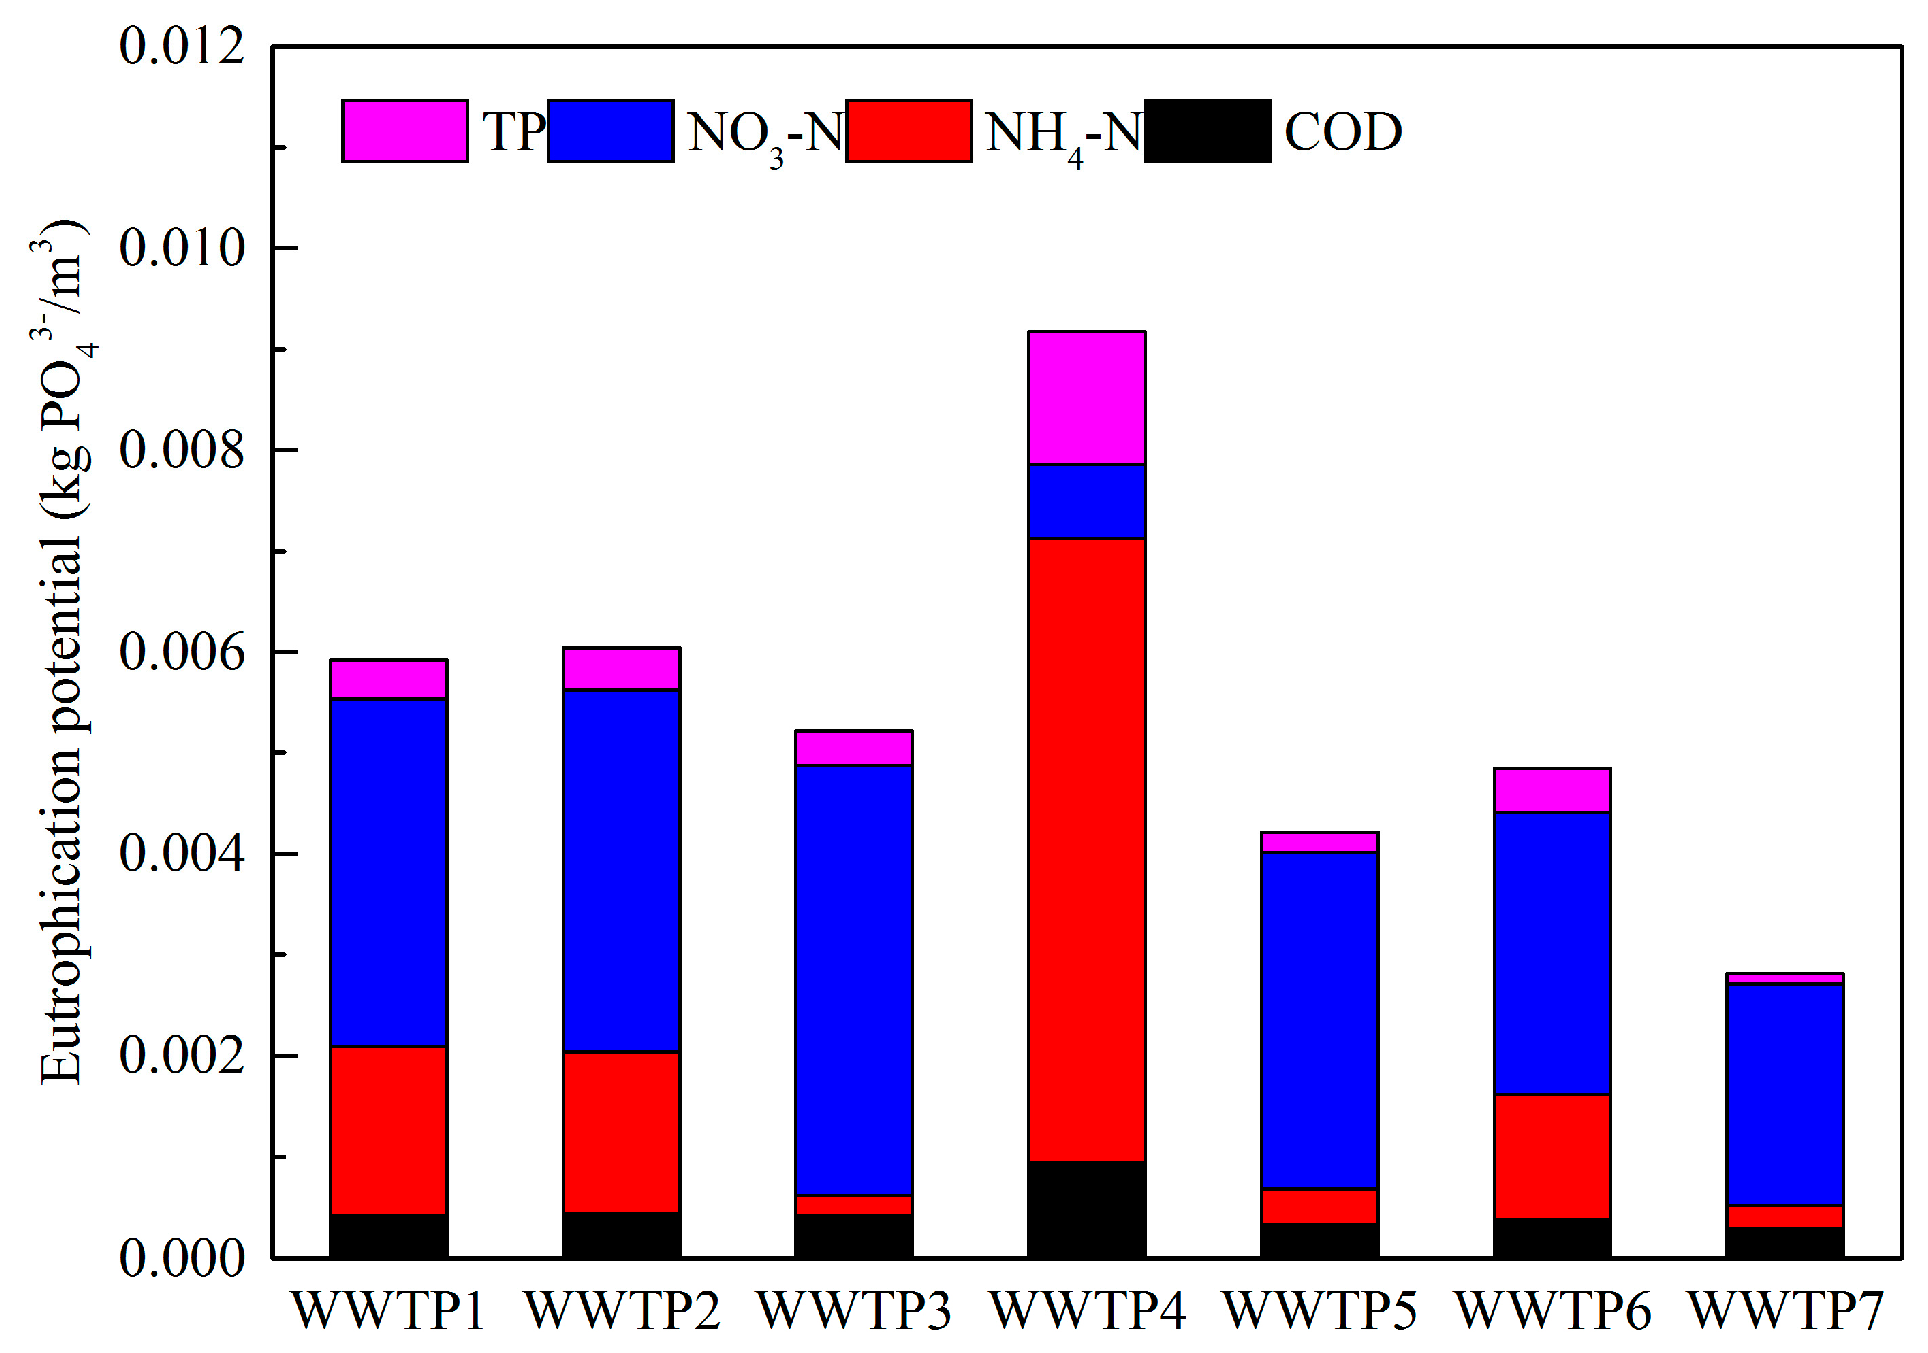
3.2. Eutrophication Effect of the Treated Effluent

As shown in Figure 1, the effluent eutrophication effect of different WWTPs was in the range of 0.0028–0.0092 kg/m3, and the order from low to high value was WWTP7, WWTP5, WWTP6, WWTP3, WWTP1, WWTP2, and WWTP4. The average contribution of COD, NH4-N, NO3-N, and TP to the total effluent eutrophication effect for all WWTPs was 0.43%, 23.97%, 60.22%, and 7.38%, respectively. Among all effluent pollutants, nitrogen, especially NO3-N, was the largest contributor of the eutrophication effect. NH4-N contributed to 67.37% for WWTP4 and NO3-N contributed to 57.68%–81.46% for the other six WWTPs. A high eutrophication effect of nitrogen is mainly due to its lower removal efficiency than other parameters, leading to high TN concentrations in the effluent. The results of Garrido-Baserba et al. [6] and Li et al. [36] also showed that TN played an important role in the eutrophication effect of WWTPs. To a certain extent, the effluent eutrophication effect correlated to the effluent TN concentration. Therefore, treatment processes or WWTPs with a high TN removal efficiency or a better effluent quality would have a lesser effluent eutrophication effect. WWTP4, the WWTP with the lowest TN removal efficiency and highest effluent TN concentration, had the highest effluent eutrophication effect with a value of 0.0092 kg/m3, with TN (NH4-N and NO3-N) accounting for 75.37% (63.37% for NH4-N and 8% for TN). On the contrary, WWTP7 had a relatively high TN removal efficiency and the lowest effluent TN concentration. Therefore, WWTP7 had the lowest effluent eutrophication effect.
So as to improve the pollutant removal loading rate or reduce the effluent eutrophication effect, the removal of TN needs more attention to be paid. Biological nitrogen removal is mainly based on two processes, i.e., nitrification and denitrification. Nitrification is the prerequisite of denitrification, while TN can only be removed during denitrification. A good nitrification performance may not definitely lead to a low effluent eutrophication effect, but a worse performance of nitrification certainly leads to a high effluent eutrophication effect due to a high effluent NH4-N concentration (as was the case of WWTP4).

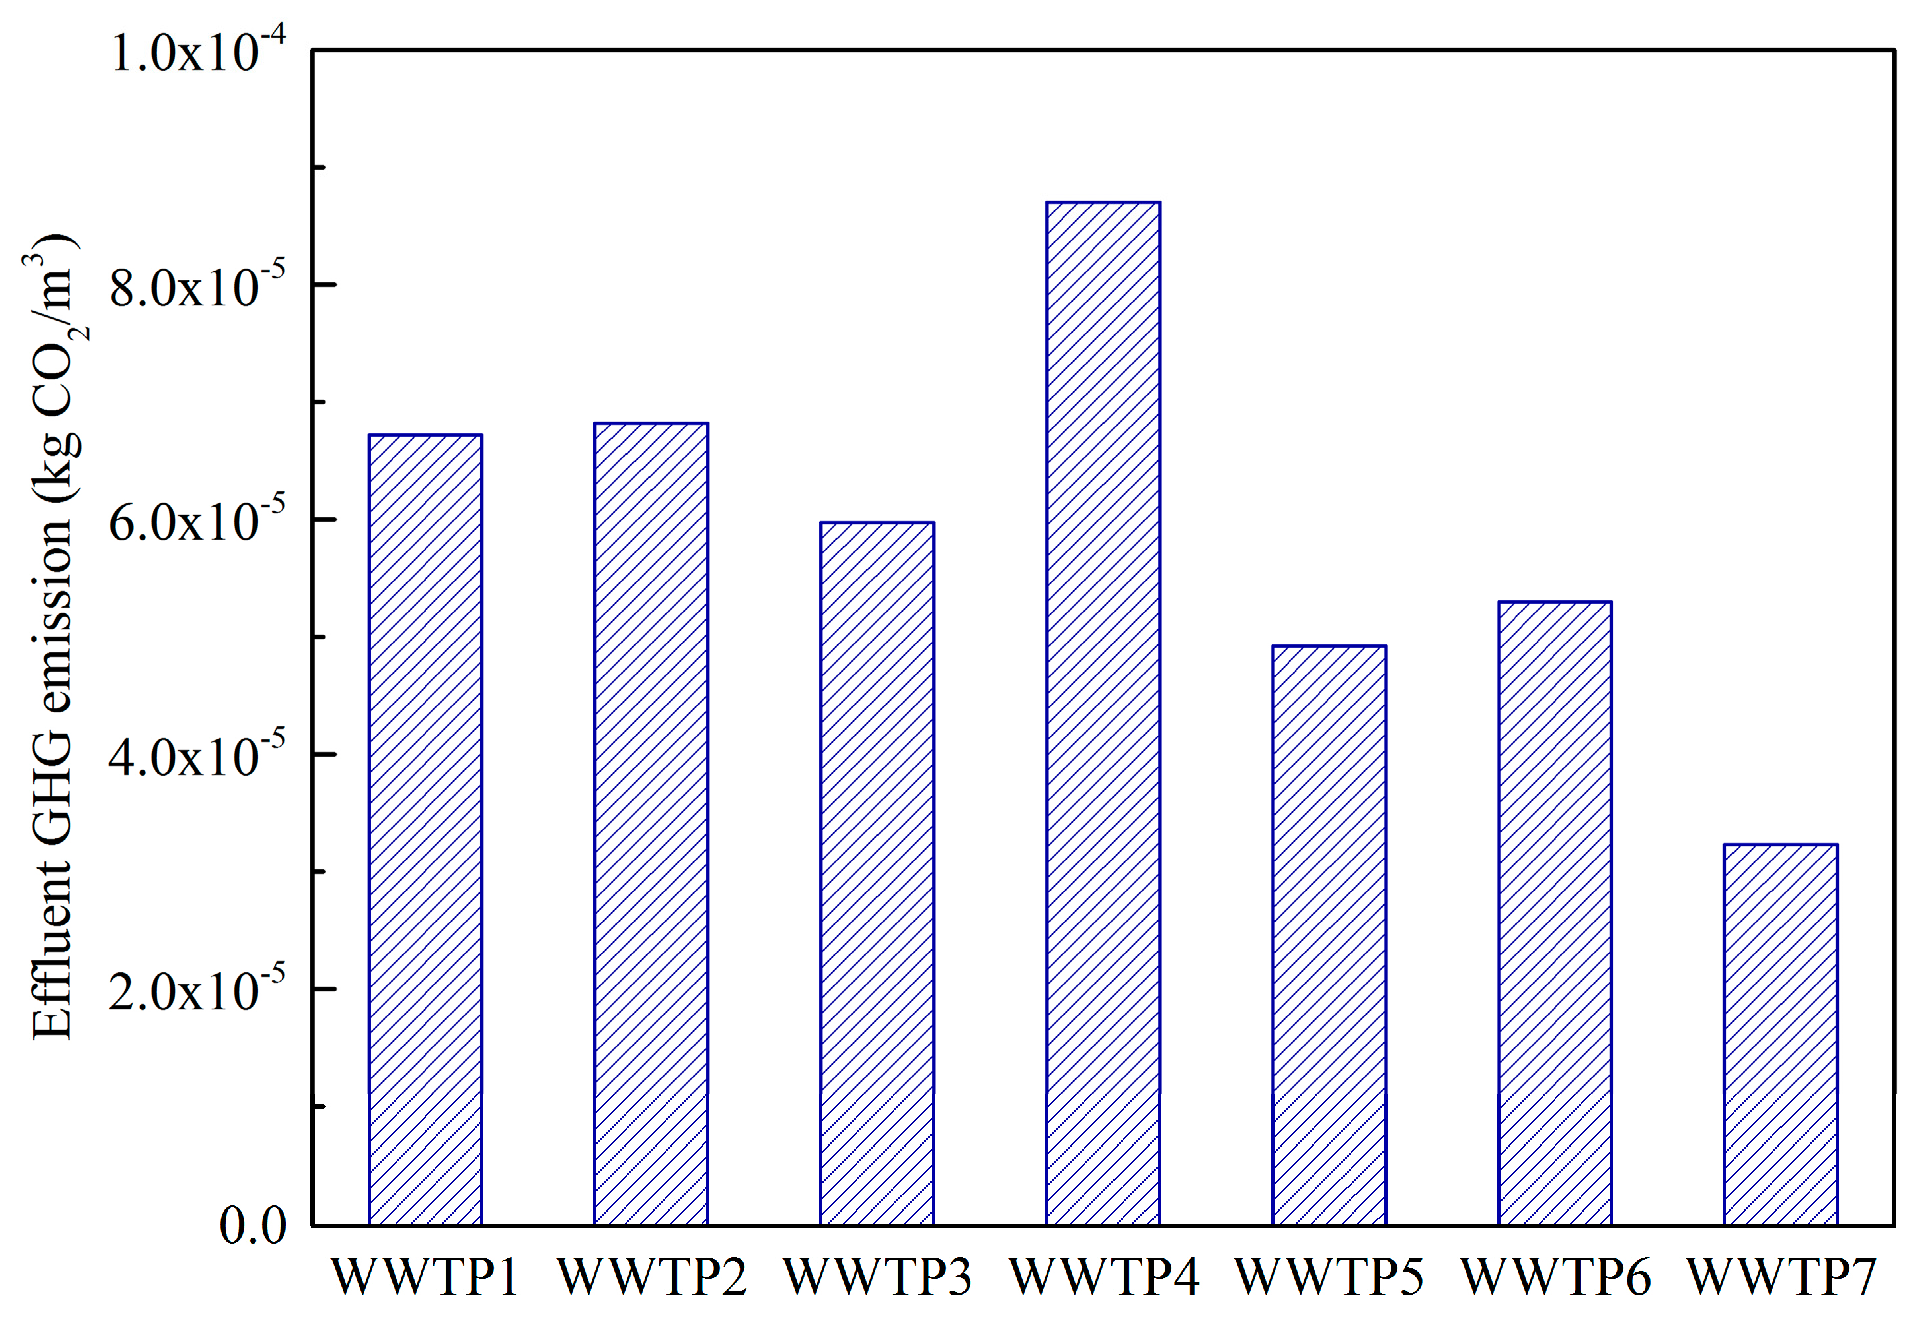
3.3. Global Warming Effect of the Treated Effluent

As the effluent GHG emission mainly comes from the effluent TN, the performance of WWTPs on the effluent global warming effect was similar to the effluent eutrophication effect. Therefore, WWTPs with a low effluent TN concentration had less effluent GHG emission. As shown in Figure 2, the effluent GHG emission of WWTP1–7 was in the range of 3.23 × 10⁻⁵–8.70 × 10⁻⁵ kg·CO2/m3, with an average value of 5.95 × 10⁻⁵ kg·CO2/m3. This emission was much lower than the reported total GHG emission of WWTPs. Some case studies of WWTPs showed that the total GHG emission from whole WWTPs, including direct and indirect emission, reached 0.228–0.245 kg·CO2/m3 [39]. The total flow-based emission of N2O was 0.37 × 10⁻⁵–3.01 × 10⁻⁵ g·N2O/m3 [40], equaling 1.1 × 10⁻³–9.0 × 10⁻³ g·CO2/m3. Therefore, the effluent N2O emission only accounted for a small part of the total GHG emission of WWTPs. Reduction in the effluent TN would not lead to an obvious decrease in GHG emission, but it is meaningful for the control of the effluent eutrophication effect.

3.4. Heavy Metal Risk of the Treated Effluent

The removal efficiency and the effluent ecological risk of heavy metals (As, Cd, Cr, Pb, and Hg) of WWTP1–7 are shown in Table 4. Biological treatments are designed to remove the organic matter and nutrients in wastewater and not necessarily to remove heavy metals; only a side benefit can be observed in the treatment of heavy-metal-bearing streams [41]. In this study, removal of Cr, Hg, and Pb was observed in all WWTPs, with the removal efficiency of 55.95%–92.5%, 37.87%–88.03%, and 8.7%–63.11%, while the removal of As and Cd was only achieved in some WWTPs, unsteadily. Reported heavy metal removal efficiency of WWTP in China was 49%–66% (Pb), 47%–61% (Cd), 76%–82% (Cr), 43%–55% (As), and 66%–72% (Hg) [16]. Many mechanisms, such as the physical trapping of precipitated metals in the sludge floc matrix, binding of soluble metal to bacterial extracellular polymers, and accumulation of soluble metal by the cell, have been proposed to explain how heavy metals are incorporated into activated sludge [42,43,44]. Many factors, including influent characteristics, and types and operating parameters of treatment processes, may affect the removal efficiency of heavy metals. More details and deeper studies are needed to explain the different performance of WWTPs for different heavy metal removal efficiencies obtained in this study.
As to the similar level of effluent heavy metal concentration, the risk index of seven WWTPs due to heavy metals was almost the same, in the range of 13.37–16.89. According to the grades of potential ecological risk proposed by Hakanson [31], the effluent ecological risk of all WWTPs was low. This value was much lower than the reported ecological risk of heavy metals in sludge from WWTPs, with an overall value of 1376.34 [16]. Therefore, rather than the effluent, sludge should be focused on to control the ecological risk of heavy metals. Averaged E r i of individual heavy metals of WWTPs was ranked in the order of Pb > Hg > Cd > As > Cr. E r i of heavy metals in sewage sludge found by Li et al. [16] was ranked in the order of Cr < Zn < Pb < Ni < As < Cu < Hg < Cd. The different ranks might be the result from the different distribution characteristics of heavy metals in the effluent and sludge, respectively. As the effluent Pb and Hg had high ecological risk in WWTPs, these two types of heavy metals should be focused on so as to control the effluent ecological risk of heavy metals.
The human health risk of effluent heavy metals are shown in Table 5. The non-carcinogenic risks for adults and children of seven WWTPs were in the range of 5.53 × 10⁻⁵–6.91 × 10⁻⁵ and 4.87 × 10⁻³–5.28 × 10⁻³, which were much lower than 1, showing that the hazard quotient of the effluent from WWWPs was low. As contributed most to the effluent HQ, followed by Cr, Pb, Cd, and Hg. An acceptable cancer risk of heavy metals published by USEPA [35] was 10−6–10−4. The cancer risk of the effluent heavy metals from WWTPs was in the range of 8.29 × 10⁻⁸–2.04 × 10⁻⁷ for adults and 1.82 × 10⁻⁶–5.06 × 10⁻⁶ for children, lower than the acceptable value. Different from HQ, Cr was the largest contributor of cancer risk, which was due to a much higher cancer risk of Cr than other heavy metals. Obviously, both HQ and CR of the effluent heavy metals from WWTPs were low. However, due to the characteristic of non-biodegradability, the effluent heavy metals might accumulate in receiving water systems or soils through processes like reclaimed water irrigation, the ecological or health risk of effluent heavy metals would be magnified. Therefore, its environmental risk should be also considered when assessing its environmental effect, especially for its long-term accumulation effect.

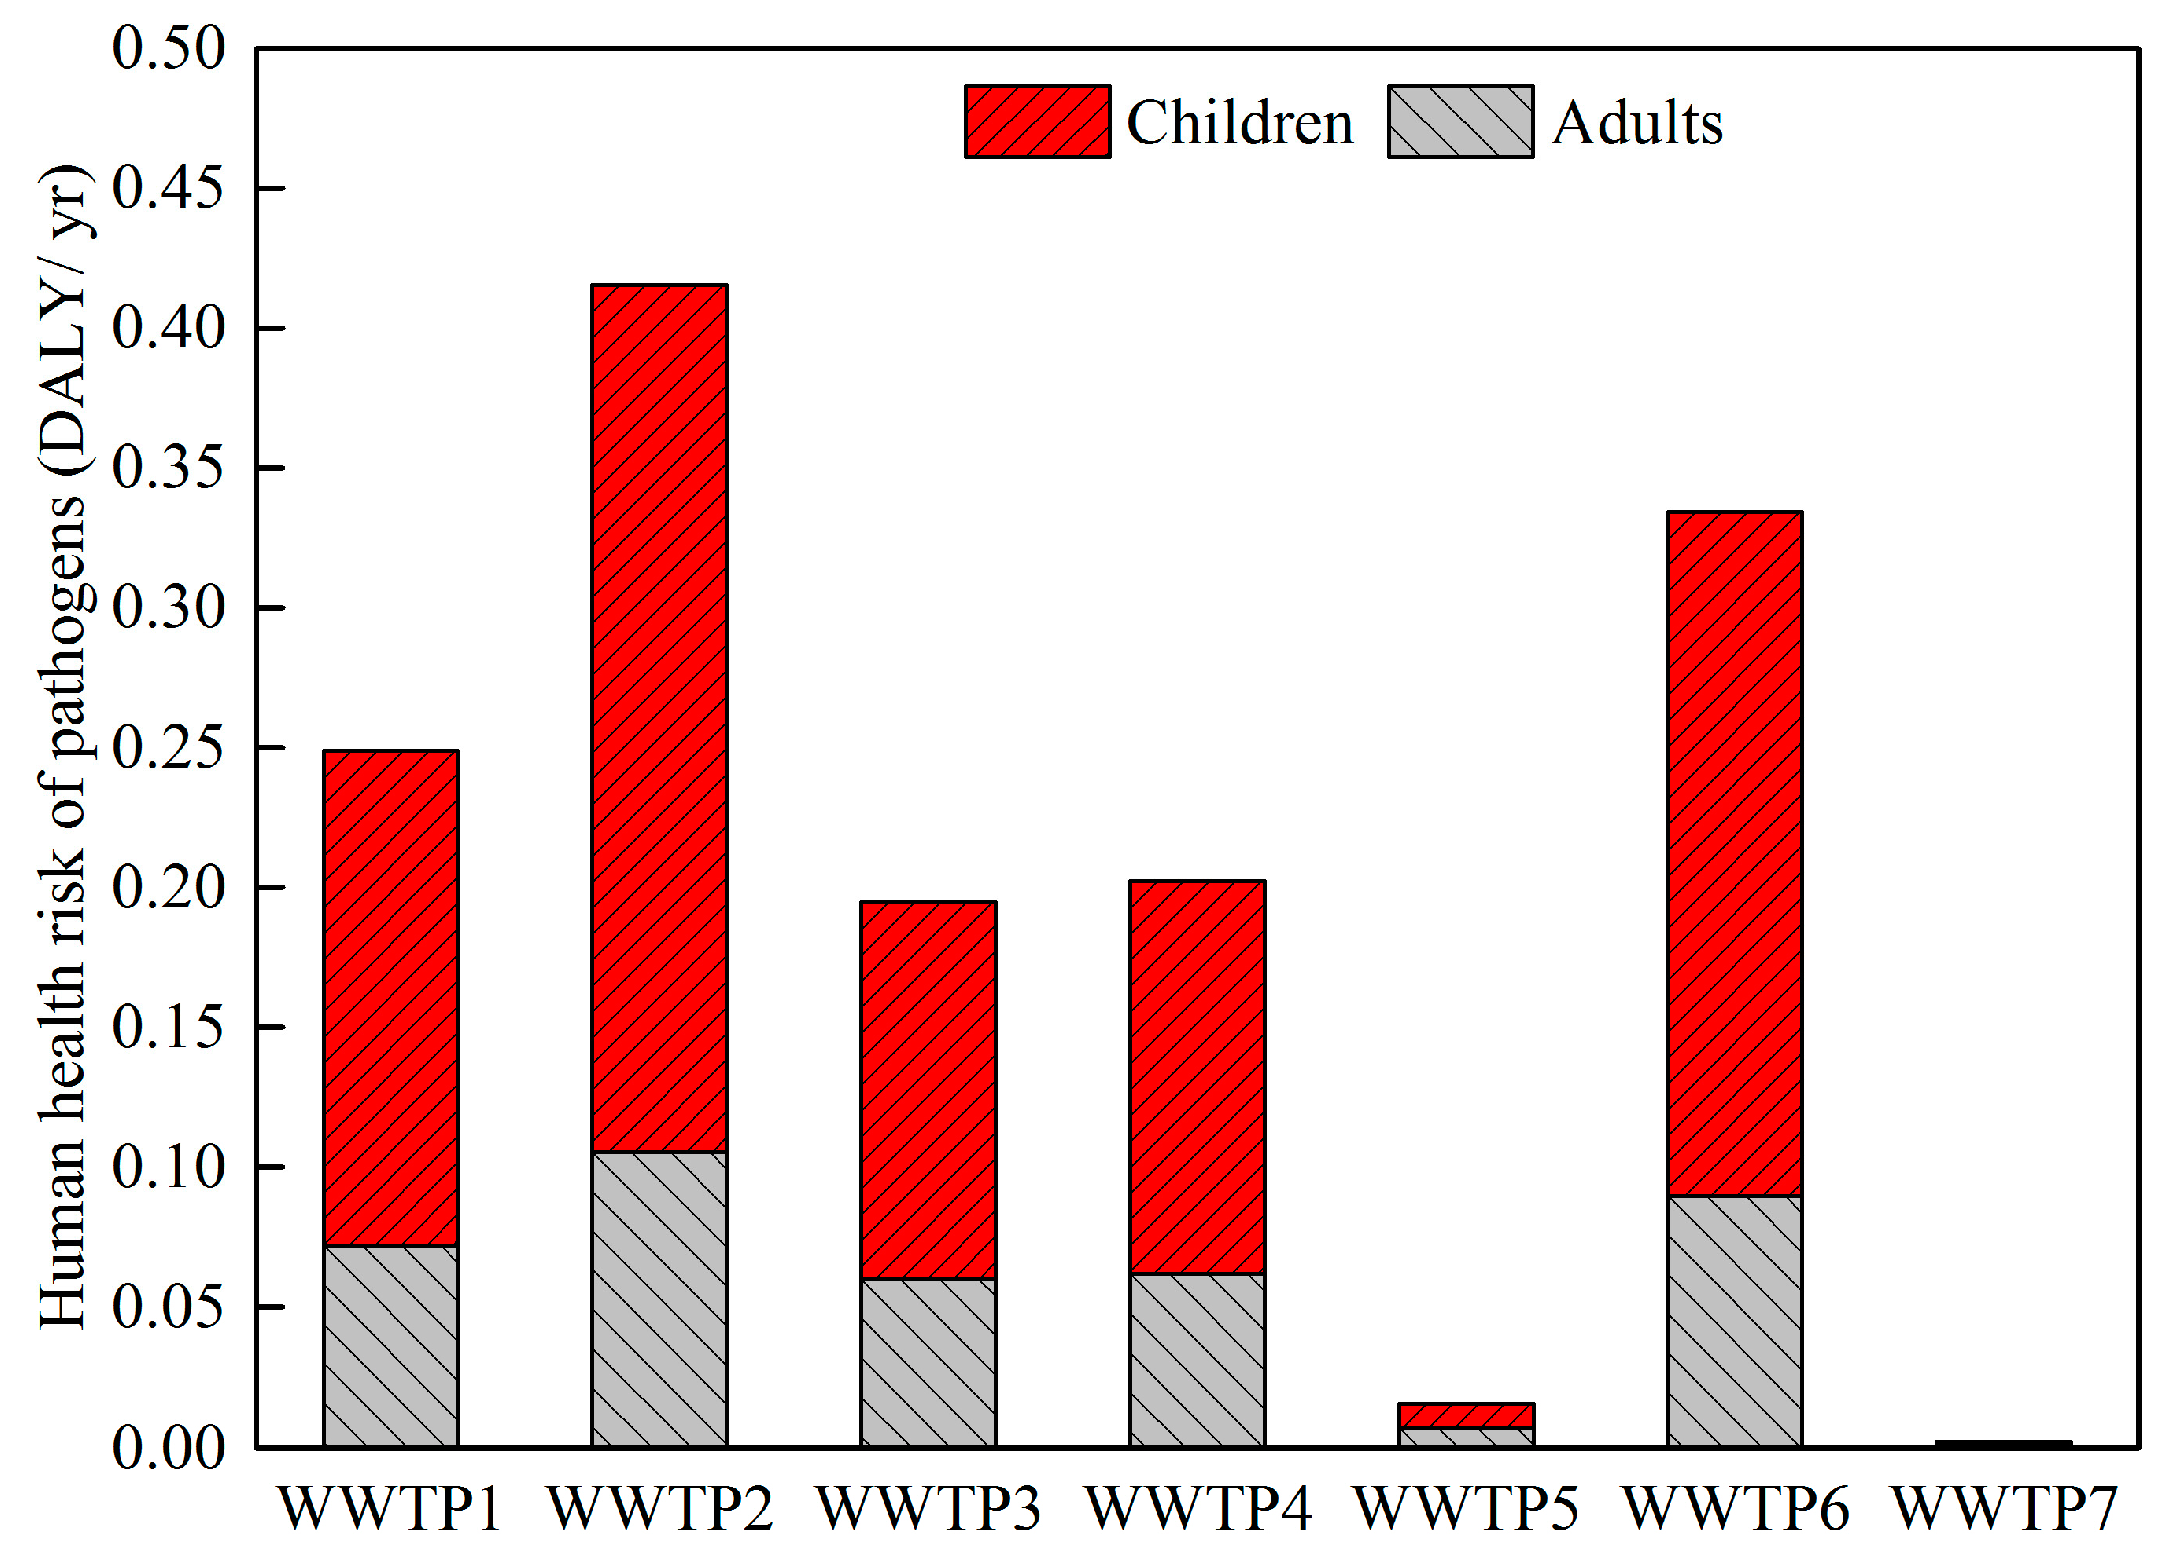
3.5. Microbial Risk of the Treated Effluent

Human health risk of pathogens from WWTP1–7 is shown in Figure 3. As the effluent human health risk of pathogens is a function of the effluent E. coli concentration, WWTPs of good effluent quality of E. coli had low human health risks of pathogens. The average human health risk of pathogens of WWTP1–7 was in the range of 0.0024–0.0042 DALY, and the risk value varied from WWTPs due to their different effluent quality. Those values were comparable with the results of Harder et al. [23] from different WWTPs, where the microbial risk of WWTPs ranged from values lower than 0.001 DALY to as high as 8.6 DALY. Human health risk of seven WWTPs was in the rank of WWTP2, WWTP6, WWTP1, WWTP4, WWTP3, WWTP5, and WWTP7. WWTPs with better E. coli removal performance tended to have a low risk. Improving process performance in the removal of E. coli might be the best way to reduce the effluent microbial risk. In addition to efficient management, an enhanced public awareness of the effluent risk of WWTPs can reduce the exposure frequency (especially for children) and the affected number of people.
In addition to the direct human health risk of the effluent, the influent and sludge may also affect human health by many exposure pathways. Moreover, the effluent might also affect human heath indirectly by discharging into receiving water bodies or by reusing [22]. Therefore, the effluent microbial health risk needs to be strictly controlled to diminish the microbial health risk at the original source. For most WWTPs, the total fecal coliform was used as the single indicator to represent the state of microbial pollution. However, many different pathogens, such as pathogenic bacteria, virus, protozoa, and sometimes even vertebrae, might exist in the effluent. Different concentrations or distributions of pathogens led to risks at different levels, even though the effluent concentration of total fecal coliforms was the same. Therefore, more detailed detection is needed for WWTPs to control the effluent microbial pollution [22,23,24,33].

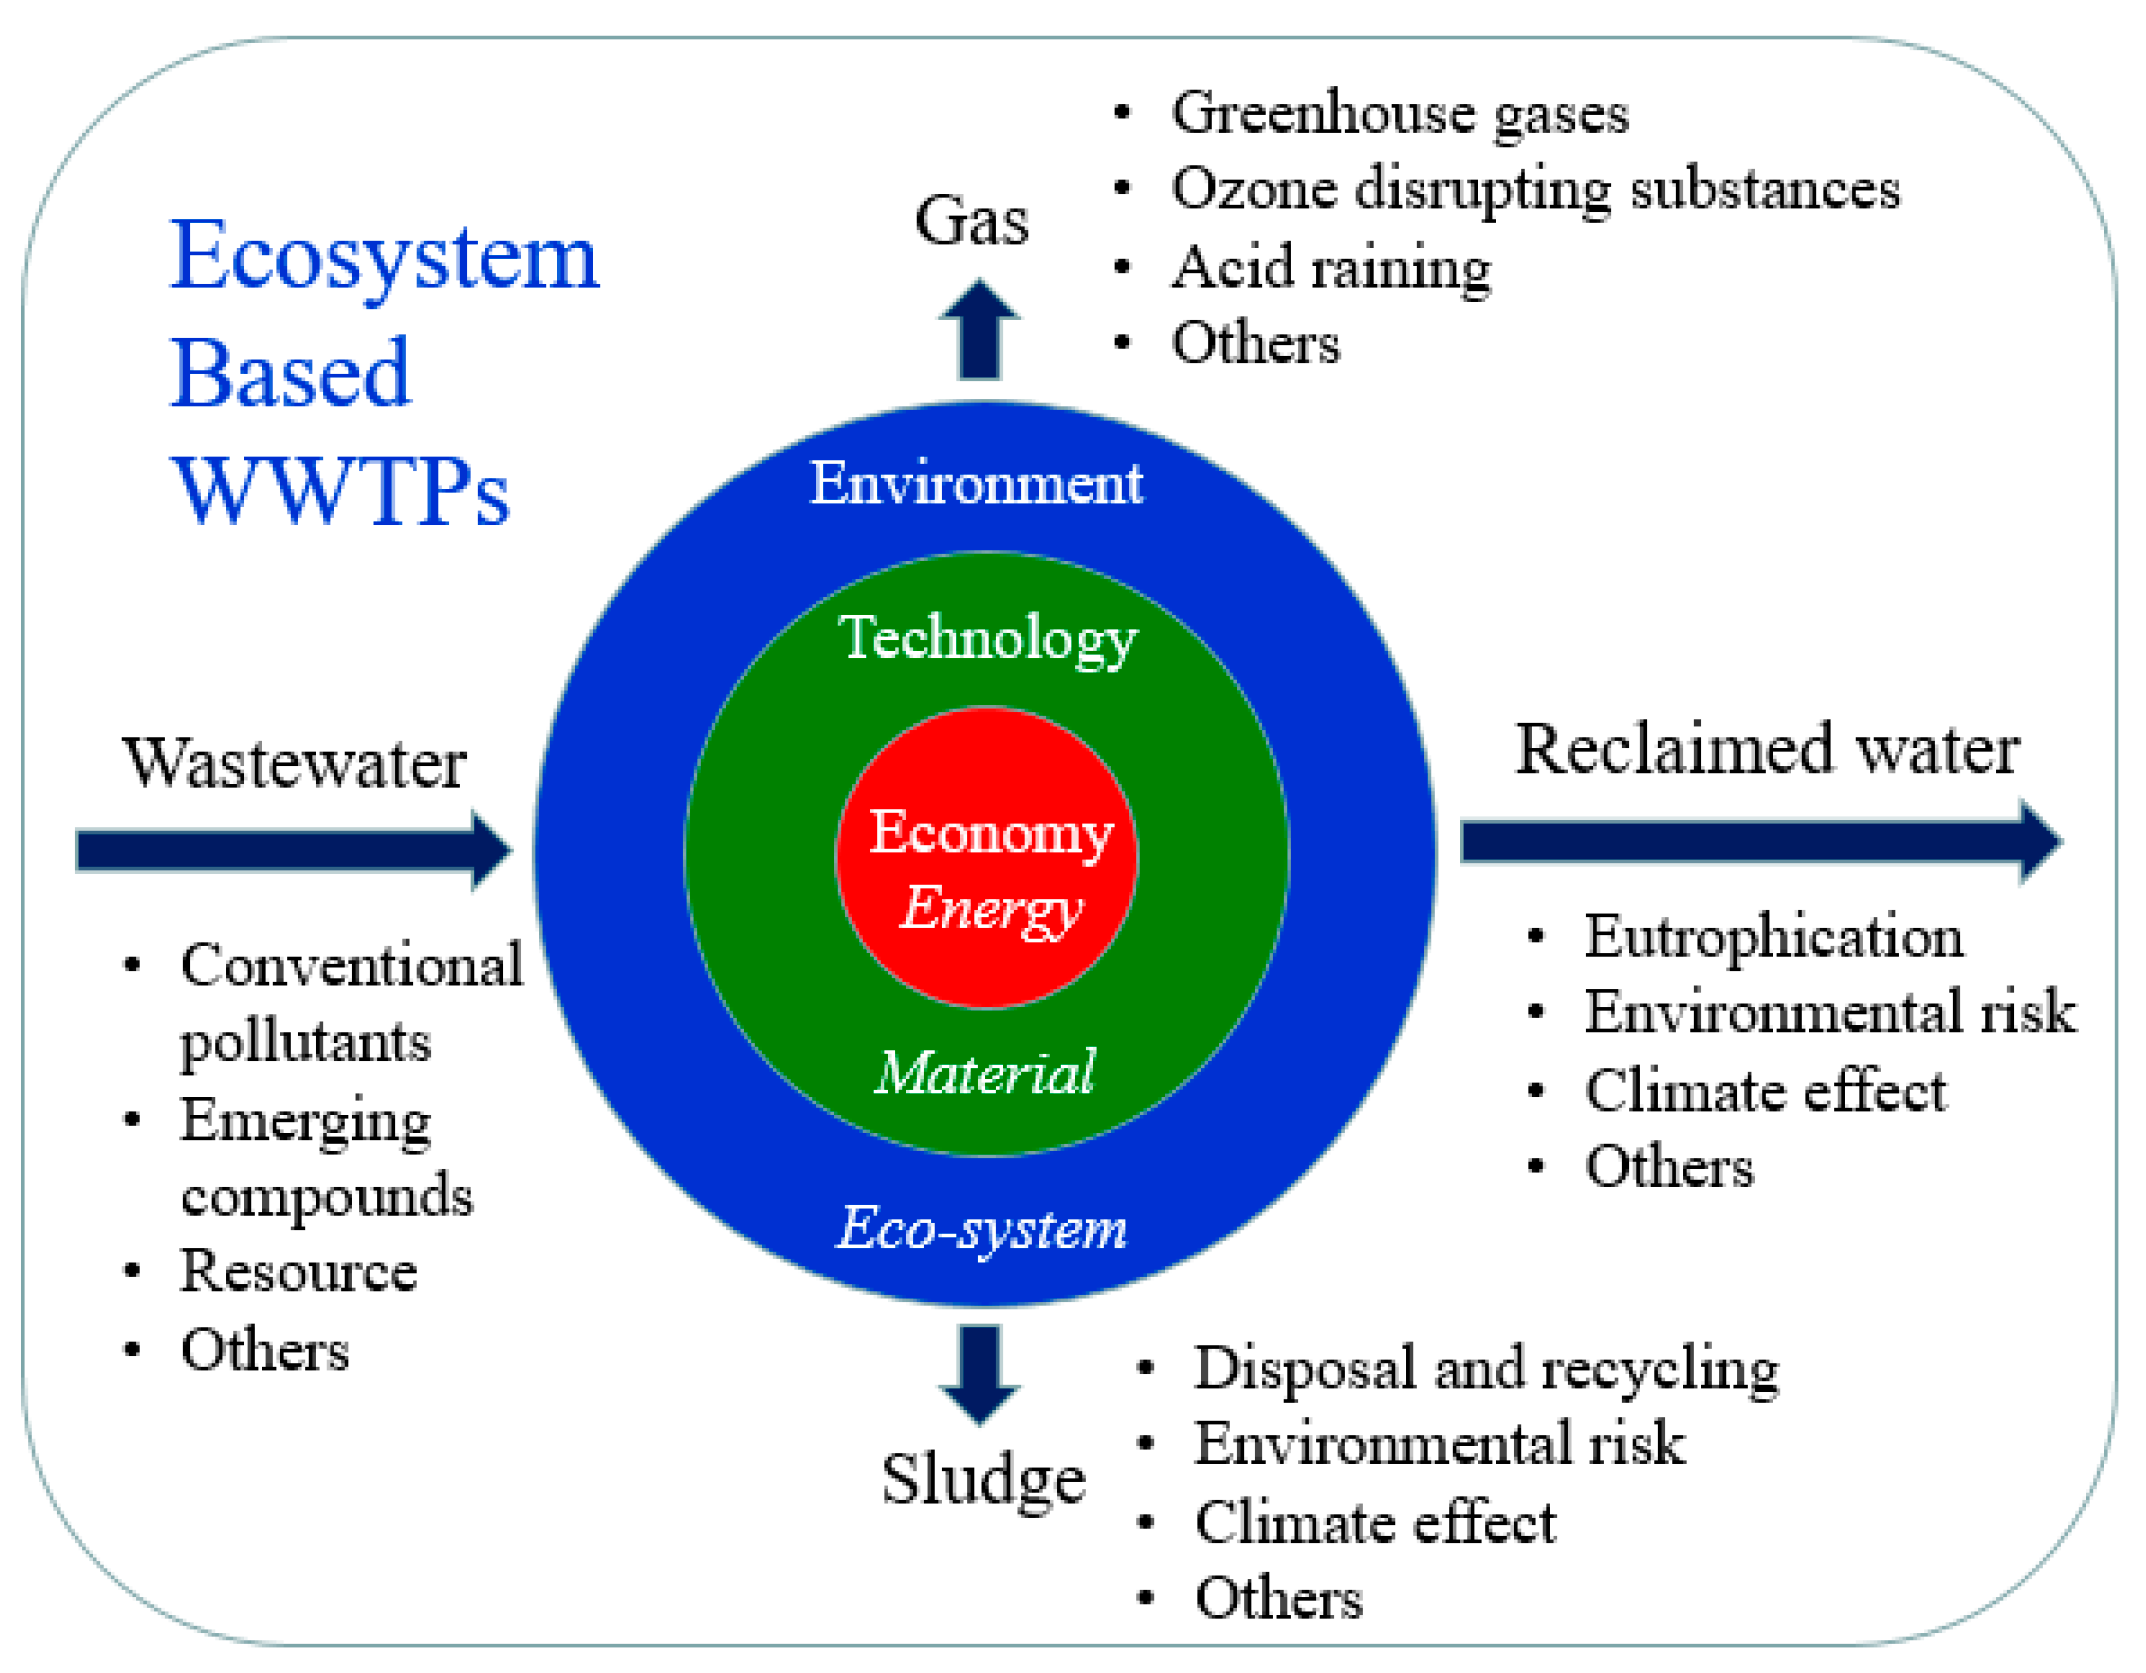
3.6. Eco-System Based Evaluation of Environmental Effect of WWTPs

From the heavy metal effect on ecological and human health risk assessment, it was indicated that not only effect from the treated water, but also that from solid waste should be considered. Therefore, a comprehensive ecosystem-based WWTP evaluation framework was proposed (Figure 4).
WWTPs are facilities to guarantee the stability and sustainability of the ecosystem. By inputs of energy, materials, and technology, WWTPs treat wastewater to reduce the impacts of pollutants on society and the environment. However, during wastewater treatment, parts of pollutants may be transformed to secondary pollutants rather than be removed, including resistant pollutants in treated water, excess sludge, and GHG, etc. As a loop in the circle of the ecosystem, WWTPs need to minimize the consumption of resources from the ecosystem and the release of secondary pollutants to the ecosystem through improving the technical performance. To achieve this goal, effective measurements should be taken, including energy recovery from the influent, and recycling of excess sludge and treated water. However, the reuse of sludge and water need to be deliberate due to the possible ecological risk and human health risk.
In this framework, environmental effects should be considered from reclaimed water (liquid phase), sludge (solid phase), and gas emission (gas phase). The assessment would include effects on the water environment, human health, and atmospheric environment, etc. Tracking back to the WWTPs, an ecosystem-based WWTP strategy would be brought forward, with the economy (especially energy) as the basis supporting the operation of the WWTP, technology as the material flow carrier (including nutrients removal), and the ultimate aim of supporting the healthy environmental ecosystem. Therefore, further studies should be carried out to develop a systematic assessment method (such as those proposed by Papa et al. [45,46]) to support the sustainable development of WWTPs, especially new concepts, such as emerging compound controls and considering wastewater as a resource, should be incorporated.

4. Conclusions

All WWTPs had good performance in the removal of COD, BOD, and SS. TN and TP removal needed to be enhanced to improve the comprehensive technical performance.
The effluent eutrophication effect was in the range of 0.0028–0.0092 kg/m3, and NO3-N was the largest contributor. The effluent GHG emission of WWTPs1–7 was in the range of 3.23 × 10⁻⁵–8.70 × 10⁻⁵ kg·CO2/m3. The effluent eutrophication effects and GHG emission of WWTPs could both be reduced by decreasing the effluent TN concentration.
The ecological risk and human health risk of heavy metals were low. Pb contributed most to the ecological risk and As to the human health risk. The human health risk of microbial pollutants of WWTP1–7 was in the range of 0.0024–0.0042 DALY.
A comprehensive ecosystem based WWTPs evaluation framework was proposed. It included liquid, solid, and gas parameters so as to systematically evaluate the environmental effects, and also energy, materials, and water flows should be considered for advancing the sustainable development of WWTPs.

Supplementary Materials

The following are available online at www.mdpi.com/2071-1050/8/10/984/s1, Table S1: The clarification level for E r i and RI.

Acknowledgments

This study was funded by Urban Planning, Land & Resources Commission of Shenzhen Municipality (Municipality Oceanic Administration of Shenzhen) and will cover the costs to publish in open access.

Author Contributions

Bo Li and Dan Wang analyzed the data and prepared the draft; Mingyuan Li and Jie Wei contributed to the design of the concept; Guangxue Wu designed the whole experiment and was in charge of the paper.

Conflicts of Interest

The authors declare no conflict of interest.

References

  1. Reemtsma, T.; Weiss, S.; Mueller, J.; Petrovic, M.; González, S.; Barcelo, D.; Ventura, F.; Knepper, T.P. Polar pollutants entry into the water cycle by municipal wastewater: A European perspective. Environ. Sci. Technol. 2006, 40, 5451–5458. [Google Scholar] [CrossRef] [PubMed]
  2. Panepinto, D.; Genon, G. Modeling of Po River Water Quality in Torino (Italy). Water Resour. Manag. 2010, 24, 2937–2958. [Google Scholar] [CrossRef]
  3. Panepinto, D.; Genon, G.; Borsarelli, A. Improvement of nitrogen removal in a large municipal wastewater plant. Chem. Eng. Trans. 2013, 34, 67–72. [Google Scholar]
  4. Panepinto, D.; Marchese, F.; Genon, G. Evaluation of Po River water quality in Torino (Italy): Effects of diffuse and local point loads. Urban Water J. 2016, 13, 583–599. [Google Scholar] [CrossRef]
  5. Papa, M.; Ceretti, E.; Viola, G.C.V.; Feretti, D.; Zerbini, I.; Mazzoleni, G.; Steimberg, N.; Pedrazzani, R.; Bertanza, G. The assessment of WWTP performance: Towards a jigsaw puzzle evaluation? Chemosphere 2016, 145, 291–300. [Google Scholar] [CrossRef] [PubMed]
  6. Garrido-Baserba, M.; Hospido, A.; Reif, R.; Molinos-Senante, M.; Comas, J.; Poch, M. Including the environmental criteria when selecting a wastewater treatment plant. Environ. Model. Soft. 2014, 56, 74–82. [Google Scholar] [CrossRef]
  7. Yi, L.; Jiao, W.; Chen, X.; Chen, W. An overview of reclaimed water reuse in China. J. Environ. Sci. 2011, 23, 1585–1593. [Google Scholar] [CrossRef]
  8. Vasquez, M.I.; Fatta-Kassinos, D. Is the evaluation of “traditional” physicochemical parameters sufficient to explain the potential toxicity of the treated wastewater at sewage treatment plants? Environ. Sci. Pollut. Res. 2013, 20, 3516–3528. [Google Scholar] [CrossRef] [PubMed]
  9. Shahabadi, M.B.; Yerushalmi, L.; Haghighat, F. Impact of process design on greenhouse gas (GHG) generation by wastewater treatment plants. Water Res. 2009, 43, 2679–2687. [Google Scholar] [CrossRef] [PubMed]
  10. Zhang, Y.; Li, Y.; Wang, C.; Zhang, W.; Xiong, W. Towards more accurate life cycle assessment of biological wastewater treatment plants: A review. J. Clean Prod. 2015, 107, 676–692. [Google Scholar] [CrossRef]
  11. Gallego, A.; Hospido, A.; Moreira, M.T.; Feijoo, G. Environmental performance of wastewater treatment plants for small populations. Resour. Conserv. Recycl. 2008, 52, 931–940. [Google Scholar] [CrossRef]
  12. Intergovernmental Panel on Climate Change (IPCC). 2006 IPCC Guidelines for National Greenhouse Gas Inventories; IGES: Hayama, Japan, 2006. [Google Scholar]
  13. Binkley, J.; Simpson, J.A. Heavy Metals in Wastewater Treatment Processes. In The Handbook of Water and Wastewater Microbiology; Mara, D., Horam, N., Eds.; Academic Press: Millbrae, CA, USA, 2003; pp. 597–610. [Google Scholar]
  14. Karvelas, M.; Katsoyiannis, A.; Samara, C. Occurrence and fate of heavy metals in the wastewater treatment process. Chemosphere 2003, 53, 1201–1210. [Google Scholar] [CrossRef]
  15. Kendir, E.; Kentel, E.; Sanin, F.D. Evaluation of heavy metals and associated health risks in a metropolitan wastewater treatment plant’s sludge for its land application. Hum. Ecol. Risk Assess. 2015, 21, 1631–1643. [Google Scholar] [CrossRef]
  16. Li, J.; Luo, G.; Gao, J.; Yuan, S.; Du, J.; Wang, Z. Quantitative evaluation of potential ecological risk of heavy metals in sewage sludge from three wastewater treatment plants in the main urban area of Wuxi, China. Chem. Ecol. 2015, 31, 235–251. [Google Scholar] [CrossRef]
  17. Khan, M.U.; Malik, R.N.; Muhammad, S. Human health risk from heavy metal via food crops consumption with wastewater irrigation practices in Pakistan. Chemosphere 2013, 93, 2230–2238. [Google Scholar] [CrossRef] [PubMed]
  18. Wang, Y.; Qiao, M.; Liu, Y.; Zhu, Y. Health risk assessment of heavy metals in soils and vegetables from wastewater irrigated area, Beijing-Tianjin city cluster, China. J. Environ. Sci. 2012, 24, 690–698. [Google Scholar] [CrossRef]
  19. Gao, Q.; Li, Y.; Cheng, Q.; Yu, M.; Hu, B.; Wang, Z.; Yu, Z. Analysis and assessment of the nutrients, biochemical indexes and heavy metals in the Three Gorges Reservoir, China, from 2008 to 2013. Water Res. 2016, 92, 262–274. [Google Scholar] [CrossRef] [PubMed]
  20. Emmanuel, E.; Pierre, M.G.; Perrodin, Y. Groundwater contamination by microbiological and chemical substances released from hospital wastewater: Health risk assessment for drinking water consumers. Environ. Int. 2009, 35, 718–726. [Google Scholar] [CrossRef] [PubMed]
  21. Min, X.; Xie, X.; Chai, L.; Liang, Y.; Li, M.; Ke, Y. Environmental availability and ecological risk assessment of heavy metals in zinc leaching residue. Trans. Nonferrous Met. Soc. China 2013, 23, 208–218. [Google Scholar] [CrossRef]
  22. Westrell, T.; Schönning, C.; Stenström, T.A.; Ashbolt, N.J. QMRA (quantitative microbial risk assessment) and HACCP (hazard analysis critical control points) for management of pathogens in wastewater and sewage sludge treatment and reuse. Water Sci. Technol. 2004, 50, 23–30. [Google Scholar] [PubMed]
  23. Harder, R.; Heimersson, S.; Svanstrom, M.; Peters, G.M. Including pathogen risk in life cycle assessment of wastewater management. 1. Estimating the burden of disease associated with pathogens. Environ. Sci. Technol. 2014, 48, 9438–9445. [Google Scholar] [CrossRef] [PubMed]
  24. Salgot, M.; Huertas, E.; Weber, S.; Dott, W.; Hollender, J. Wastewater reuse and risk: Definition of key objectives. Desalination 2006, 187, 29–40. [Google Scholar] [CrossRef]
  25. Teunis, P.F.M.; Medema, G.J.; Kruidenier, L.; Havelaar, A.H. Assessment of the risk of infection by Cryptosporidium or Giardia in drinking water from a surface water source. Water Res. 1997, 31, 1333–1346. [Google Scholar] [CrossRef]
  26. Haas, C.N.; Rose, J.B.; Gerba, C.P. Quantitative Microbial Risk Assessment; John Wiley & Sons, Inc.: New York, NY, USA, 1999. [Google Scholar]
  27. Haas, C.N.; Eisenberg, J.N.S. Risk Assessment. In Water Quality: Guidelines, Standards and Health; Fewtrell, L., Bartram, J., Eds.; IWA Publishing: London, UK, 2001; pp. 161–183. [Google Scholar]
  28. Ten Veldhuis, J.A.E.; Clemens, F.H.L.R.; Sterk, G.; Berends, B.R. Microbial risks associated with exposure to pathogens in contaminated urban flood water. Water Res. 2010, 44, 2910–2918. [Google Scholar] [CrossRef] [PubMed]
  29. Copp, J.B.; Spaniers, H.; Vanrolleghem, P.A. Respirometry in Control of the Activated Sludge Process: Benchmarking Control Strategies; IWA Publishing: London, UK, 2002. [Google Scholar]
  30. Guinee, J.B. Handbook on Life Cycle Assessment: Operational Guide to the ISO Standards; Kluwer Academic Publishers: New York, NY, USA, 2002. [Google Scholar]
  31. Hakanson, L. An ecological risk index for aquatic pollution control a sedimentological approach. Water Res. 1980, 14, 975–1001. [Google Scholar] [CrossRef]
  32. State Environmental Protection Administration of China (SEPA). China National Standards-Marine Water Quality Standard (GB 3097-1997); State Environmental Protection Administration of China: Beijing, China, 1997. (In Chinese)
  33. Machdar, E.; Van Der Steen, N.P.; Raschid-Sally, L.; Lens, P.N.L. Application of quantitative microbial risk assessment to analyze the public health risk from poor drinking water quality in a low income area in Accra, Ghana. Sci. Total Environ. 2013, 449, 134–142. [Google Scholar] [CrossRef] [PubMed]
  34. Li, S.; Zhang, Q. Risk assessment and seasonal variations of dissolved trace elements and heavy metals in the Upper Han River, China. J. Hazard. Mater. 2010, 181, 1051–1058. [Google Scholar] [CrossRef] [PubMed]
  35. US Environmental Protection Agency (USEPA). Risk Assessment Guidance for Superfund (RAGS). In Volume I: Human Health Evaluation Manual (Part E, Supplemental Guidance for Dermal Risk Assessment) Final; US Environmental Protection Agency: Washington, DC, USA, 2004. [Google Scholar]
  36. Jin, L.; Zhang, G.; Tian, H. Current state of sewage treatment in China. Water Res. 2014, 66, 85–98. [Google Scholar] [CrossRef] [PubMed]
  37. Barth, E.F.; Brenner, R.C.; Lewis, R.F. Chemical-biological control of nitrogen and phosphorus in wastewater effluent. J. Water Pollut. Control Fed. 1968, 40, 2040–2054. [Google Scholar]
  38. Liao, Z.; Hu, T.; Roker, S.A.C. An obstacle to China’s WWTPs: The COD and BOD standards for discharge into municipal sewers. Environ. Sci. Pollut. Res. 2015, 22, 16434–16440. [Google Scholar] [CrossRef] [PubMed]
  39. Monteith, H.D.; Sahely, H.R.; MacLean, H.L.; Bagley, D.M. A rational procedure for estimation of greenhouse-gas emissions from municipal wastewater treatment plants. Water Environ. Res. 2005, 77, 390–403. [Google Scholar] [CrossRef] [PubMed]
  40. Wang, J.; Zhang, J.; Wang, J.; Qi, P.; Ren, Y.; Hu, Z. Nitrous oxide emissions from a typical northern Chinese municipal wastewater treatment plant. Desalination Water Treat. 2011, 32, 145–152. [Google Scholar] [CrossRef]
  41. Dionisi, D.; Levantesi, C.; Majone, M.; Bornoroni, L.; De Sanctis, M. Effect of micropollutants (organic xenobiotics and heavy metals) on the activated sludge process. Ind. Eng. Chem. Res. 2007, 46, 6762–6769. [Google Scholar] [CrossRef]
  42. Brown, M.J.; Lester, J.N. Metal removal in activated sludge: The role of bacterial extracellular polymers. Water Res. 1979, 13, 817–837. [Google Scholar] [CrossRef]
  43. Stephenson, T.; Lester, J.N. Heavy metal behaviour during the activated sludge process I. Extent of soluble and insoluble metal removal. Sci. Total Environ. 1987, 63, 199–214. [Google Scholar] [CrossRef]
  44. Couillard, D.; Chartier, M. Removal of metals from aerobic sludges by biological solubilization in batch reactors. J. Biotechnol. 1991, 20, 163–180. [Google Scholar] [CrossRef]
  45. Papa, M.; Pedrazzani, R.; Bertanza, G. How green are environmental technologies? A new approach for a global evaluation: The case of WWTP effluents ozonation. Water Res. 2013, 47, 3679–3687. [Google Scholar] [CrossRef] [PubMed]
  46. Papa, M.; Alfonsín, C.; Moreira, M.T.; Bertanza, G. Ranking wastewater treatment trains based on their impacts and benefits on human health: A “Biological Assay and Disease” approach. J. Clean. Product. 2016, 113, 311–317. [Google Scholar] [CrossRef]
Figure 1. The effluent eutrophication potential of different WWTPs.
Sustainability 08 00984 g001
Figure 2. The effluent GHG emission of different WWTPs.
Sustainability 08 00984 g002
Figure 3. The effluent human health risk of pathogens.
Sustainability 08 00984 g003
Figure 4. The proposed framework for the ecosystem-based WWTPs.
Sustainability 08 00984 g004
Table 1. Information about the design of wastewater treatment plants.
WWTPTreatment ProcessCapacity (104 m3/Day)
WWTP1AB/Oxidation Ditch30
WWTP2AB/Oxidation Ditch35
WWTP3MUCT56
WWTP4Oxidation Ditch3
WWTP5BIOSTYR5
WWTP6A2O5
WWTP7A2O5
Table 2. Influent and effluent water quality of WWTPs.
InfluentWWTP1WWTP2WWTP3WWTP4WWTP5WWTP6WWTP7
Treated Water (104 m3/year)9968.5711,247.0620,839.92839.941341.106902.571186.87
SS (mg/L)328.13234.42395.73413.91164.92144.12312.40
COD (mg/L)386.30249.98262.37490.69142.55288.09210.37
BOD5 (mg/L)121.3585.4893.56138.7344.13111.7166.47
NH4-N (mg/L)43.8137.8030.0327.5721.5824.0716.67
TN (mg/L)55.6344.5640.7639.5126.5633.9020.74
TP (mg/L)5.924.565.398.033.484.623.73
Cr (mg/L)0.0120.0090.0070.0090.0120.1260.061
As (mg/L)0.0100.0110.0100.0150.0100.0100.010
Hg (μg/L)0.0830.1310.1070.1380.9980.0890.356
Pb (mg/L)0.0190.0320.0180.0230.0120.0120.019
Cd (mg/L)0.0010.0010.0010.0010.0010.0020.001
Fecal coliforms (CFU/L)4.02 × 1085.05 × 1082.73 × 1082.84 × 1081.53 × 1081.56 × 1085.30 × 107
EffluentWWTP1WWTP2WWTP3WWTP4WWTP5WWTP6WWTP7
SS (mg/L)7.078.708.3917.246.905.504.67
COD (mg/L)19.1619.9019.1342.8915.0517.6113.40
BOD5 (mg/L)3.163.002.667.201.852.991.80
NH4-N (mg/L)4.173.990.5115.430.873.070.57
TN (mg/L)13.4413.6511.9517.409.8410.596.46
TP (mg/L)0.380.4150.3431.320.200.440.10
Cr (mg/L)0.0030.0040.0030.0040.0050.0100.005
As (mg/L)0.0100.0100.0100.0100.0100.0090.010
Hg (μg/L)0.0340.0470.0600.0410.0770.0550.043
Pb (mg/L)0.0110.0120.0120.0130.0110.0090.012
Cd (mg/L)0.0010.0010.0010.0010.0010.0010.001
Fecal coliforms (CFU/L)2.83 × 1035.37 × 1032.10 × 1032.20 × 1031.23 × 1024.1 × 1031.77 × 101
Table 3. Technical performance of WWTPs.
Removal Capacity (kg·COD-eq/m3)WWTP1WWTP2WWTP3WWTP4WWTP5WWTP6WWTP7
AB/Oxidation DitchAB/Oxidation DitchMUCTOxidation DitchBIOSTYRA2OA2O
COD0.370.230.240.450.130.270.20
BOD50.240.160.180.260.080.220.13
SS0.640.450.770.790.320.280.62
TN0.840.620.580.440.330.470.29
TP0.550.410.500.670.330.420.36
Total COD-eq2.641.882.282.621.191.651.59
Removal Efficiency (%)WWTP1WWTP2WWTP3WWTP4WWTP5WWTP6WWTP7
COD95.0492.0492.7191.2689.4493.8993.63
BOD597.3996.4997.1694.8195.8297.3397.29
SS97.8496.2997.8895.8495.8296.1898.51
TN75.8469.3770.6855.9562.9468.7568.84
TP93.5790.8993.6383.6194.1890.5997.26
Total CODeq88.4184.0087.8882.0882.6685.0590.56
Table 4. Ecological risk of effluent heavy metals from all WWTPs.
WWTPRemoval Efficiency (%) E r i RI
CrAsHgPbCdCrAsHgPbCd
WWTP172.880.0058.9040.506.780.032.002.715.633.0013.37
WWTP262.595.6764.0763.115.470.042.023.755.833.0514.69
WWTP355.950.0044.0429.36−3.170.032.004.796.213.1516.17
WWTP458.4633.0970.5943.178.060.042.003.256.513.1114.91
WWTP561.270.0092.298.70−2.380.052.006.155.383.3116.89
WWTP692.104.0237.8718.2438.950.101.884.444.722.9614.10
WWTP792.500.0088.0336.322.940.052.003.416.053.3014.81
Table 5. Human health risk of effluent heavy metals from all WWTPs.
Risk TypesHeavy MetalsWWTP1WWTP2WWTP3WWTP4WWTP5WWTP6WWTP7
HI (Adults)Cr5.64 × 10−66.34 × 10−65.76 × 10−66.85 × 10−68.10 × 10−61.78 × 10−58.21 × 10−6
As4.37 × 10−54.41 × 10−54.37 × 10−54.37 × 10−54.37 × 10−54.10 × 10−54.37 × 10−5
Hg2.23 × 10−73.08 × 10−73.93 × 10−72.67 × 10−75.05 × 10−73.64 × 10−72.80 × 10−7
Pb4.03 × 10−64.17 × 10−64.44 × 10−64.66 × 10−63.85 × 10−63.38 × 10−64.33 × 10−6
Cd1.73 × 10−66.86 × 10−67.08 × 10−67.00 × 10−67.44 × 10−66.67 × 10−67.43 × 10−6
HI (Children)Cr1.40 × 10−41.58 × 10−41.43 × 10−41.71 × 10−42.02 × 10−44.42 × 10−42.04 × 10−4
As4.44 × 10−34.49 × 10−34.44 × 10−34.44 × 10−34.44 × 10−34.17 × 10−34.44 × 10−3
Hg1.51 × 10−52.09 × 10−52.66 × 10−51.81 × 10−53.42 × 10−52.47 × 10−51.90 × 10−5
Pb4.29 × 10−44.44 × 10−44.73 × 10−44.96 × 10−44.10 × 10−43.59 × 10−44.61 × 10−4
Cd1.33 × 10−41.36 × 10−41.40 × 10−41.38 × 10−41.47 × 10−41.32 × 10−41.47 × 10−4
CR (Adults)Cr5.72 × 10−86.43 × 10−85.84 × 10−86.95 × 10−88.22 × 10−81.80 × 10−78.33 × 10−8
As1.44 × 10−81.45 × 10−81.44 × 10−81.44 × 10−81.44 × 10−81.35 × 10−81.44 × 10−8
Pb5.29 × 10−95.49 × 10−95.84 × 10−96.13 × 10−95.07 × 10−94.44 × 10−95.69 × 10−9
Cd5.93 × 10−96.03 × 10−96.22 × 10−96.15 × 10−96.54 × 10−95.86 × 10−96.52 × 10−9
CR (Children)Cr1.52 × 10−61.70 × 10−61.55 × 10−61.84 × 10−62.18 × 10−64.78 × 10−62.21 × 10−6
As1.71 × 10−71.73 × 10−71.71 × 10−71.71 × 10−71.71 × 10−71.61 × 10−71.71 × 10−7
Pb6.43 × 10−86.67 × 10−87.10 × 10−87.44 × 10−86.15 × 10−85.39 × 10−86.91 × 10−8
Cd7.20 × 10−87.32 × 10−87.55 × 10−87.46 × 10−87.94 × 10−87.11 × 10−87.92 × 10−8

