Article

Exploring Spatial Distribution of Pollen Allergenic Risk Zones in Urban China

1
Institute of Remote Sensing and Earth Sciences, Hangzhou Normal University, Hangzhou 311121, China
2
Zhejiang Provincial Key Laboratory of Urban Wetland and Regional Change Studies, Hangzhou 311121, China
3
Department of Geography, Kent State University, Kent, OH 44240, USA
*
Author to whom correspondence should be addressed.
Sustainability 2016, 8(10), 978; https://doi.org/10.3390/su8100978
Submission received: 23 July 2016 / Revised: 19 September 2016 / Accepted: 21 September 2016 / Published: 28 September 2016

Abstract

:
The growth of urban areas and the impact of urban ecosystems on public health and urban sustainability have been leading issues of both academic and public interest. More than 100 million Chinese people suffer from pollen allergy. Pollen allergy induces bronchitis, bronchial asthma, pulmonary heart disease, and may even be life-threatening. Thus, pollen allergies greatly affect the daily life of individuals. High-resolution WorldView-2 remote sensing data and vegetation distribution features were used to detect the dominant tree species in the study area and obtain canopy distribution information on different tree species. In this way, the sources of pollen from different tree species were identified. Using remote sensing technology, the overall accuracy of tree species recognition for the study area exceeds 86%. Most plants in the study area flower during the spring, so the pollen allergenic risk zones are extensive during spring and sparse in fall. Based on the spatial ranges of pollen dispersal during different seasons, areas were identified that might contain pollen concentrations detrimental to pollen-sensitive individuals.

1. Introduction

With the growing trend of urbanization, it is estimated that the majority of the world’s population will live in urban areas. The growth of urban areas and the impact of urban ecosystems on public health and urban sustainability have been leading issues of both academic and public interest. Pollen is the male reproductive cell of spermatophytes. Pollen grains are not easily oxidized and are small in size, occurring in large quantities [1,2]. The main reason of inducing the seasonal allergic rhinitis and asthma is the airborne allergic pollen, which is largely caused by the main inhalation allergens in outdoor air [3,4,5]. The impact of tree species and associated urban landscape change have raised growing concerns about the public health risk issues involved in daily activities of individuals. Some people have allergic reactions after inhaling pollen, commonly referred to as a pollen allergy. Pollen allergies show significant seasonal and regional features. In the USA, 2%–10% residents suffer from pollen allergies, and most cases are associated with Ambrosia artemisiifolia (ragweed) [6,7]. In Mexico, 23%–31% of allergic reactions are due to pollen allergy [8,9,10]. In Japan, about 6 million people are affected by pollen, mainly from Cryptomeria japonica (L. f.) D. Don [11]. The allergenic pollen in northern China is mainly from Ambrosia artemisiifolia L. which belongs to the wild Compositae weeds in Artemisia [12,13]. Typical manifestations of pollen allergy include sneezing, runny nose, watery eyes, and even severe itchiness of the nose, eyes, and external auditory canal. In severe cases, pollen allergy can induce bronchitis, bronchial asthma, pulmonary heart disease, etc., thereby affecting the daily life, work, and travel of the affected population [14]. Without timely treatment, pollen allergy can develop into chronic asthma, conjunctivitis, pneumonia, and other respiratory diseases, and in severe cases can cause heart failure, kidney damage, or other fatal diseases, or even shock and sudden cerebral death [14]. Exact data on the overall morbidity of pollen allergies in China have yet to be reported, but [15] estimated 0.9% morbidity (up to 5% in endemic regions) from pollen allergies in China, with an increasing trend.
Traditional methods to detect airborne pollen needs to be conducted through the point of distribution of pollen collection device to get pollen concentration. So a large amount of pollen collection devices are needed to get a more complete regional surface pollen distribution information, which requires much time and energy [16,17,18]. Remote sensing technology has incomparable ground monitoring capabilities, with high time-effectiveness, large areal coverage, and traceability. By the complementary of the two methods, we can not only get a large area of the distribution of the pollen, but also can know some points of the pollen concentration information.
In this study, by utilizing high-resolution satellite remote sensing data, an object-oriented classification method was used to recognize tree species. A field investigation was conducted to verify the classification results, and then information on tree species distribution was extracted for different seasons. Spatial analysis was conducted to extract risk zones for high-level pollen concentration and to analyze the results.

2. Background

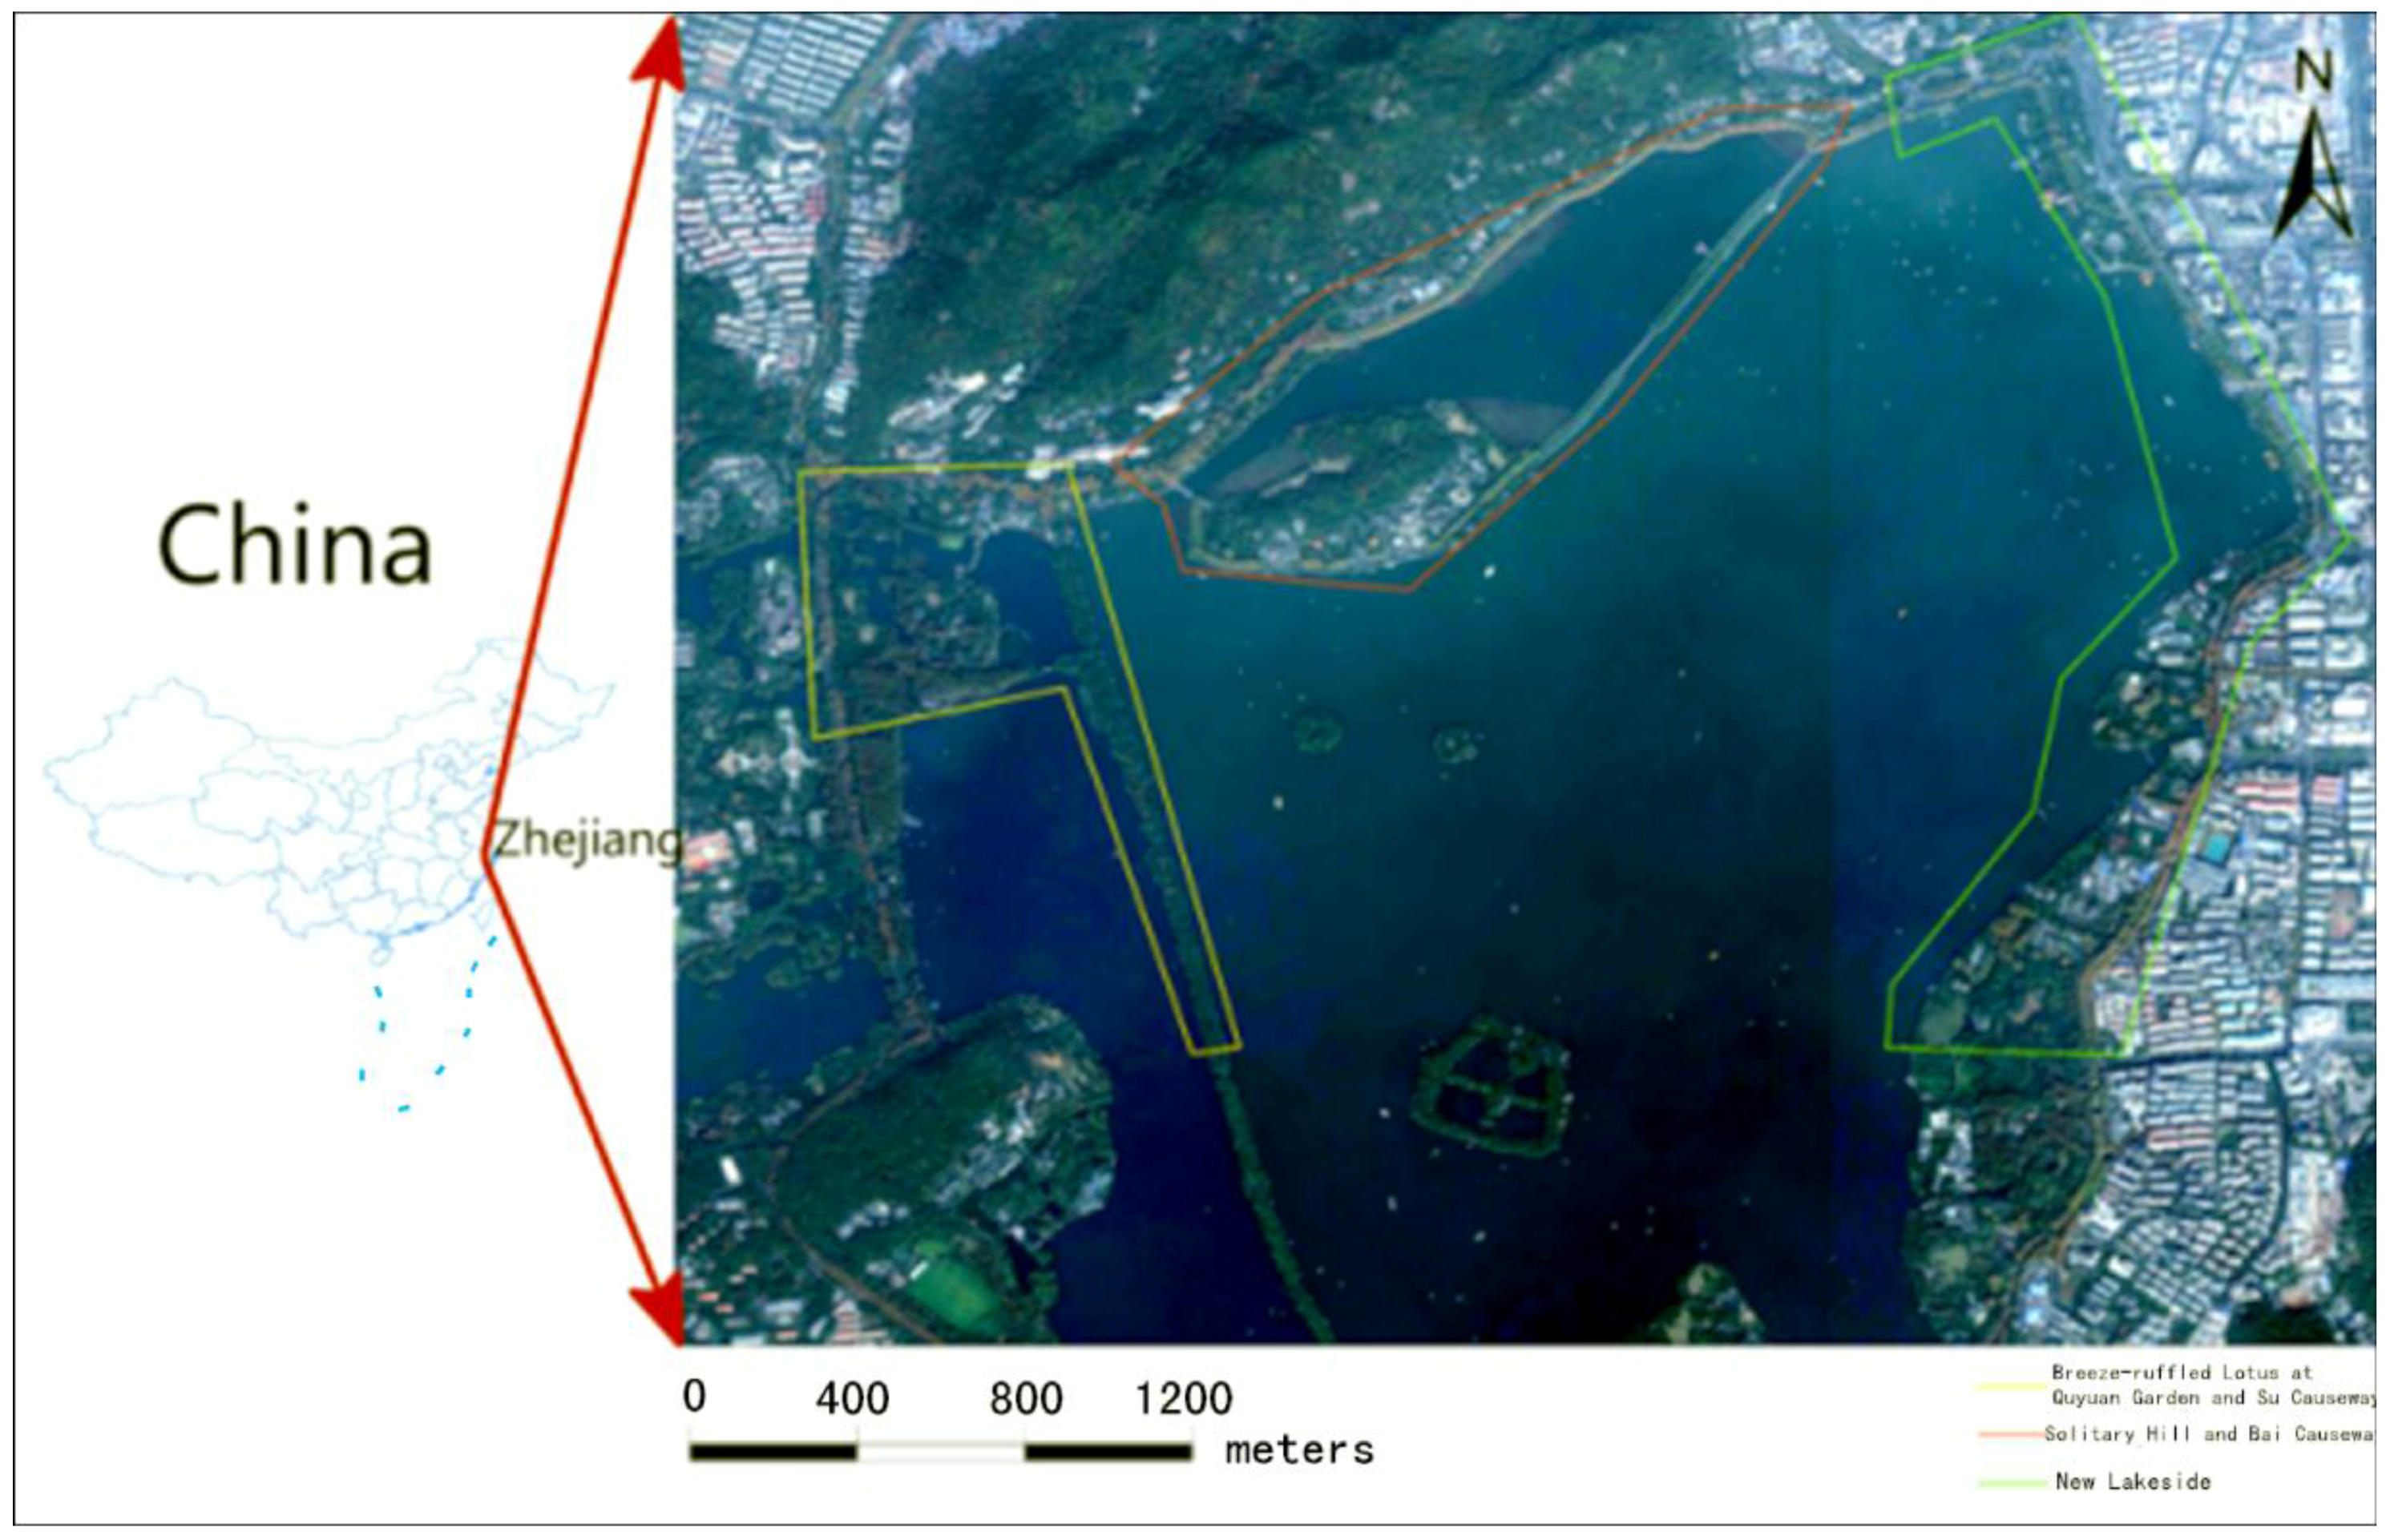
2.1. Overview of Study Area

Though urban areas only account for a small proportion of the earth, the population flow is highly dynamic, bringing in a large number of visitors. Such intensive and rapid human movement exacerbates impacts of pollen allergenic risk zones in Urban China, which has been experiencing a restless and dramatic growth both vertically and horizontally. The study area is located in the West Lake Scenic Area of Hangzhou, Zhejiang Province, China (120°8′E, 30°15′N). This scenic area is of global importance for cultural heritage—especially the plant landscape, receiving many tourists each year from all over the world. This metropolitan area has been the preferred destination for millions of domestic migrants and overseas investors. While studies have indicated that the pollen of these plants can be caused by different degrees of pollen allergy [19]. According to the West Lake Hangzhou Scenic Area Management Committee statistics, the total number of visitors to all pay-sight spots of the West Lake in 2014 was about 15 million person-time. Considering that pay-sight spots attract one-quarter of all visitors to the West Lake Scenic Area, so the total number of visitors to the West Lake Scenic Area in 2014 was estimated at more than 60 million, of which a large overall number would be expected to be pollen sensitive [14]. According to survey results, more than 40% of the total number of tourists visited sites such as Breeze-ruffled Lotus at Quyuan Garden, Su Causeway, Broken Bridge with Thawing Snow, New Lakeside, etc., therefore those representative areas were selected for this study. Zoning and classification of a study area can improve classification accuracy [20,21,22]; since locations have differing vegetation distributions, the study area was divided into three subareas: Breeze-ruffled Lotus at Quyuan Garden and Su Causeway; Solitary Hill and Bai Causeway; and New Lakeside , as shown in Figure 1.

2.2. Study Materials
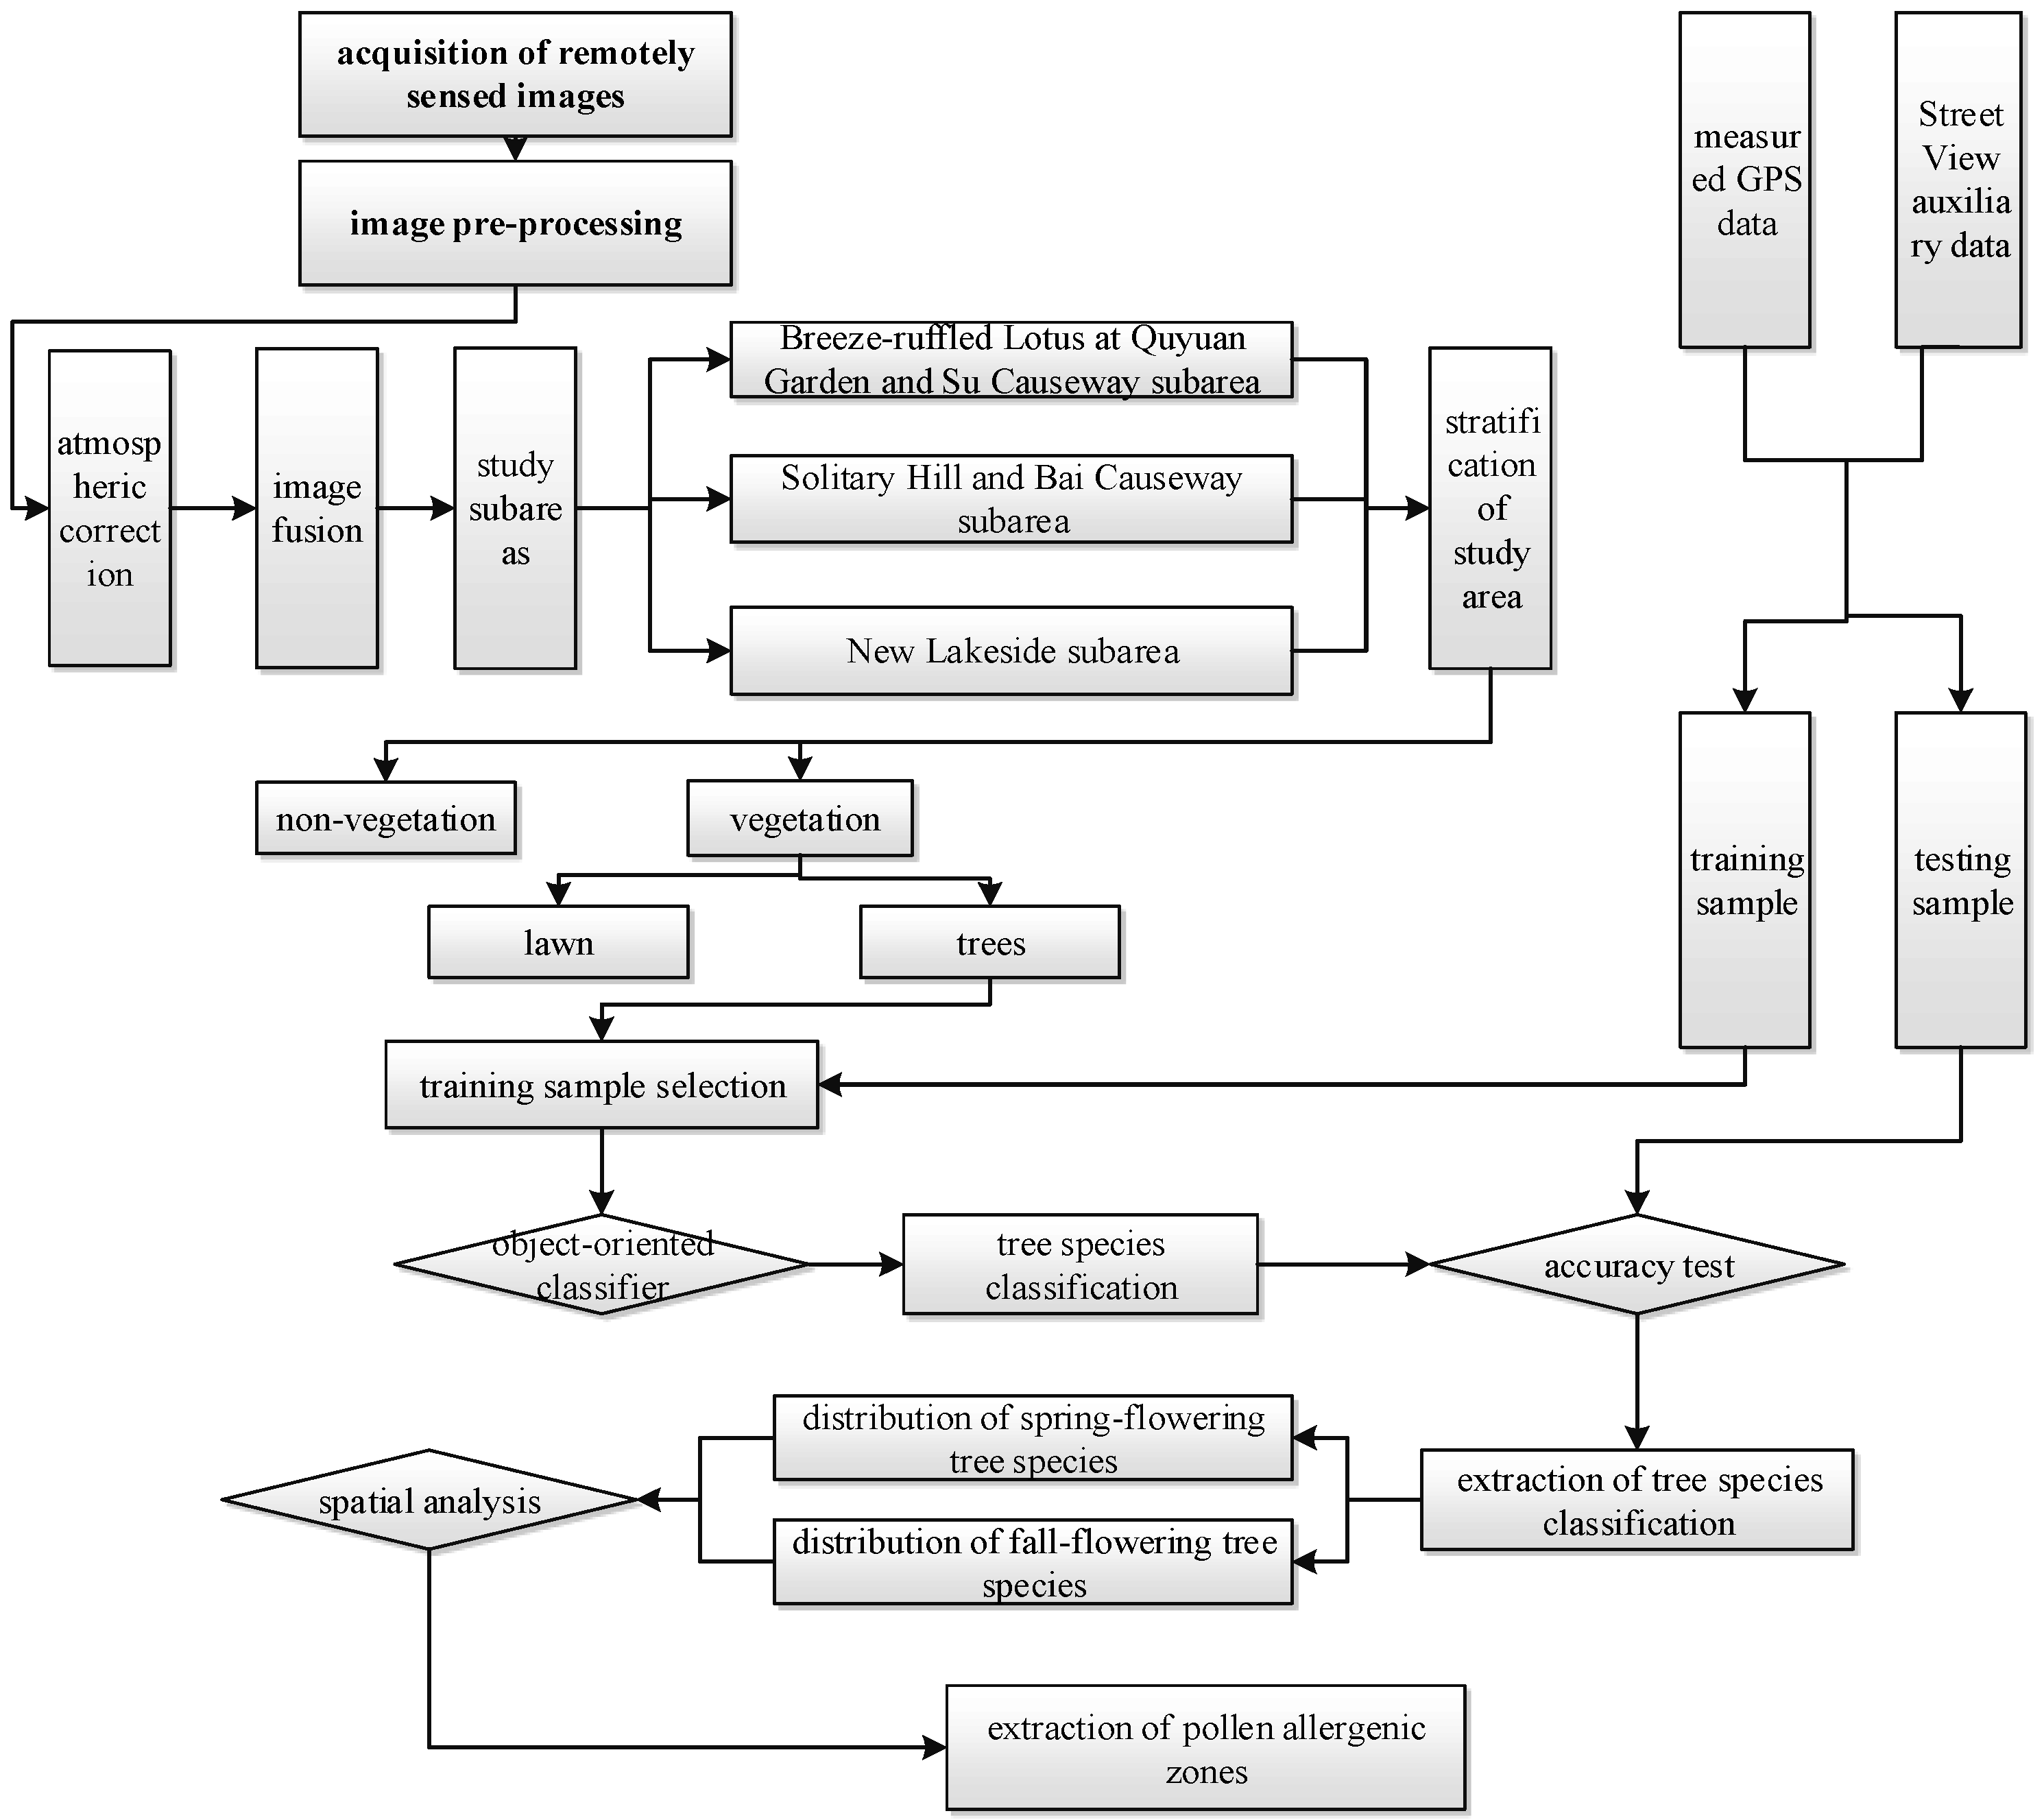
WorldView-2 data for 31 December 2009 were used, including panchromatic data with 0.5 m resolution and multispectral data with 2 m resolution. The survey day was sunny and cloudless, and the remote sensing images were clear with good imaging quality. Field-measured GPS data for the study area were used in combination with auxiliary data from Tencent “Street View Map” images. The data were analyzed using ArcGIS 10.1 (Esri, Redlines, CA, USA) and ENVI 5.0 (Exelis VIS, Boulder, CO, USA) software.

3. Study Methods

The dramatic urban transition in coastal China has led to accelerated urban expansion and a booming tourism industry, which has driven many people to seek various opportunities and move around in urban areas. China’s unprecedented and multifaceted urban growth has generated many fascinating issues for scholarly research. Understanding the interaction between human dynamics and urban environment in China would allow appropriate strategies and policies to be formulated to facilitate the sustainability and environmental justice studies in China. Identifying pollen allergenic risk zones is of interest in urban landscape planning and management. Remote sensing technology was used to identify tree species in the study area. The occurrence and seasonal flowering phases of these species were used to map zones that present pollen allergenic risk. First, high-resolution satellite remote sensing images were pre-processed to extract vegetation cover for the study area [23,24]. Tree types are judged by the information of vegetation spectra and texture—because the different tree species have different canopy shape features, different leaf size and density, and the canopy images reflected in the remote sensing images have different texture features. The gray-level co-occurrence matrix (GLCM) method is usually used to extract texture information [25]. Combined with the field survey data, the classification and distribution range of the species were determined. From this, tree species were identified. Subsequently, the tree species category, distribution range and tree species were verified by means of field survey. Next, the spatial ranges of pollen dispersal were determined from the flowering phases of the various tree species and their patterns of pollen dispersal. Given that pollen spread uses the whole canopy as the dispersal source, the GIS buffer function was used for spatial analysis of the possible pollen dispersal area. Pollen allergenic risk zones of different tree species were extracted separately. Finally, the spatial and seasonal distributions of pollen allergenic risk zones within the study area were determined by integrating the distribution information of pollen allergenic risk zones for different tree species. The detailed process is shown in Figure 2.

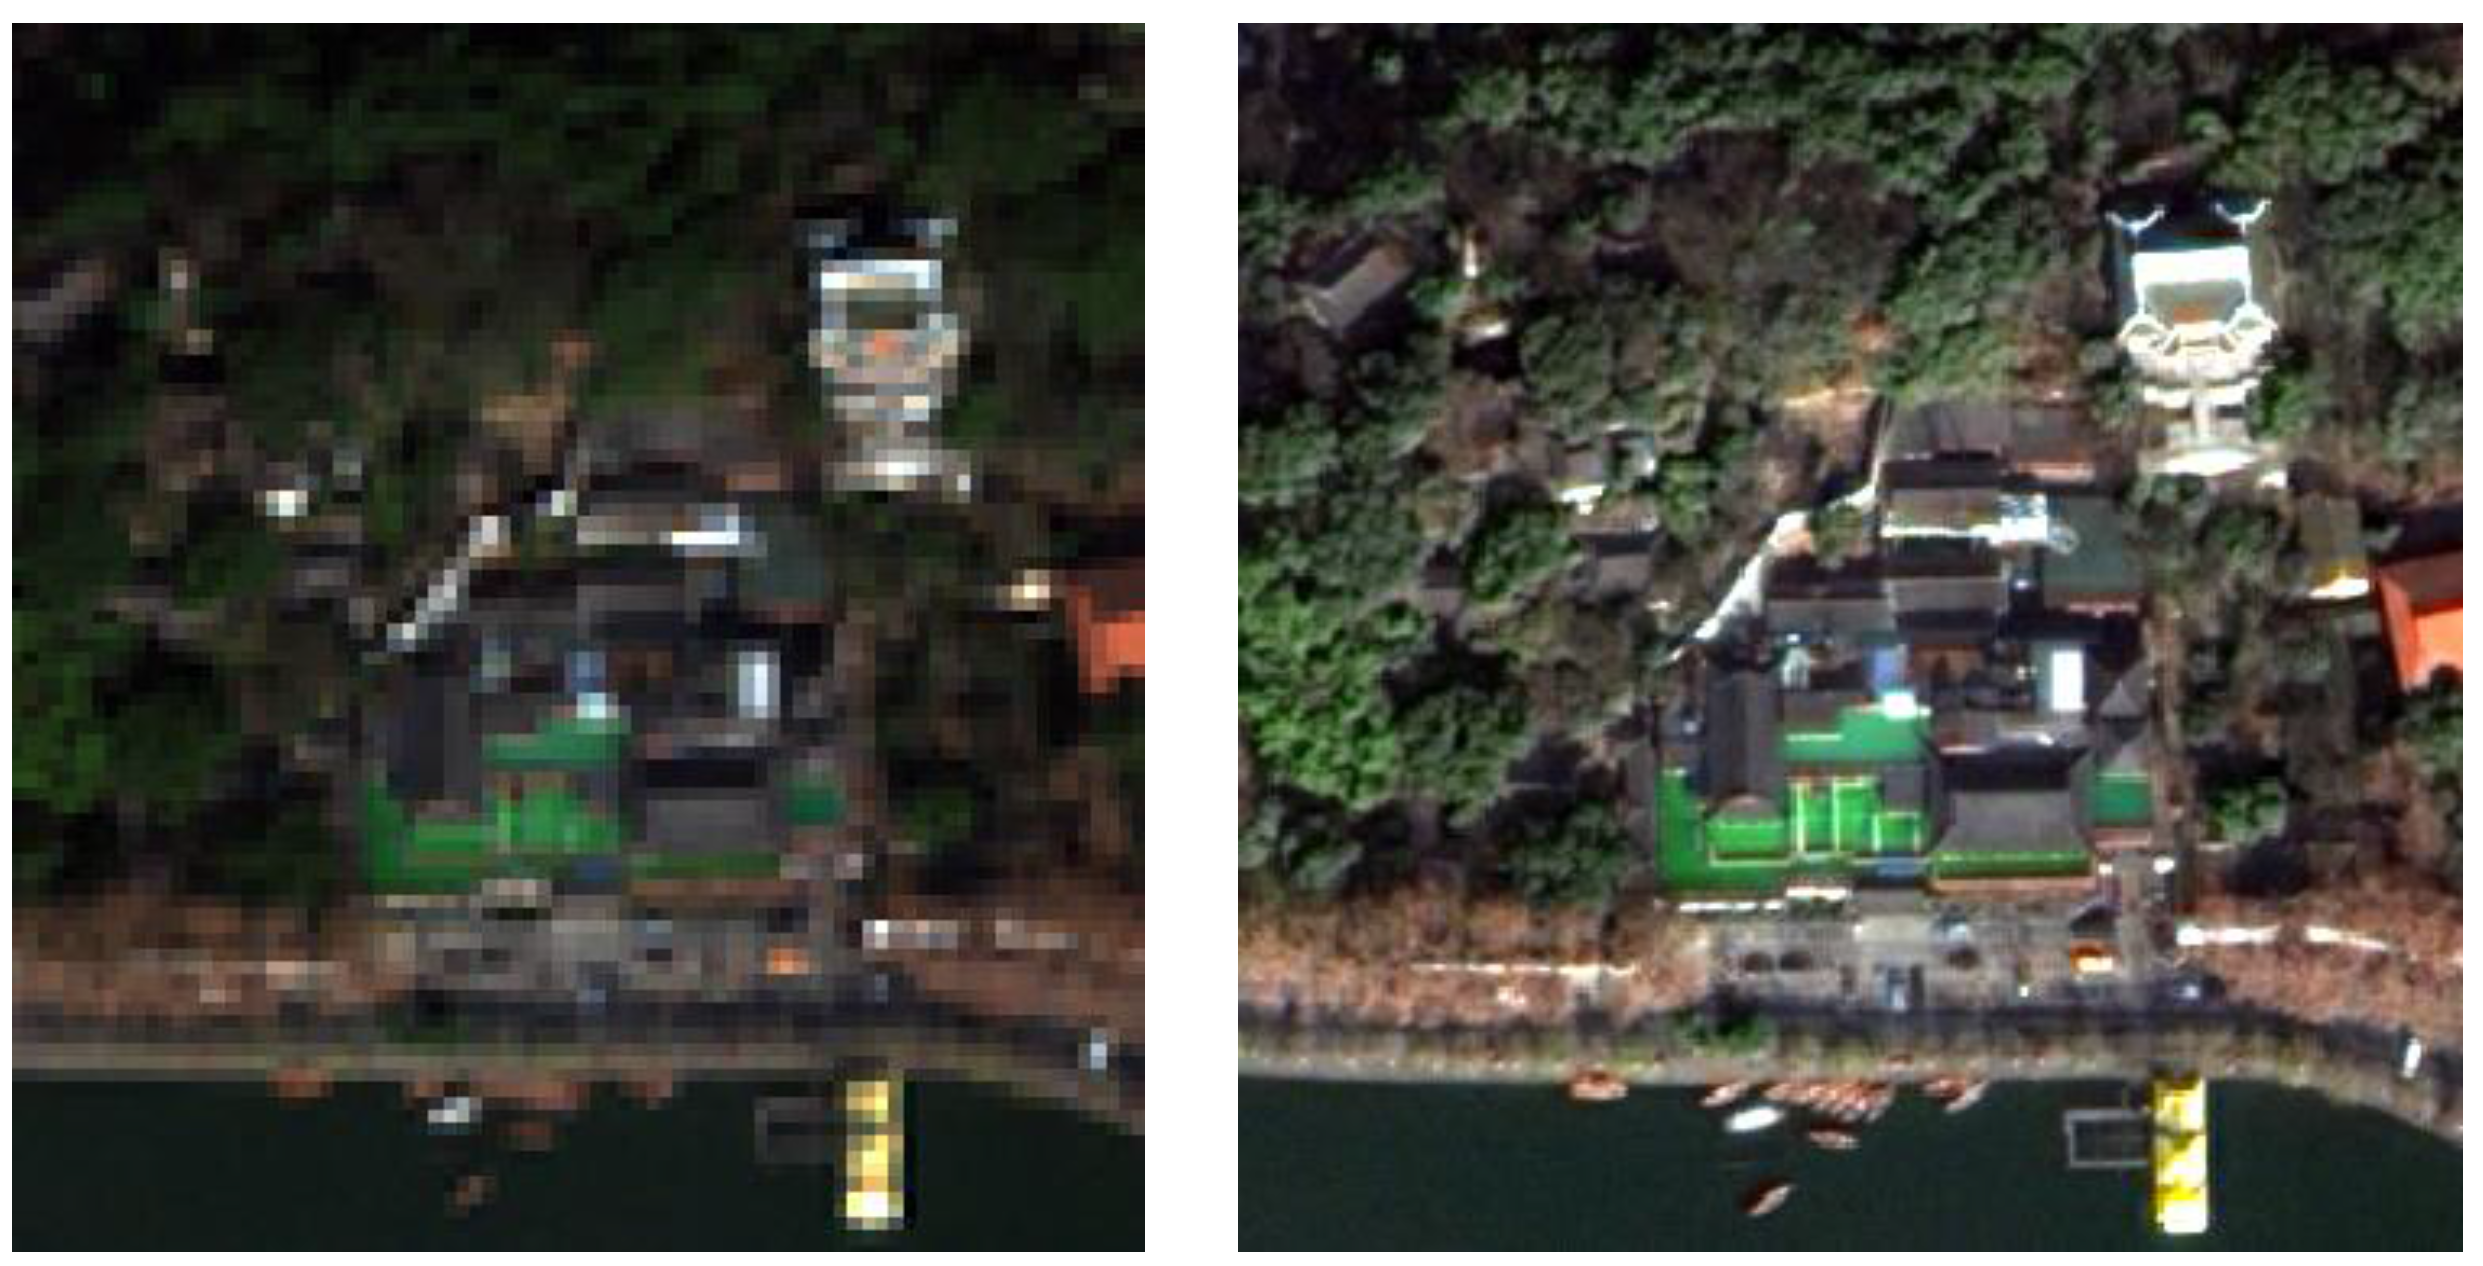
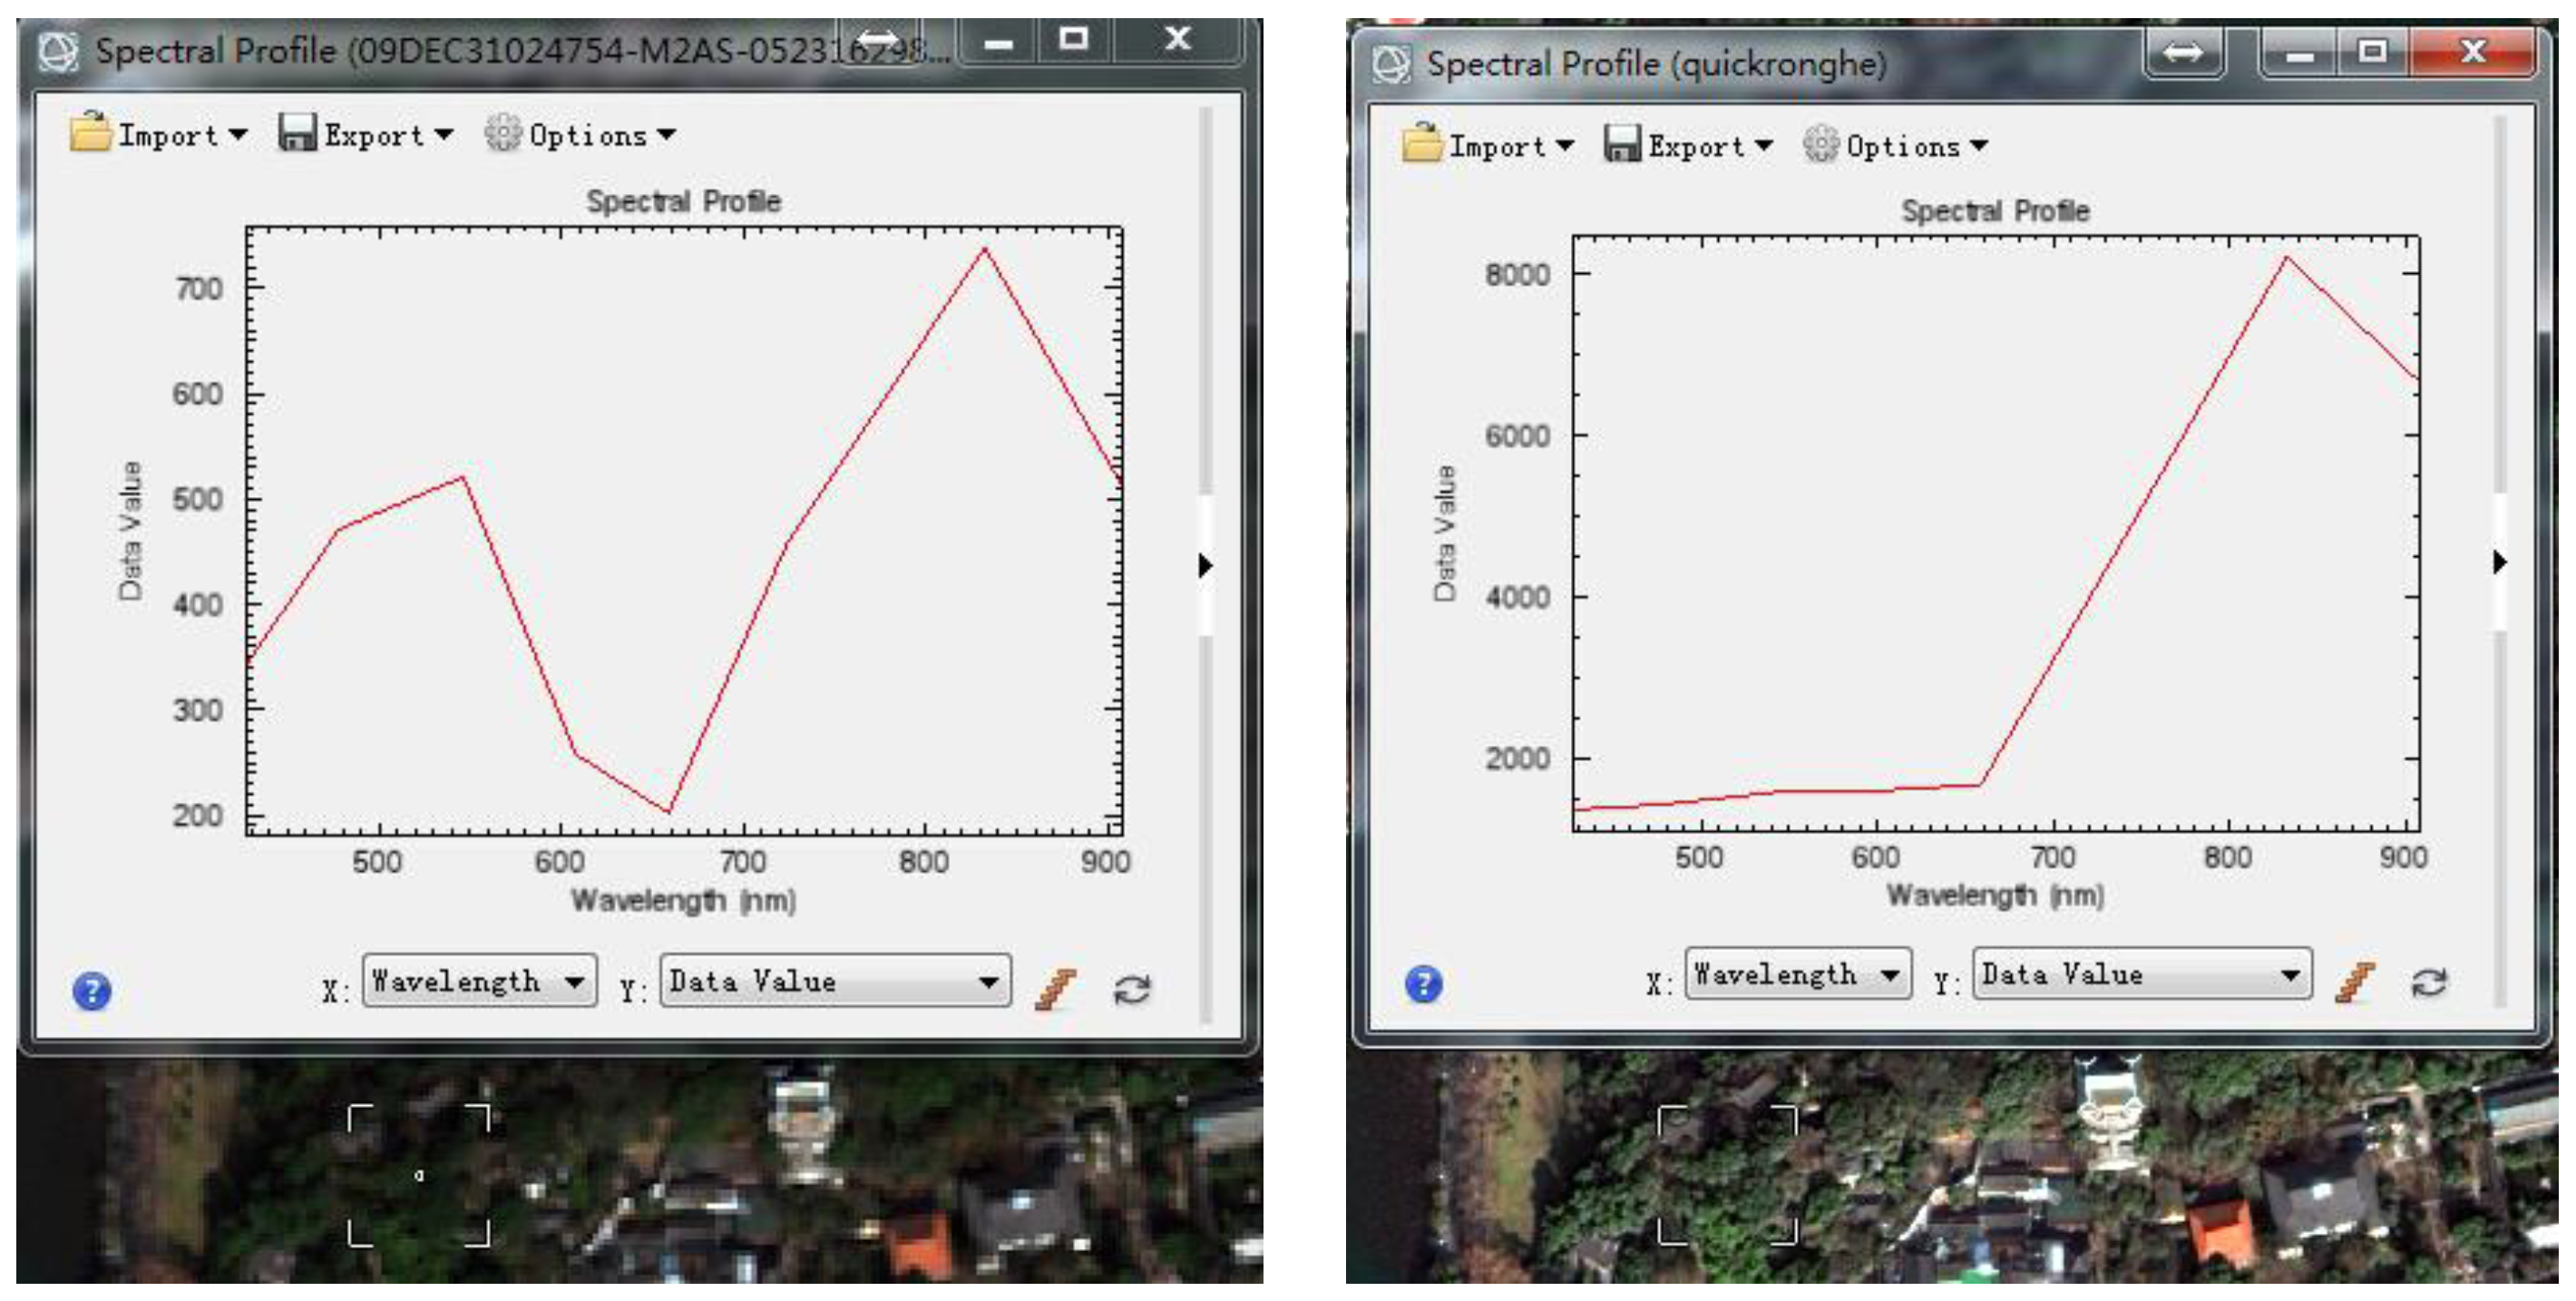
3.1. Processing of Remotely Sensed Images

Recognition of tree species from remotely sensed images requires highly-specific processing. The image processing method utilized WorldView-2’s advantages, high resolution and abundant spectral information, to maximize the information extracted from the remote sensing images [26,27]. Within a study area, it is usually easy to distinguish evergreen species and deciduous species from images obtained in fall or winter seasons [28,29]. Our images were usually unprocessed or only underwent simple parameter correction processing, and were specifically pre-processed for different research requirements. The images mainly underwent atmospheric correction to faithfully reflect the spectral information of ground objects. Fusion processing was also required for images to determine the spectral features of different ground objects, and to reduce human error during training sample selection and improve classification accuracy. Although high-resolution remote sensing images were used, the phenomenon of “different spectra for the same object, same spectrum for different objects” [30,31] was still observed. This phenomenon was even more pronounced in this study, because it was necessary to differentiate between tree species of the same genus. Hence, pre-classification partition and stratification processing of the study area were still necessary to improve classification accuracy.

3.1.1. Atmospheric Correction

Atmospheric correction was performed to eliminate the influence of light factors on ground object reflection; the influence of atmospheric molecules and aerosol scattering; and the influences of atmospheric substances such as water vapor, carbon dioxide, methane, ozone, etc. on ground object reflection. In this study, the ENVI Quick Atmospheric Correction module was employed to eliminate the influence of atmosphere and light on ground object reflection in images, restoring the actual spectral information of ground objects, obtaining the real reflectivity of ground objects and thereby allowing for quantitative analyses such as inversion of ground object parameters [32]. Comparison between ground object spectral information, before and after quick atmospheric correction, shows that the corrected spectrum curve better fits the actual situation (Figure 3).

3.1.2. Image Band Fusion

For image fusion, panchromatic WorldView-2 satellite images have high resolution and can reflect text information of ground objects, which is however presented in grayscale, and thereby provides poor color representation. Its multispectral spatial resolution is relatively lower than that of the panchromatic band, with less prominent detailed information. However, it includes abundant spectral information and can reflect color conditions of different types of ground objects. In this study, data fusion methods in ENVI software were used to combine the advantages of high spatial resolution of panchromatic data and the broad color range of multi-spectra, to generate new data with both high spatial resolution and prominent color features that facilitated analysis and interpretation of images and to some extent improved the application value of images. The findings indicate that the Gram-Schmidt spectral sharpening fusion method improves image quality. Figure 4 compares the images before and after fusion.

3.1.3. Partition and Stratification

Regarding stratification of the study area, before classification and extraction of remote sensing images, it was considered that since only the vegetation’s canopy information was extracted, masking non-vegetation information from classification using vegetation index could effectively reduce misclassification and improve classification accuracy. Grass lawns were also extracted from vegetation based on different texture information, leaving only trees.

3.2. Recognition of Tree Species

Object-oriented classification is appropriate for differentiating tree species. One of its advantages is to classify based on the texture, shape, and proximal information of different image objects of different types that share similar spectral features [33]. Classification of remote sensing imagery also relies on the accuracy of interpretation marks and the selection of a training sample. In this study, ENVI software was employed and object-oriented classification was used to perform ground object classification of images. Additionally, the classification results, class vector data, and classification statistical data were exported to facilitate data analysis and post-classification processing.
Visual interpretation markers were mainly determined from field GPS survey and verification, and through auxiliary recognition of Tencent “Street View Map” software (Tencent, Shenzhen, China). The interpretation markers are shown in Table 1.

4. Results and Analysis

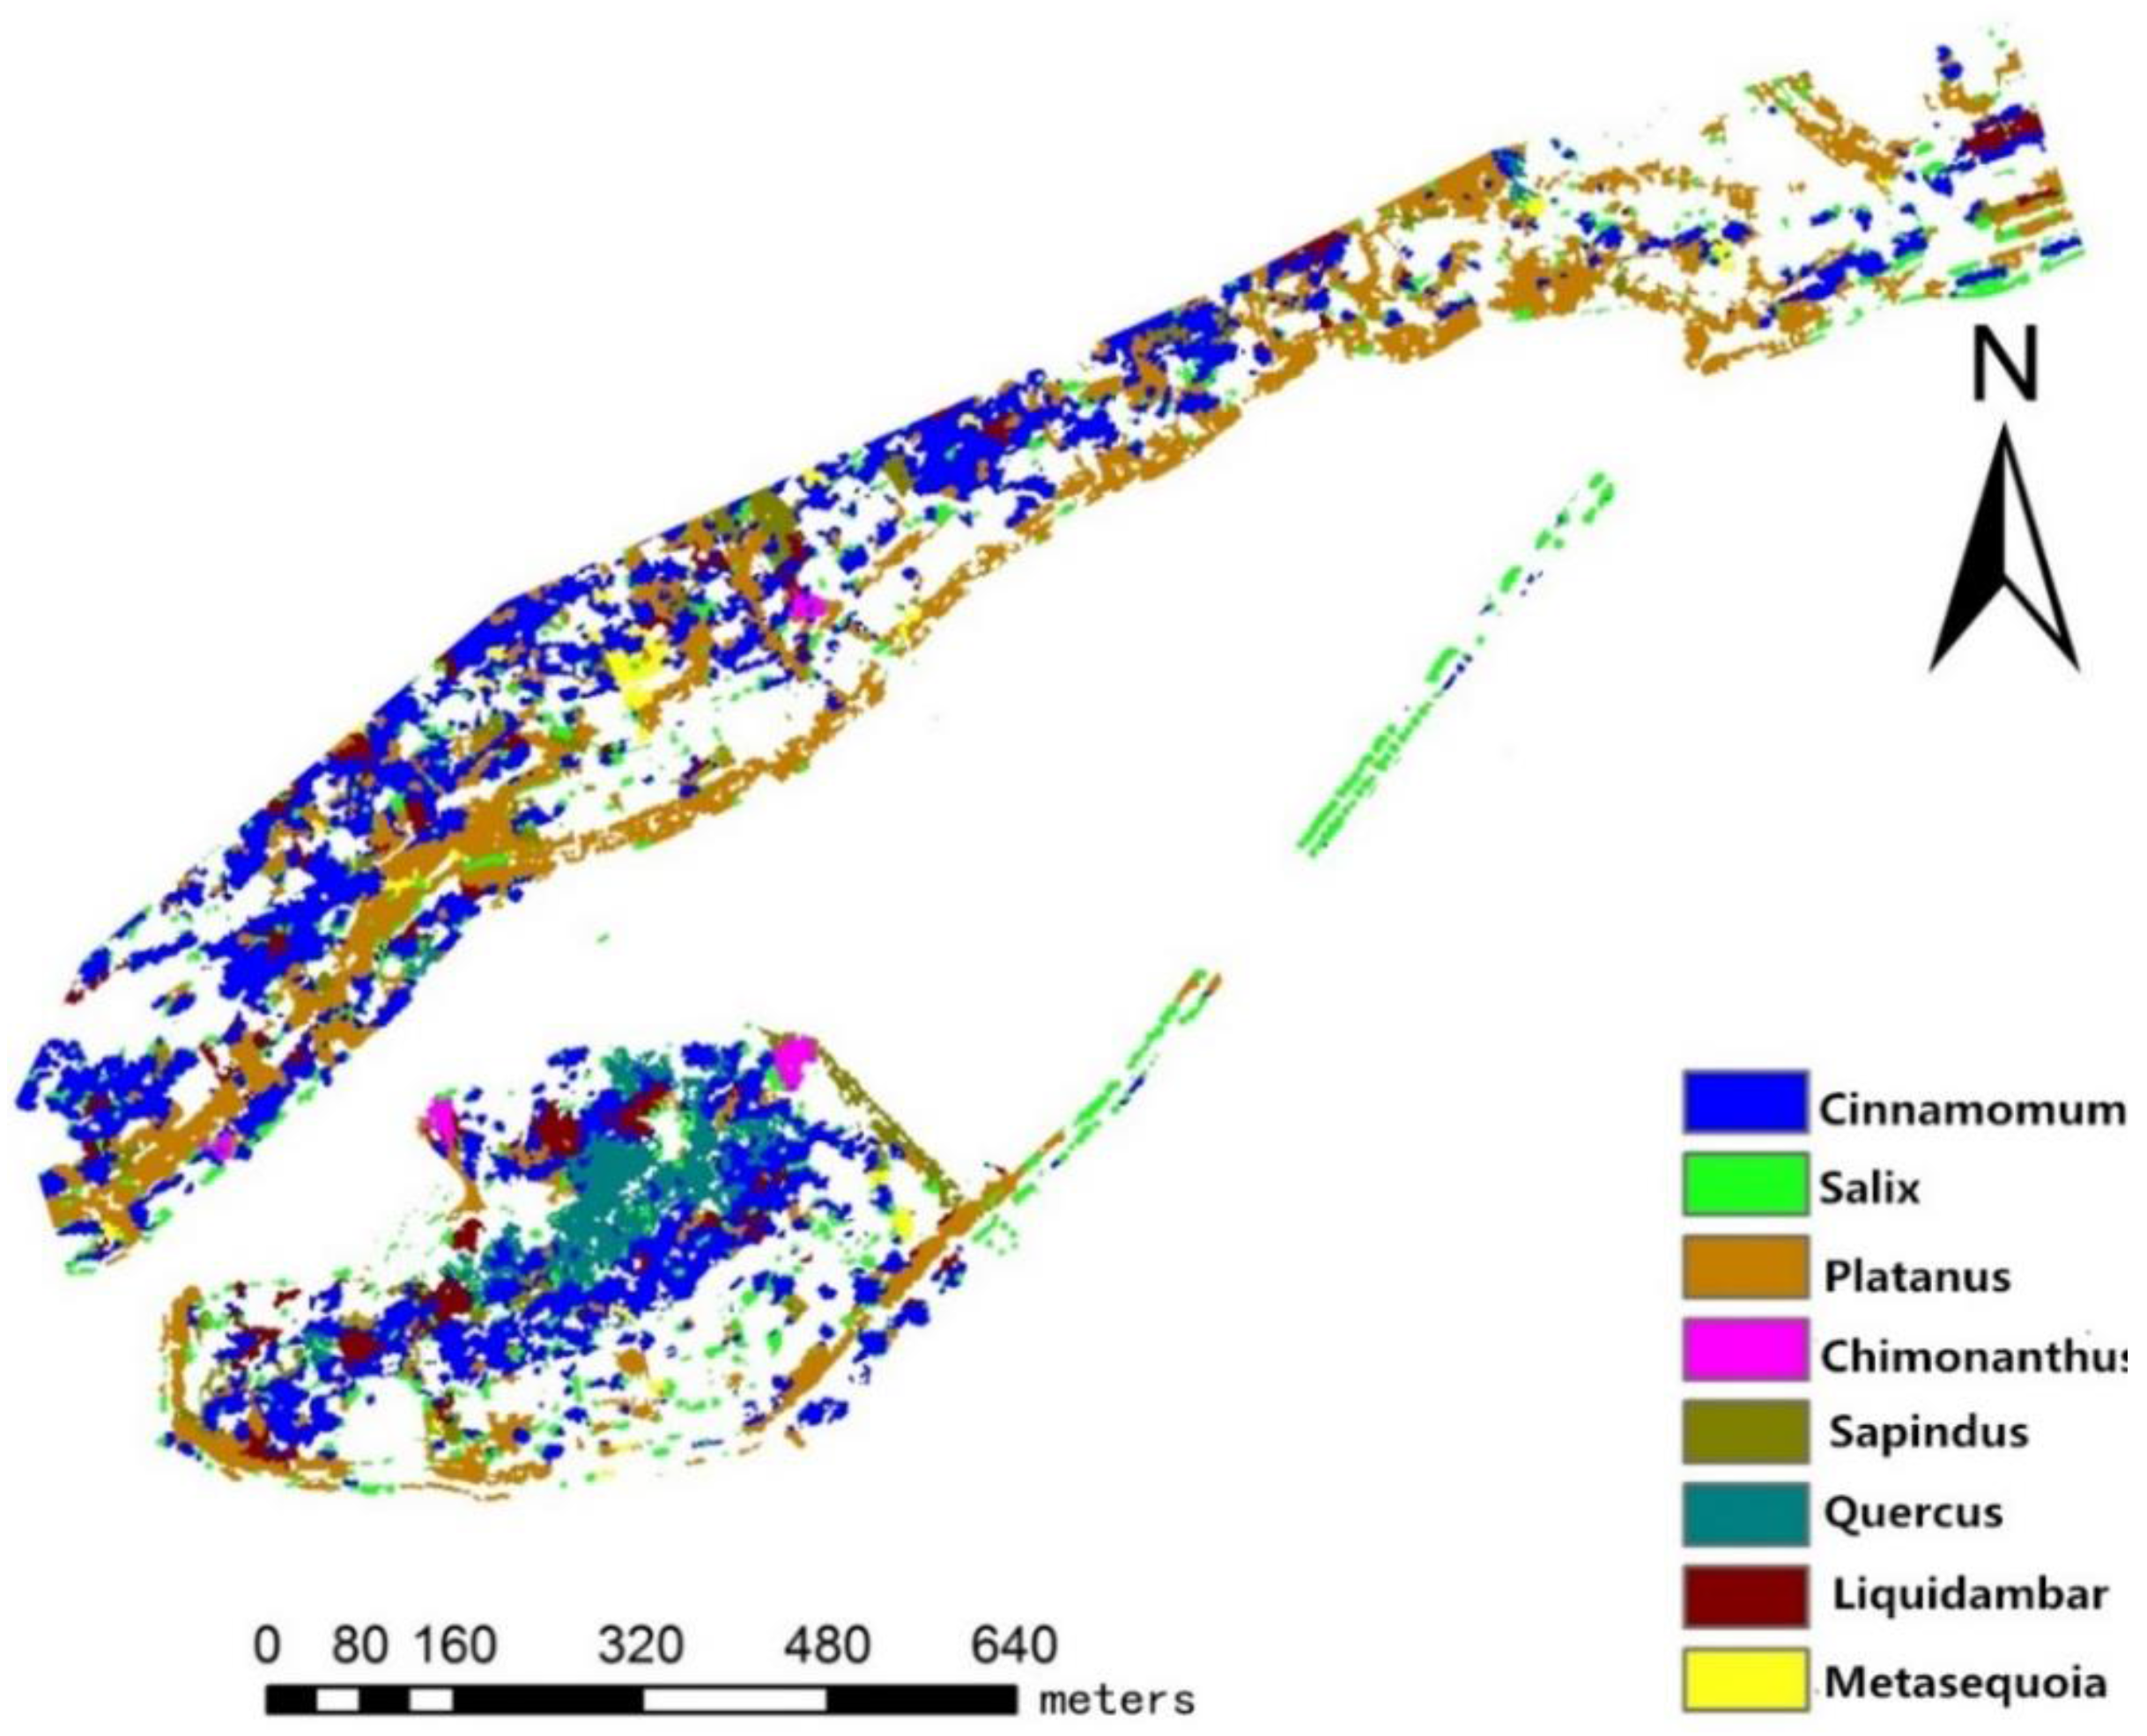
4.1. Recognition of Tree Species

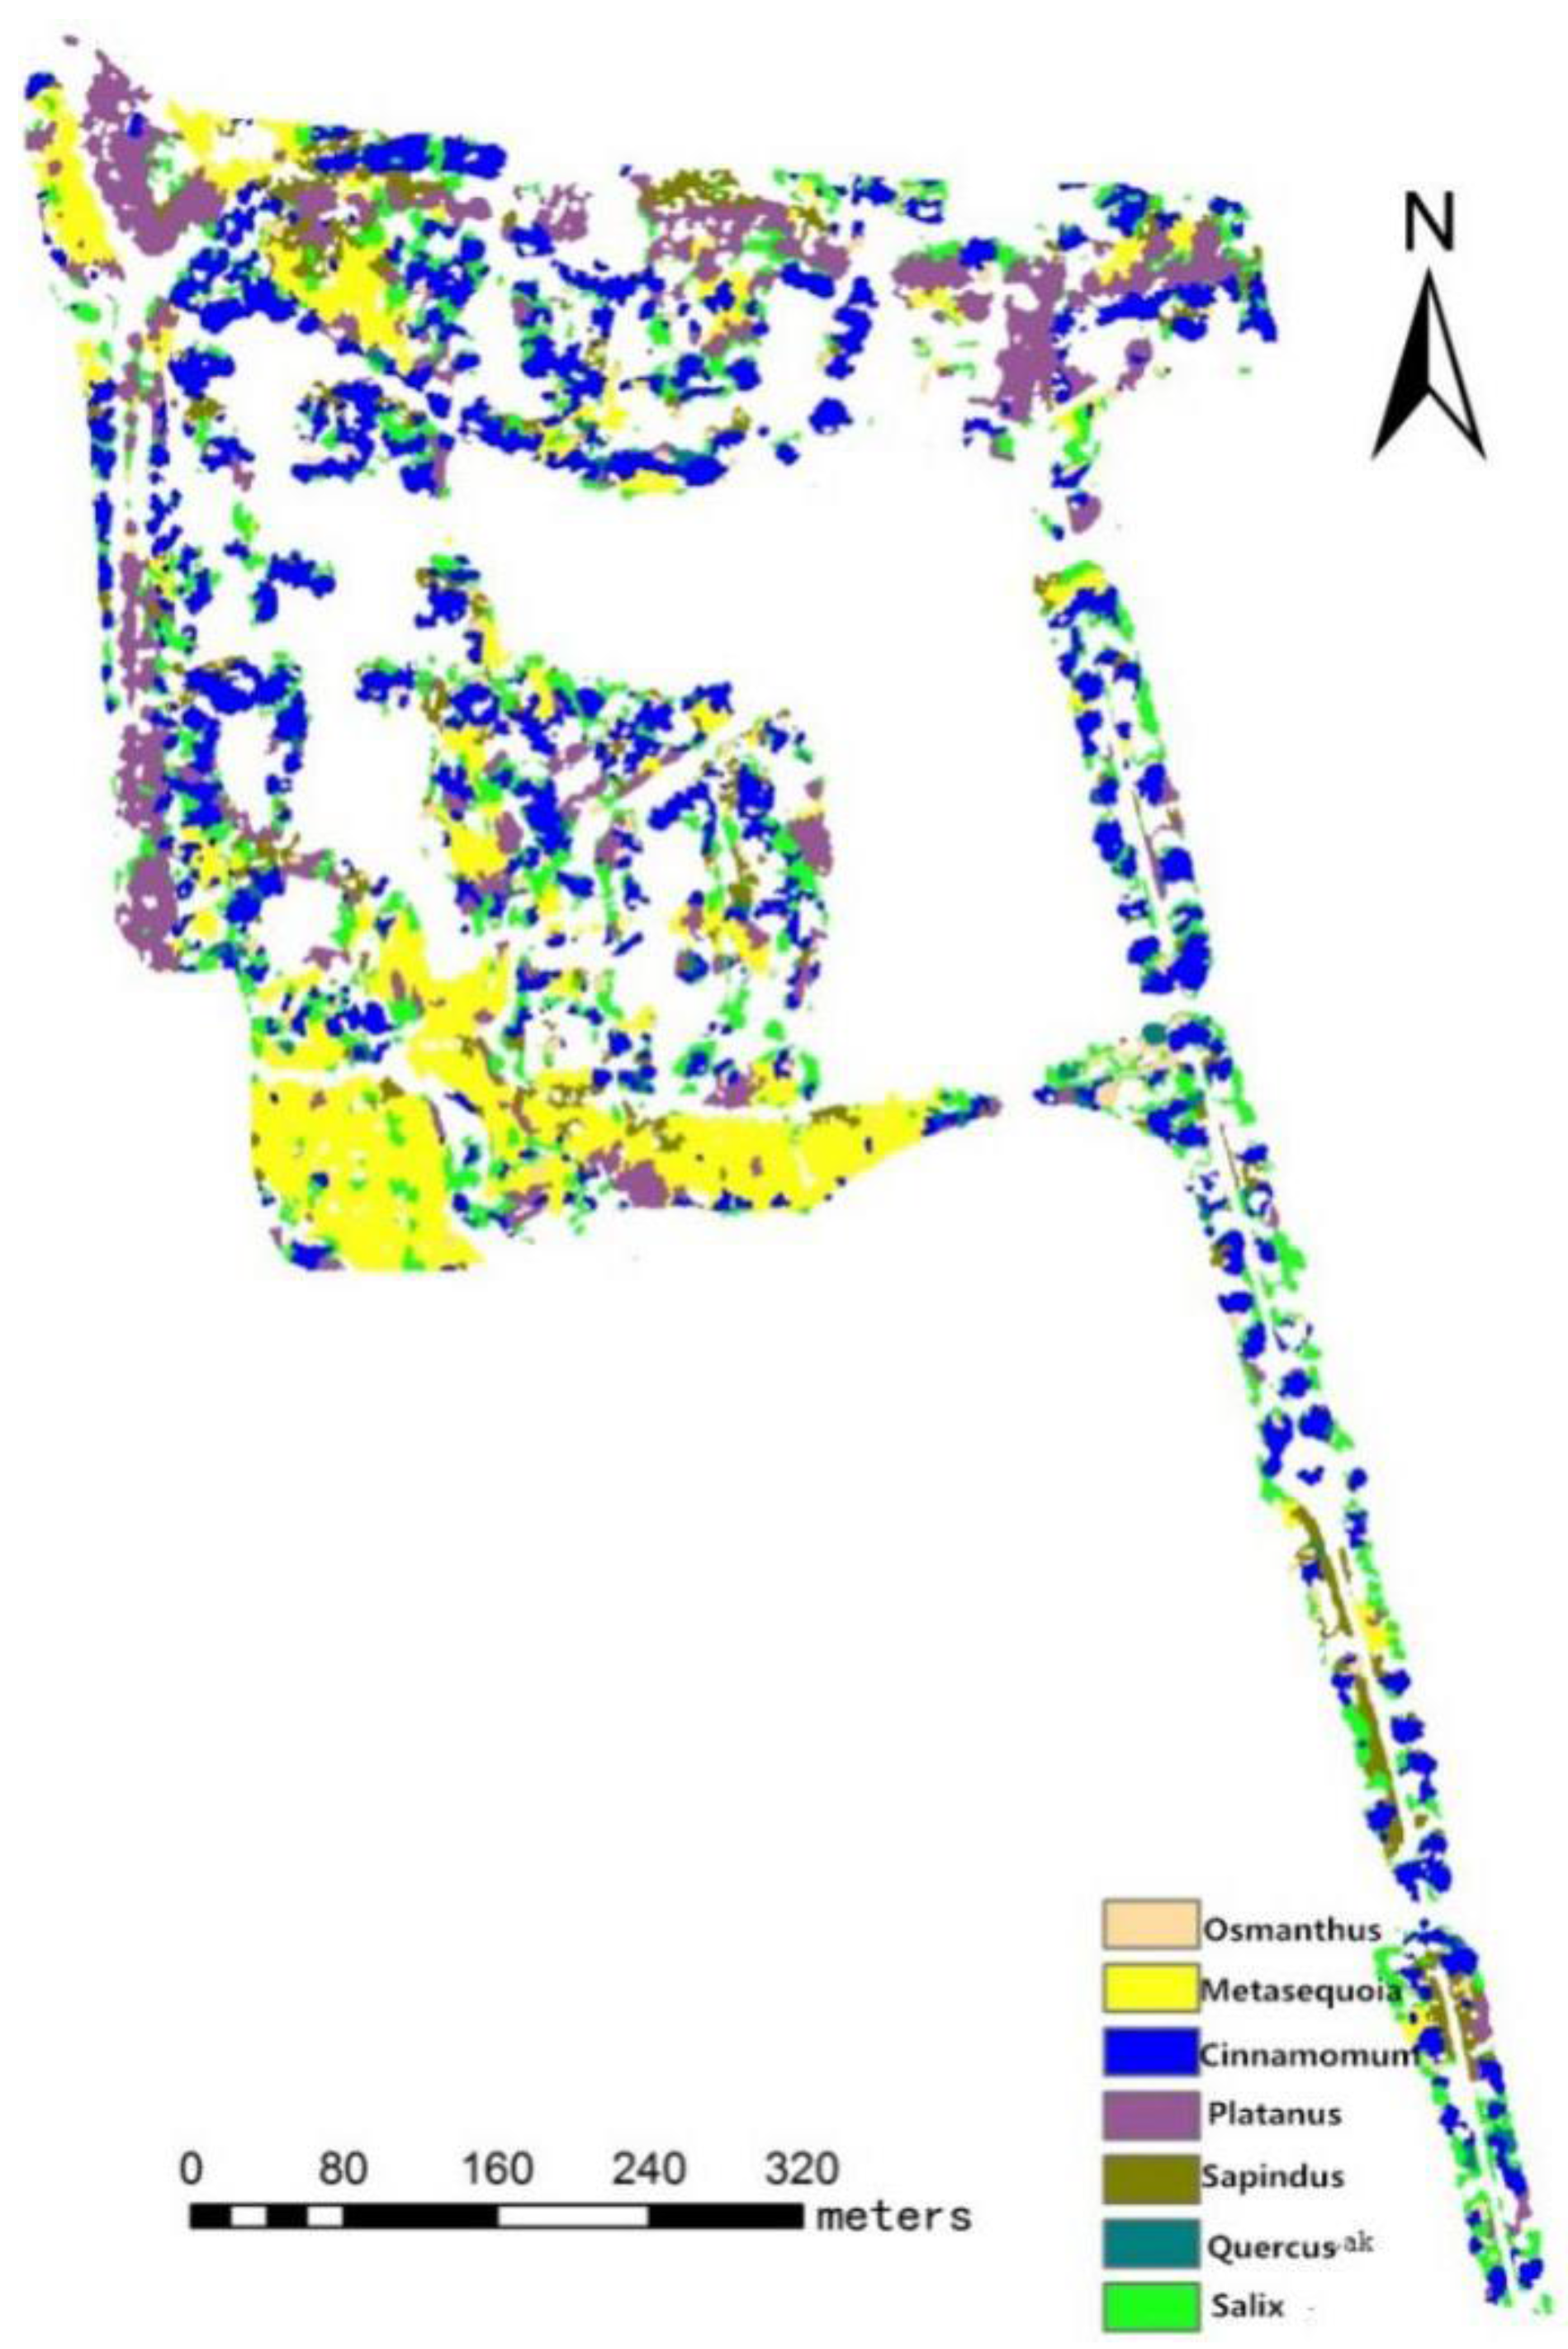
4.1.1. Breeze-Ruffled Lotus at Quyuan Garden and Su Causeway Subarea

Through field survey, we identified dominant tree species in the Breeze-ruffled Lotus at Quyuan Garden and Su Causeway subarea: camphor, metasequoia, salix, osmanthus, sapindus, platanus acerifolia, and quercus acutissima. Therefore, only those species were classified and extracted. The classification results are shown in Figure 5 and classification accuracy is shown in Table 2. User accuracy means the classification of the various land cover categories, corresponding to the ground true reference, the real number of pixels of the category of the percentage. Users do not know the true value graph, and therefore can only be based on the results given by the classifier to guess how much is reliable. So this calculation is called user accuracy. Producer means true ground reference data of the land cover classification of the test point, there are parts of the test point is the wrong classification, and the percentage of the number of pixels is correctly classified. Producers know the true value of the map, they use the evaluation of the classifier as the true value of the number of points in the graph of the number of points.
It can be inferred from the classification results and estimation that the tree species in the subarea are mostly metasequoia, camphor, and platanus acerifolia, as the distribution of these species is relatively concentrated. Sapindus and salix have the highest producer’s accuracy and the lowest user’s accuracy, which may be due to their low proportions in tree species distribution. Other tree species have very high recognition accuracies, resulting in an overall classification accuracy of 86%.

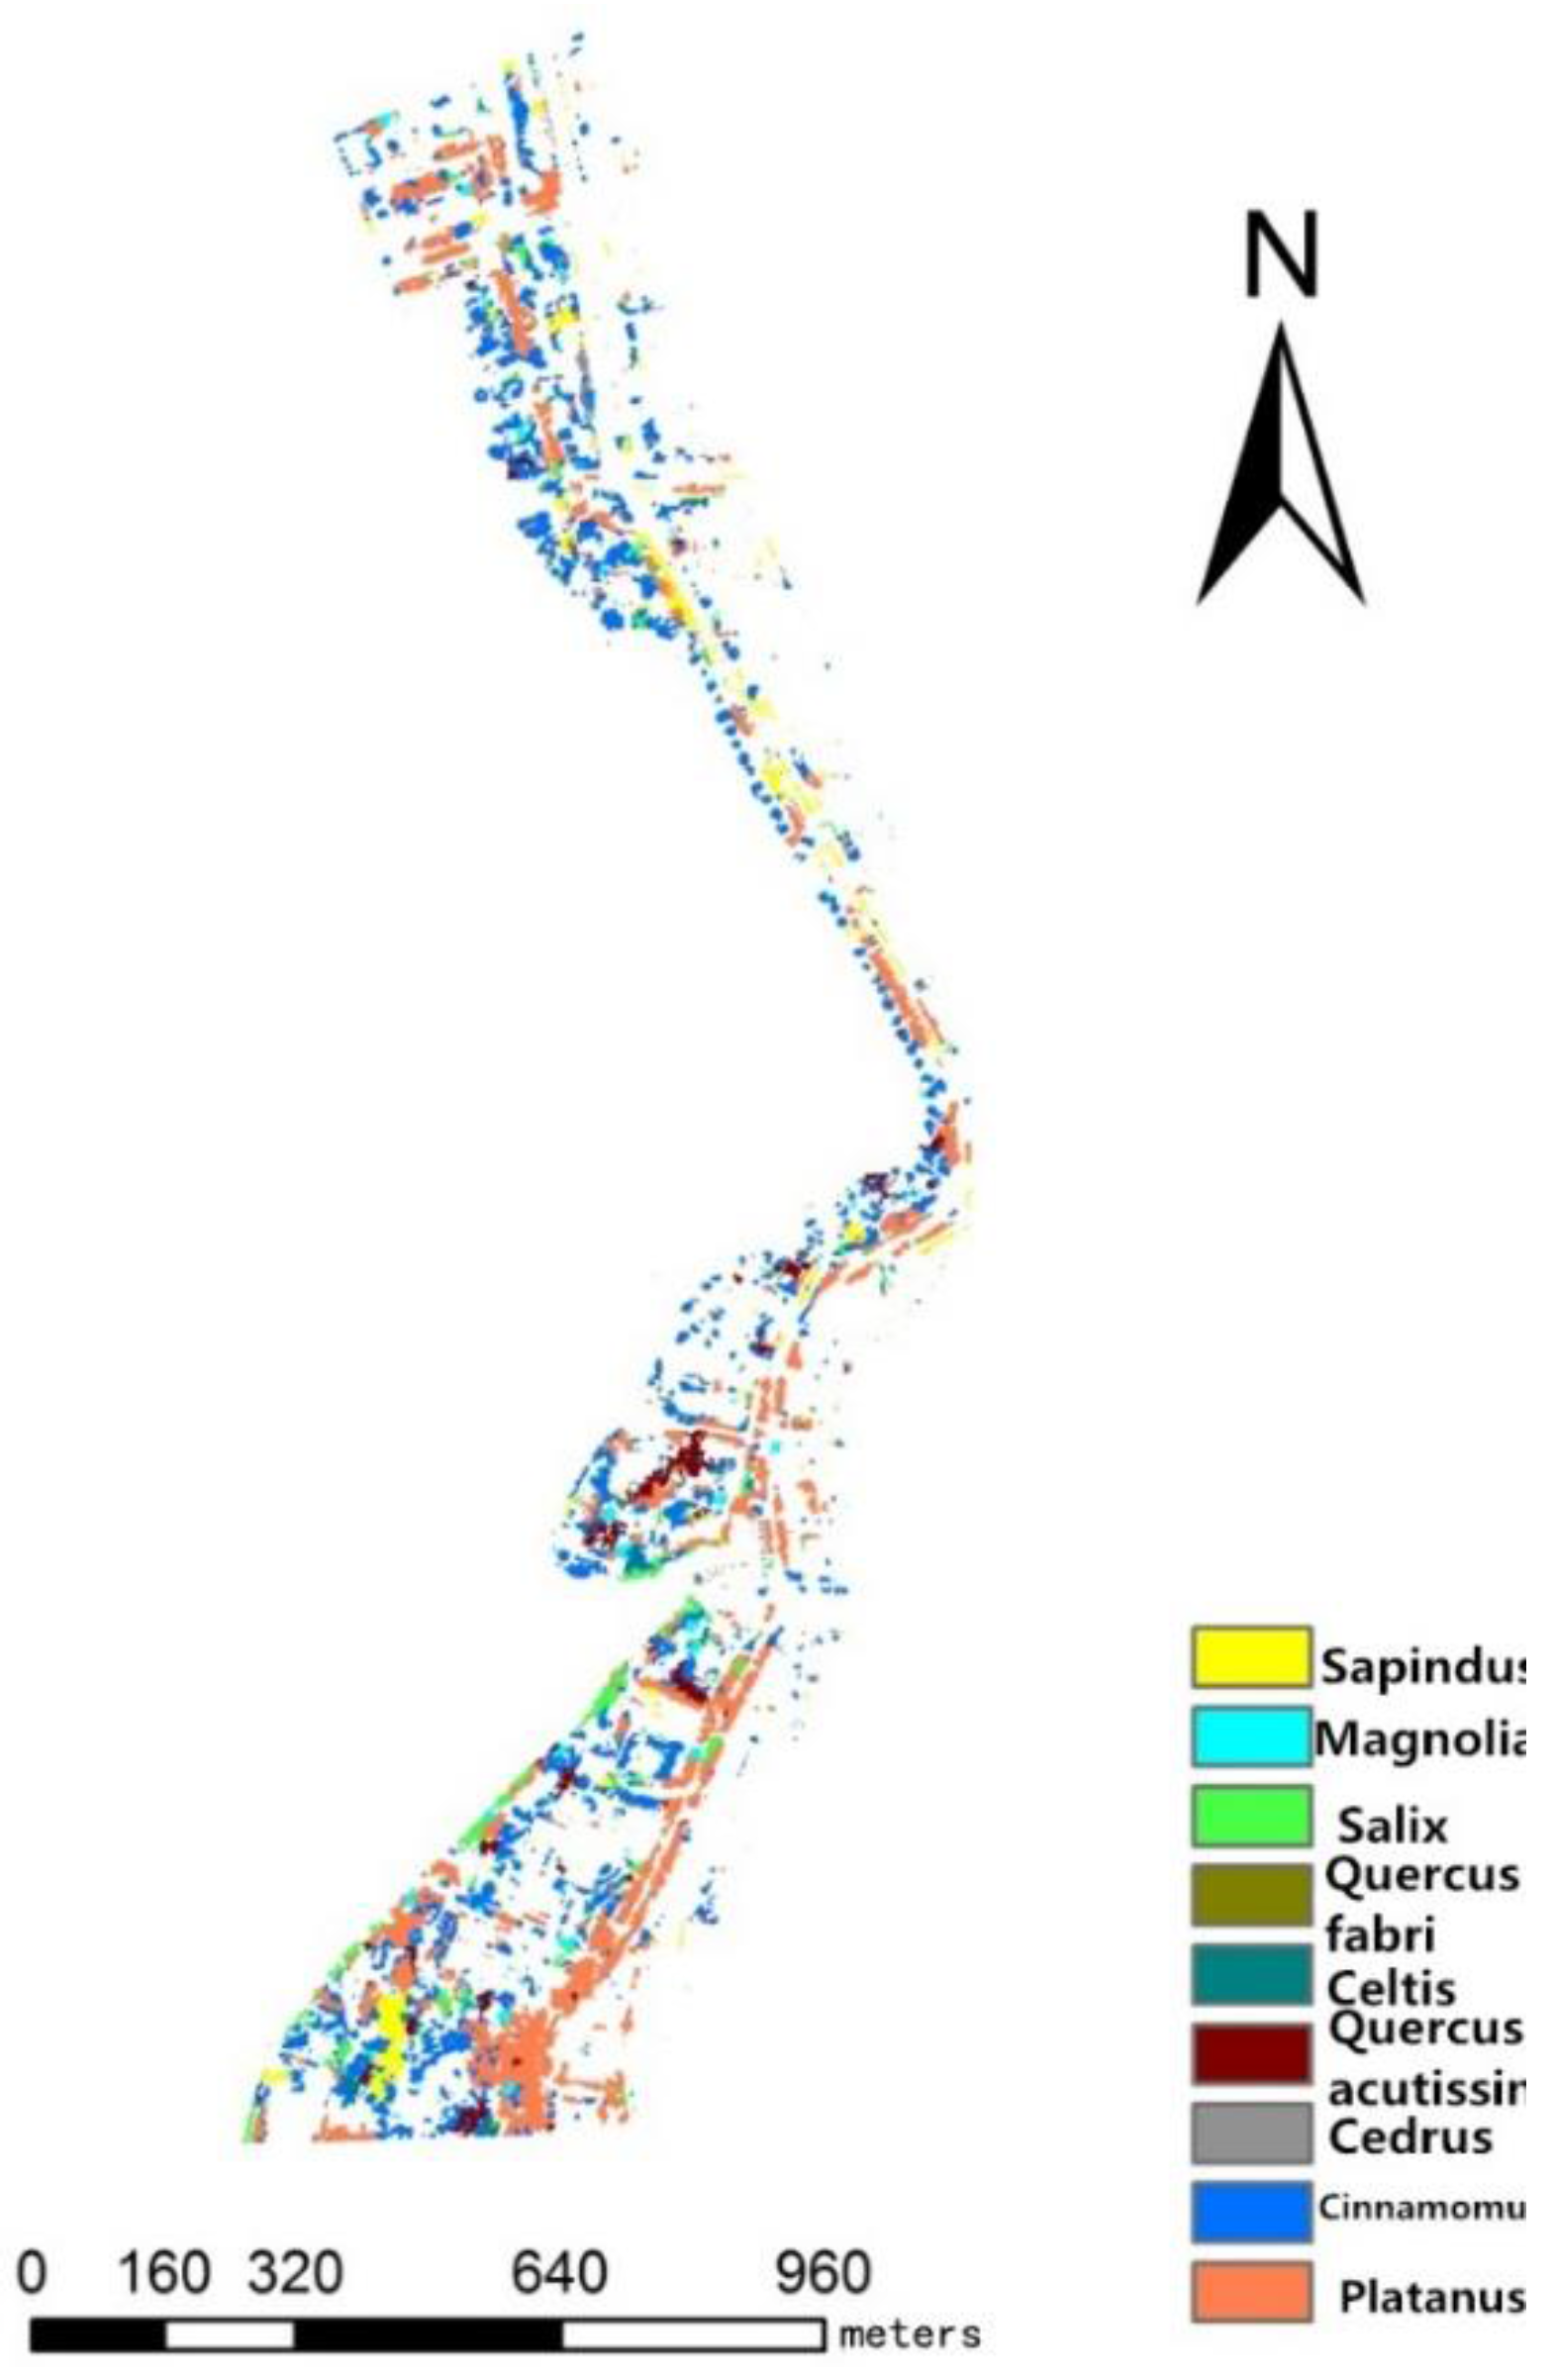
4.1.2. Solitary Hill and Bai Causeway Subarea

Solitary Hill is a small peninsula on the north bank of the West Lake. In terms of plant allocation, the road along Bai Causeway is densely planted with salix, while different peach trees are planted extensively along the causeway bank. Tall platanus acerifolias are planted along the roads on Solitary Hill, with the dominant tree species being camphor, plum, quercus acutissima, liquidambar, sapindus, metasequoia, etc. Only these dominant tree species were classified and extracted. The classification results are shown in Figure 6 and classification accuracy is shown in Table 3.
According to the classification results, the Solitary Hill and Bai Causeway subarea is dominated by camphor, platanus acerifolia, and quercus acutissima. Salix is mainly distributed on Bai Causeway and along the lake shores. platanus acerifolia is mainly distributed along both sides of the main road. Metasequoia, platanus acerifolia, and quercus acutissima have the highest producer’s accuracy, while plum, metasequoia, and sapindus have the highest user’s accuracy. The overall accuracy is 90.36%. Liquidambar has the lowest classification accuracy.

4.1.3. New Lakeside Subarea

New Lakeside subarea is located on the east side of the West Lake, stretching to Beishan Street in the north and Wenying Pavilion in the south. The dominant tree species in this subarea are: camphor, platanus acerifolia, sapindus, salix, cedrus, magnolia grandiflora, and quercus acutissima, as shown in Figure 7.
According to the classification results, the New Lakeside subarea has a higher distribution of camphor and platanus acerifolia; the distributions of other tree species are comparatively similar. Cedrus and sapindus have the highest producer’s accuracy and the lowest user’s accuracy. Quercus acutissima has the highest user’s accuracy. The overall classification accuracy is 86.05%, as shown in Table 4.
In this study, the testing sample set comprised one-on-one GPS points (one point corresponded to one tree) obtained through field survey, and supplementary points obtained from Tencent Street View mapping. ENVI software was used to estimate the accuracy of the classification results via a confusion matrix. The overall accuracy and Kappa coefficient can be calculated from the confusion matrix; classification accuracy is more than 85%, which is acceptable.
There are two peak pollen periods in eastern China, in the spring (March to May) and fall (August to October) seasons [34]. In the present survey, the tree species flowering in the spring are camphor, quercus acutissima, salix, platanus acerifolia, liquidambar, plum, hovenia, celtis sinensis, and white oak; whereas osmanthus fragrans and cedrus deodara flower in the fall. The flowering phases of metasequoia, sapindus, and magnolia grandiflora do not occur during peak pollen periods, and therefore the distributions of their pollen allergenic zones were not extracted. The combined distributions of flowering tree species in spring and fall are shown in Figure 8 and Figure 9, respectively.

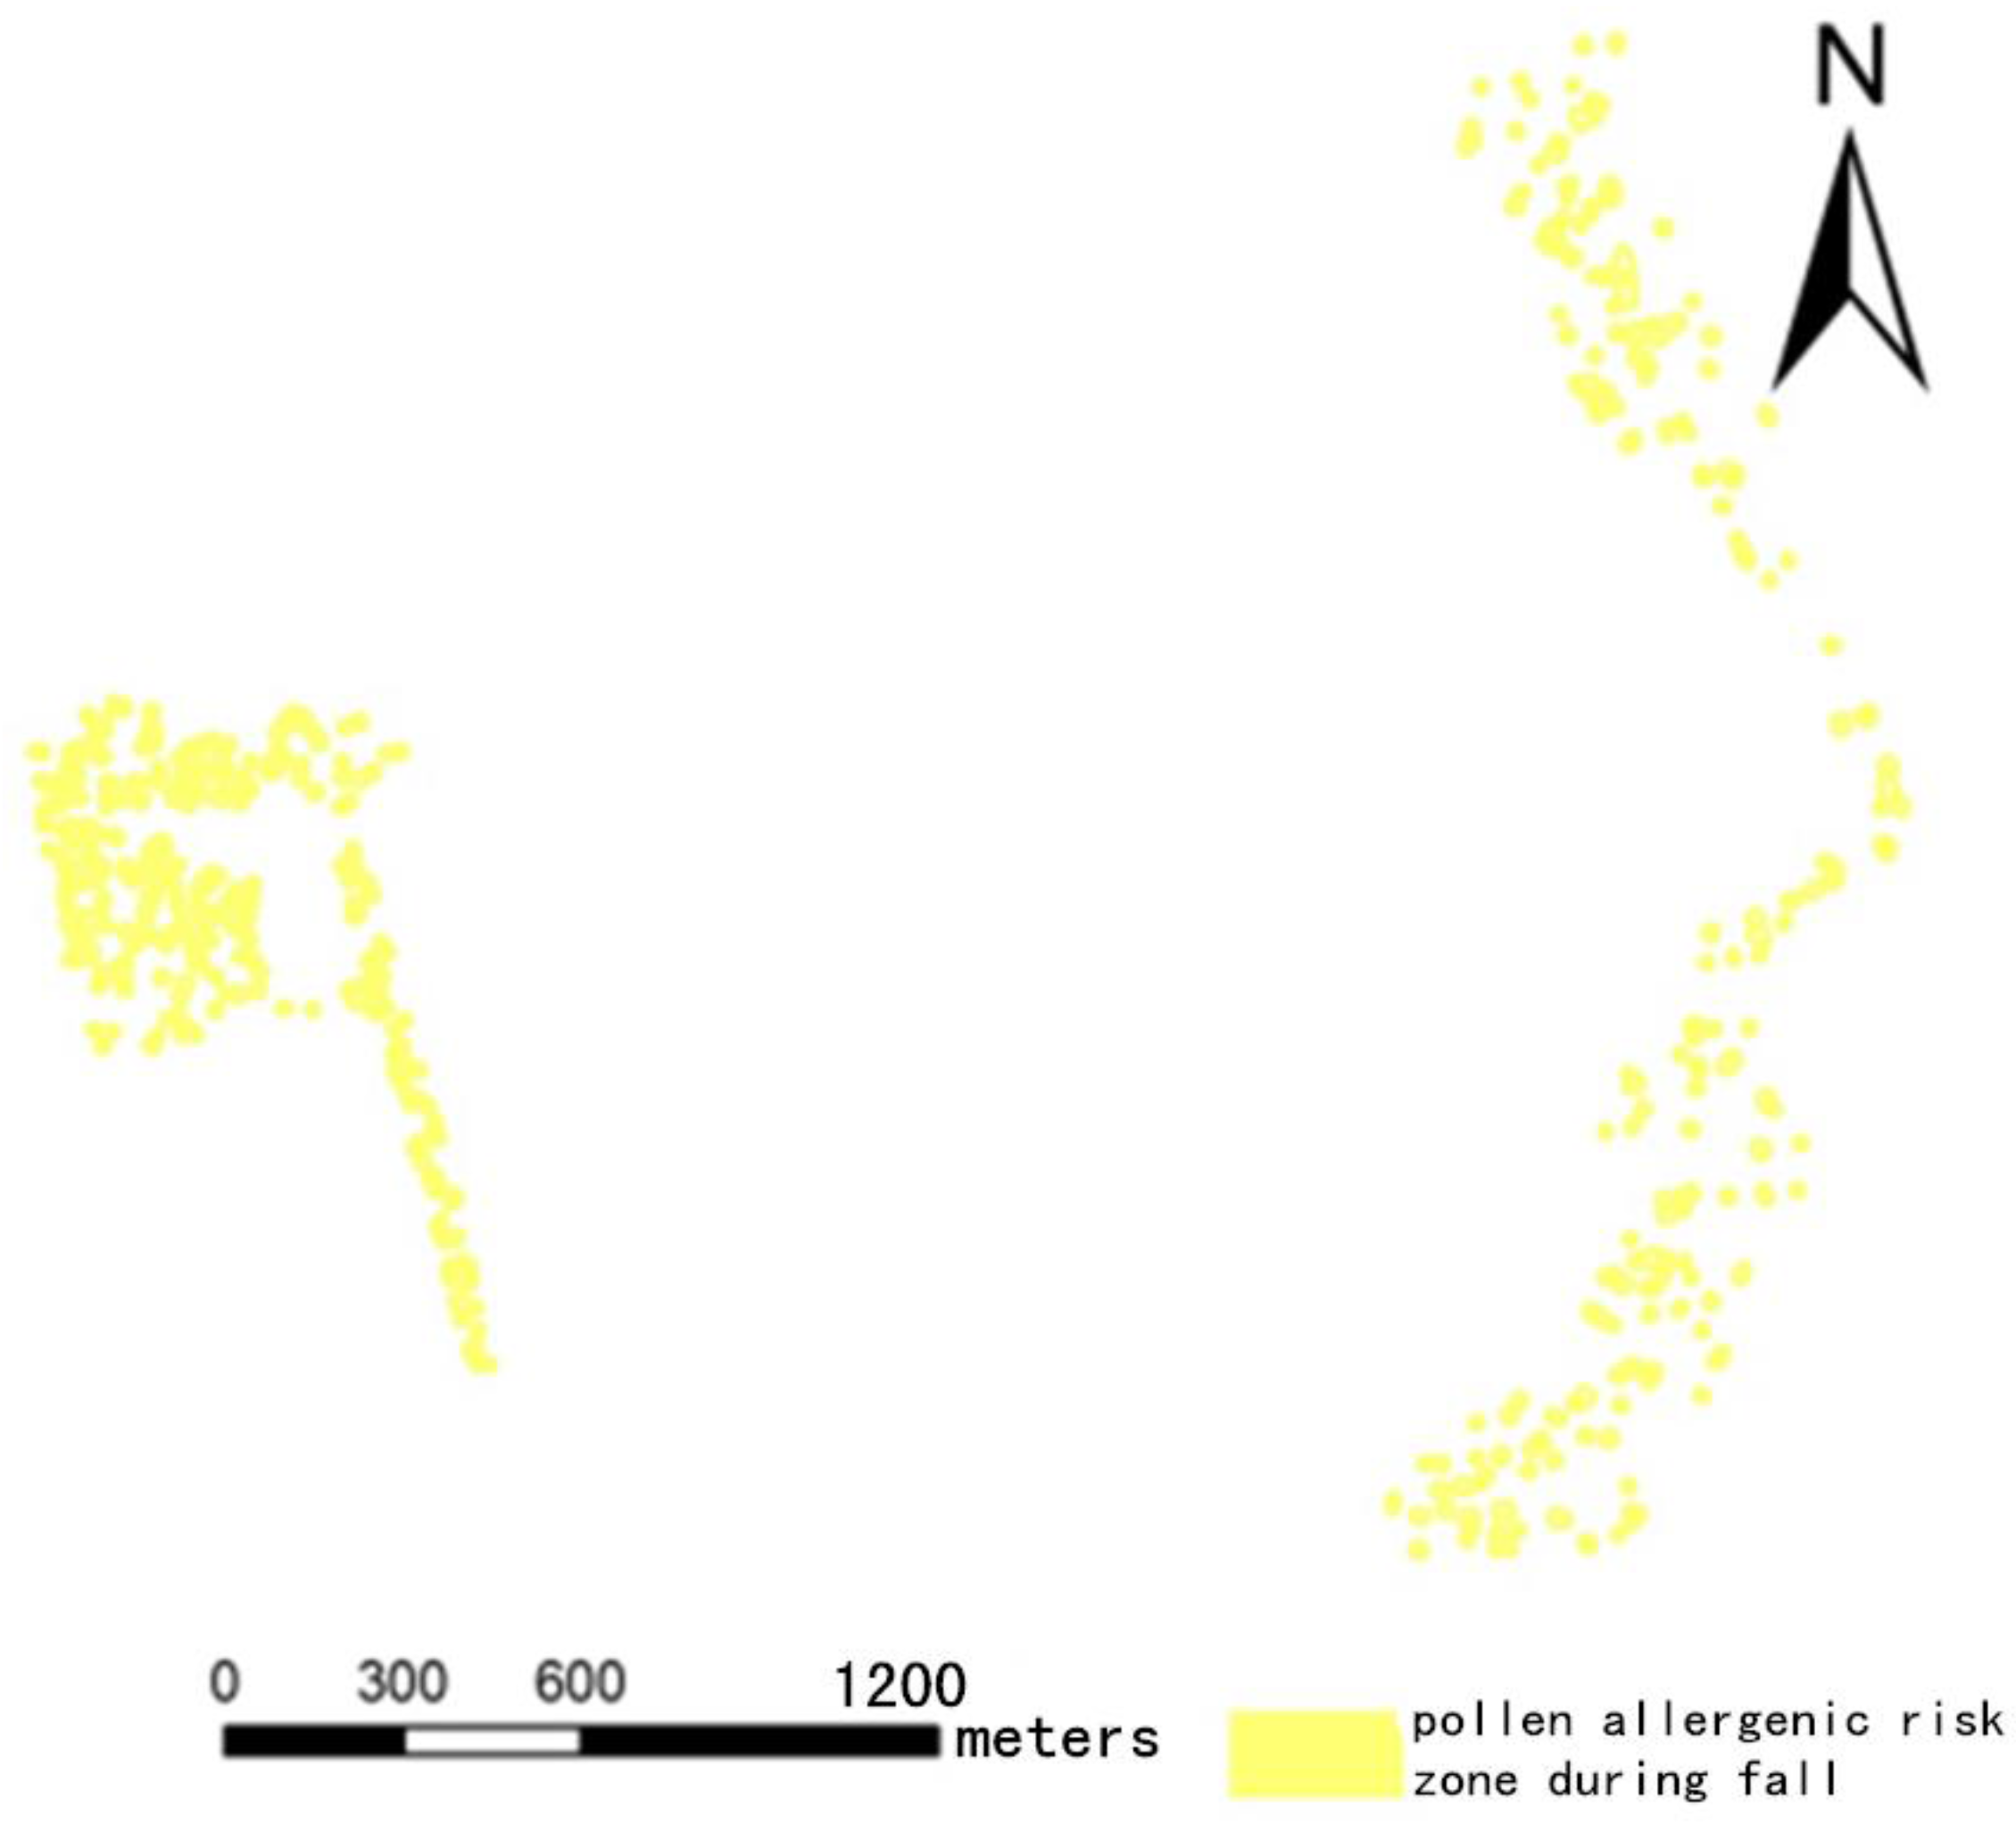
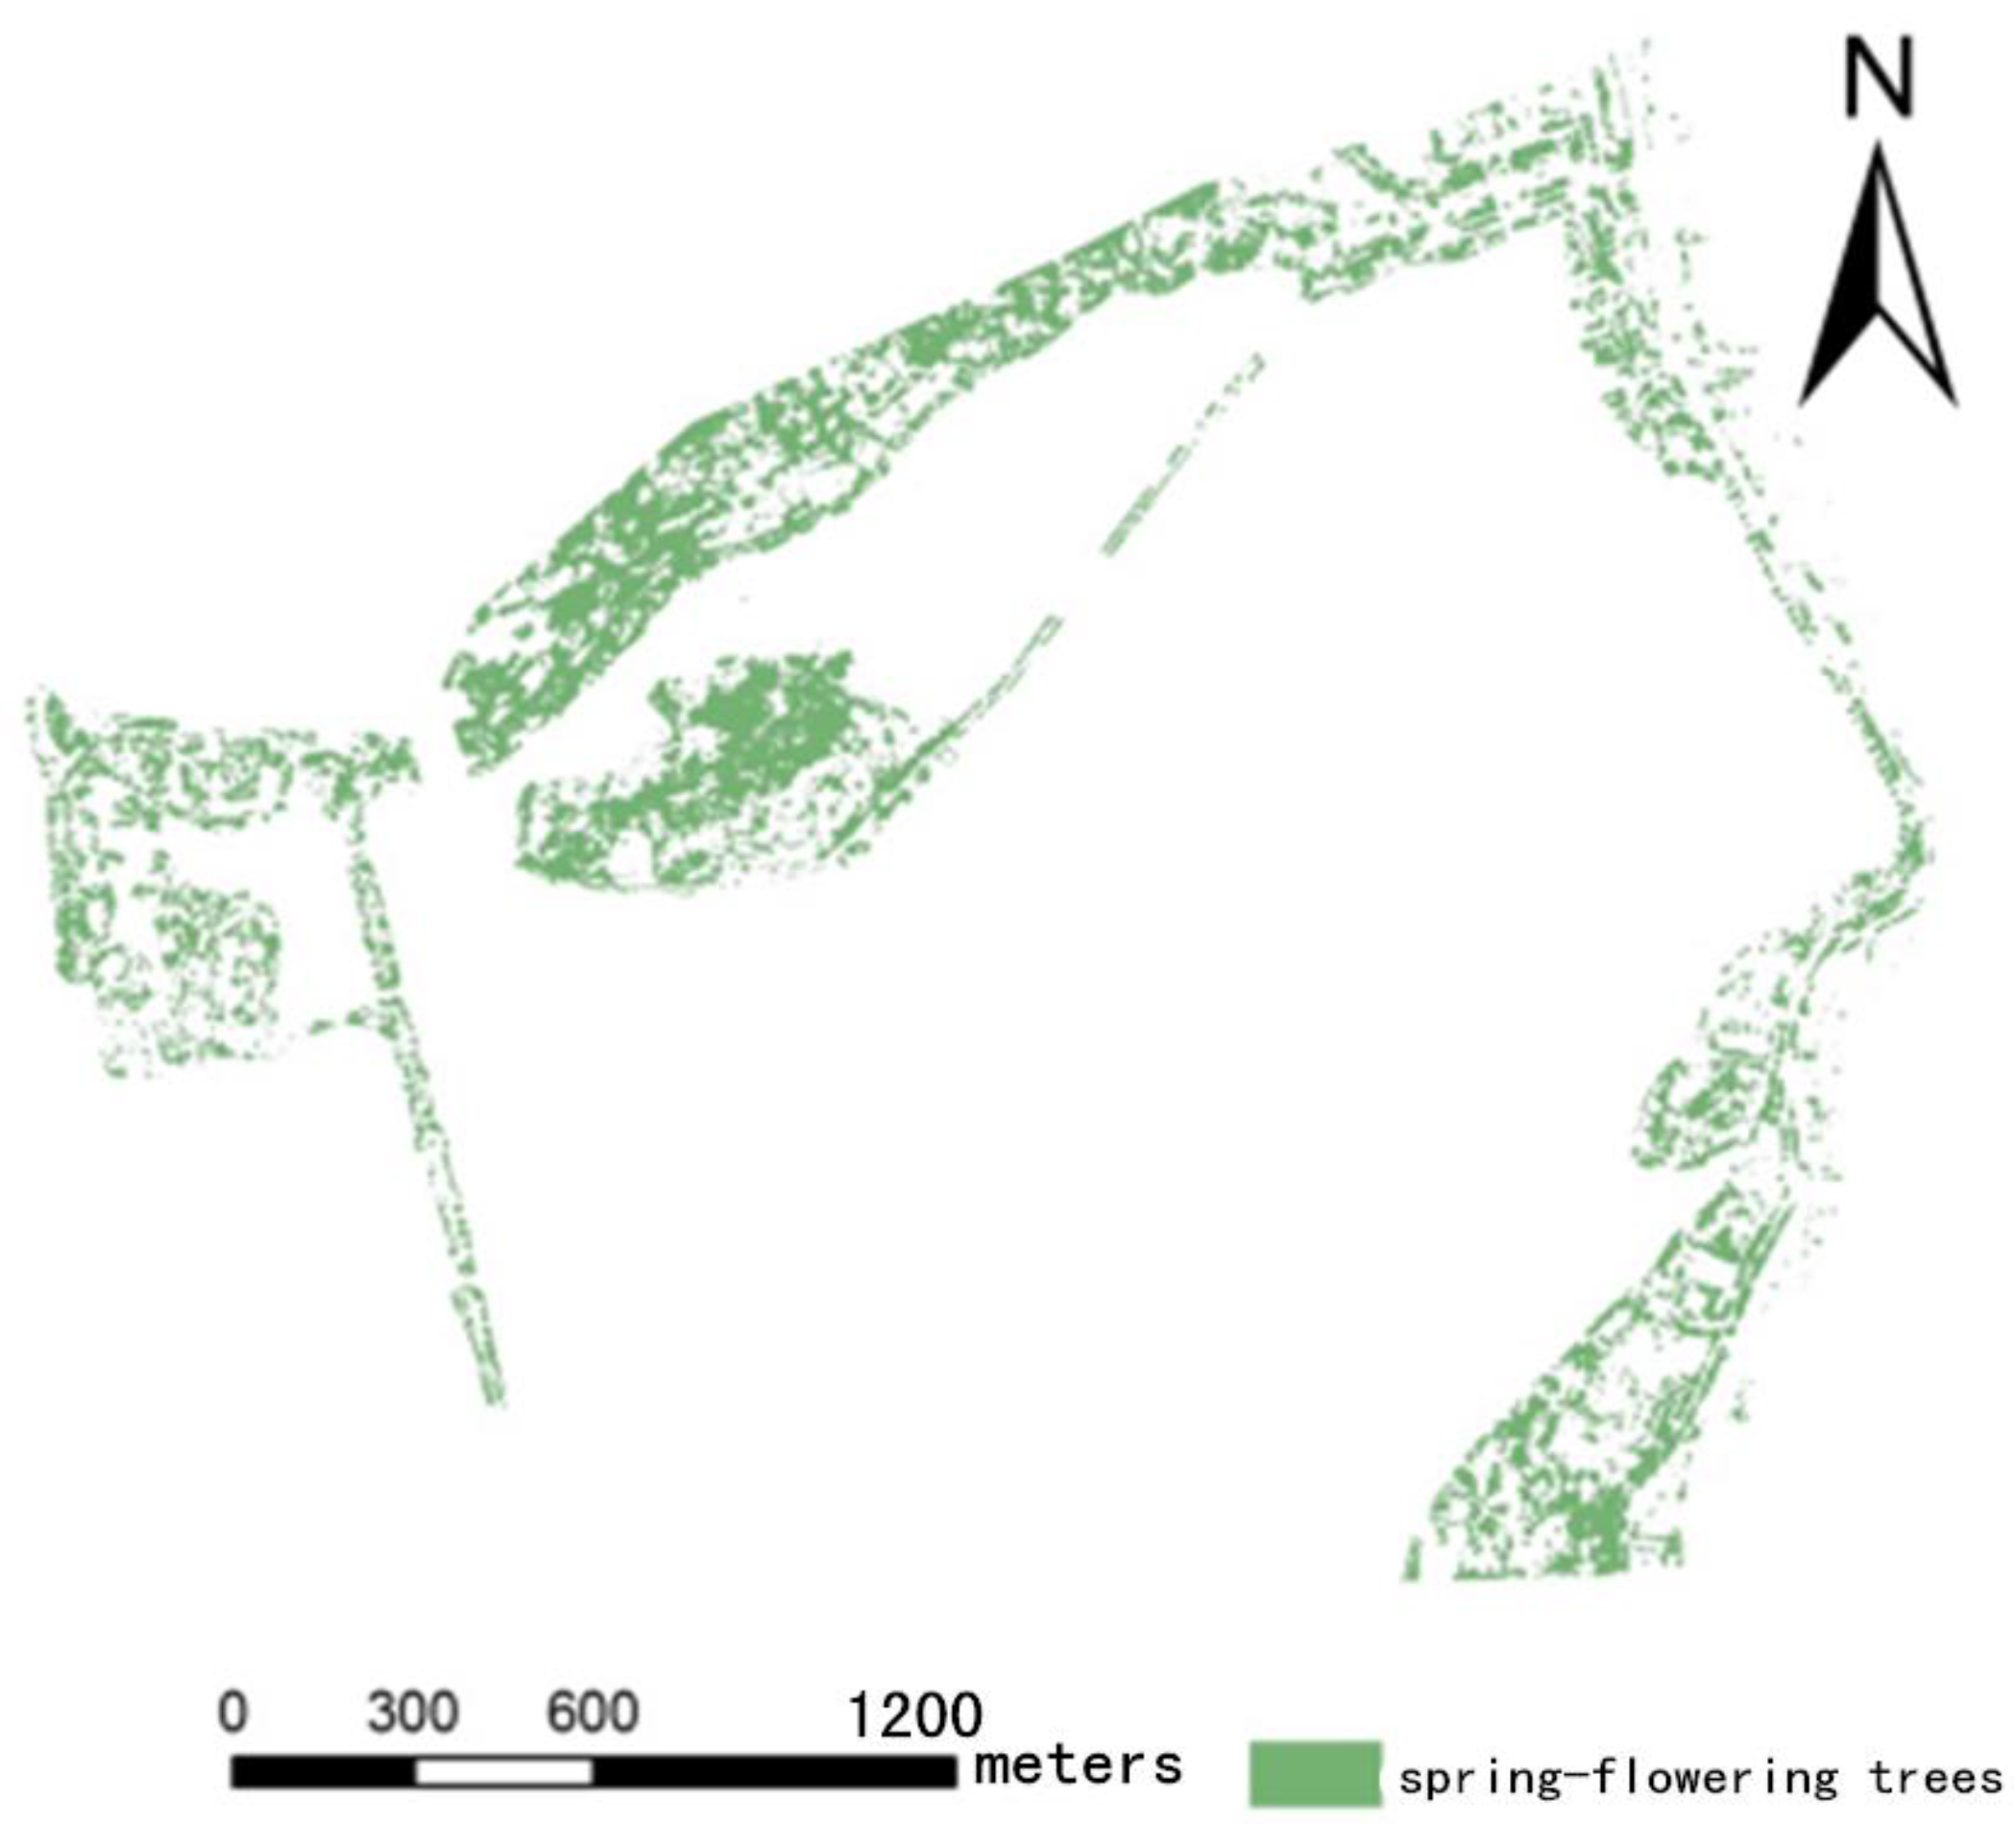
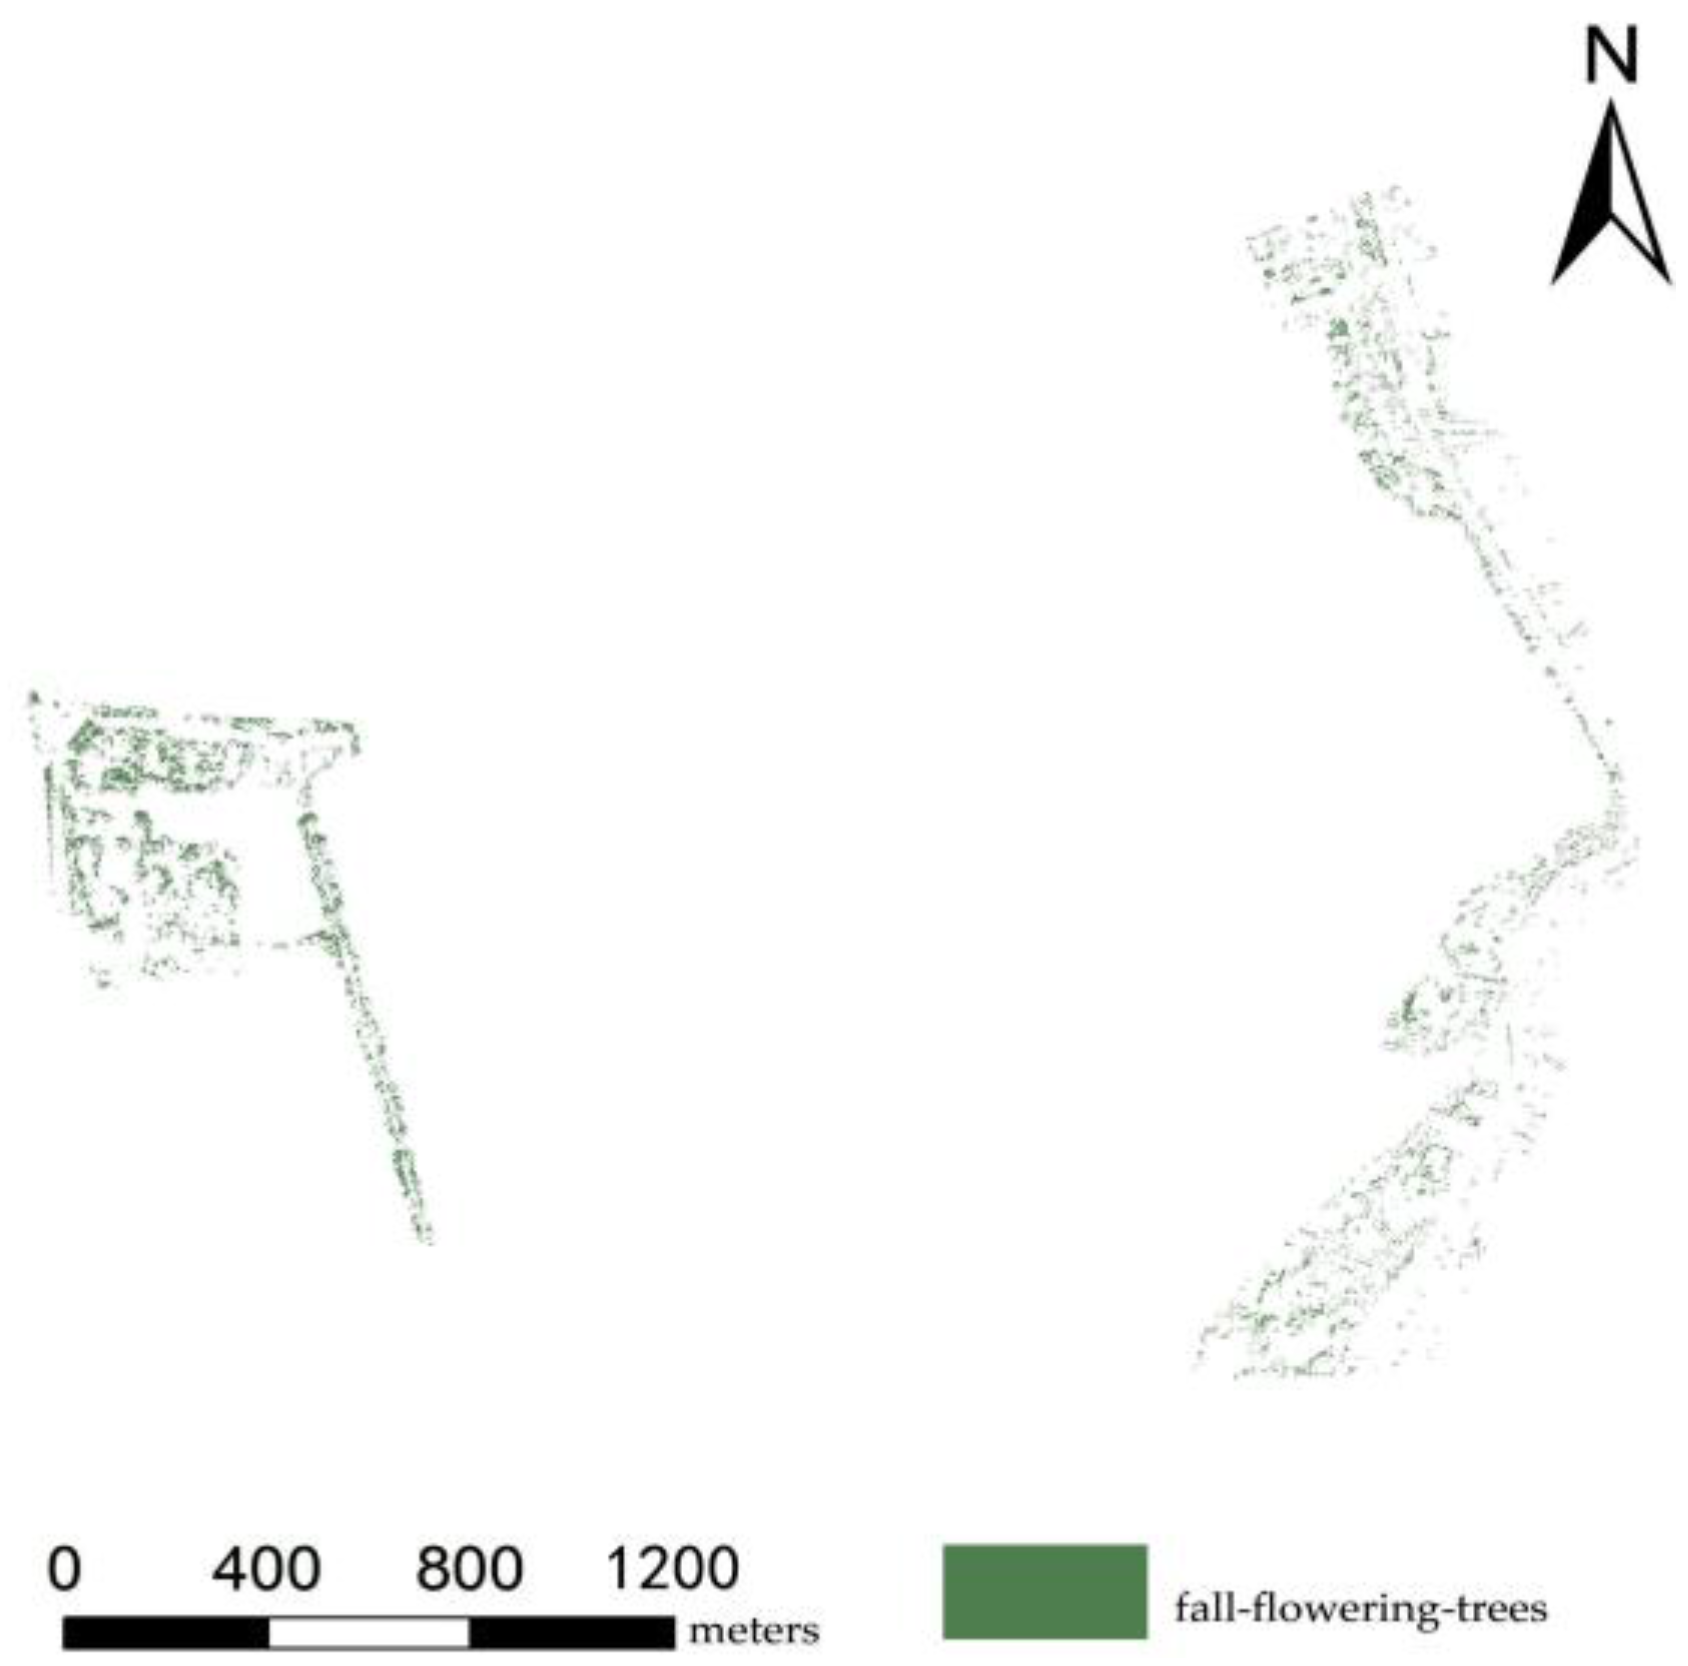
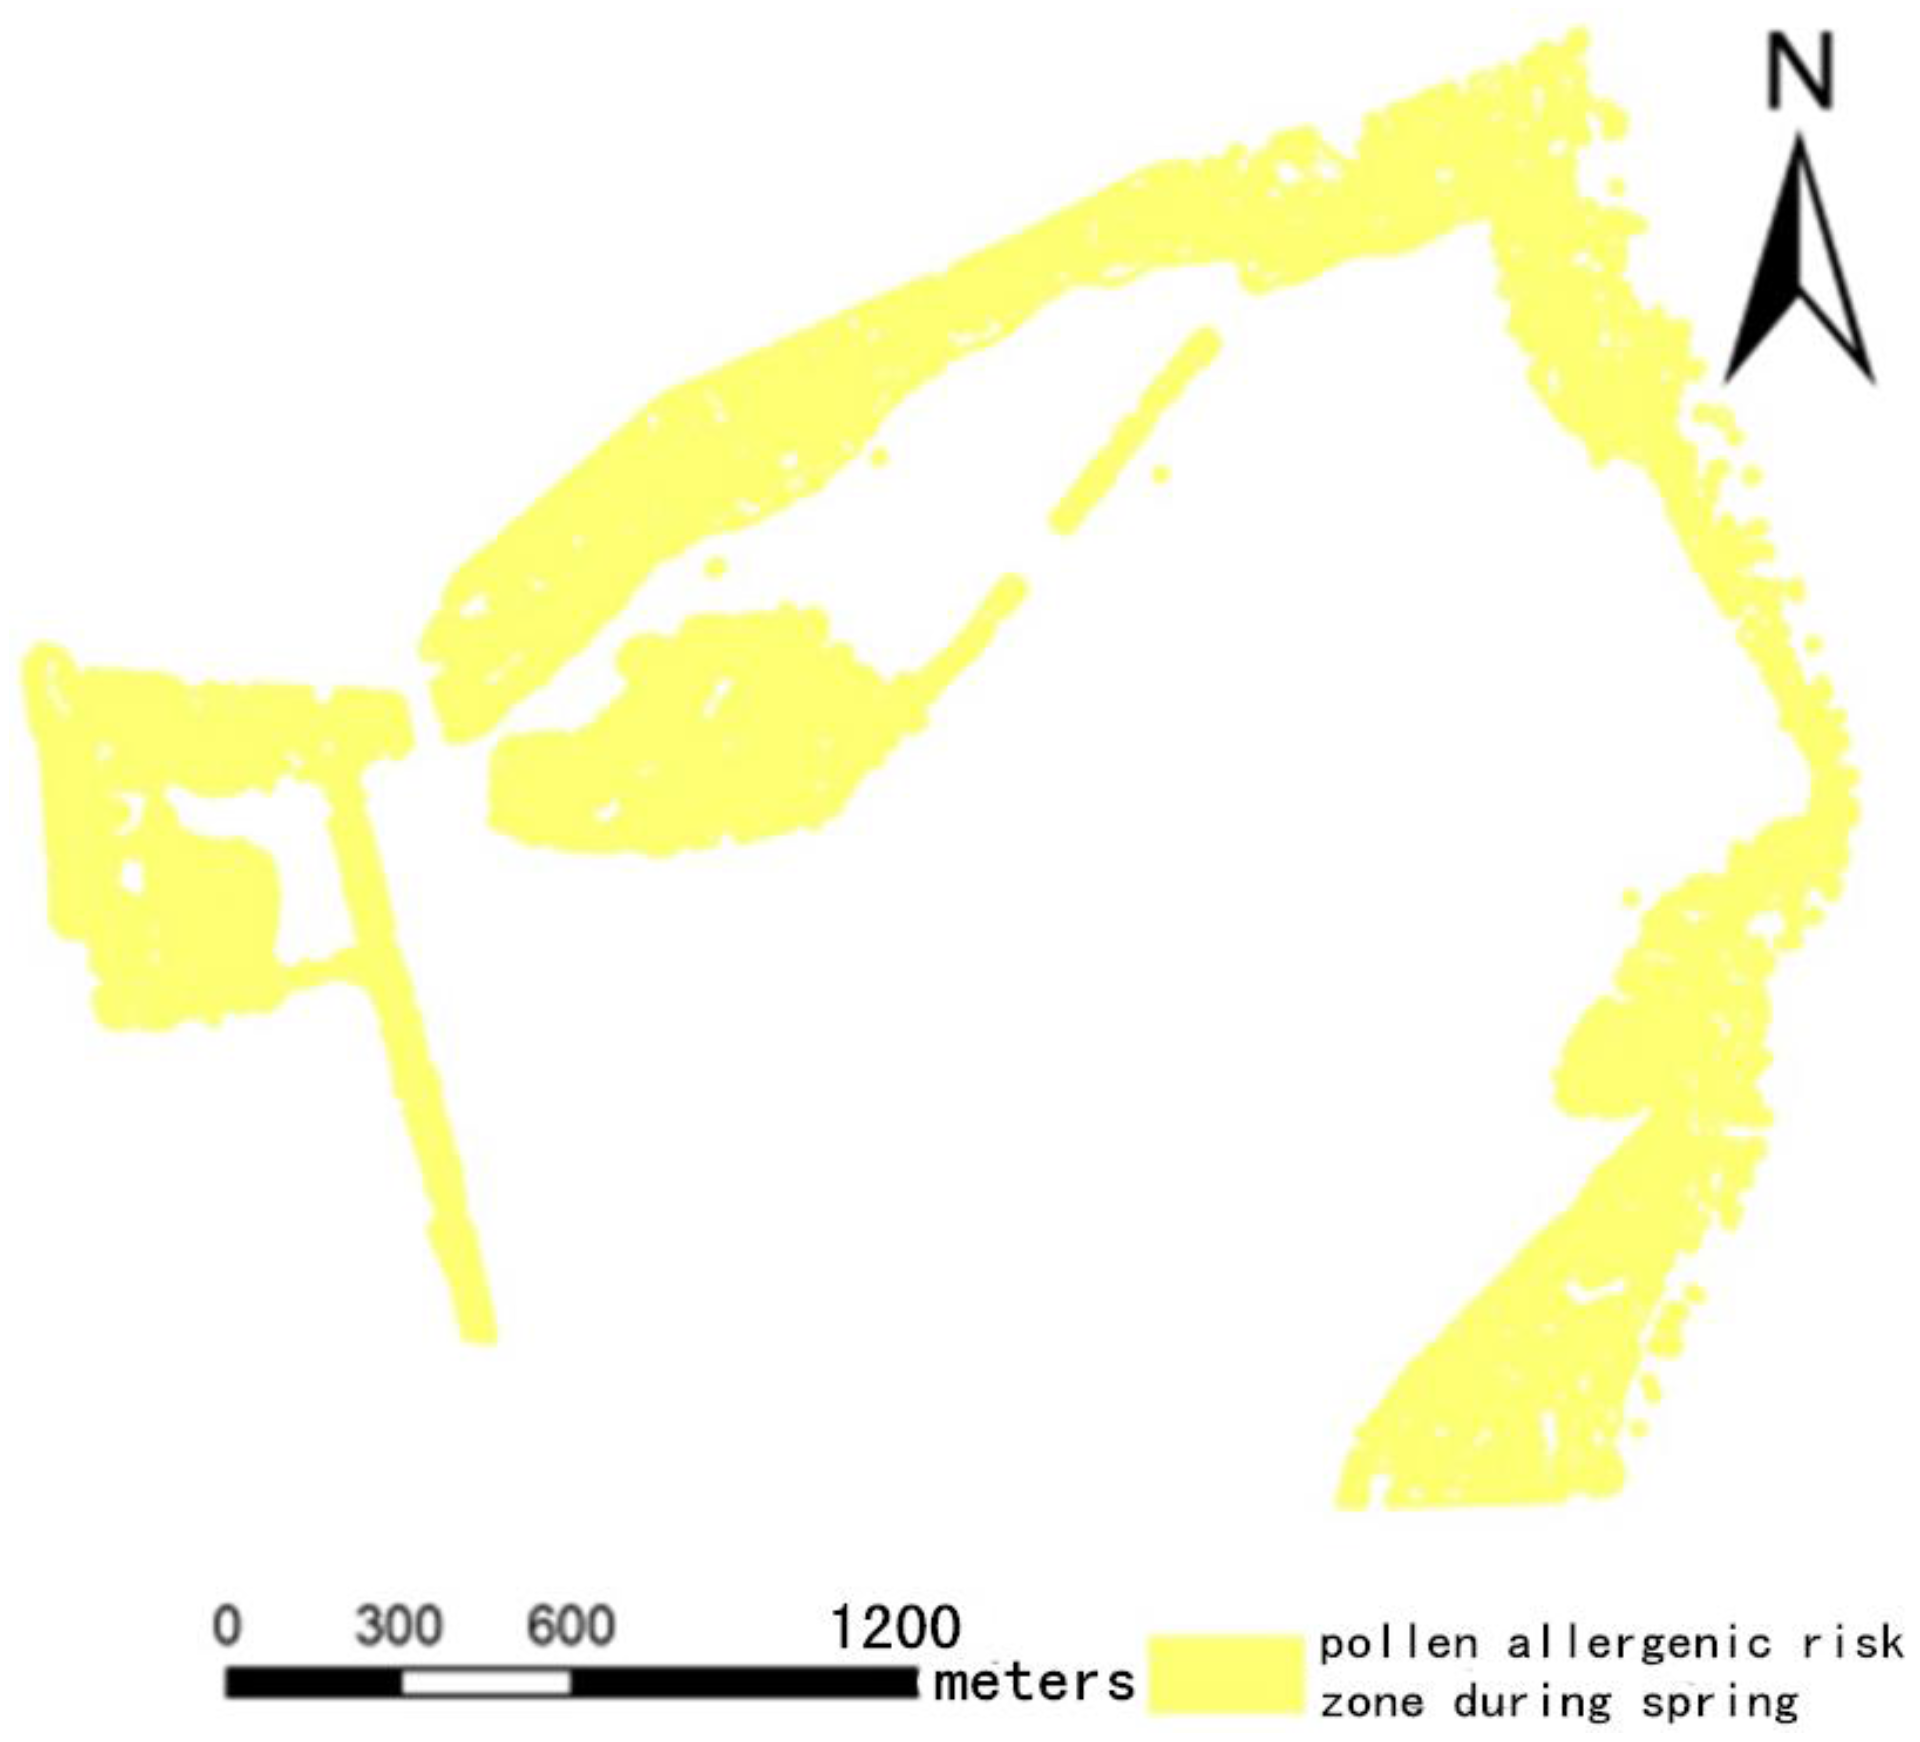
4.2. Distribution of Pollen Allergenic Zones

Yang et al. pointed out that because pollen is dispersed via air currents, pollen concentrations differ according to the distance from the source plants. Excluding the influence of wind, the concentration of drifted pollen increases with distance, and reaches a maximum value in the area 10–15 m from the plant [35]. Hence, in this study, 15 m was selected as the pollen allergenic radius of the risk zones.
The GIS software was used to vectorize the spatial distribution of tree species during their flowering phases, and the buffer function was used for spatial analysis, to establish a buffer zone of 15 m according to the vectorized point or line features of the tree species distribution. These buffer zones were considered as pollen allergenic zones. The spatial distributions of pollen allergenic zones in spring and fall are shown in Figure 10 and Figure 11, respectively. It can be seen that in high pollen allergy incidence seasons, the spring flowering period, the entire West Lake Scenic Area forms a single, large allergenic zone that is larger during the spring than during fall. For this reason, visitors with a pollen allergy should avoid visiting the West Lake during these two periods. In the fall, tourists who suffer from a pollen allergy might be better advised to visit the Solitary Hill and Bai Causeway subareas.

5. Discussion and Conclusions

Most previous studies emphasized the vital benefits from ecosystem functions that underlie the foundation of human society in urban areas. However, the impact of tree species on public health should also be paid attention in order to facilitate urban sustainability [36,37,38]. As the world’s largest developing country with about three decades of double-digit economic growth, China’s systemic shift from state socialism to a market economy has been the increasing human-environmental conflicts. Given the important role of metropolitan areas in China’s economic and social transition, there is a growing need to address emerging environmental challenges and develop policies for sustainable human settlement development. The spatial relationship needs to be explored between health risk and the tree environment. However, it is still a great challenge to incorporate a data-driven approach into urban landscape planning, although the concepts of pollen allergenic risk have provided new perspectives for a better understanding of the roots of human-environment conflict. In this study, an object-oriented classification system was used to identify tree species in the upper canopy, from high-resolution remote sensing images; fourteen species, including camphor and metasequoia, were identified. In addition, the distribution of tree species that flower during the peak pollen periods of spring and fall were separately extracted. Based on pollen dispersal patterns, a GIS buffer function was used for spatial analysis to determine the distribution ranges of pollen allergenic zones and to map pollen allergenic risk zones during the spring and fall.
The findings are summarized as follows:
(1)
Using remote sensing technology, the overall accuracy of tree species recognition for the study area exceeds 86%.
(2)
Most plants in the study area flower during the spring, thus the pollen allergenic risk zones are also extensive during spring and sparse in fall.
(3)
As a complementary approach to traditional methods, the use of remote sensing technology is both time- and energy-efficient, and can provide highly effective, broad-range monitoring of the study area.
The accelerated growth of large-scale urban environmental data has attracted considerable attention from scholars, planners, and policy makers. This study proposes a tree species recognition process based on high-resolution remote sensing images. The results were verified by field GPS data and auxiliary Tencent Street View mapping data; spatial analysis of tree species image classification results was performed using GIS software. Methods for determining the pollen allergenic risk zones of different tree species in different seasons reflected specific conditions within the study area. This method is fast, simple, and practicable, and can indicate the macro-scale distributions of pollen allergenic risk zones.
Nevertheless, the present study has some limitations. The determination of pollen risk zones should consider multiple factors, such as weather, temperature, humidity, wind speed, topography, light intensity, etc. [39]. This study presumed flat topography and windless weather conditions. Hence, future studies should aim to establish an analytical model that integrates landform, wind speed, temperature, and other factors. Grade specification of pollen allergenic risk zones should also be considered in further studies. In planning for urban sustainability, we need to move beyond examining the specific tree species and consider the entirety of the human-dominated urban environmental system, in order to seek a more systematic solution.

Acknowledgments

This work has been supported by National Natural Science Foundation of China (41329001, 41430637) and Zhejiang Provincial Natural Science Foundation of China (LY16D010007).

Author Contributions

Junfeng Xu, Zhanqing Cai, Tiantian Wang, Guang Liu, and Peng Tang co-designed and performed research; Xinyue Ye provided the method and edited the draft. All authors read and approved the final manuscript.

Conflicts of Interest

The authors declare no conflict of interest.

References

  1. Casas, C.; Márquez, J.; Suárez-Cervera, M.; Seoane-Camba, J.A. Immunocytochemical localization of allergenic proteins in Parietaria judaica L. (Urticaceae) pollen grains. Eur. J. Cell Biol. 1996, 70, 179–188. [Google Scholar] [PubMed]
  2. Muñoz-Romo, M.; Sosa, M.; Quintero, Y.C. Digestibility of columnar cacti pollen grains in the glosophagine bats Glossophaga longirostris and Leptonycteris curasoae (Chiroptera: Phyllostomidae). Rev. Biol. Trop. 2005, 53, 277–280. [Google Scholar] [PubMed]
  3. Blagkley, C.H. Experimental Researches on the Causes and Nature of Catarrhus aEstivus (Hay-Fever or Hay-Asthma); Dawson: London, UK, 1959. [Google Scholar]
  4. Corren, J. Allergic rhinitis and asthma: How important is the link? J. Allergy Clin. Immunol. 1997, 99, S781–S786. [Google Scholar] [CrossRef]
  5. Ahlström-Emanuelsson, C.; Andersson, M.; Persson, C.; Schrewelius, C.; Greiff, L. Topical treatment with aqueous solutions of rofleponide palmitate and budesonide in a pollen-season model of allergic rhinitis. Clin. Exp. Allergy 2004, 34, 731–735. [Google Scholar] [CrossRef] [PubMed]
  6. Frenz, D.A. Volumetric ragweed pollen data for eight cities in the continental United States. Ann. Allergy Asthma Immunol. 1999, 82, 41–46. [Google Scholar] [CrossRef]
  7. Zhang, Y.; Bielory, L.; Mi, Z.; Cai, T.; Robock, A.; Georgopoulos, P. Allergenic pollen season variations in the past two decades under changing climate in the United States. Glob. Chang. Biol. 2015, 21, 1581–1589. [Google Scholar] [CrossRef] [PubMed]
  8. Tarragó, I.B. An annual study of airborne pollen in northern Mexico City. Aerobiologia 1996, 12, 191–195. [Google Scholar] [CrossRef]
  9. Ordaz, V.A.; Castañeda, C.B.; Campos, C.L.; Rodríguez, V.M.; Saens, J.G.; Ríos, P.C. Asthmatic exacerbations and environmental pollen concentration in La Comarca Lagunera (Mexico). Rev. Alerg. Mex. 1998, 45, 106–111. [Google Scholar] [PubMed]
  10. Carosso, A.; Gallesio, M.T. Allergy to ragweed: Clinical relevance in Turin. Aerobiologia 2000, 16, 155–158. [Google Scholar] [CrossRef]
  11. Nishihata, S.; Inouye, S.; Saiga, T.; Sahashi, N.; Suzuki, S.; Murayama, K.; Yokoyama, T.; Saito, Y. Prevalence rate of allergy to Japanese cedar pollen in Tokyo—From field investigation in 1996 by Tokyo Japanese Cedar Pollen Allergy Measurements and Review Committee. Arerugi 1999, 48, 597–604. [Google Scholar] [PubMed]
  12. Shi, Q.M.; Xiang, J.S.; Shu, H. Distribution of airborne allergenic pollen around parks and the relationship between airborne allergenic pollen and pollinosis. J. Clin. Otolaryngol. 1997, 11, 314–316. [Google Scholar]
  13. Ishizaki, T.; Koizumi, K.; Ikemori, R.; Ishiyama, Y.; Kushibiki, E. Studies of prevalence of Japanese cedar pollinosis among the residents in a densely cultivated area. Ann. Allergy 1987, 58, 265–270. [Google Scholar] [PubMed]
  14. Ye, S.T.; Zhang, J.T.; Qiao, B.S.; Lu, Y.J. Airborne and Allergenic Pollen Grains in China; Scientific Press: Beijing, China, 1998; pp. 1–3. [Google Scholar]
  15. Zhang, D. Application Research of Beijing area from 1 to 4 concentration prediction of trichosanthin. Meteorology 2010, 36, 128–132. [Google Scholar]
  16. Laaidi, M.; Thibaudon, M.; Besancenot, J.P. Two statistical approaches to forecasting the start and duration of the pollen season of Ambrosia in the area of Lyon (France). Int. J. Biometeorol. 2003, 48, 65–73. [Google Scholar] [CrossRef] [PubMed]
  17. Lacey, J.; Venette, J. Outdoor air sampling techniques. In Bioaerosols Handbook; CRC Press: Boca Raton, FL, USA, 1995; pp. 407–471. [Google Scholar]
  18. Grote, M.; Vrtala, S.; Niederberger, V.; Wiermann, R.; Valenta, R.; Reichelt, R. Release of allergen-bearing cytoplasm from hydrated pollen: A mechanism common to a variety of grass (Poaceae) species revealed by electron microscopy. J. Allergy Clin. Immunol. 2001, 108, 109–115. [Google Scholar] [CrossRef] [PubMed]
  19. Yu, Y.; Cheng, S. Species and distribution of airborne pollen plants in major citys of China. Chin. J. Clin. Immunol. Allergy 2015, 2, 136–141. [Google Scholar]
  20. Ernst, C.L.; Hoffer, R.M. Using Landsat MSS [multispectral scanner] data with soils information to identify wetland habitats [Vegetation types]. In Proceedings of the 5th Annual William T. Pecora Memorial Symposium on Remote Sensing, Sioux Falls, SD, USA, 10–15 June 1979.
  21. Townsend, P.A.; Walsh, S.J. Remote sensing of forested wetlands: Application of multitemporal and multispectral satellite imagery to determine plant community composition and structure in southeastern USA. Plant Ecol. 2001, 157, 129–149. [Google Scholar] [CrossRef]
  22. Hagens, J.S. Object-Oriented and Pixel-Based Image Classification Using Landsat Multispectral and Hyperion Hyperspectral Imagery in Boreal Conditions; Lakehead University: Thunder Bay, ON, Canada, 2008. [Google Scholar]
  23. Peddle, D.R. An empirical comparison of evidential reasoning, linear discriminant analysis, and maximum likelihood algorithms for alpine land cover classification. Can. J. Remote Sens. 1993, 19, 31–44. [Google Scholar] [CrossRef]
  24. Franklin, S.E.; Peddle, D.R. Classification of SPOT HRV imagery and texture features. Int. J. Remote Sens. 1990, 11, 551–556. [Google Scholar] [CrossRef]
  25. Haralick, R.M.; Shanmugam, K.; Dinstein, I.H. Texture Features for Image Classification. IEEE Trans. Syst. Man Cybern. 1975, 3, 610–621. [Google Scholar] [CrossRef]
  26. Sefercik, U.G.; Alkan, M.; Buyuksalih, G.; Jacobsen, K. Generation and validation of high-resolution DEMs from Worldview-2 stereo data. Photogramm. Rec. 2013, 28, 362–374. [Google Scholar] [CrossRef]
  27. Ghosh, A.; Joshi, P.K. A comparison of selected classification algorithms for mapping bamboo patches in lower Gangetic plains using very high resolution WorldView 2 imagery. Int. J. Appl. Earth Obs. Geoinform. 2014, 26, 298–311. [Google Scholar] [CrossRef]
  28. Maheswary, P.; Srivastava, N. Retrieval of Remote Sensing Images Using Colour and Texture Attribute. Comput. Sci. 2009, 4. [Google Scholar]
  29. Doi, R. Simple luminosity normalization of greenness, yellowness and redness/greenness for comparison of leaf spectral profiles in multi-temporally acquired remote sensing images. J. Biosci. 2012, 37, 723–730. [Google Scholar] [CrossRef] [PubMed]
  30. Qin, Q. The problem and solution of automatic interpretation of remote sensing image. J. Sci. Surv. Mapp. 2000, 25, 21–24. [Google Scholar]
  31. Kervrann, C.; Boulanger, J. Optimal spatial adaptation for patch-based image denoising. IEEE Trans. Image Process. 2006, 15, 2866–2878. [Google Scholar] [CrossRef] [PubMed]
  32. Bernstein, L.S.; Adler-Golden, S.M.; Sundberg, R.L.; Levine, R.Y.; Perkins, T.C.; Berk, A.; Ratkowski, A.J.; Felde, G.; Hoke, M.L. A New Method for Atmospheric Correction and Aerosol Optical Property Retrieval for VIS-SWIR Multi-and Hyperspectral Imaging Sensors: QUAC (Quick Atmospheric Correction); Spectral Sciences Inc.: Burlington, MA, USA, 2005. [Google Scholar]
  33. Shackelford, A.K.; Davis, C.H. Fully automated road network extraction from high-resolution satellite multispectral imagery. In Proceedings of the 2003 IEEE International Geoscience and Remote Sensing Symposium, Toulouse, France, 21–25 July 2003; pp. 461–463.
  34. Xin, J.; Ouyang, Z.; Zheng, H.; Wang, X.; Miao, H. Pollen sensitive plants in the city and its influencing factors. J. Ecol. 2007, 9, 3820–3827. [Google Scholar]
  35. Yang, Y. Study on Trees Pollen Dispersal Regulation and Affecting Factors in Beijing City; Beijing Forestry University: Beijing, China, 2007. [Google Scholar]
  36. Cariñanos, P.; Casares-Porcel, M. Urban green zones and related pollen allergy: A review. Some guidelines for designing spaces with low allergy impact. Landsc. Urban Plan. 2011, 101, 205–214. [Google Scholar] [CrossRef]
  37. Cariñanos, P.; Adinolfi, C.; Díaz de la Guardia, C.; De Linares, C.; Casares-Porcel, M. Characterization of Allergen Emission Sources in Urban Areas. J. Environ. Qual. 2015, 45, 289–290. [Google Scholar] [CrossRef] [PubMed]
  38. Asero, R. Birch and ragweed pollinosis north of Milan: A model to investigate the effects of exposure to “new” airborne allergens. Allergy 2002, 57, 1063–1066. [Google Scholar] [CrossRef] [PubMed]
  39. Galán, C.; Alcázar, H.; Dominguez, P. Meteorological variation effect on aerobiology—New tools on pollen forecasting. Eur. Ann. Allergy Clin. Immunol. 2006, 38, 203–208. [Google Scholar] [PubMed]
Figure 1. Overview of West Lake Scenic Area, Hangzhou, Zhejiang Province, China, showing study subareas. Figure legend: Breeze-ruffled Lotus at Quyuan Garden and Su Causeway; Solitary Hill and Bai Causeway; New Lakeside.
Sustainability 08 00978 g001
Figure 2. Flow diagram of the study process.
Sustainability 08 00978 g002
Figure 3. Spectral differences in ground objects before and after atmospheric correction.
Sustainability 08 00978 g003
Figure 4. Comparison of images before and after fusion.
Sustainability 08 00978 g004
Figure 5. Distribution of tree species in Breeze-ruffled Lotus at Quyuan Garden and Su Causeway subarea (Figure legend: Osmanthus fragrans, Metasequoia glyptostroboides Hu et Cheng, Cinnamomum camphora (L.) Presl., Platanus acerifolia Willd., Sapindus mukorossi Gaertn., Quercus acutissima Carruth., and Salix babylonica L.).
Sustainability 08 00978 g005
Figure 6. Accuracy of tree species recognition: Solitary Hill and Bai Causeway subarea (Figure legend: Cinnamomum camphora (L.) Presl., Salix babylonica L., Platanus acerifolia Willd., Chimonanthus praecox (Linn.) Link, Sapindus mukorossi Gaertn., Quercus acutissima Carruth., Liquidambar formosana, Metasequoia glyptostroboides Hu et Cheng).
Sustainability 08 00978 g006
Figure 7. Tree species classification of New Lakeside subarea (Figure legend: Sapindus mukorossi Gaertn., Magnolia Grandiflora Linn., Salix babylonica L., Quercus fabri Hance, Celtis sinensis Pers., Quercus acutissima Carruth., Cedrus deodara (Roxb.) G.Don, Cinnamomum camphora (L.) Presl., Platanus acerifolia Willd.).
Sustainability 08 00978 g007
Figure 8. Spatial distribution of spring-flowering trees (Figure legend: spring-flowering trees).
Sustainability 08 00978 g008
Figure 9. Spatial distribution of fall-flowering trees (Figure legend: fall-flowering trees).
Sustainability 08 00978 g009
Figure 10. Spatial distribution of pollen allergenic risk zone during spring (Figure legend: pollen allergenic zone in spring).
Sustainability 08 00978 g010
Figure 11. Spatial distribution of pollen allergenic risk zone during fall (Figure legend: pollen allergenic zone in fall).
Sustainability 08 00978 g011
Table 1. Remote sensing interpretation markers.
Tree SpeciesInterpretation MarkerTree SpeciesInterpretation Marker
Platanus acerifolia Willd. Sustainability 08 00978 i001Magnolia grandiflora Linn. Sustainability 08 00978 i002
Camphor (Cinnamomum camphora (L.) Presl.) Sustainability 08 00978 i003Celtis sinensis Pers. Sustainability 08 00978 i004
Metasequoia glyptostroboides Hu et Cheng Sustainability 08 00978 i005Liquidambar formosana Sustainability 08 00978 i006
Osmanthus fragrans Sustainability 08 00978 i007Salix babylonica L. Sustainability 08 00978 i008
Sapindus mukorossi Gaertn. Sustainability 08 00978 i009White oak (Quercus fabri Hance) Sustainability 08 00978 i010
Cedrus deodara (Roxb.) G.Don Sustainability 08 00978 i011Quercus acutissima Carruth. Sustainability 08 00978 i012
Plum (Chimonanthus praecox (Linn.) Link) Sustainability 08 00978 i013Peach (Amygdalus persica L.) Sustainability 08 00978 i014
Table 2. Accuracy of tree species recognition: Breeze-ruffled Lotus at Quyuan Garden and Su Causeway subarea.
Tree speciesProd. Accuracy (Percent)User Accuracy (Percent)Overall AccuracyKappa Coefficient
Osmanthus fragrans97.9474.6186.00%80.00%
Metasequoia glyptostroboides Hu et Cheng85.8088.65
Cinnamomum camphora (L.) Presl.80.0997.54
Platanus acerifolia Willd.89.4289.77
Sapindus mukorossi Gaertn.100.0036.45
Quercus acutissima Carruth.69.0179.03
Salix babylonica L.100.0026.78
Table 3. Accuracy of tree species recognition: Solitary Hill and Bai Causeway subarea.
Tree speciesProd. Accuracy (Percent)User Accuracy (Percent)Overall AccuracyKappa Coefficient
Chimonanthus praecox (Linn.) Link96.52100.0090.36%86.93%
Metasequoia glyptostroboides Hu et Cheng100.00100.00
Cinnamomum camphora (L.) Presl.96.7298.36
Platanus acerifolia Willd.100.0093.62
Sapindus mukorossi Gaertn.20.77100.00
Quercus acutissima Carruth.100.0066.77
Salix babylonica L.96.8594.96
Liquidambar formosana10.9227.15
Table 4. Accuracy of tree species recognition: New Lakeside subarea.
Tree SpeciesProd. Accuracy (Percent)User Accuracy (Percent)Overall AccuracyKappa Coefficient
Magnolia grandiflora Linn.91.8261.9686.05%79.78%
Cinnamomum camphora (L.) Presl.97.1488.80
Platanus acerifolia Willd.99.6781.84
Sapindus mukorossi Gaertn.100.0036.45
Quercus acutissima Carruth.77.44100.00
Cedrus deodara (Roxb.) G.Don100.0026.78
Celtis sinensis Pers.75.3665.25
Salix babylonica L.86.6887.35

