Article

Nitrogen and Sediment Capture of a Floating Treatment Wetland on an Urban Stormwater Retention Pond—The Case of the Rain Project

Department of Environmental Science and Policy, George Mason University, Fairfax, VA 22030, USA
*
Author to whom correspondence should be addressed.
Sustainability 2016, 8(10), 972; https://doi.org/10.3390/su8100972
Submission received: 6 August 2016 / Revised: 16 September 2016 / Accepted: 22 September 2016 / Published: 24 September 2016

Abstract

:
Nitrogen is widely recognized as a chronic urban stormwater pollutant. In the United States, wet retention ponds have become widely used to treat urban runoff for quantity and quality. While wet ponds typically function well for the removal of sediments, nitrogen removal, performance can be inconsistent due to poor design and/or lack of maintenance. Retrofitting ponds to improve their nitrogen capture performance, however, is often expensive. By hydroponically growing macrophytes on wet ponds, floating treatment wetlands (FTW) may provide a cheap, sustainable means of improving nitrogen removal efficiency of aging stormwater ponds. Few studies have been performed on the effectiveness real-world stormwater systems, however. In this study, we investigated the nitrogen and sediment capture performance of a 50 m2 floating treatment wetland deployed for 137 days on a stormwater wet pond located within an urban university campus near Washington, D.C. A total of 2684 g of biomass was produced, 3100 g of sediment captured, and 191 g of nitrogen removed from the pond. Although biomass production was relatively low (53 g/m2), we found that nitrogen uptake by the plants (0.009 g/m2/day) was comparable to contemporary FTW studies.

1. Introduction

Urban runoff, or stormwater, is increasingly responsible for the transport of sediment, nutrients, and other pollutants into natural waterways [1,2]. Stormwater is created when permeable surfaces and vegetation are replaced with impervious infrastructure (i.e., roads, parking lots, and buildings) that prevent infiltration and result in the flow of large volumes of water into storm drains and streams during storm events. As stormwater flows across these impervious surfaces, it collects sediment, nutrients, and other contaminants which can pollute receiving waters if left untreated [3,4,5]. As a result, federal, state, and local laws have been enacted to address the myriad issues associated with urban runoff by requiring implementation of stormwater control measures (SCM) such as permeable pavement, bioswales, and retention ponds (also referred to as “best management practices” or BMPs) [6].
In the wake of the Clean Water Act’s passage in 1972, urban retention ponds became the most common SCM used to treat urban runoff [7]. These ponds are now a ubiquitous feature of modern development with some 200–300 ponds in Fairfax County, Virginia alone [8]. Depending on their design, these perennially wet ponds may reduce the risk of flooding downstream and limit stream bank erosion by attenuating the flow of stormwater into receiving waterways [9]. Given sufficient time, or hydraulic residence time, water quality of runoff can also be improved in retention ponds through gravity sedimentation of particulates, organic matter, and metals [10]. Periodic maintenance of wet ponds is required to remove built-up sediments or the ponds may rapidly become ineffective at capturing suspended sediments [9]. Sediments should be typically removed once average pond depth has decreased by 50%, which can occur in 5–10 years depending on pond design and watershed stability [11,12]. Over the past two decades, nitrogen and phosphorus have become recognized as pervasive stormwater pollutants targeted by water quality regulations and implementation of the Environmental Protection Agency’s (EPA) Total Maximum Daily Load (TMDL) program [4]. The TMDL program requires that states establish the maximum amount, or load, of pollutant discharge allowed into impaired waters. Once a TMDL has been determined for a particular pollutant, states or municipalities attempt to meet the established load limits by creating a permitting system for point source polluters and implementing BMPs where necessary [13]. The EPA suggests that nutrient pollutants may also be removed by wet ponds though studies have shown that nutrient removal is inconsistent and highly dependent on pond design features such as relative location of inputs/outputs, hydraulic residence time, and the presence of vegetation [6,7,9,14]. While gravity sedimentation is the primary mechanism for water quality improvement, nutrients are also removed through biological uptake by plants. For example, Mallin et al. [15] and Collins et al. [6] found that nutrient removal was highest in ponds that maximized contact with the root zone of plants and lowest in ponds whose inputs and outputs were located near each other, resulting in a “short circuit” of inflow to outflow that significantly reduced hydraulic residence time and exposure to vegetation. Renovating ponds to meet design criteria that favor nutrient removal can, however, be expensive (approx. $20,000–$60,000/acre for dredging alone), prompting research into alternative methods for improving nutrient removal in wet ponds [16].
One proposed method of improving nutrient capture function of wet ponds is to increase exposure of nutrient laden water to plant roots by constructing floating treatment wetlands (FTWs) [17,18,19]. In wet ponds, vegetation is typically rooted in littoral sediment which limits root exposure and, therefore, nutrient capture performance [20]. In FTWs, hydroponic growth of emergent macrophytes allows the direct uptake of nutrients from the water column. Bottom-rooted vegetation is also at risk of inundation-related stress given the variable nature of the water level in stormwater systems. The buoyant nature of the FTW system, on the other hand, ensures that the plant roots are fully exposed to the water column at all times with no risk of inundation regardless of change in water level. In addition to nutrient removal, recent studies have shown that the suspended root matrix and the FTW structure itself can provide a large surface area for the growth of microbial biofilms that may contribute to removal or transformation of pollutants (e.g., denitrification for N removal) [20,21,22]. The development of a dense, web-like root matrix beneath the FTW can also increase the sediment capture function of a wet pond by physically trapping suspended sediments and encouraging flocculation and precipitation of particulates by impeding the flow of water [7]. While many studies suggest strong potential for FTW use in stormwater systems, most studies have been performed in simulated environments such as mesocosms with relatively few studies taking place on real-world stormwater systems until recently [7,23,24,25]. Because the performance of FTWs depends heavily on the design of the stormwater pond as well as characteristics of the FTW itself (i.e., surface area coverage and plant density) it is important to investigate real-world performance [14,23,24].
One potential drawback of FTWs is that the aerial plant tissue must be harvested annually to ensure permanent removal of nutrients from the stormwater system. However, the assumption that aerial tissues accumulate a significant amount of nutrients is based on only a handful of studies investigating the temporal variation in the distribution of nutrients within FTW plant tissues [24,25,26,27]. Wang et al. [26], for example, reported that distribution of nutrients within the biomass of FTW grown plants varied temporally by both species and target nutrient. In bottom-rooted plants, Marschner [27] and Williamson et al. [28] found that nutrient distribution in biomass varied with developmental stage and in response to nutrient availability in the growth medium while Meuleman et al. [29] found that Phragmites australis redistributed nutrients to the roots during the winter, although these results may not be representative of a hydroponic system. Further investigation of nutrient distribution and mobilization is needed in order to optimize harvest strategies for FTW systems.
We investigated the performance of a small FTW on an urban stormwater retention pond near Washington, D.C. as part of “The Rain Project”, an interdisciplinary student group research and scholarship project addressing sustainable stormwater management on a university campus [30]. We focused primarily on nitrogen uptake via plant growth as well as sediment accretion on the FTW structure itself. Due to funding limitations, we were unable to include an assessment of the microbial catabolism of inorganic nitrogen species by any biofilms that may have developed. The FTW was stocked with five species of native wetland plants and deployed for 137 days during the summer of 2015. The objectives were to estimate nitrogen capture performance of the FTW through quantification of (1) biomass production; (2) differential nitrogen content of the roots and shoots of each species; (3) physical sediment captured by the roots and FTW structure itself; and (4) the nitrogen contained in the sediment accumulated on the FTW structure. This information may inform future management and harvest strategies for FTW systems deployed on stormwater wet ponds.

2. Materials and Methods

2.1. Study Site and Water Quality Monitoring

The FTW was deployed on Mason Pond (38°49′44″ N, 77°18′37″ W), a 7100 m2 urban stormwater retention pond with an average depth of 1.1 m located on George Mason University’s (GMU) Fairfax campus. The pond is primarily fed by a heavily incised stream that flows through a small wooded area before entering the pond. During storm events, additional runoff from adjacent parking lots is transported into the pond through two storm sewers. The outflow of the pond is a weir located approximately 100 m from the primary inflow on the opposite end of the pond. The drainage area for Mason Pond covers approximately 0.55 km2 of land on the urban campus of a university attended by approximately 35,000 students with a large commuter population [31]. The campus is dominated by large buildings, expansive parking lots, and dwindling pockets of undisturbed land. Since the pond’s construction, local development has increased the drainage area beyond its design capacity by approximately 10% [32]. Total precipitation during the study period (May–September 2015) was 421 mm with a monthly average of 84 mm while air temperature ranged from 5.6 °C in May to 34.4 °C in September [33].
Water temperature, dissolved oxygen, and pH were measured two to three times per week during the study period using a YSI 600XL multi-parameter sonde. Measurements were taken at two locations near the inlet of the pond and two were taken underneath the FTW nearest to the outlet of the pond. Grab samples were taken simultaneously with sonde measurements to determine total suspended solids in the pond (TSS). Analysis of total nitrogen (TN) and total phosphorus (TP) in the pond were beyond the scope of funding received for the project, however a recent campus-wide stormwater assessment indicated TN and TP in Mason Pond was typical for urban wet ponds: 2.37–2.56 mg/L and 0.101–0.111 mg/L, respectively [34]. A summary of the hydrologic and water quality characteristics of Mason Pond are presented in Table 1.

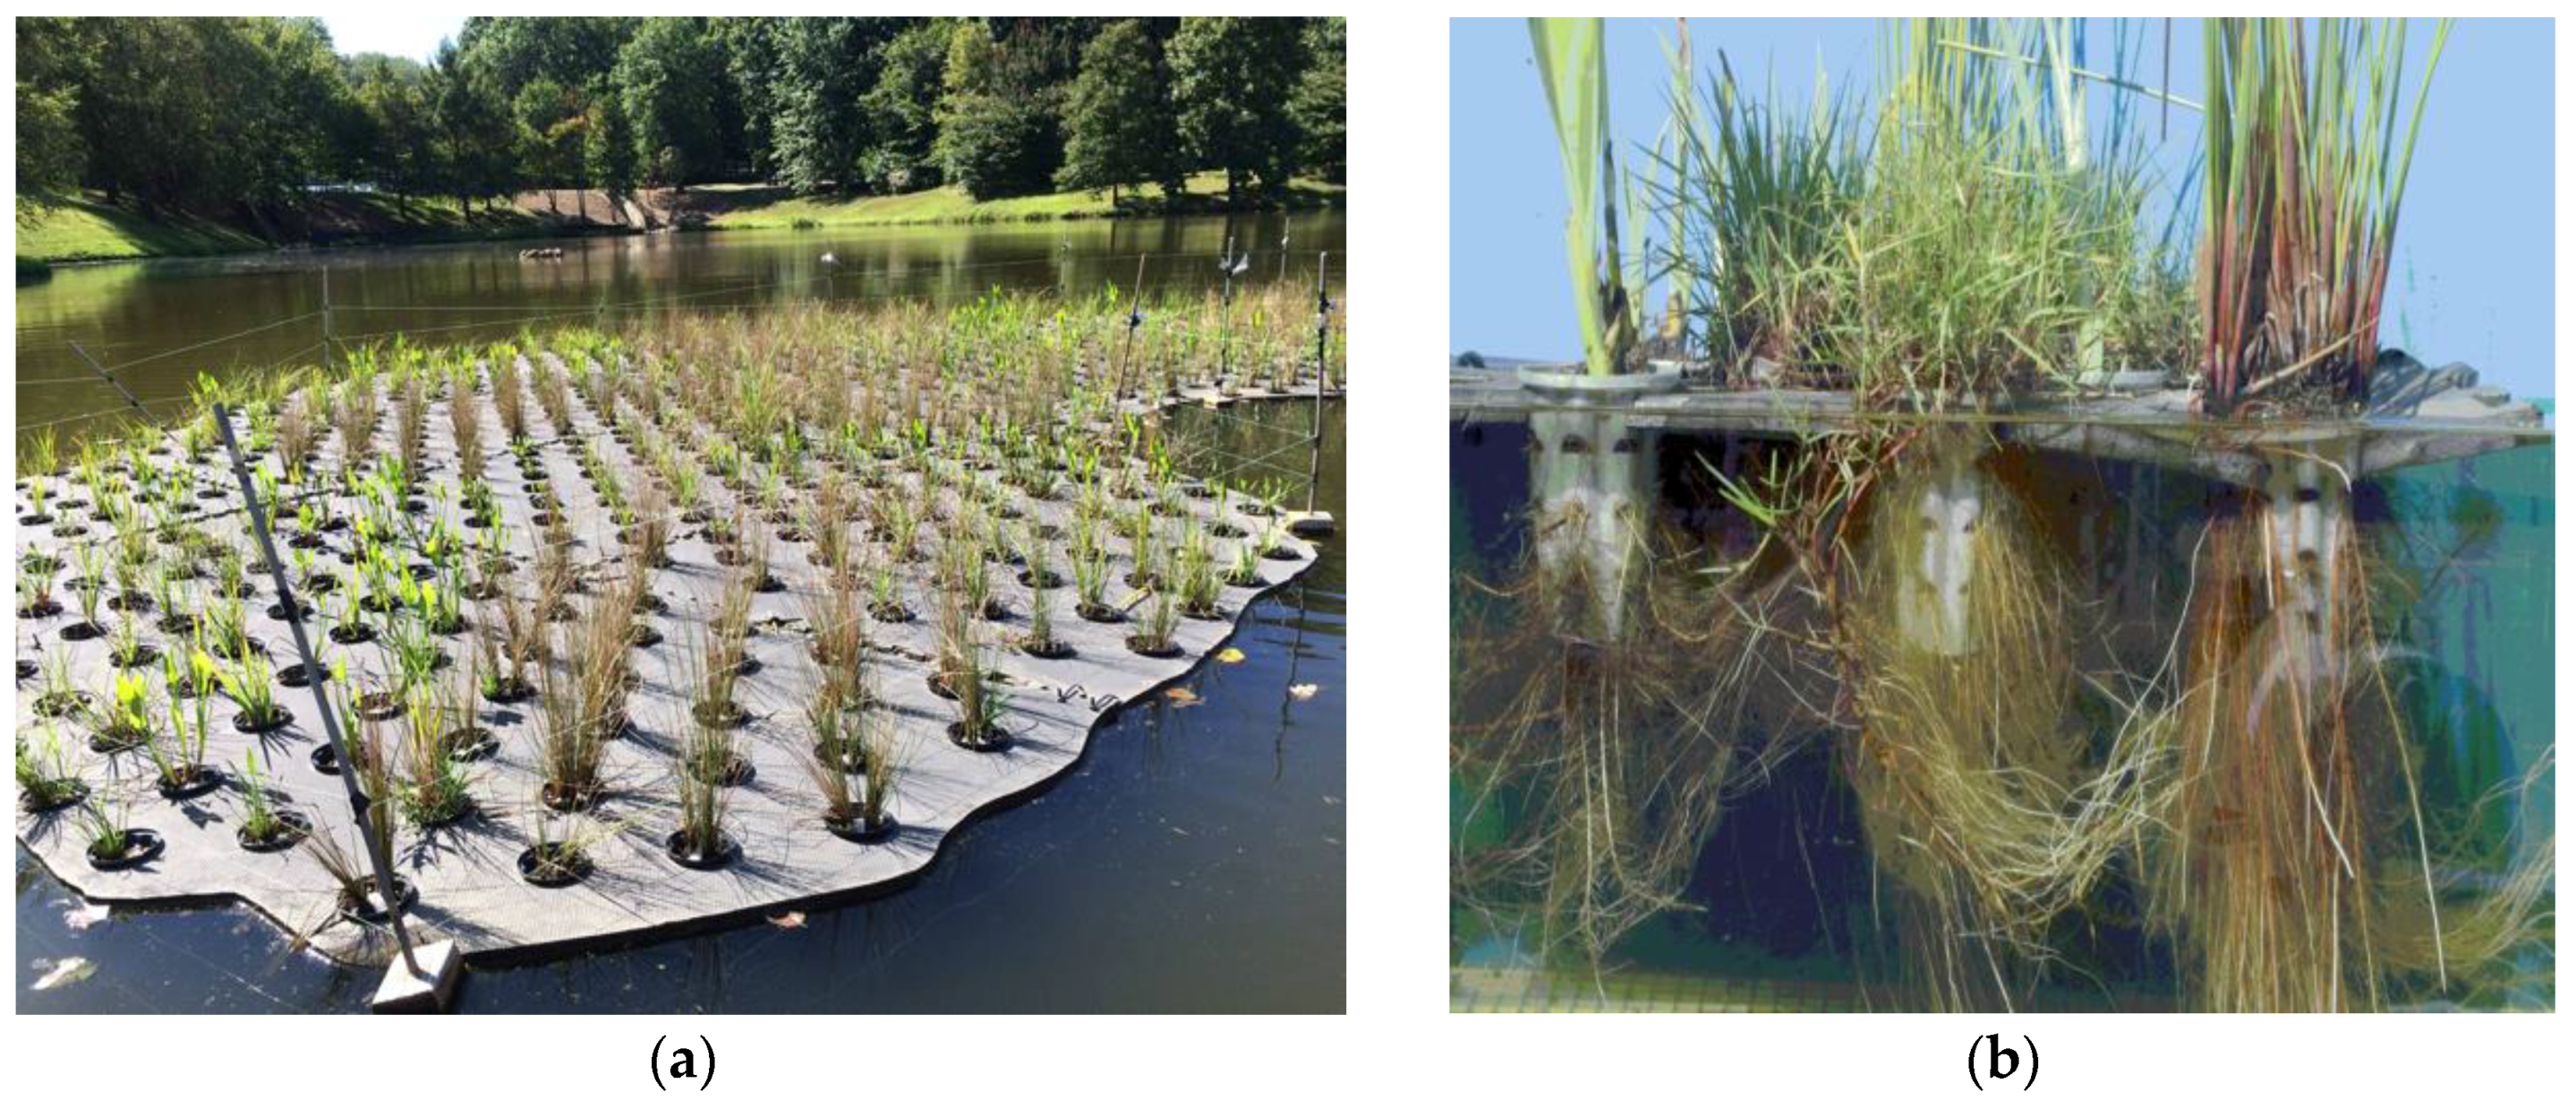
2.2. FTW Construction

FTWs can be created using commonly available materials such as polyvinyl chloride (PVC) tubing and plastic mesh or by employing purpose-built FTW systems such as Biohaven® or Beemat [35,36,37,38]. The variety of construction materials available allows for flexibility in the size and shape of FTWs so that aesthetics may be incorporated. In this study, the FTW design incorporated ideas developed by an interdisciplinary group of GMU undergraduate students enrolled in an ecological sustainability course (EVPP/BIOL 378 and 379) in the Spring semester of 2015. The FTW was designed to mimic human kidneys for their ability to filter contaminants from stormwater [30].
The FTW was constructed using a commercially available system marketed as Beemat (BeeMats LLC, New Smyrna Beach, FL, USA). The system is based around a buoyant, 1.3 cm thick ethylene vinyl acetate (EVA) foam mat covered with pre-cut circular holes uniformly spaced 10 cm apart (Figure 1a). The pre-cut holes allow plants, placed in perforated plastic cups supplied with the system [39], to be suspended from the mat such that the roots were submerged below the water while the shoots remained above the water line as in a hydroponic system (Figure 1b). The mats are typically sold in a variety of dimensions with dovetail joint-style cutouts along the edges allowing multiple mats to be joined together like puzzle pieces. Multiple rectangular foam mats were fastened together into two ~30 m2 rectangles and divided into two identical “kidneys” with a final combined surface area of just over 50 m2. The FTW was then stocked with plants before being placed on Mason Pond in the area with the greatest depth (approximately 1.54 m). Once deployed, the kidneys were tethered together using marine grade rope fed through 1” PVC tube to ensure the FTWs maintained approximately 2.5 m of separation at all times. Each kidney was then anchored to the bottom of the pond by two cinder blocks such that the FTW system was free to move vertically with any changes in pond water level, but did not travel significantly due to wind action or water current. We installed the full-scale floating wetland on 12 May 2015 [40].
Canada geese are often found in the pond and have damaged FTWs in other studies. To deter waterfowl from landing on the FTW and/or grazing on the plants, a simple fence was constructed from fishing line strung between wooden dowels placed around the periphery of each kidney [7,25]. A piece of reflective plastic flagging was attached to the top of each dowel to create an additional visual/audible deterrent.

2.3. Plant Selection and Setup

Five species of native wetland emergent macrophytes were chosen for use on the FTW: Alisma subcordatum (American water plantain), Carex stricta (upright sedge), Iris versicolor (blue flag iris), Juncus effusus (common rush), and Pontederia cordata (pickerelweed). Plugs were purchased from Environmental Concern Inc. (St. Michael’s, MD, USA); a nursery that specializes in the sale of wetland plant species for research and industrial use. These species were selected because they are common North American wetland native plants that tolerate constant inundation of the root system. While all five species have been previously used in treatment wetlands, Juncus and Carex have been shown to be highly effective nutrient removers [41,42] and, as such, were planted in higher numbers than the other species (Table 2).
Prior to deployment on the FTW, the roots of each plug were thoroughly washed in water to remove any potting medium in an effort to limit import of sediment and nutrients into the pond. The washed roots were then gently wrapped with a sheet of coconut coir and inserted into a perforated plastic cup. A plastic fastener was then used to secure the plant in place so that it did not become dislodged or float out of the cup. The plastic cup was then inserted into one of the pre-cut holes on the FTW mat immediately prior to deployment.

2.4. Plant Biomass Measurement and Tissue Analysis

To determine change in plant biomass (i.e., plant growth) and their nitrogen contents, between 8 and 18 individuals of each species were collected before and after FTW deployment. Initial plant samples were randomly selected from the lot delivered by the nursery while post-deployment samples were randomly selected on the day the FTW was removed from the pond and all biomass was harvested. Samples were processed within three days of collection. The roots of all samples were gently washed with water to remove any sediment or foreign materials. Sediment washed from roots and cups of plants collected after deployment was saved for sediment analysis (see following section). The roots of post-deployment samples had to be cut away from the coconut coir wrapper because the roots had grown entangled in the coir during the course of the FTW deployment. Care was taken to cut the roots off as close to the coir wrapper as possible to minimize the loss of plant material. The coconut coir was then carefully unwrapped and the remaining plant material inside was collected. Scissors were used to separate the roots and shoot of each plant for individual analysis. Individual plant samples were transferred to a pre-weighed brown paper bag, weighed for wet mass, and placed in a Lindberg Blue Mechanical Oven (Model #M01450A) at 50 °C for 36 h or until constant mass was achieved between measurements. Once dry, the bags were removed and weighed to determine dry mass. The individual dried samples were then combined by species and plant structure (root/shoot) and ground into a fine powder using a 60-mesh screen on a Thomas Scientific Mini-Mill Cutting Mill (Model #3383-L10). Three samples of the root and shoot of each species were analyzed for nitrogen content with a Perkin Elmer Series II CHNS/O Analyzer.

2.5. Sediment Analysis

After plants were removed from the FTW, sediment accumulated on the underside of the Beemat was collected while still wet. Quadrats of approximately 0.05 m2 were randomly placed on the Beemat and plastic putty knives were used to scrape as much sediment as possible from the surface. Sediment was removed from approximately 3.23 m2 of the mat surface (excluding pre-cut holes in the mat). The scraped sediment was transferred to a Nalgene bottle and placed in a refrigerator for temporary storage. Within 24 h, the sediment was transferred to a pre-weighed foil packet and dried at 60 °C for 36 h. The mass of the sediment was then calculated by subtracting the mass of the empty foil packet from the mass of the foil packet containing dried sediment. Density of accumulated sediment (g/m2) was calculated by dividing the mass of dried sediment collected by the area sampled. An estimate for total mass of sediment accumulated by the FTW mat was calculated by multiplying the density by the total area of the FTW minus the pre-cut holes.
Sediment and foreign material trapped by plant roots and plastic cups during deployment was collected by species from the roots of the plants randomly sampled from the FTW. Tap water was used to wash the trapped material from the roots and cups into a 5-gallon bucket. The mixture of trapped material and water was then passed through a 2 mm sieve to remove large, non-sediment material (i.e., small rocks and twigs) followed by a 0.5 mm sieve to remove finer pieces of non-sediment material (i.e., fine plant material and small aquatic organisms). The material trapped by the sieves was thoroughly washed with tap water to minimize the amount of sediment not accounted for. The remaining mixture was assumed to contain only trapped sediment. To determine the amount of sediment captured by the sampled plants, the total volume of the sediment and water mixture was determined. The mixture was then agitated vigorously to suspend the sediment evenly in the water column. Three random 100 mL samples were then vacuum filtered through Whatman™ 934-AH™ glass microfiber filters (CAT. No. 1827-047). The filters were then dried at 105 °C for 1 h to determine dry mass of sediment filtered. The resultant mass was then divided by the volume filtered to determine the density of suspended sediment. Total amount of sediment trapped by the sampled plants was then estimated by multiplying the density of suspended sediment by the total volume of sediment and water mixture. To estimate the amount of sediment captured per cup, the estimated mass of total trapped sediment was divided by the number of plants sampled for each species respectively. The mass of total sediment trapped by the roots and cups on the FTW was then estimated by multiplying the mass of sediment trapped per plant by the total number of plants of each respective species. CHNS/O analysis was also performed for sediment scraped from the FTW structure itself as well as the sediment washed from the cup and roots for each species.

2.6. Data Analysis

Individual root and shoot dry biomass measurements were combined to estimate whole plant biomass for each species. Mean and standard error of dry biomass was calculated for whole plants, roots, and shoots for each species. Mean change in biomass per plant per species was estimated by subtracting mean initial dry biomass from mean final dry biomass. Total change in biomass per species was estimated by multiplying mean change in biomass per plant by the total number of conspecifics planted on the FTW. Similarly, mean and standard error of nitrogen content (as % of dry matter) was calculated per species and plant structure. To estimate nitrogen content of whole plants (roots/shoots combined), results of CHN analysis on roots/shoots were averaged together. IBM SPSS statistical software was used to compare biomass and nitrogen content between pre- and post-deployment with an independent samples T-test (p = 0.05). Levene’s test for equality of variances was used prior to the T-test to test the equality of variance assumption. Water temperature, dissolved oxygen, and pH were compared between inlet and below-FTW using a two-sample T-test (p = 0.05).

3. Results and Discussion

3.1. Mason Pond Water Quality

The water quality in Mason Pond (Table 1) was comparable to that of stormwater used in both mesocosm and real-world studies [43,44]. There was no significant difference between the water temperature, dissolved oxygen, pH, and TSS when inlet and below-FTW measurements were compared (p > 0.05). Borne et al. [23] observed significantly lower DO beneath their FTW which, coupled with high water temperature and secretion of organic carbon from plant roots, create ideal conditions for denitrification. The lack of measurable impact on selected water quality parameters is likely due to the small size of our FTW (~1% of pond surface area). A model by Marimon et al. [14] suggests that an FTW must cover 10%–25% of pond surface area to significantly improve water quality.

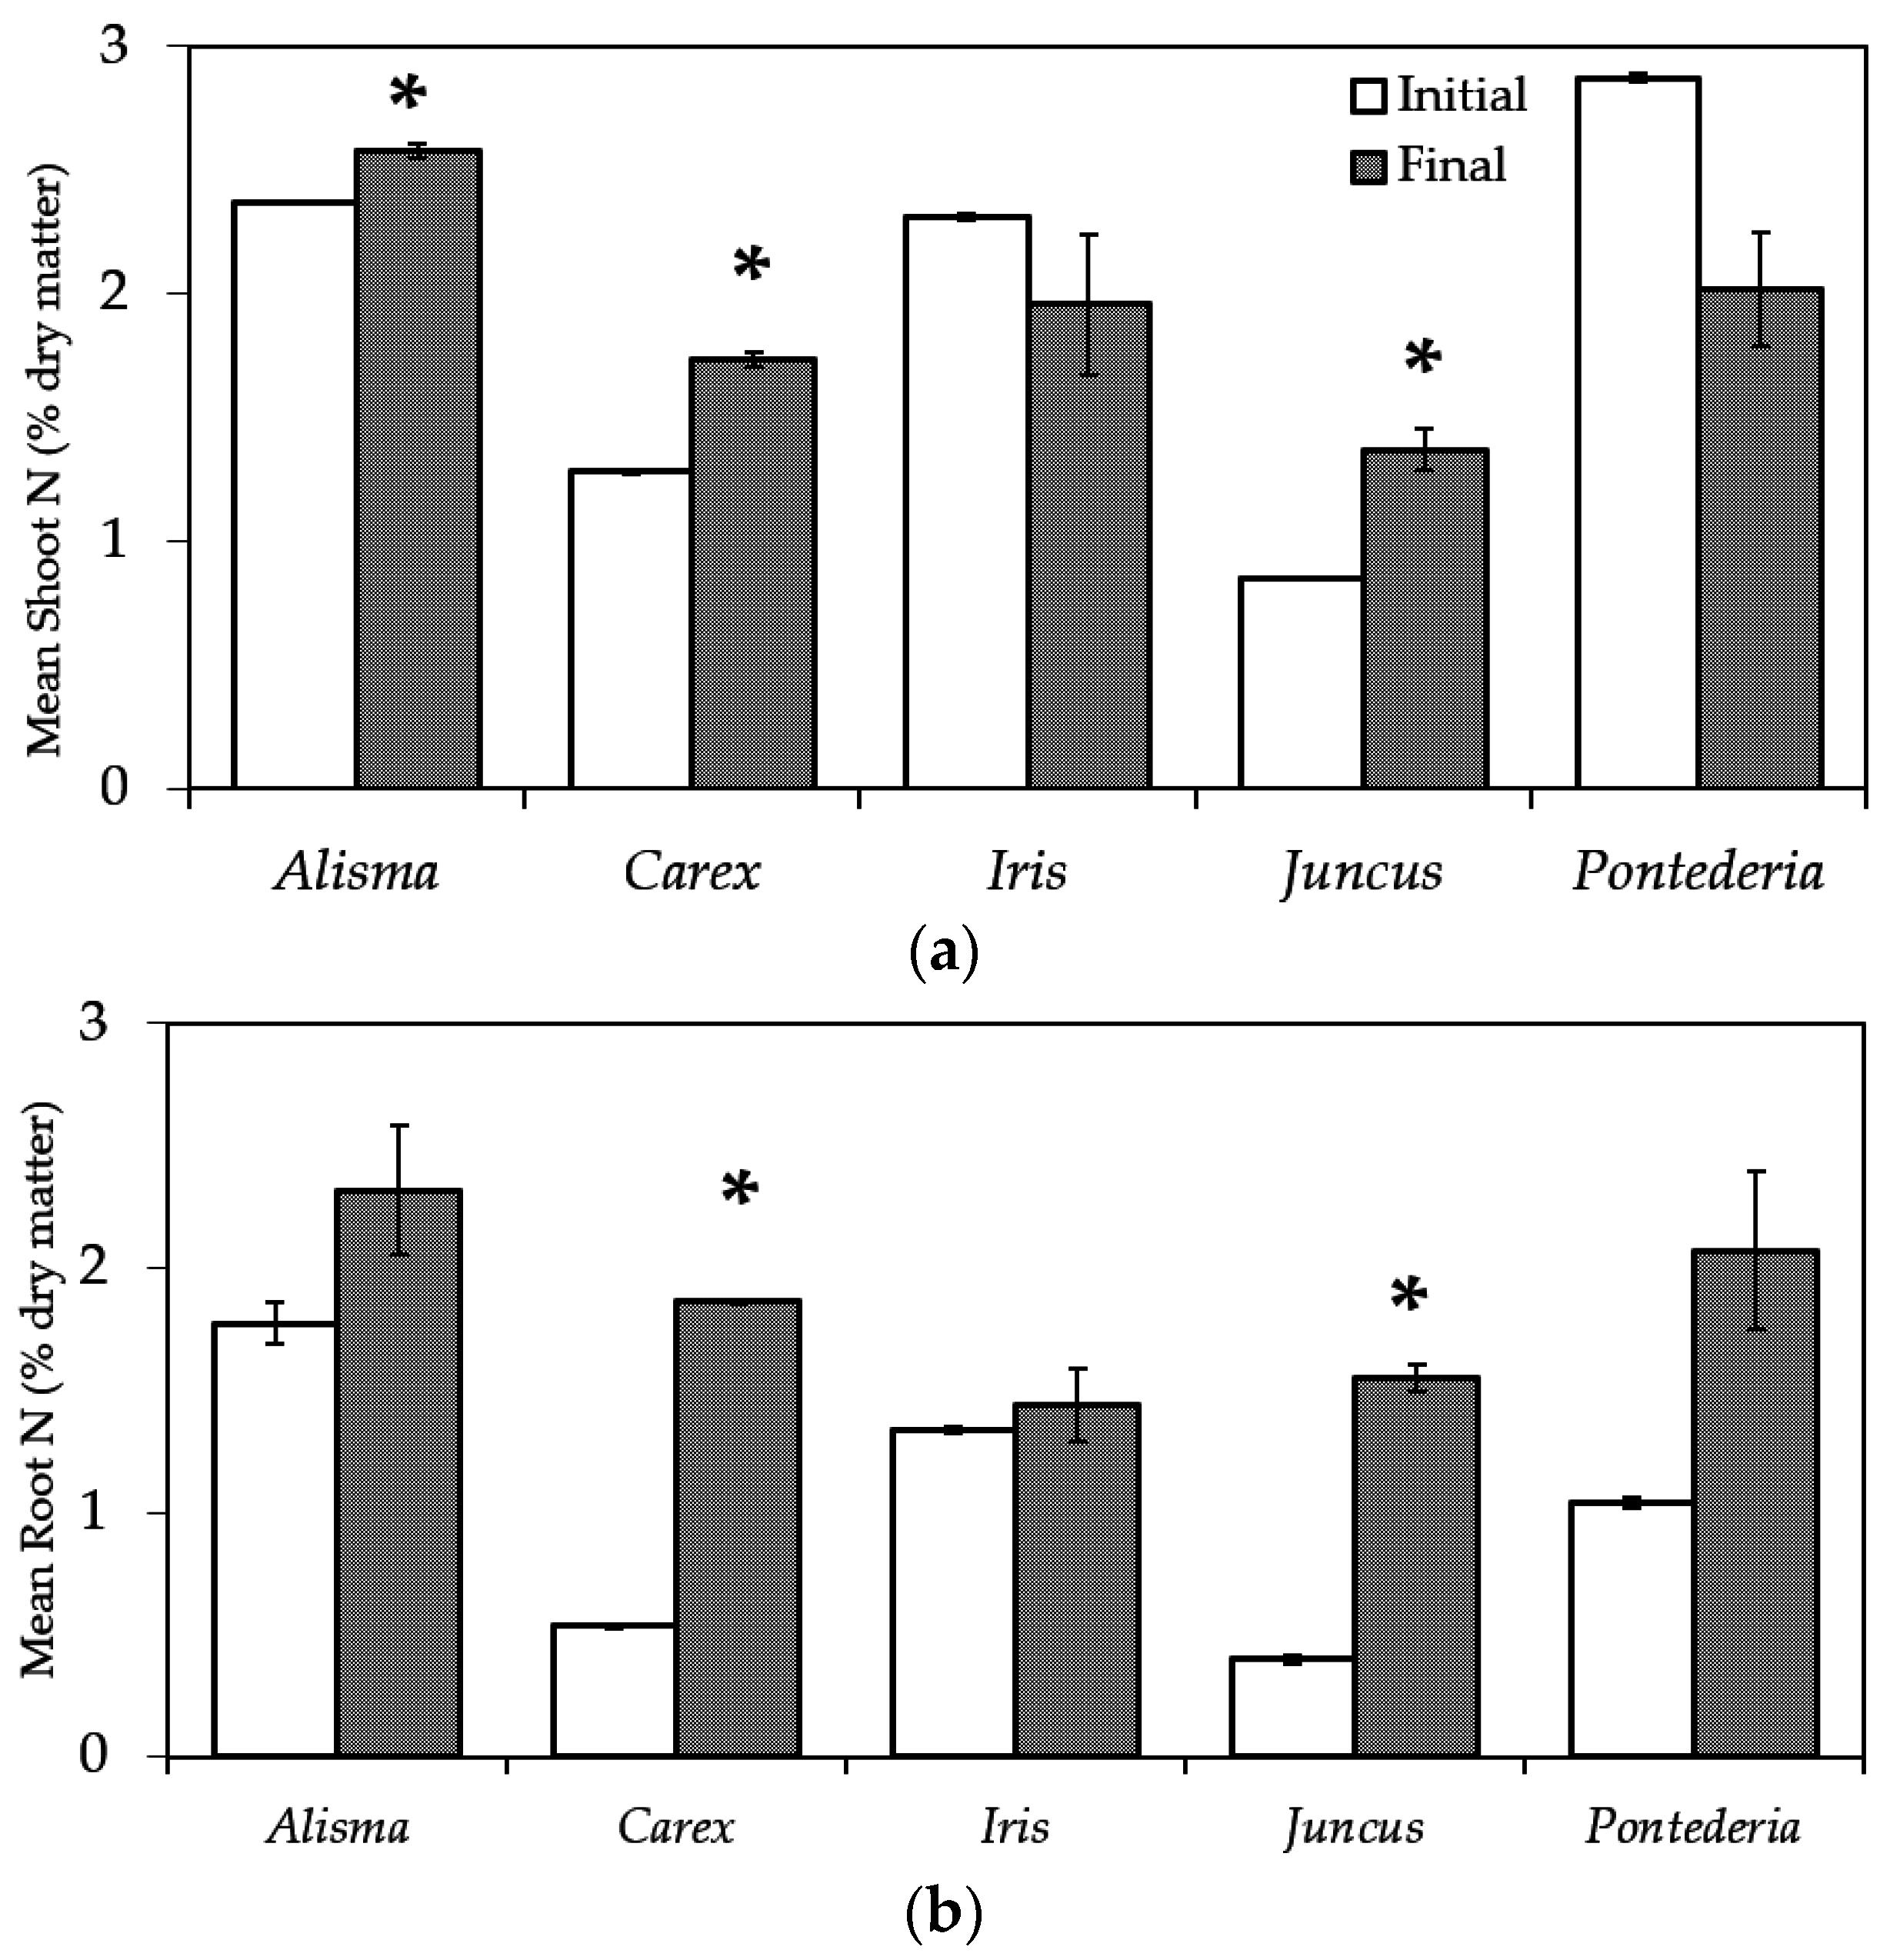
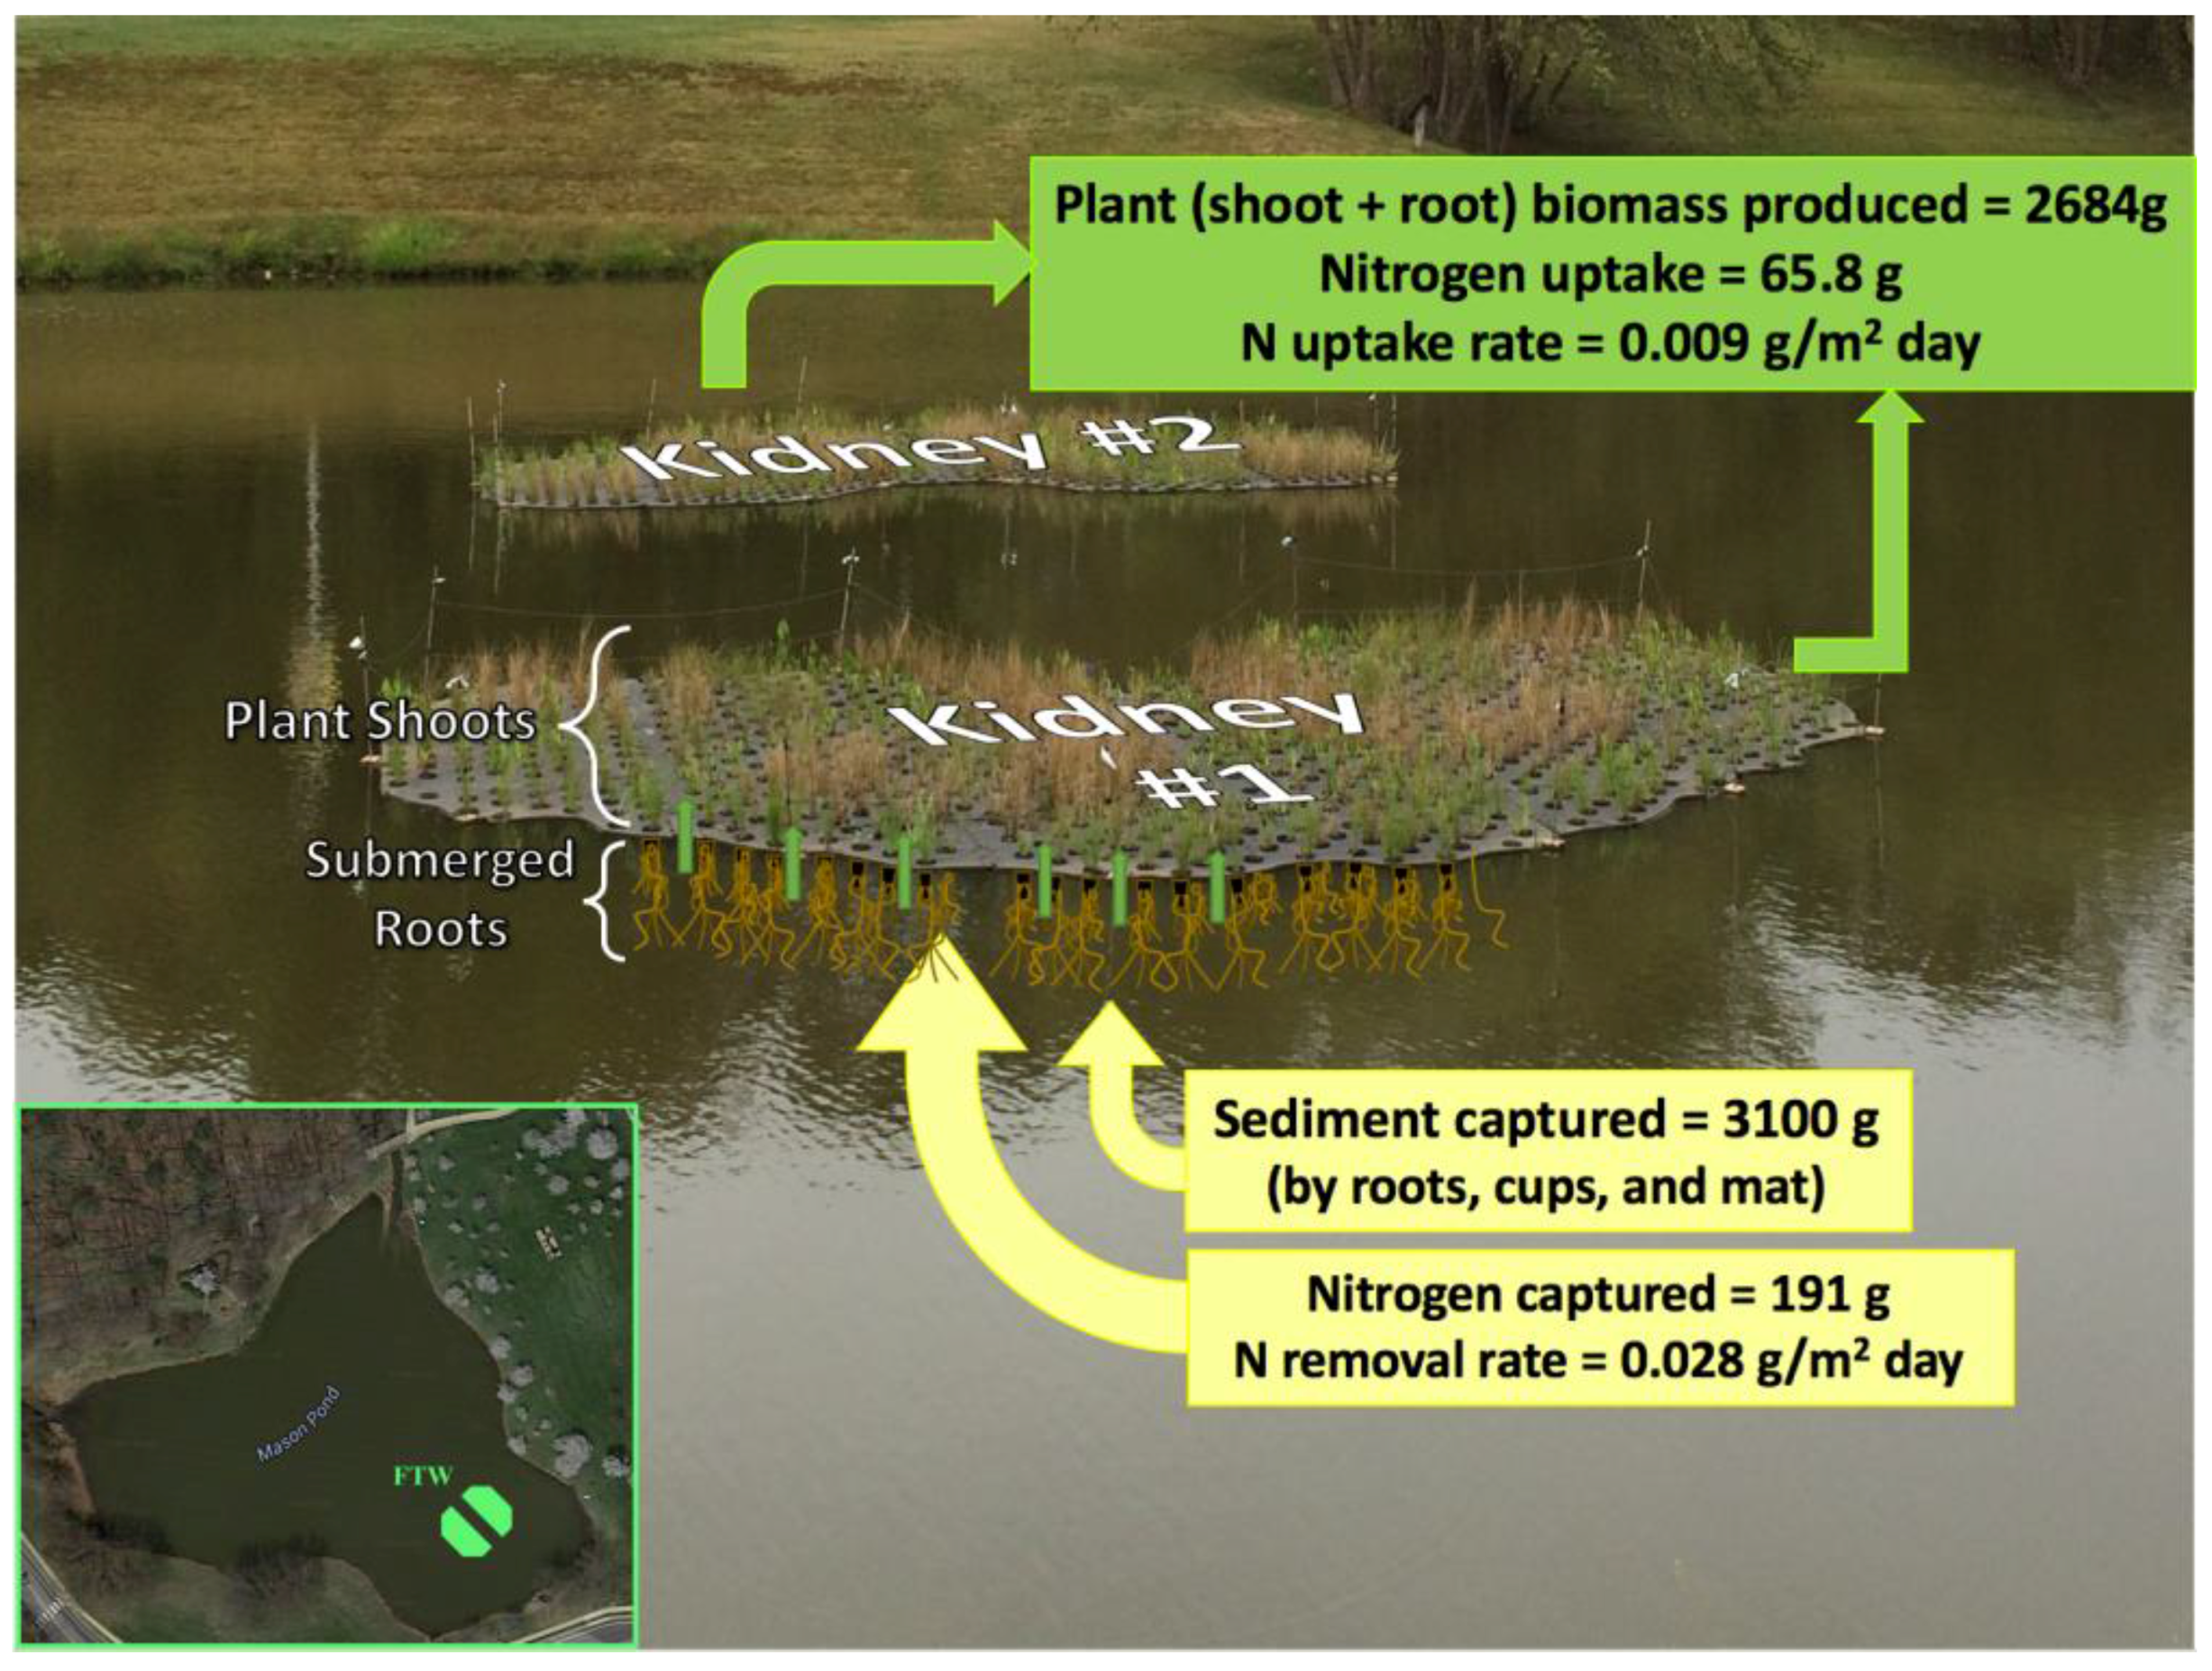
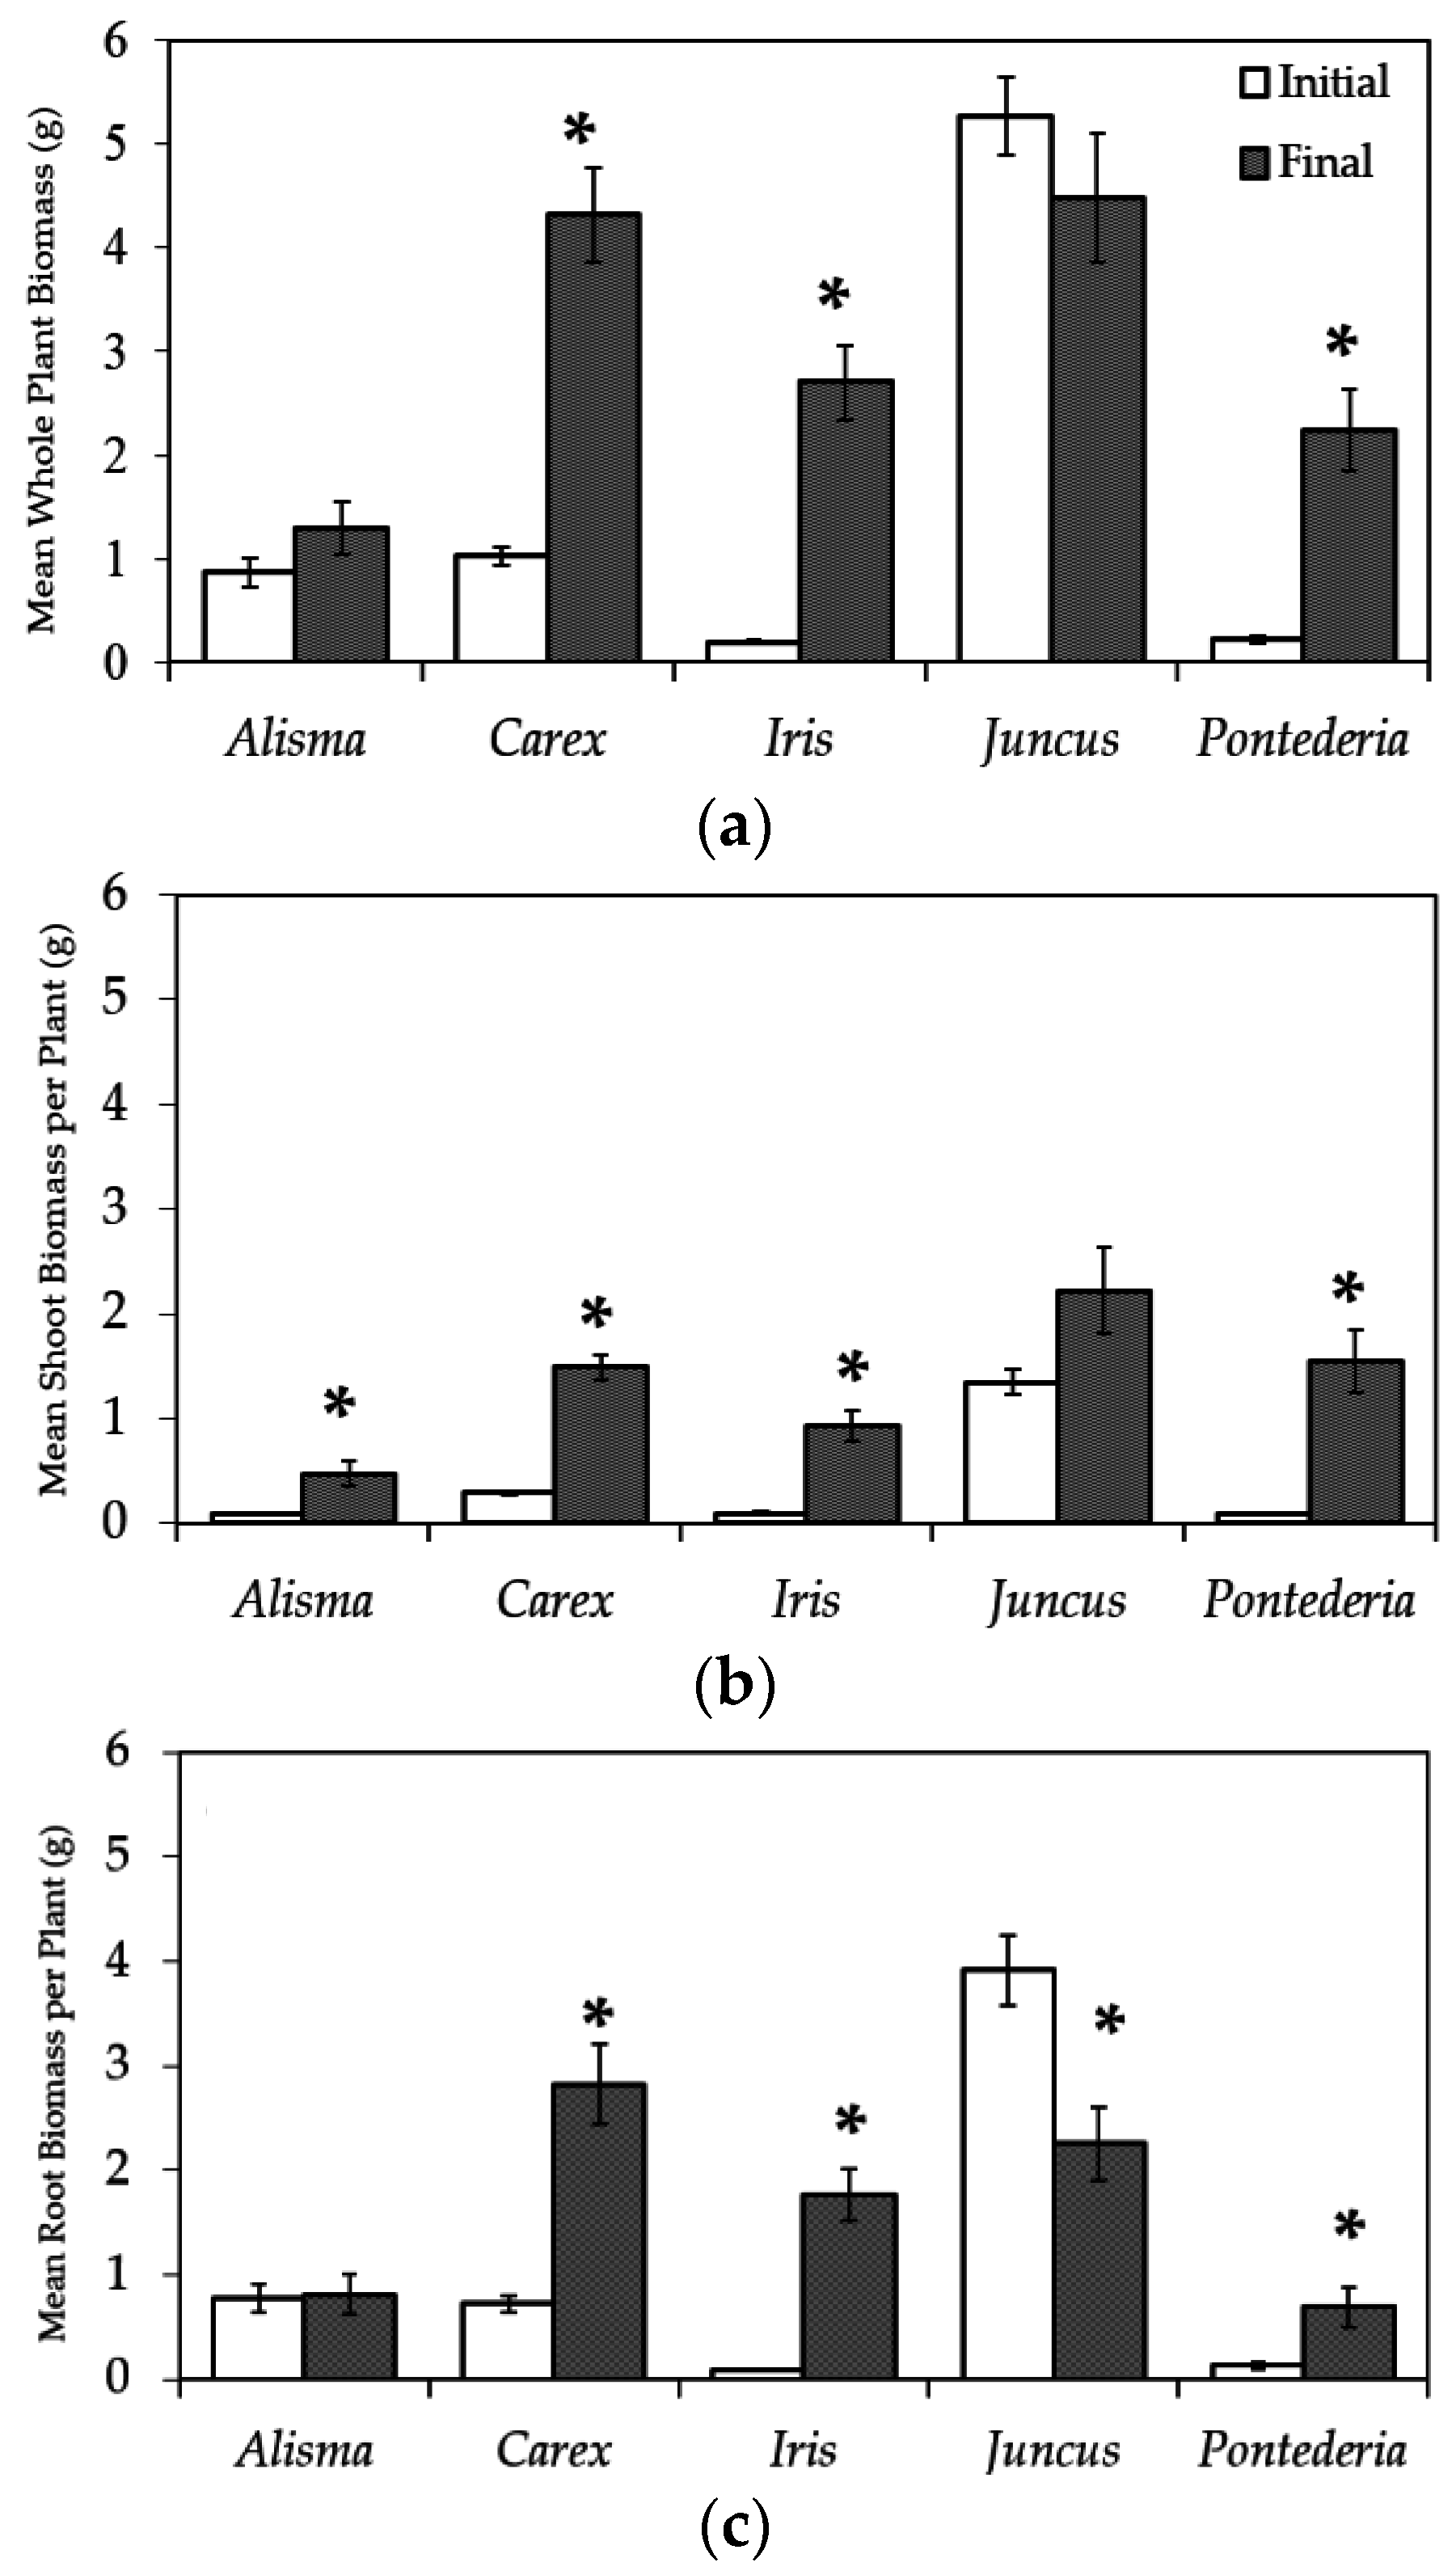
3.2. Plant Biomass Production and Nitrogen Uptake

Visual assessment of above-mat growth on the FTW suggested that biomass production was poor on the FTW. While we did not explicitly measure shoot length in this study, no shoots appeared to exceed 25 cm in height; less than half of what was reported in several other FTW studies [7,43,44]. Root length, however, appeared to be on par with observations by Wang et al. [44] ranging from 20 to 50 cm. Over the course of the 137-day deployment, an estimated 53.7 g/m2 of total biomass was produced by the plants on the FTW for a total of 2684 g of biomass. By comparison, Lynch et al. [43] found that a Beemat based FTW (the same system used in this study) stocked with Juncus effusus produced 155.3 g/m2 in total biomass when deployed in mesocosms that contained less than half the TN found in Mason Pond. When we examined biomass production at the species level we found that, while growth was relatively low all around, some species were more productive than others. Carex, Iris, and Pontederia experienced a significant increase (p < 0.05) in biomass during deployment, generating an average of 3.29 g, 2.51 g, and 2.02 g in biomass, respectively (Figure 2a). Alisma and Juncus, however, showed no change from initial biomass though Juncus appeared to have lost mass after deployment. While we observed similar mass per plant values as Wang et al. [44], Winston et al. [7] reported final biomass between one and two magnitudes of order higher than we observed for the same species of Carex, Juncus, and Pontederia. In both of these studies, the FTWs were deployed between two and four times longer than ours which suggests FTWs may require at least one growing season to become acclimated before producing considerable biomass although this did not appear to limit biomass by Lynch et al. [43].
Shoot biomass increased significantly in all species except Juncus (Figure 2b). Similarly, the roots of Carex, Iris, and Pontederia increased significantly from initial deployment while Juncus roots appeared to lose an average of 1.66 g of root biomass which we attribute to inaccurate initial root mass measurements (Figure 2c). The Juncus plugs received from the nursery were severely pot-bound which made it very difficult to wash all soil from the roots without causing damage to the plant. This is supported by the fact that the initial mean root mass of Juncus was 3.13 g higher than Alisma which had the second heaviest initial root mass (3.91 g vs. 0.78 g respectively). We suspect that any remaining potting material was then washed away during the course of the FTW’s deployment.
While whole-plant biomass production was mediocre in comparison to other FTW studies, we observed noteworthy differences between above- and below-mat biomass production. For example, we observed higher below-mat biomass production compared to the mesocosm-based FTW study mentioned earlier (23.8 g/m2 vs. 12.4 g/m2) though above-mat production was nearly five times lower in our study (29.9 g/m2 vs. 142.9 g/m2) [43]. In both cases, it is likely that below-mat biomass production was higher than observed as it was difficult, if not impossible, to remove all root material for sampling. The ratio of above-mat biomass to below-mat biomass (A:B) on our FTW that indicated development of root mass outpaced shoot development in all species except Juncus and Pontederia (Table 3). Other FTW studies, however, have consistently reported more vigorous shoot growth (A:B > 1) than we observed [7,20]. While disproportionate root growth has been observed as a physiological response to low nutrient availability, nutrient levels in Mason Pond are not thought to be low enough to trigger such a response [27,28,45]. Unfortunately, funding limited our ability to periodically measure nutrient levels in the pond to verify this assumption. Given the heavily urbanized location of the pond, however, it is unlikely that the pond waters are oligotrophic. Nutrient removal is a function of the combination of several physicochemical and biological processes, including sedimentation and plant uptake. Further research is needed to investigate more carefully those factors that may interact with or impact growth of FTW plants.
The FTW plants removed a total of 65.8 g of N at a rate of 0.009 g/m2/day which is well within the range of nitrogen uptake rates reported by Wang et al. [26] in a review of 16 studies on FTWs and similar technologies (i.e., between 0.0015 and 2.8 g/m2/day; mean 0.64 g/m2/day). This result is also very similar to the 0.007 g/m2/day of nitrogen uptake by a Beemat FTW reported by Lynch et al. [43]. Root and shoot nitrogen concentration were quite similar across the board with root concentrations ranging from 1.44% to 2.32% of dry matter and shoot concentrations ranging from 1.37% to 2.58% of dry matter (Figure 3). Alisma exhibited the highest concentration of nitrogen in both the roots and shoots, while root and shoot nitrogen was lowest in Iris and Juncus, respectively. For comparison, Winston et al. [7] reported below-mat nitrogen concentrations between 1% and 2% and above-mat concentrations less than or equal to 1% for a Biohaven® based FTW. In an investigation of nitrogen accumulation in sediment-rooted wetland macrophytes, Lenhart et al. [46] reported above- and below-ground nitrogen concentrations of between 0.78%–2.63% and 0.39%–1.94% respectively. These results suggest that nitrogen uptake in our FTW was not dissimilar from other FTW systems nor bottom-rooted plants. To ensure that nitrogen was not exported from the plants during deployment, we also compared initial and final nitrogen concentrations. We found that nitrogen content in the shoots of Alisma, Carex, and Juncus increased significantly over the course of the deployment while nitrogen content in the roots increased only in Carex and Juncus (Figure 3). This suggests that Carex and Juncus may have a greater capacity for nitrogen assimilation than the other species sampled.
Several studies have suggested that nitrogen may be redistributed between root and shoot tissue on a seasonal basis or in response to environmental stimuli [25,26]. However, we found that nitrogen distribution between the roots and shoots of the plants did not differ much after growth on the FTW (Table 3). Although Carex showed a statistically significant difference in the nitrogen content between roots and shoots, this difference was fairly negligible in terms of overall nitrogen capture (i.e., 1.86% vs. 1.73%). While some studies suggest that temporal variation in the distribution of nutrients within plant tissues should be a major consideration in harvesting strategy, our results suggest that scheduling harvest at peak above-mat biomass may be a simpler solution as it mitigates the risk of release of nitrogen associated with senescence.

3.3. Sediment and Sediment N Capture

During the course of the deployment, we periodically lifted up the edge of the FTW to examine root growth. Within several weeks, a brown film had formed on the bottom of the FTW mat, the perforated plant cups, and the plant roots themselves indicating accumulation of suspended particulate matter. We were unable to separate sediment captured by plant roots from that captured by the plant cups and they are therefore referred to as a single unit (roots) in this discussion. The FTW mat accumulated approximately 30.69 g/m2 of sediment; a total of 1313 g of sediment captured between the two kidneys (Table 4). This sediment contained 54.4 mg/kg nitrogen indicating that the FTW mat removed approximately 71.5 g of nitrogen from the pond (Table 4). Sediment trapped by the roots varied by plant species and ranged from 0.89 g/plant in Alisma to 1.44 g/plant in Carex with an estimated total sediment capture of 1787 g. Nitrogen content of the root-trapped sediment varied slightly by species and ranged from 2.57% to 3.79%. Extrapolation for all plants on the FTW indicated that as much as 1787 g of sediment, containing 54 g of nitrogen, was trapped by the roots. These results suggest that a total of 3100 g of sediment and 125 g of nitrogen was captured by the FTW system as a whole at a rate of 66 g/m2 (Table 4). In a review of floating wetland studies, Headley and Tanner [24] reported past FTWs have exhibited sediment capture rates between 20 and 2200 g/m2 which suggests that our FTW performed favorably in this regard. As discussed in Section 3.1., however, TSS was not significantly reduced near the FTW likely due to the small size of our FTW. At least one other study has reported significant reductions in TSS in a pond featuring an FTW [47]. Based on these results, however, it is not unreasonable to assume that FTWs that cover a larger proportion of pond surface area may contribute to significant sediment capture through physical trapping and also by encouraging gravity sedimentation.

3.4. Nitrogen Budget

Our FTW plant uptake was responsible for just 34.4% of nitrogen removal by mass. The remaining nitrogen was contained in sediments captured by the hanging root matrix (28.3%) and accumulated on the FTW mat (37.3%). Few other studies have investigated sediment capture through physical processes on FTWs and none have analyzed the sediment for nitrogen content so we are unfortunately unable to compare our results with others [21]. Regardless, the FTW as a whole removed a total of 191 g of nitrogen from the pond at a rate of 0.028 g/m2/day (Figure 4).

3.5. Implications of the Study and Recommendations

Although our FTW was a small case study, it adds further evidence that these systems can augment the performance of stormwater wet ponds as a means of improving water quality of urban runoff. Nitrogen and sediment were captured, albeit in small amounts by a low-cost, low-maintenance system. In addition, the FTW provided a new habitat for wildlife in and around the pond. During bi-weekly monitoring, we observed a variety of wildlife utilizing the FTW. Two resident green herons, undeterred by the waterfowl fence, quickly learned to use the FTW as a platform from which to prey on the schools of small fish that swam around and underneath it. Spiders and ants also appeared to have colonized the artificial island, while dragonflies and damselflies were observed using the waterfowl fence posts as both molting posts and hunting perches. Lastly, frogs and turtles were frequent visitors, sunning themselves on the surface of the mat. It is likely that more wildlife was utilizing the FTW than we observed as Wang et al. [44] reported the presence of at least 22 species of animals and insects on or near their FTW (located less than two miles from our own).
For these reasons, FTWs present a sustainable option for improving the function of wet stormwater ponds—especially in cases where funds may be unavailable for expensive retrofits. Despite this, practitioners may face challenges from municipalities or local governing bodies when attempting to deploy FTWs as they are a relatively new technology. For example, we initially faced skepticism and opposition from our campus facilities department when we requested permission to deploy our FTW on the campus pond. Although we were eventually given permission to deploy the FTW, it was only on the condition that the FTW was very small and would be removed by the end of the summer. By limiting the size and deployment length, the scope of our study was fairly reduced. Once deployed, however, the FTW project was well-received by the public and administrators alike, suggesting that the skepticism largely stemmed from unfamiliarity with the technology. In fact, the attention received by the FTW provided multiple opportunities for outreach and education regarding stormwater issues as we received a fair amount of inquiries by nearby municipalities about their adoption of the FTW. While SCMs and BMPs provide a means of managing and treating stormwater, urban water pollution will not be significantly reduced without an informed public. Our FTW, located on a pond near the center of campus, provided multiple opportunities to educate the public about urban water pollution and/or sustainable stormwater management, and how they can help reduce it. We invited a local high school class to help deploy and learn about the FTW which gave us an opportunity to discuss stormwater related issues in urban watersheds (see Ahn, 2016 for more information [30]). During our weekly monitoring after launching the FTW, it was not uncommon to receive questions about the FTW from curious passersby. While nearly everyone we encountered had never heard of FTWs before, most people intuitively understood its purpose and were receptive to learning more about stormwater issues.
We live in an era of ever-increasing urbanization, yet stormwater issues caused by such development are largely overlooked by the general public. Furthermore, climate change is predicted to increase the frequency of storm events which will further compound issues related to urban stormwater management. It is critical to work together to learn more about and to adopt green infrastructure such as FTW to create sustainable ways of managing nutrients and pollutants in our waterways. Our FTW project, the so-called “The Rain Project”, presented a successful case of addressing an important contemporary environmental issue (i.e., sustainable stormwater management) through experiential learning, community building, and public outreach [30].

4. Conclusions

Although biomass production on our FTW was relatively unremarkable, the rate of nitrogen uptake by plant biomass was comparable to rates reported in other FTW studies [23]. Distribution of nitrogen between the roots and shoots generally did not differ between pre- and post-deployment which suggests that harvest strategies should focus on maximizing biomass removal rather than attempting to capitalize on temporal changes in nutrient distributions. Nitrogen was also found in the sediments trapped by the plant roots and FTW structure itself, however it is unlikely that such captured sediments would ever be harvested as it is a labor intensive process that requires removal of the entire FTW system. Furthermore, the plant roots and FTW structure may have provided a surface for the development of bacterial biofilms that could contribute to overall nitrogen removal via nitrification and denitrification pathways. Unfortunately, funding limitations prevented us from investigating this aspect of FTW performance. FTWs represent a promising new technology for the augmentation of stormwater wet ponds, however their long-term effectiveness remains unclear. Further investigation is needed to determine the performance of FTW systems over multiple growing seasons, clarify nutrient distributions within plant matter to inform harvest strategies, and examine the contribution of biofilms to overall nutrient removal.

Acknowledgments

Thanks go to University Life, the College of Science Dean’s Office, Biology and Environmental Science and Policy departments, at GMU for their supports for the Rain Project. Special thanks go to Mason 4-VA Innovation Grant and OSCAR undergraduate research and scholarship program that sponsored the study described in this paper. We sincerely thank all the students who participated in the Rain Project, especially the ones from both the Spring 2015 Ecological Sustainability class (EVPP378/BIO379) that participated in the design, construction, and installation of the FTW and the Fall 2015 Wetland Ecology and Management (EVPP 646/647) that assisted with harvesting the FTW and processing plant samples. We appreciate assistance by Suzanne Dee, Mary Means, Jillian Brooks, and Andy Sachs throughout the project.

Author Contributions

Changwoo Ahn conceived and designed the study; Brendan McAndrew, Joanna Spooner, and Changwoo Ahn all participated in conducting the study; Brendan McAndrew, Changwoo Ahn, and Johanna Spooner all participated in collecting, analyzing, and interpreting the data; Brendan McAndrew and Changwoo Ahn wrote the paper.

Conflicts of Interest

The authors declare no conflict of interest.

References

  1. Fletcher, T.; Duncan, H.; Poelsma, P.; Lloyd, S. Stormwater Flow and Quality, and the Effectiveness of Non-Proprietary Stormwater Treatment Measures: A Review and Gap Analysis; Cooperative Research Centre for Catchment Hydrology: Clayton, Australia, 2004. [Google Scholar]
  2. Yang, G.; Bowling, L.C.; Cherkauer, K.A.; Pijanowski, B.C. The impact of urban development on hydrologic regime from catchment to basin scales. Landsc. Urban Plan. 2011, 103, 237–247. [Google Scholar] [CrossRef]
  3. Carey, R.O.; Hochmuth, G.J.; Martinez, C.J.; Boyer, T.H.; Dukes, M.D.; Toor, G.S.; Cisar, J.L. Evaluating nutrient impacts in urban watersheds: Challenges and research opportunities. Environ. Pollut. 2013, 173, 138–149. [Google Scholar] [CrossRef] [PubMed]
  4. U.S. Environmental Protection Agency. Preliminary Data Summary of Urban Storm Water Best Management Practices; EPA: Washington, DC, USA, 1999.
  5. Fletcher, T.D.; Andrieu, H.; Hamel, P. Understanding, management and modelling of urban hydrology and its consequences for receiving waters: A state of the art. Adv. Water Resour. 2013, 51, 261–279. [Google Scholar] [CrossRef]
  6. Collins, K.A.; Lawrence, T.J.; Stander, E.K.; Jontos, R.J.; Kaushal, S.S.; Newcomer, T.A.; Grimm, N.B.; Cole Ekberg, M.L. Opportunities and challenges for managing nitrogen in urban stormwater: A review and synthesis. Ecol. Eng. 2010, 36, 1507–1519. [Google Scholar] [CrossRef]
  7. Winston, R.J.; Hunt, W.F.; Kennedy, S.G.; Merriman, L.S.; Chandler, J.; Brown, D. Evaluation of floating treatment wetlands as retrofits to existing stormwater retention ponds. Ecol. Eng. 2013, 54, 254–265. [Google Scholar] [CrossRef]
  8. Fairfax County. Stormwater Management Pond Quick Reference Guide. Available online: http://www.fairfaxcounty.gov/dpwes/environmental/swm_quickref.htm (accessed on 22 May 2016).
  9. U.S. Environmental Protection Agency. Storm Water Technology Fact Sheet—Wet Detention Ponds; EPA: Washington, DC, USA, 1999.
  10. Borne, K.E.; Fassman, E.A.; Tanner, C.C. Floating treatment wetland retrofit to improve stormwater pond performance for suspended solids, copper and zinc. Ecol. Eng. 2013, 54, 173–182. [Google Scholar] [CrossRef]
  11. Hunt, W.F. Maintenance of Stormwater Wetlands and Wet Ponds; North Carolina Cooperative Extension Service: Raleigh, NC, USA, 2006; Available online: https://brunswick.ces.ncsu.edu/wp-content/uploads/2013/04/Wetland-and-Pond-Maintenance-2006.pdf (accessed on 2 June 2016).
  12. Rollins, S. Neighborhood Stormwater Pond Maintenance Log and Resources; Clemson University: Clemson, SC, USA, 2016; Available online: https://www.clemson.edu/extension/natural_resources/water/stormwater_ponds/resources/files/final_binder_pond_maintenance.pdf (accessed on 2 June 2016).
  13. EPA Program Overview: Total Maximum Daily Loads (TMDL). Available online: https://www.epa.gov/tmdl/program-overview-total-maximum-daily-loads-tmdl (accessed on 16 September 2016).
  14. Marimon, Z.A.; Xuan, Z.; Chang, N. System dynamics modeling with sensitivity analysis for floating treatment wetlands in a stormwater wet pond. Ecol. Model. 2013, 267, 66–79. [Google Scholar] [CrossRef]
  15. Mallin, M.A.; Ensign, S.H.; Wheeler, T.L.; Mayes, D.B. Pollutant Removal Efficacy of Three Wet Detention Ponds Michael. J. Environ. Qual. 2002, 31, 654–660. [Google Scholar] [CrossRef] [PubMed]
  16. VDEQ. Maintaining Your BMP: A Guidebook for Private Owners and Operators. 2000. Available online: http://www.deq.virginia.gov/Portals/0/DEQ/Water/Publications/BMPHandbook.pdf (accessed on 7 May 2016). [Google Scholar]
  17. Headley, T.R.; Tanner, C.C. Application of Floating Wetlands for Enhanced Stormwater Treatment: A Review; National Institute of Water & Atmospheric Research Ltd.: Hamilton, New Zealand, 2006. Available online: http://www.aucklandcity.govt.nz/council/documents/technicalpublications/TP324%20-%20Floating%20Wetland%20Review-Final.pdf (accessed on 16 May 2016).
  18. Sample, D.J.; Wang, C.-Y.; Fox, L.J. Innovative Best Management Fact Sheet No. 1: Floating Treatment Wetlands; Virginia Cooperative Extension: Blacksburg, VA, USA, 2013; Available online: https://pubs.ext.vt.edu/BSE/BSE-76/BSE-76-PDF.pdf (accessed on 4 April 2016).
  19. Wanielista, M.P.; Chang, N.-B.; Chopra, M.; Xuan, Z.; Islam, K.; Marimon, Z. Floating Wetland Systems for Nutrient Removal in Stormwater Ponds; Florida Department of Environmental Protection: Tallahassee, FL, USA, 2012; Available online: https://www.dep.state.fl.us/water/nonpoint/docs/nonpoint/final-report-ucf-fdot-beemats.pdf (accessed on 8 July 2016).
  20. Tanner, C.C.; Headley, T.R. Components of floating emergent macrophyte treatment wetlands influencing removal of stormwater pollutants. Ecol. Eng. 2011, 37, 474–486. [Google Scholar] [CrossRef]
  21. Kadlec, R.H.; Wallace, S. Treatment Wetlands, 2nd ed.; CRC Press: Boca Raton, FL, USA, 2009. [Google Scholar]
  22. Osem, Y.; Chen, Y.; Levinson, D.; Hadar, Y. The effects of plant roots on microbial community structure in aerated wastewater-treatment reactors. Ecol. Eng. 2007, 29, 133–142. [Google Scholar] [CrossRef]
  23. Borne, K.E.; Fassman-Beck, E.A.; Winston, R.J.; Hunt, W.F.; Tanner, C.C. Implementation and maintenance of floating treatment wetlands for urban stormwater management. J. Environ. Eng. 2015. [Google Scholar] [CrossRef]
  24. Headley, T.R.; Tanner, C.C. Constructed wetlands with floating emergent macrophytes: An innovative stormwater treatment technology. Crit. Rev. Environ. Sci. Technol. 2012, 42, 2261–2310. [Google Scholar] [CrossRef]
  25. Wang, C.Y.; Sample, D.J. Assessment of the nutrient removal effectiveness of floating treatment wetlands applied to urban retention ponds. J. Environ. Manag. 2014, 137, 23–35. [Google Scholar] [CrossRef] [PubMed]
  26. Wang, C.-Y.; Sample, D.J.; Bell, C. Vegetation effects on floating treatment wetland nutrient removal and harvesting strategies in urban stormwater ponds. Sci. Total Environ. 2014, 499, 384–393. [Google Scholar] [CrossRef] [PubMed]
  27. Marschner, H. Mineral Nutrition of Higher Plants; Academic Press: London, UK; San Diego, CA, USA, 1995. [Google Scholar]
  28. Williamson, L.C. Phosphate availability regulates root system architecture in Arabidopsis. Plant Physiol. 2001, 126, 875–882. [Google Scholar] [CrossRef] [PubMed]
  29. Meuleman, A.F.M.; Beekman, J.P.; Verhoeven, J.T.A. Nutrient retention and nutrient-use efficiency in Phragmites australis stands after wasterwater application. Wetlands 2002, 22, 712–721. [Google Scholar] [CrossRef]
  30. Ahn, C. A creative collaboration between the science of ecosystem restoration and art for sustainable stormwater management on an urban college campus. Restor. Ecol. 2016, 24, 291–297. [Google Scholar] [CrossRef]
  31. George Mason University (GMU). MS4 Annual Report; George Mason University: Fairfax, VA, USA, 2015. [Google Scholar]
  32. George Mason University. Mason SWMP Draft 2013; George Mason University: Fairfax, VA, USA, 2013. [Google Scholar]
  33. National Oceanic and Atmospheric Administration (NOAA). Climate Data Inventories; Vienna Station: Fairfax, VA, USA, 2016.
  34. George Mason University. MS4 TMDL Action Plan; George Mason University: Fairfax, VA, USA, 2015. [Google Scholar]
  35. Floating Islands International, Inc. BioHaven® Technology. Available online: http://www.floatingislandinternational.com/products/biohaven-technology/ (accessed on 23 September 2016).
  36. BeeMats, LLC. BeeMats: Floating Wetlands. Available online: http://beemats.com/home.html (accessed on 23 September 2016).
  37. De Stefani, G.; Tocchetto, D.; Salvato, M.; Borin, M. Performance of a floating treatment wetland for in-stream water amelioration in NE Italy. Hydrobiologia 2011, 674, 157–167. [Google Scholar] [CrossRef]
  38. Wang, C.-Y.; Sample, D.J. Assessing floating treatment wetlands nutrient removal performance through a first order kinetics model and statistical inference. Ecol. Eng. 2013, 61, 292–302. [Google Scholar] [CrossRef]
  39. Henry, J.H.; Henry, E.T. Plant Root Pruning Container 2007. Available online: https://www.google.com/patents/US7210266 (accessed on 23 September 2016).
  40. NBC 4 Washington. Students Say Pond Class at GMU Really Floats Their Boats. Available online: http://www.nbcwashington.com/news/local/304771321.html (accessed on 25 May 2015).
  41. Tanner, C.C. Plants for constructed wetland treatment systems—A comparison of the growth and nutrient uptake of eight emergent species. Ecol. Eng. 1996, 7, 59–83. [Google Scholar] [CrossRef]
  42. Means, M.M.; Ahn, C.; Korol, A.R.; Williams, L.D. Carbon storage potential by four macrophytes as affected by planting diversity in a created wetland. J. Environ. Manag. 2016, 165, 133–139. [Google Scholar] [CrossRef] [PubMed]
  43. Lynch, J.; Fox, L.J.; Owen, J.S.; Sample, D.J. Evaluation of commercial floating treatment wetland technologies for nutrient remediation of stormwater. Ecol. Eng. 2015, 75, 61–69. [Google Scholar] [CrossRef]
  44. Wang, C.-Y.; Sample, D.J.; Day, S.D.; Grizzard, T.J. Floating treatment wetland nutrient removal through vegetation harvest and observations from a field study. Ecol. Eng. 2015, 78, 15–26. [Google Scholar] [CrossRef]
  45. Lorenzen, B.; Brix, H.; Mendelssohn, I.A.; McKee, K.L.; Miao, S.L. Growth, biomass allocation and nutrient use efficiency in Cladium jamaicense and Typha domingensis as affected by phosphorus and oxygen availability. Aquat. Bot. 2001, 70, 117–133. [Google Scholar] [CrossRef]
  46. Lenhart, H.A.; Hunt, W.F.; Burchell, M.R. Harvestable nitrogen accumulation for five storm water wetland plant species: Trigger for storm water control measure maintenance? J. Environ. Eng. 2012, 138, 972–978. [Google Scholar] [CrossRef]
  47. Borne, K.E.; Tanner, C.C.; Fassman-Beck, E.A. Stormwater nitrogen removal performance of a floating treatment wetland. Water Sci. Technol. 2013, 68, 1657–1664. [Google Scholar] [CrossRef] [PubMed]
Figure 1. (a) Top view of the floating treatment wetland (FTW) system deployed on Mason Pond showing cup spacing and waterfowl fence; (b) side view of Beemat FTW illustrating plant cup system (image courtesy of Beemats LLC: www.beemats.com).
Sustainability 08 00972 g001
Figure 2. Initial and final mean biomass per plant for (a) whole plant; (b) shoots; and (c) roots of plants deployed on the Mason Pond floating treatment wetland. Error bars represent standard error and asterisks represent significant difference between initial and final biomass (p < 0.05).
Sustainability 08 00972 g002
Figure 3. Initial and final mean nitrogen content as percent of dry matter per plant for (a) shoots and (b) roots for plants deployed on the Mason Pond floating treatment wetland. Error bars represent standard error while asterisks represent significant difference between initial and final nitrogen concentration (p < 0.05).
Sustainability 08 00972 g003
Figure 4. Summary of FTW performance in biomass production, nitrogen uptake, and sediment capture. Nitrogen uptake and removal rates were calculated based on the surface area of the floating mat (50 m2) and its deployment period of 137 growing season days. Inset: map of Mason Pond showing FTW location on the pond.
Sustainability 08 00972 g004
Table 1. Mason Pond water quality and hydrologic characteristics during the study period. Physicochemical parameters are reported as mean ± standard deviation.
ParameterValue
Area (m2)~7100
Volume (m3)~7810
Mean Depth (m)1.10
Mean Water Temperature (°C)29.0 ± 2.7
Mean pH7.51 ± 0.80
Mean Dissolved Oxygen (mg/L)9.71 ± 2.05
Mean TSS (mg/L)21.8 ± 10.5
Table 2. Planting regime for Mason Pond floating treatment wetland showing the number of individuals of each species that were planted on the FTW.
Plant SpeciesAlismaCarexIrisJuncusPontederia
# of individuals planted200350170500290
Table 3. Post-deployment above- and below-mat biomass (g) and nitrogen content (mg) per plant (Mean ± Standard Error) with ratio between above- and below-mat biomass (A:B). Nitrogen mass per plant estimated by multiplying mean dry biomass with nitrogen content as percent of dry matter. Biomass ratio calculated by dividing above-mat biomass by below-mat biomass. Biomass was compared with a two sample T-test to check for difference in above- and below-mat growth; an asterisk (*) symbolizes significant difference at p = 0.05.
Below-MatAbove-MatA:B
Plant SpeciesBiomass (g)Nitrogen (mg)Biomass (g)Nitrogen (mg)Biomass Ratio
Alisma subcordatum0.82 ± 0.1918.89 ± 2.150.47 ± 0.1212.18 ± 0.130.57
Carex stricta2.82 ± 0.38 *52.62 ± 0.251.49 ± 0.13 *25.79 ± 0.470.52
Iris versicolor1.77 ± 0.2425.42 ± 2.620.93 ± 0.1418.23 ± 2.640.52
Juncus effusus2.25 ± 0.3534.85 ± 1.212.22 ± 0.4130.44 ± 1.890.99
Pontederia cordata0.69 ± 0.1914.36 ± 2.251.55 ± 0.3131.26 ± 3.572.24
Table 4. Summary of biomass, sediment, and nitrogen mass captured by the FTW. Nitrogen mass is separated by biological (i.e., plant growth) and physical processes (i.e., sediment accumulation on the plant roots and underside of the mat). Sediment was washed from the roots and plant cup simultaneously and is referred to here as “per plant-cup”. All calculations were based on surface area of the floating mat (50 m2) and its deployment period of 137 growing season days. The number of individuals planted per species can be found in Table 2.
FTW Component
Plant SpeciesMat
AlismaCarexIrisJuncusPontederia Total
Biomass (g)
per plant0.423.292.51−0.79 *2.02
FTW Total84.171151.79425.94−392.80 *584.782684.16
Nitrogen—Plant Biomass (g)
per plant0.0140.0680.0420.0320.041
FTW total3.0324.776.8219.1112.0665.80
Sediment (g)
per plant-cup0.891.441.161.211.04
FTW Total178.98503.40196.75606.06301.961312.973100.12
Nitrogen—Sediment (g)
per plant-cup0.030.040.040.030.04
FTW Total6.7914.007.2815.5510.4871.47125.57
* Apparent loss of Juncus biomass was likely due to inaccuracy of initial root mass measurements. See Section 3.2 for more information.

