1. Introduction
After the 2002 FIFA World Cup held in South Korea and Japan, the South Korean government owned 10 new stadiums. These stadiums have been operated by the relevant local governments. These local governments have full responsibility for the operation, management, and maintenance of the stadiums. The current operating situations of the stadiums regarding profits differ widely, depending on their locations. More than half of the stadiums have recorded chronic payment deficits. Therefore, the local governments involved have used significant amounts of their budgets in maintaining these stadiums.
Table 1 shows the current economic situations of the stadiums.
For example, Daegu World Cup Stadium recorded an accumulated deficit of about four million USD in 2014. In order to cope with this deficit, the local government of Daegu Metropolitan City invited private capital to invest in building the “Color Square Zone”, which was a cultural shopping center. However, the center failed to operate successfully, due to several problems including issues with allocating stores and attracting duty-free shops.
Although in 2006 the local government of Seogwipo City successfully invited one of the country’s professional soccer clubs, Jeju United FC, to base itself at Jeju World Cup Stadium (JWCS), this stadium still brings financial charges to its local government. From 2012 to 2014, JWCS recorded a deficit of about two million USD.
Moreover, the conservation and maintenance costs of the stadiums can be expected to increase, because it has been 13 years since they were built. Therefore, the local governments have attempted to implement various remedies to minimize the deficits arising from these stadiums. For example, the local government of Seogwipo City plans to commission the management of JWCS to the SK Group, which owns Jeju United FC under the naming rights of the stadium. Hosting international soccer competitions, attracting soccer teams for their off-season training, and operating a public market have been suggested as short-term innovations. From a long-term perspective, operating communities for sports activities, installing sightseeing facilities, and creating sports-shopping centers are proposed.
Along with these suggestions, significant efforts to minimize the operational costs of JWCS are proposed. The local government of Seogwipo City plans to create renewable energy facilities for JWCS by utilizing the excellent renewable energy resources of Jeju Island.
This study therefore aims to explore an independent renewable electricity generation system for JWCS by analyzing its current electricity consumption. Using the hybrid optimization of multiple energy resources (HOMER) software, potential optimal configurations of renewable energy facilities for JWCS are proposed. The rest of this study is organized as follows.
Section 2 presents the status of JWCS. Key economic parameters and detailed economic input data for the simulation are given in
Section 3 and
Section 4, respectively. The optimal configurations of renewable electricity generation systems for JWCS are presented in
Section 5. Some discussion points including the shortcomings of the current study are described in
Section 6.
Cases of Hybrid Renewable Energy Systems for Particular Areas
There are several prior studies which have investigated the economic feasibility of hybrid renewable electricity systems for particular areas. Sen and Bhattacharyya [
4] proposed hybrid renewable energy systems for Palari, one of the villages in India. The proposed systems which were mainly organized by PV arrays, wind turbines and battery units achieved a 90% renewable fraction with $0.420 per kWh of cost of energy (COE). Moreover, Harish Kumar [
5] aimed to meet the energy demand of the Geelong area, one of the residential villages in Australia. Based on the results of the simulations generated by HOMER, the systems which mainly included PV arrays and battery units showed $0.283 of per kWh of COE with a 100% renewable fraction.
In South Korea, Park and Kwon [
6] used scenario-oriented simulations for presenting optimal configurations of renewable electricity generation systems for one of the large educational institutes. Based on the simulation results of five on-grid and five off-grid scenarios, the proposed configurations achieved $0.509 per kWh of COE with a 100% renewable fraction.
In general, the optimal configurations of hybrid renewable energy systems for responding to the energy demand of isolated areas or multiple complexes in the Asia region showed $0.181~$1.284 per kWh of COE when the renewable fraction of the configurations was greater than 90% [
6].
Table 2 presents the representative results of previous studies conducted in Korea. As presented in
Table 2, the majority of the previous studies have introduced hybrid renewable energy systems for isolated areas such as islands or multiple complexes.
2. Jeju World Cup Stadium
2.1. Location and Facilities
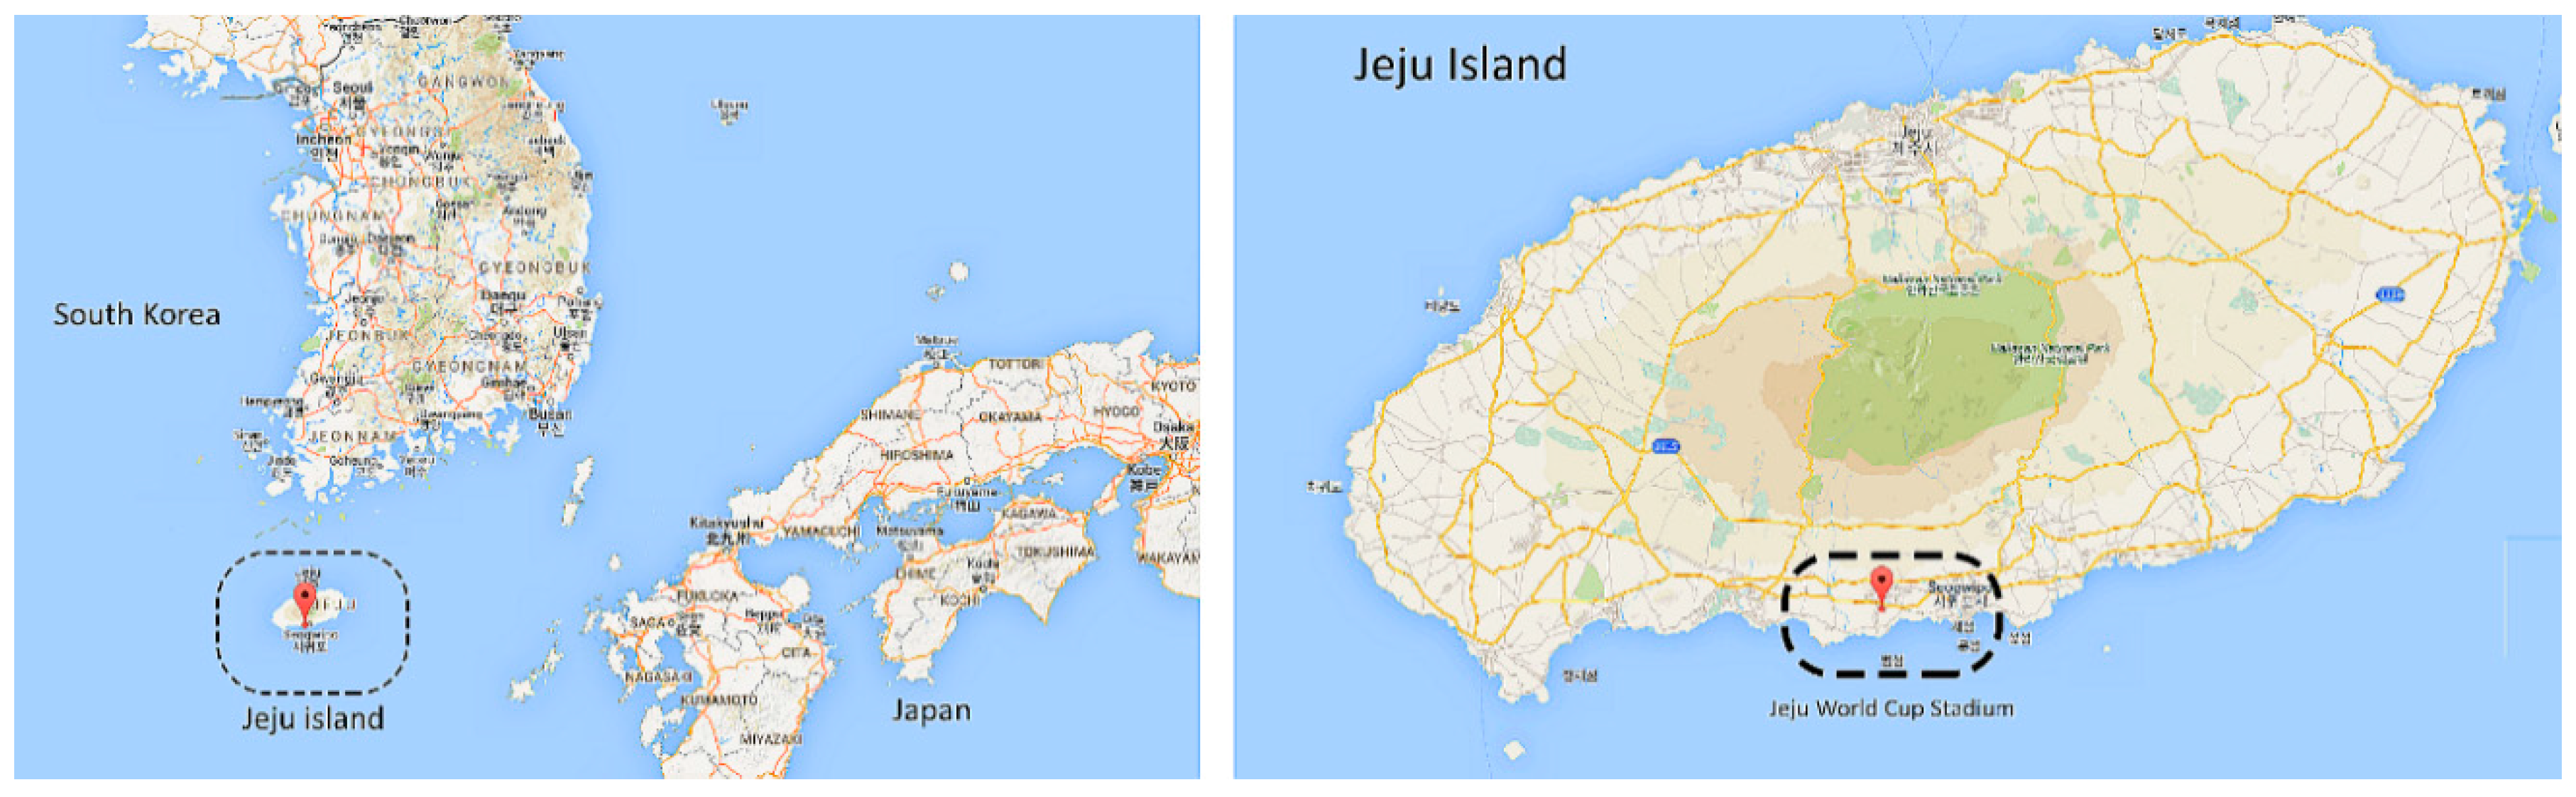
JWCS is located in the southern part of Seogwipo City, Republic of Korea. This means that this stadium is located in the most southern region of Korea [
16]. The coordinates of JWCS are 33°14′ latitude and 126°30′ longitude (
Figure 1). JWCS has a total area of 134,122 m
2, with 22,188 m
2 of buildings and a total floor area of 75,957 m
2 across two basement and four ground levels. Initially, 42,778 seats were installed in JWCS; after the FIFA World Cup in 2002, more than 7000 seats were moved to its secondary stadium, Gangchanghak Practice Stadium. Therefore, JWCS currently has 35,657 seats.
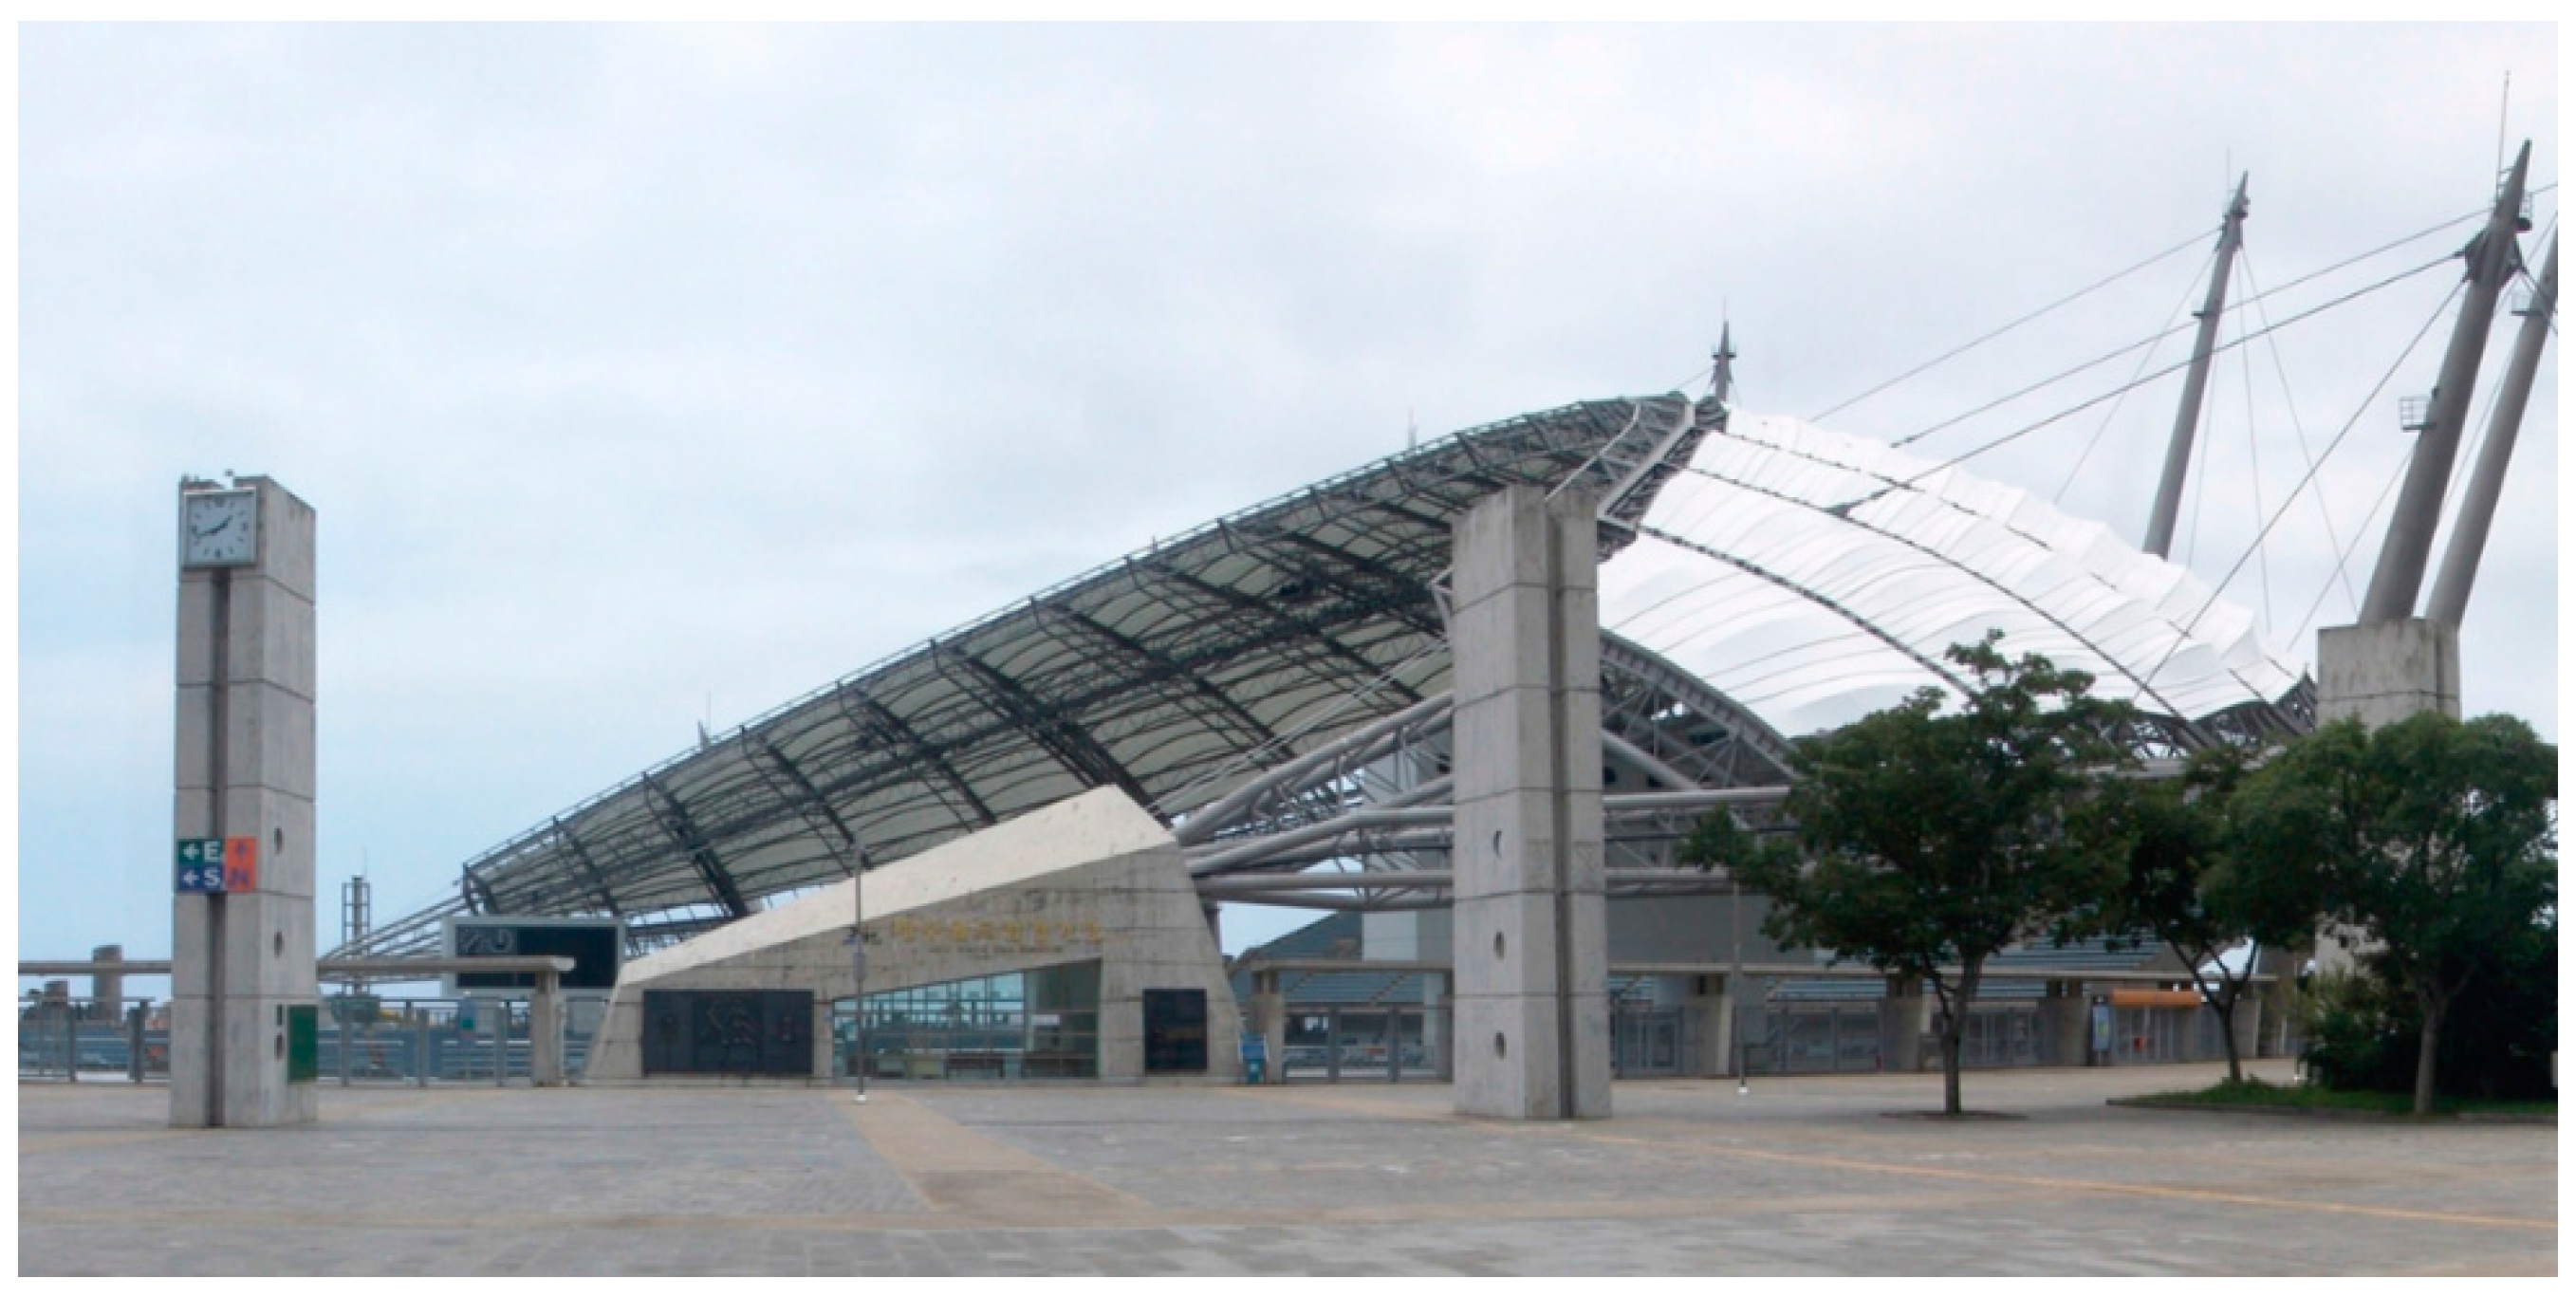
The design of JWCS originated in the shape of the crater in Hallasan, one of the shield dormant volcanoes on Jeju Island. The design of JWCS’s roof mainly depicts images of fishing nets and “Taewoo”, which is the formation of traditional ships in Jeju (
Figure 2).
Since the location of JWCS is close to the southern coast of South Korea and the stadium needs to be built to withstand strong winds from the sea, the roof of JWCS has a multiple suspension structure with cable trusses. With this structure, the roof can endure winds of greater than 65 m/s [
17]. Moreover, in order to minimize wind effects, the playing pitch of JWCS is built about 14 m below ground level. The lighting capacity of JWCS is more than 2000 lux.
Given the top world-class structure of JWCS, Jeju United FC—one of the participants in the K-League Classic, which is the premier professional soccer league in South Korea—has used JWCS as its home ground since 2006 [
18].
2.2. Load Information
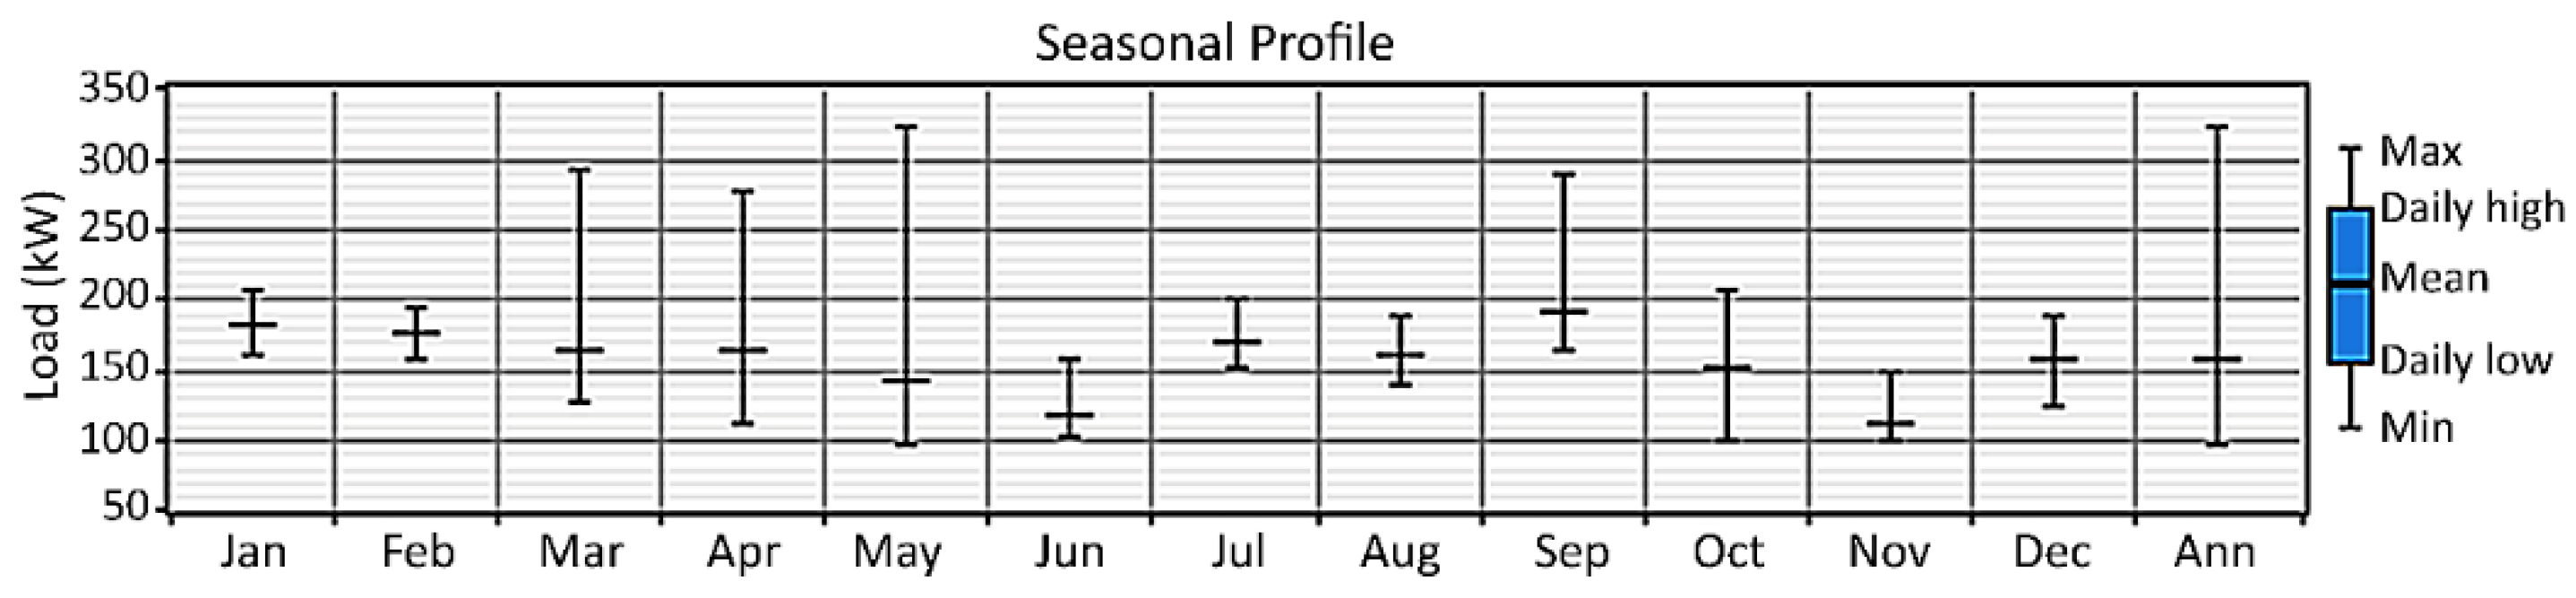
The energy system of JWCS is currently maintained and operated by the electricity grid that comprises the island’s energy system. The total amount of electricity used by JWCS was calculated as 1.617 GWh in 2014. The average and peak energy demand amounts of the stadium are 157 kW and 321 kW, respectively. Therefore, the load factor of the stadium is 0.489.
Figure 3 shows the seasonal profile of the electricity demand of the stadium.
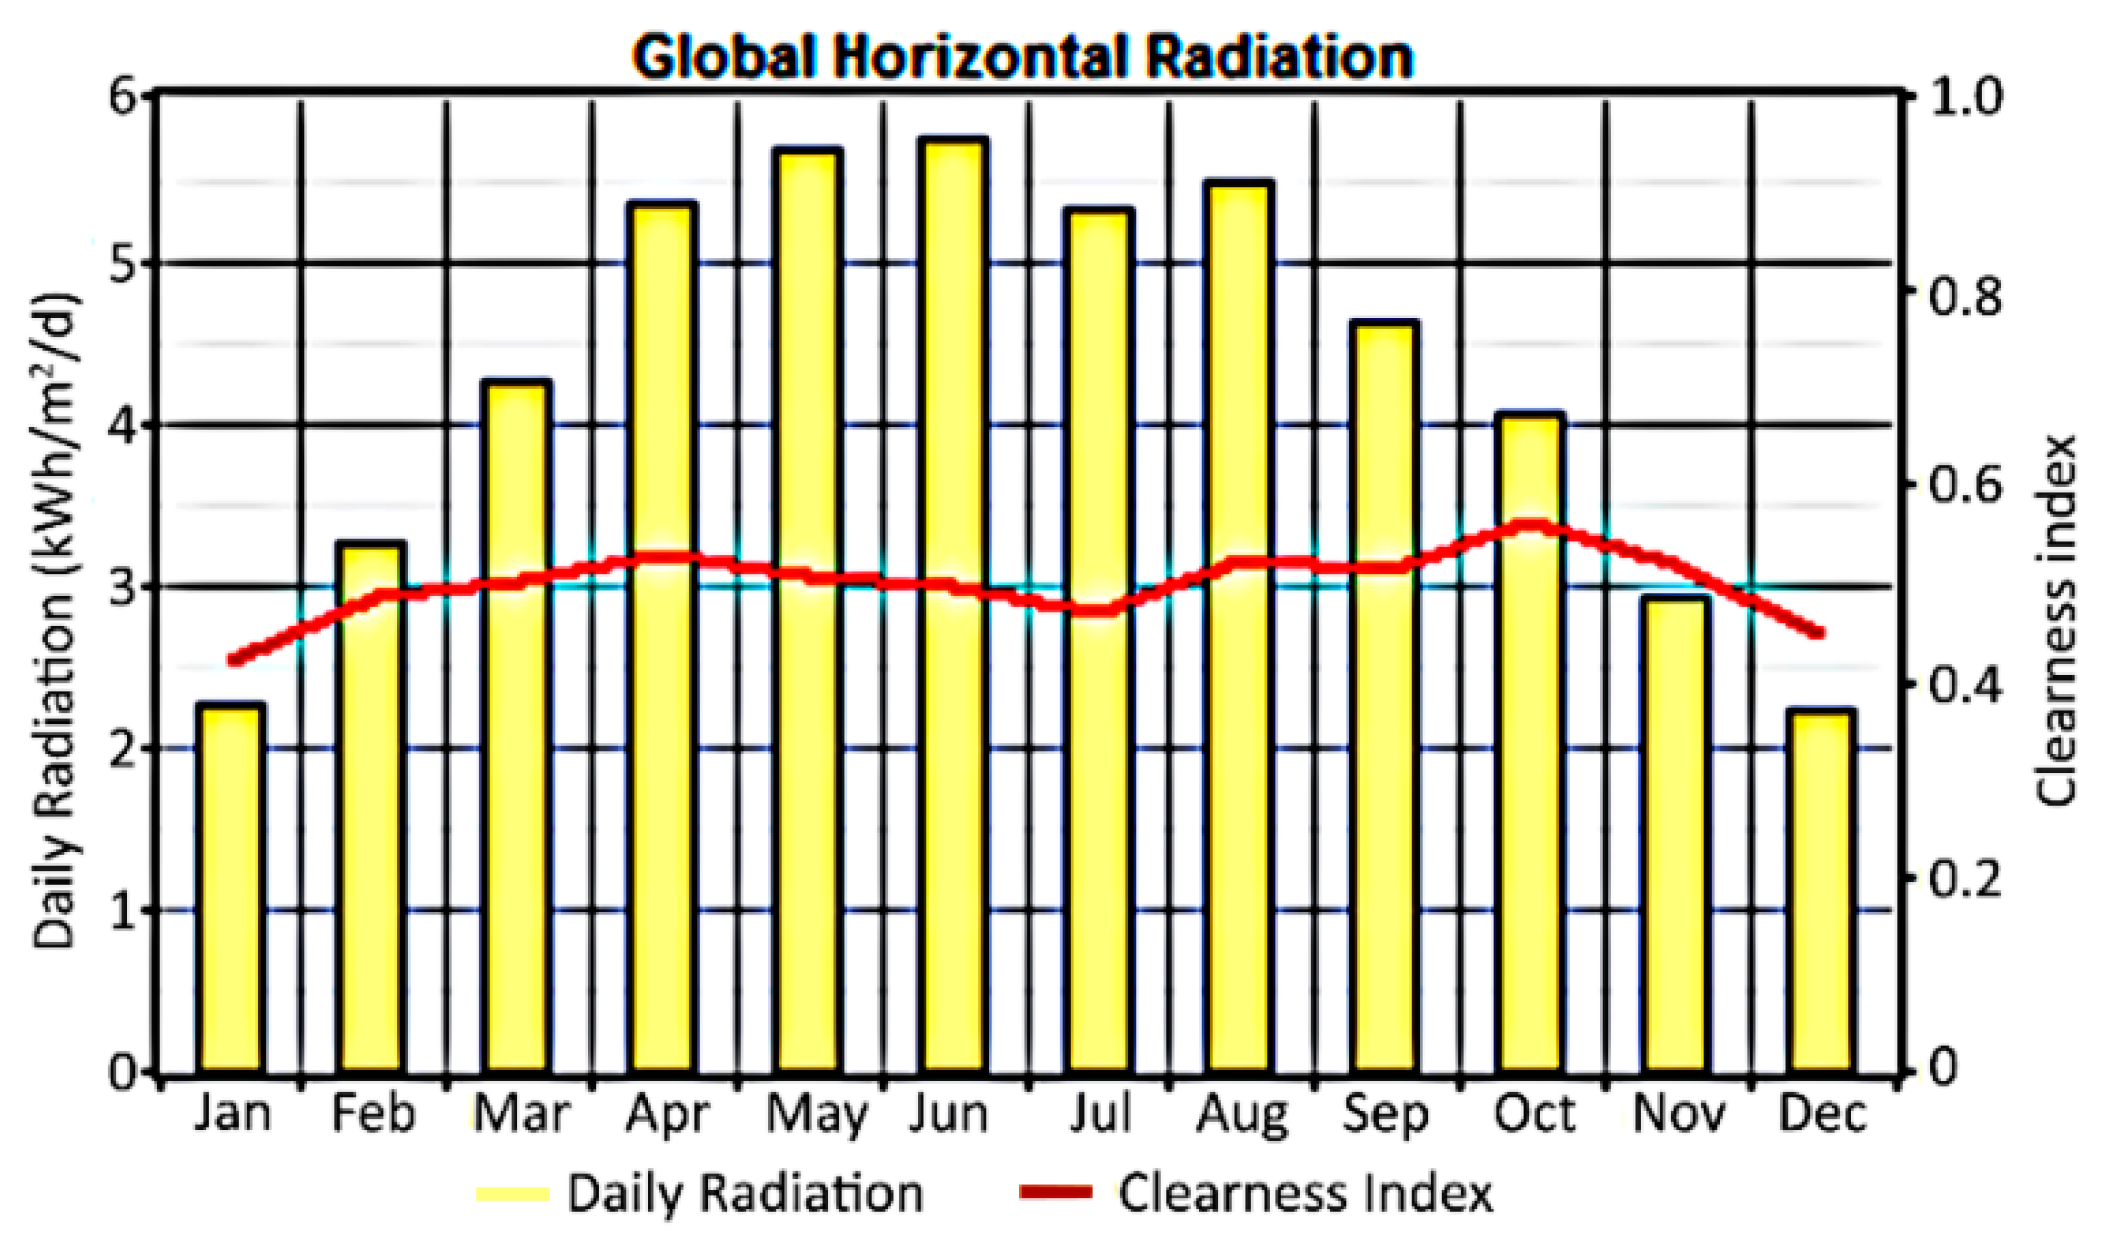
2.3. Solar Energy Information
This study uses data from the National Aeronautics and Space Administration. The annual solar clearness index and average daily radiation are calculated as 0.503 and 4.165 kWh/m
2/day, respectively. The profile of the average monthly solar resource is presented in
Figure 4.
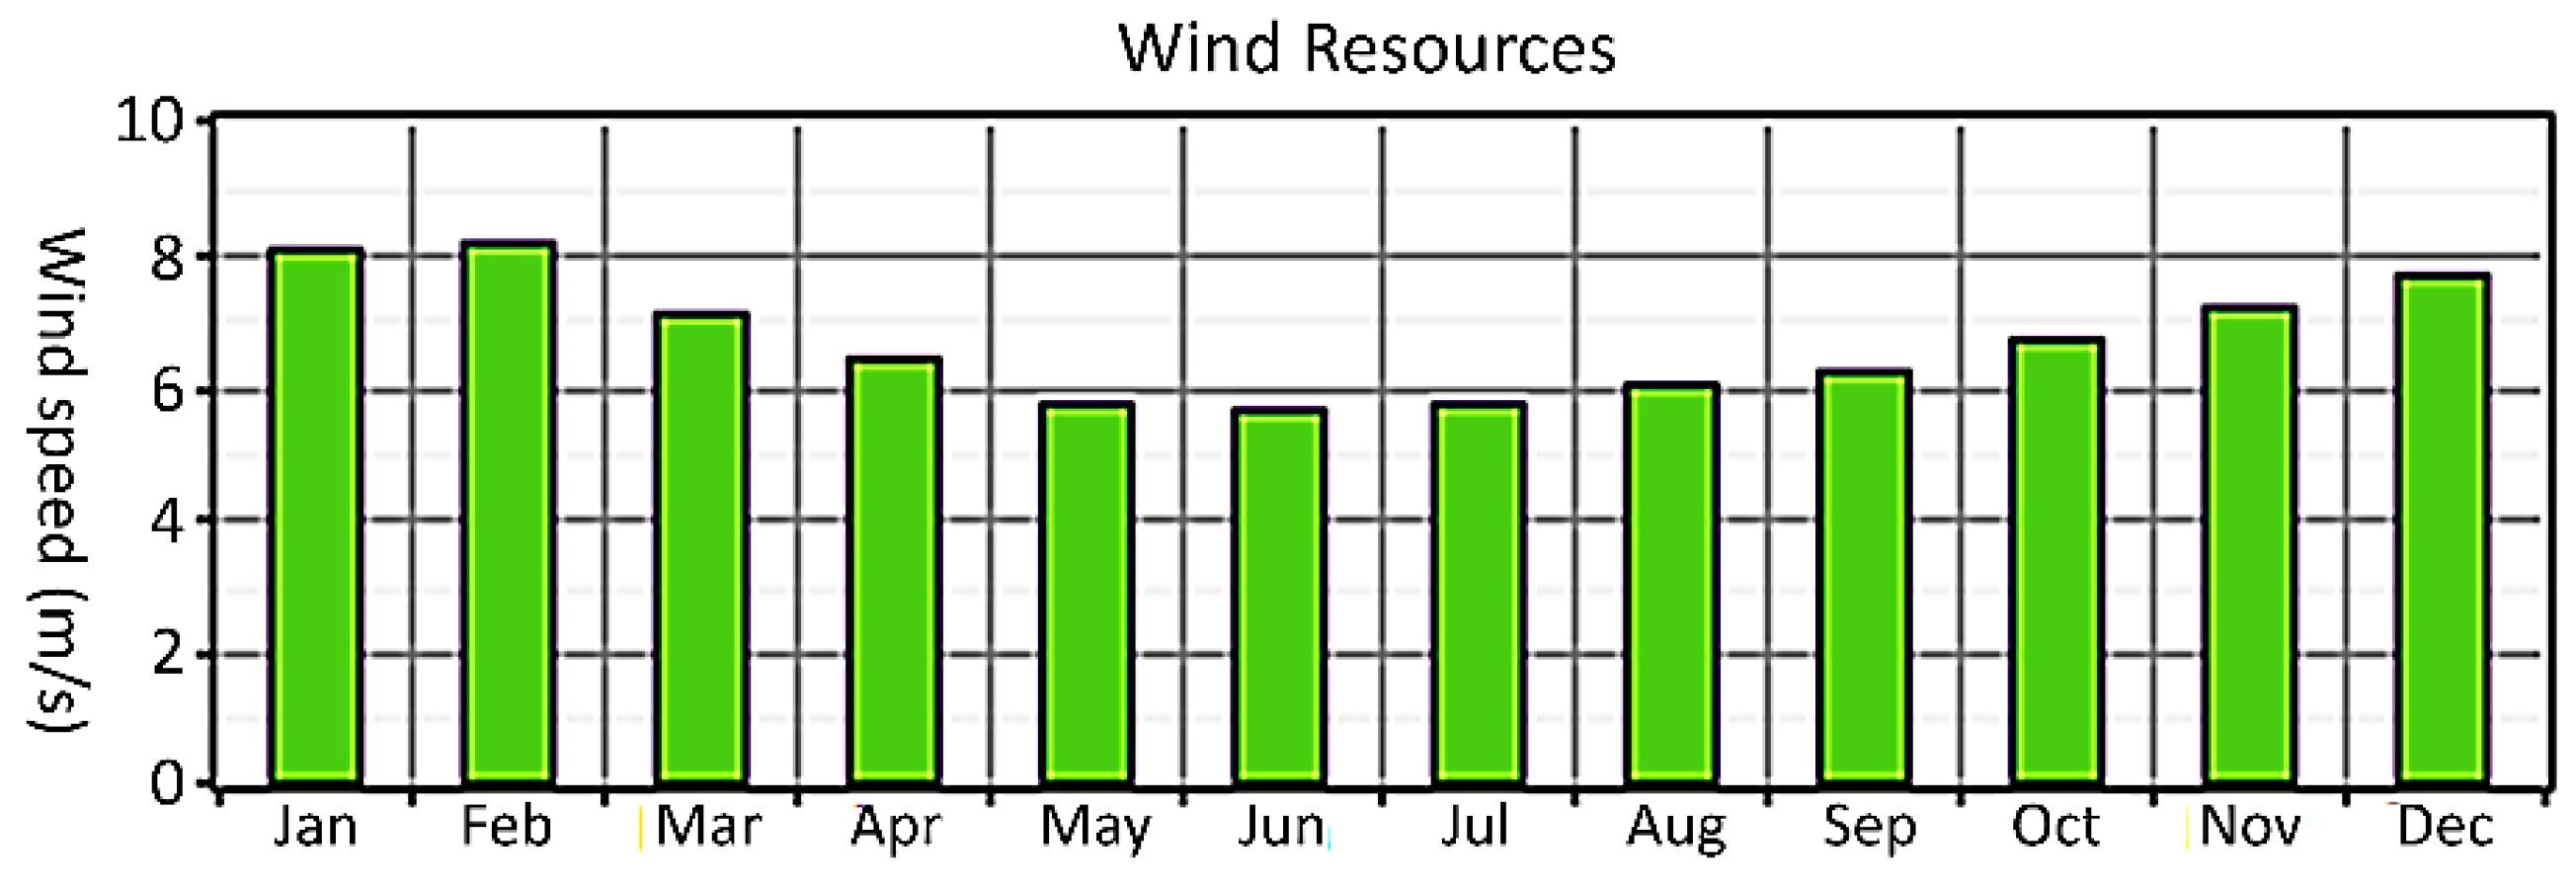
2.4. Wind Energy Information
The details of JWCS’s wind speed data are provided by the National Aeronautics and Space Administration and the Korea Meteorological Administration (KMA). Since the operational height of the wind turbines currently in use is 25 m above the ground, the data used are the averages of the wind speeds at 50 m and ground level. The annual average wind speed is calculated as 6.701 m/s, while
Figure 5 shows the monthly wind speed profile of JWCS.
3. Key Parameters for the Simulation
3.1. Annual Real Interest Rate
In order to calculate more accurate economic outputs, the real annual interest rate was computed using the mathematical methods introduced by Dursun [
19]. The basic information for the parameters is provided by the Bank of Korea. From this, the annual real interest rate used for the simulation is 3.018%.
3.2. COE and NPC
The average cost of producing 1 kWh from a particular electricity generation system is defined as the COE. The COE is the first optimization criterion for the simulation. The net present cost (NPC) is the total cost incurred by the system, including the installation costs of its components and maintenance and management costs. If two optimal suggestions show the same COE levels, the NPC is used as the second optimization criterion for the simulation [
7]. The estimated lifetime is 25 years, while all calculation steps of the simulation follow the guidelines of Dursun [
19].
4. Renewable Electricity Generation Systems
The goal of this study is to identify the optimal renewable electricity generation system for JWCS by comparing renewable energy resources. For the analysis, photovoltaic (PV) arrays, wind turbines, a converter, and batteries are considered. In order to examine the economic feasibility of a given system, initial (installation and replacement) and O&M (operation and management) costs of each component must be entered into the HOMER software. The installation, replacement, and O&M costs of PV arrays per kW are $1800, $1800, and $25 per year, respectively. The current study assumes a PV array lifetime of 20 years with no tracking system. This study considers capacities of 0 kW to 15,000 kW in 5 kW steps [
4,
6,
7,
19].
A 10-kW-capacity generic turbine model is considered for the use of wind energy. The installation, replacement, and O&M costs for two wind turbines are $29,000, $25,000 and $400 per year, respectively. A 15-year lifetime and 25 m turbine heights are used in the simulation. This study considers the use of 0 to 2400 wind turbines in steps of two turbines in the simulation [
4,
6,
7,
19].
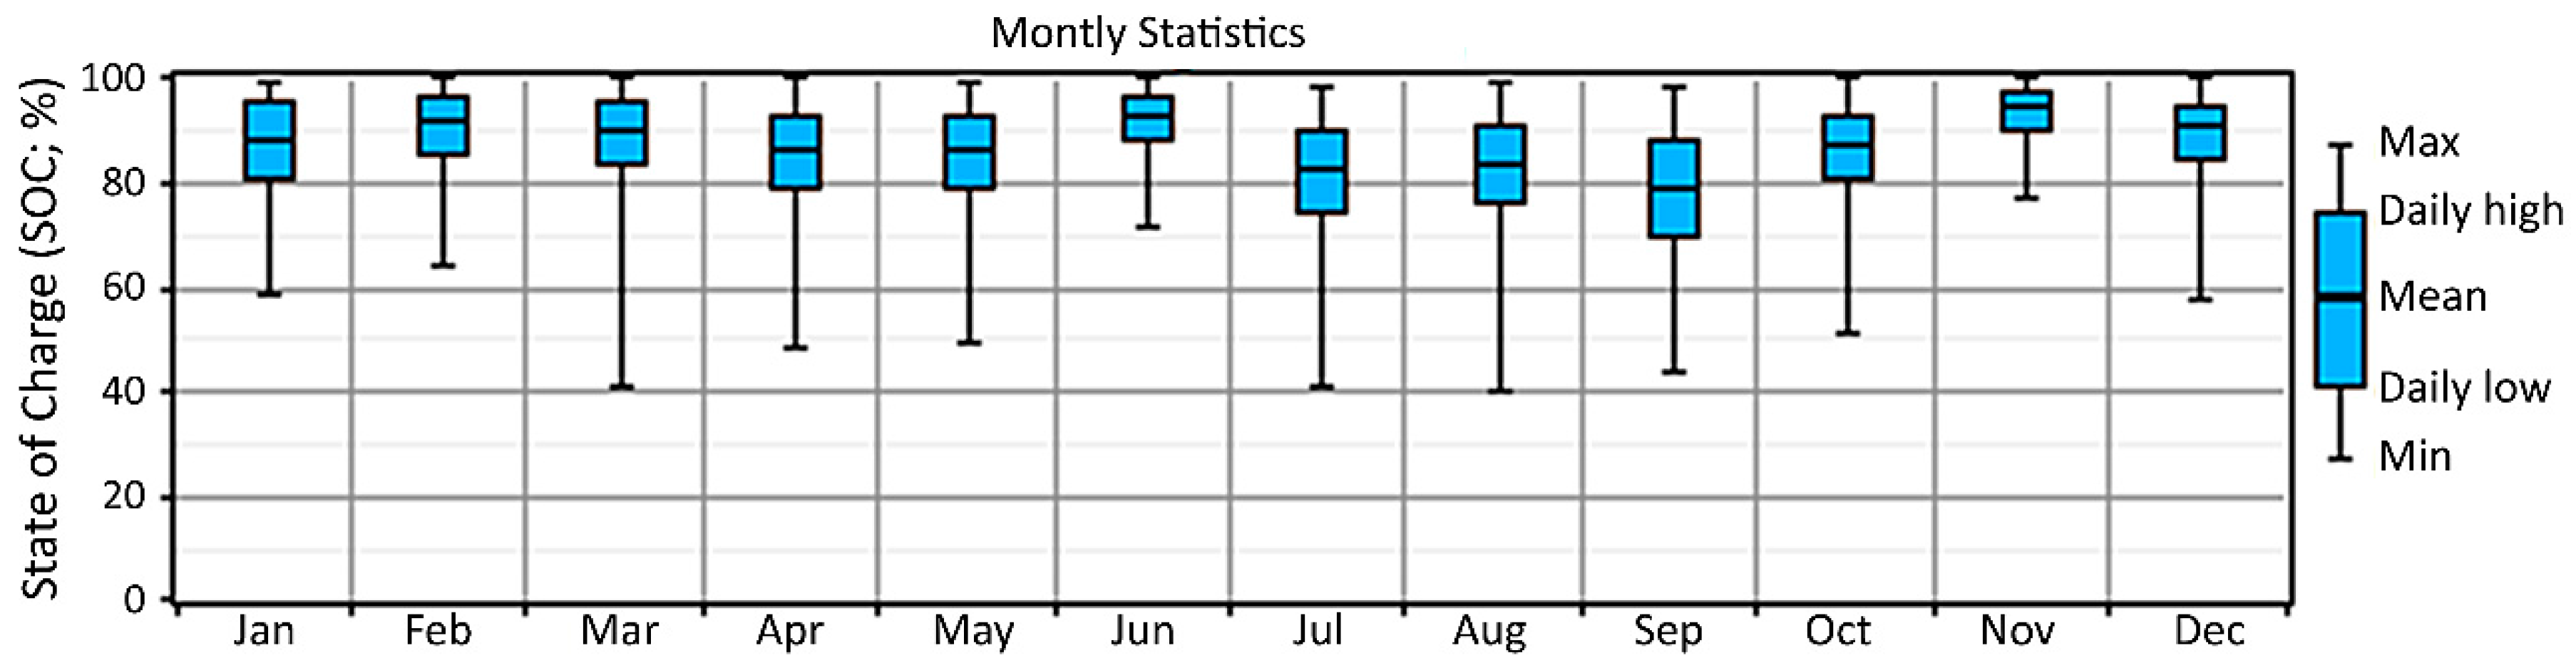
In suggesting an independent renewable electricity generation system, batteries are an essential component. The Surretts-6CS25P model battery, with a nominal voltage of 6 V, a nominal capacity of 1156 Ah, an 80% round-trip efficiency, a minimum charge state of 40%, and a lifetime throughput of 9645 kWh, is considered. The O&M, installation, and replacement costs of each battery are $10, $1229, and $1229 per year, respectively. This study considers 0 to 15,000 units in steps of 10 units. In order to provide connections between AC and DC components, a converter is used. The O&M, installation, and replacement costs per kW are $10 per year, $800, and $800, respectively. A converter has an estimated lifetime of 15 years, 90% inverter efficiency, 100% rectifier capacity relative to the inverter, and 85% rectifier efficiency. This study considers 0 to 3000 kW as converter capacity in steps of 5 kW.
5. Results
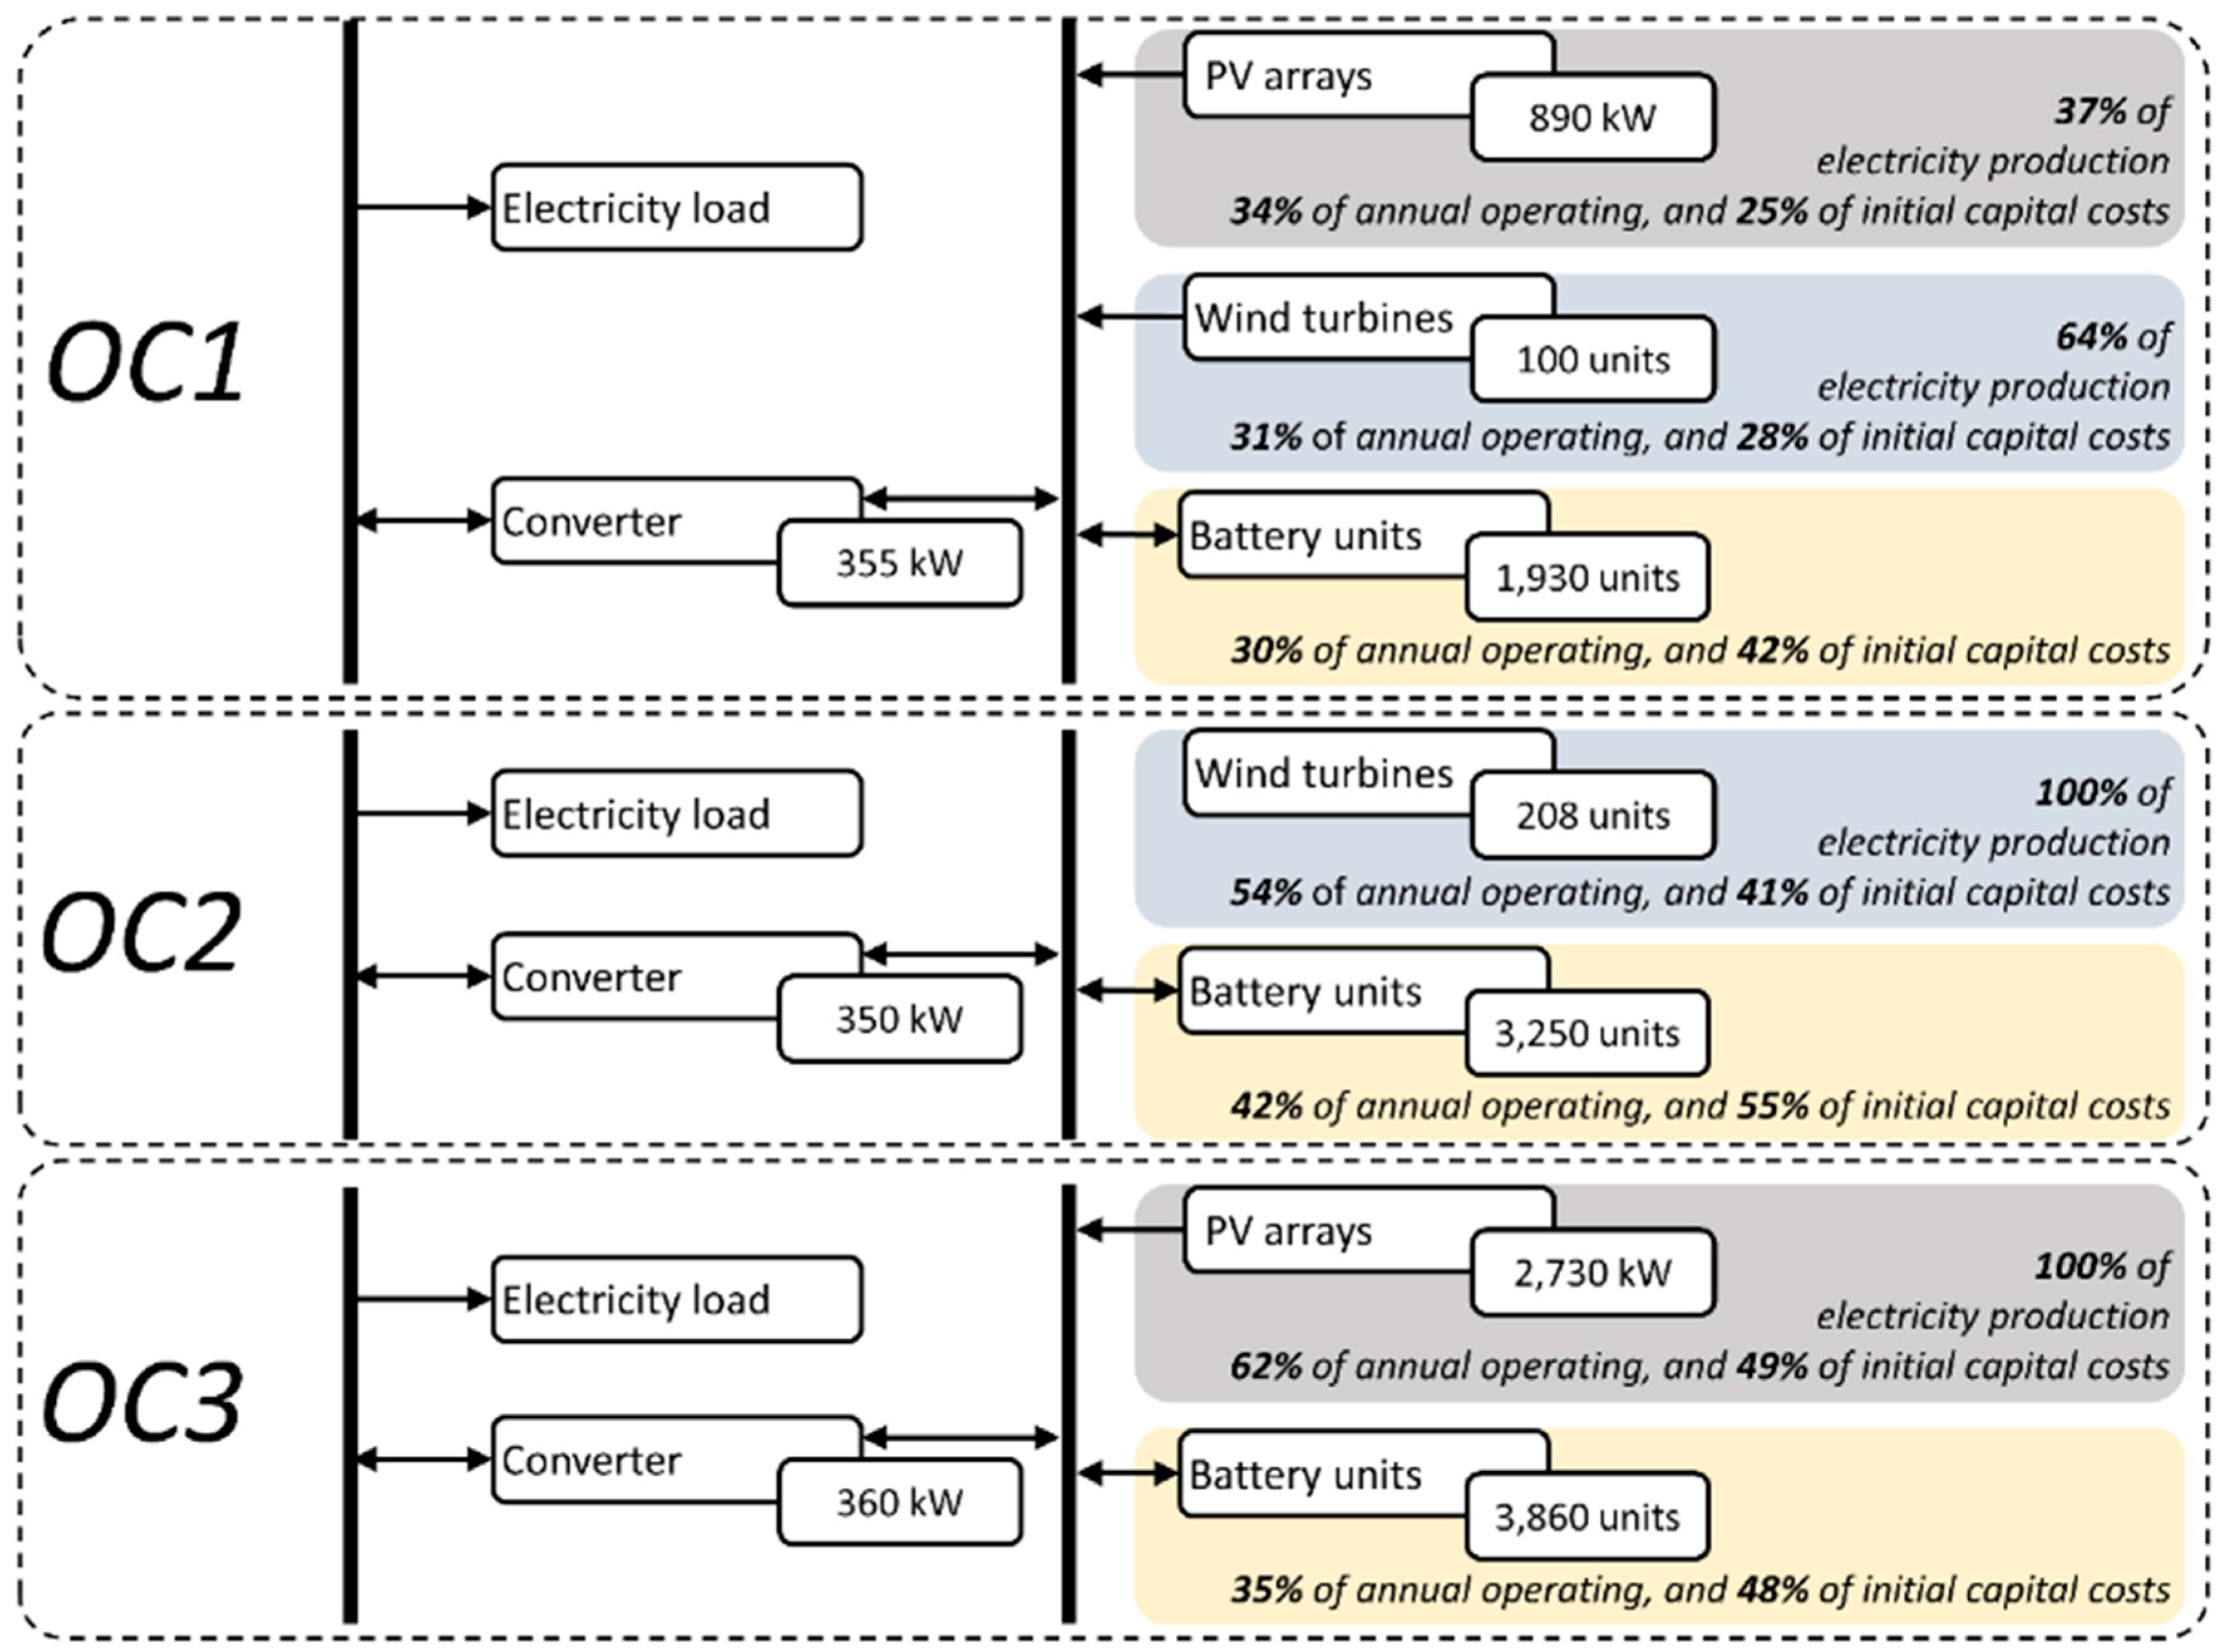
This study suggests three optimal simulated configurations: wind turbines–PV arrays–batteries-converter, wind turbines–batteries-converter, and PV arrays–batteries-converter.
Figure 6 and
Table 3 present the optimal configurations (OCs).
Figure 7 shows the cost summary of the OCs.
Table 4 shows the estimated annualized costs of each configuration.
Table 5 presents the annual electricity-related parameters of the system, while
Table 6 shows detailed information on each component in the system.
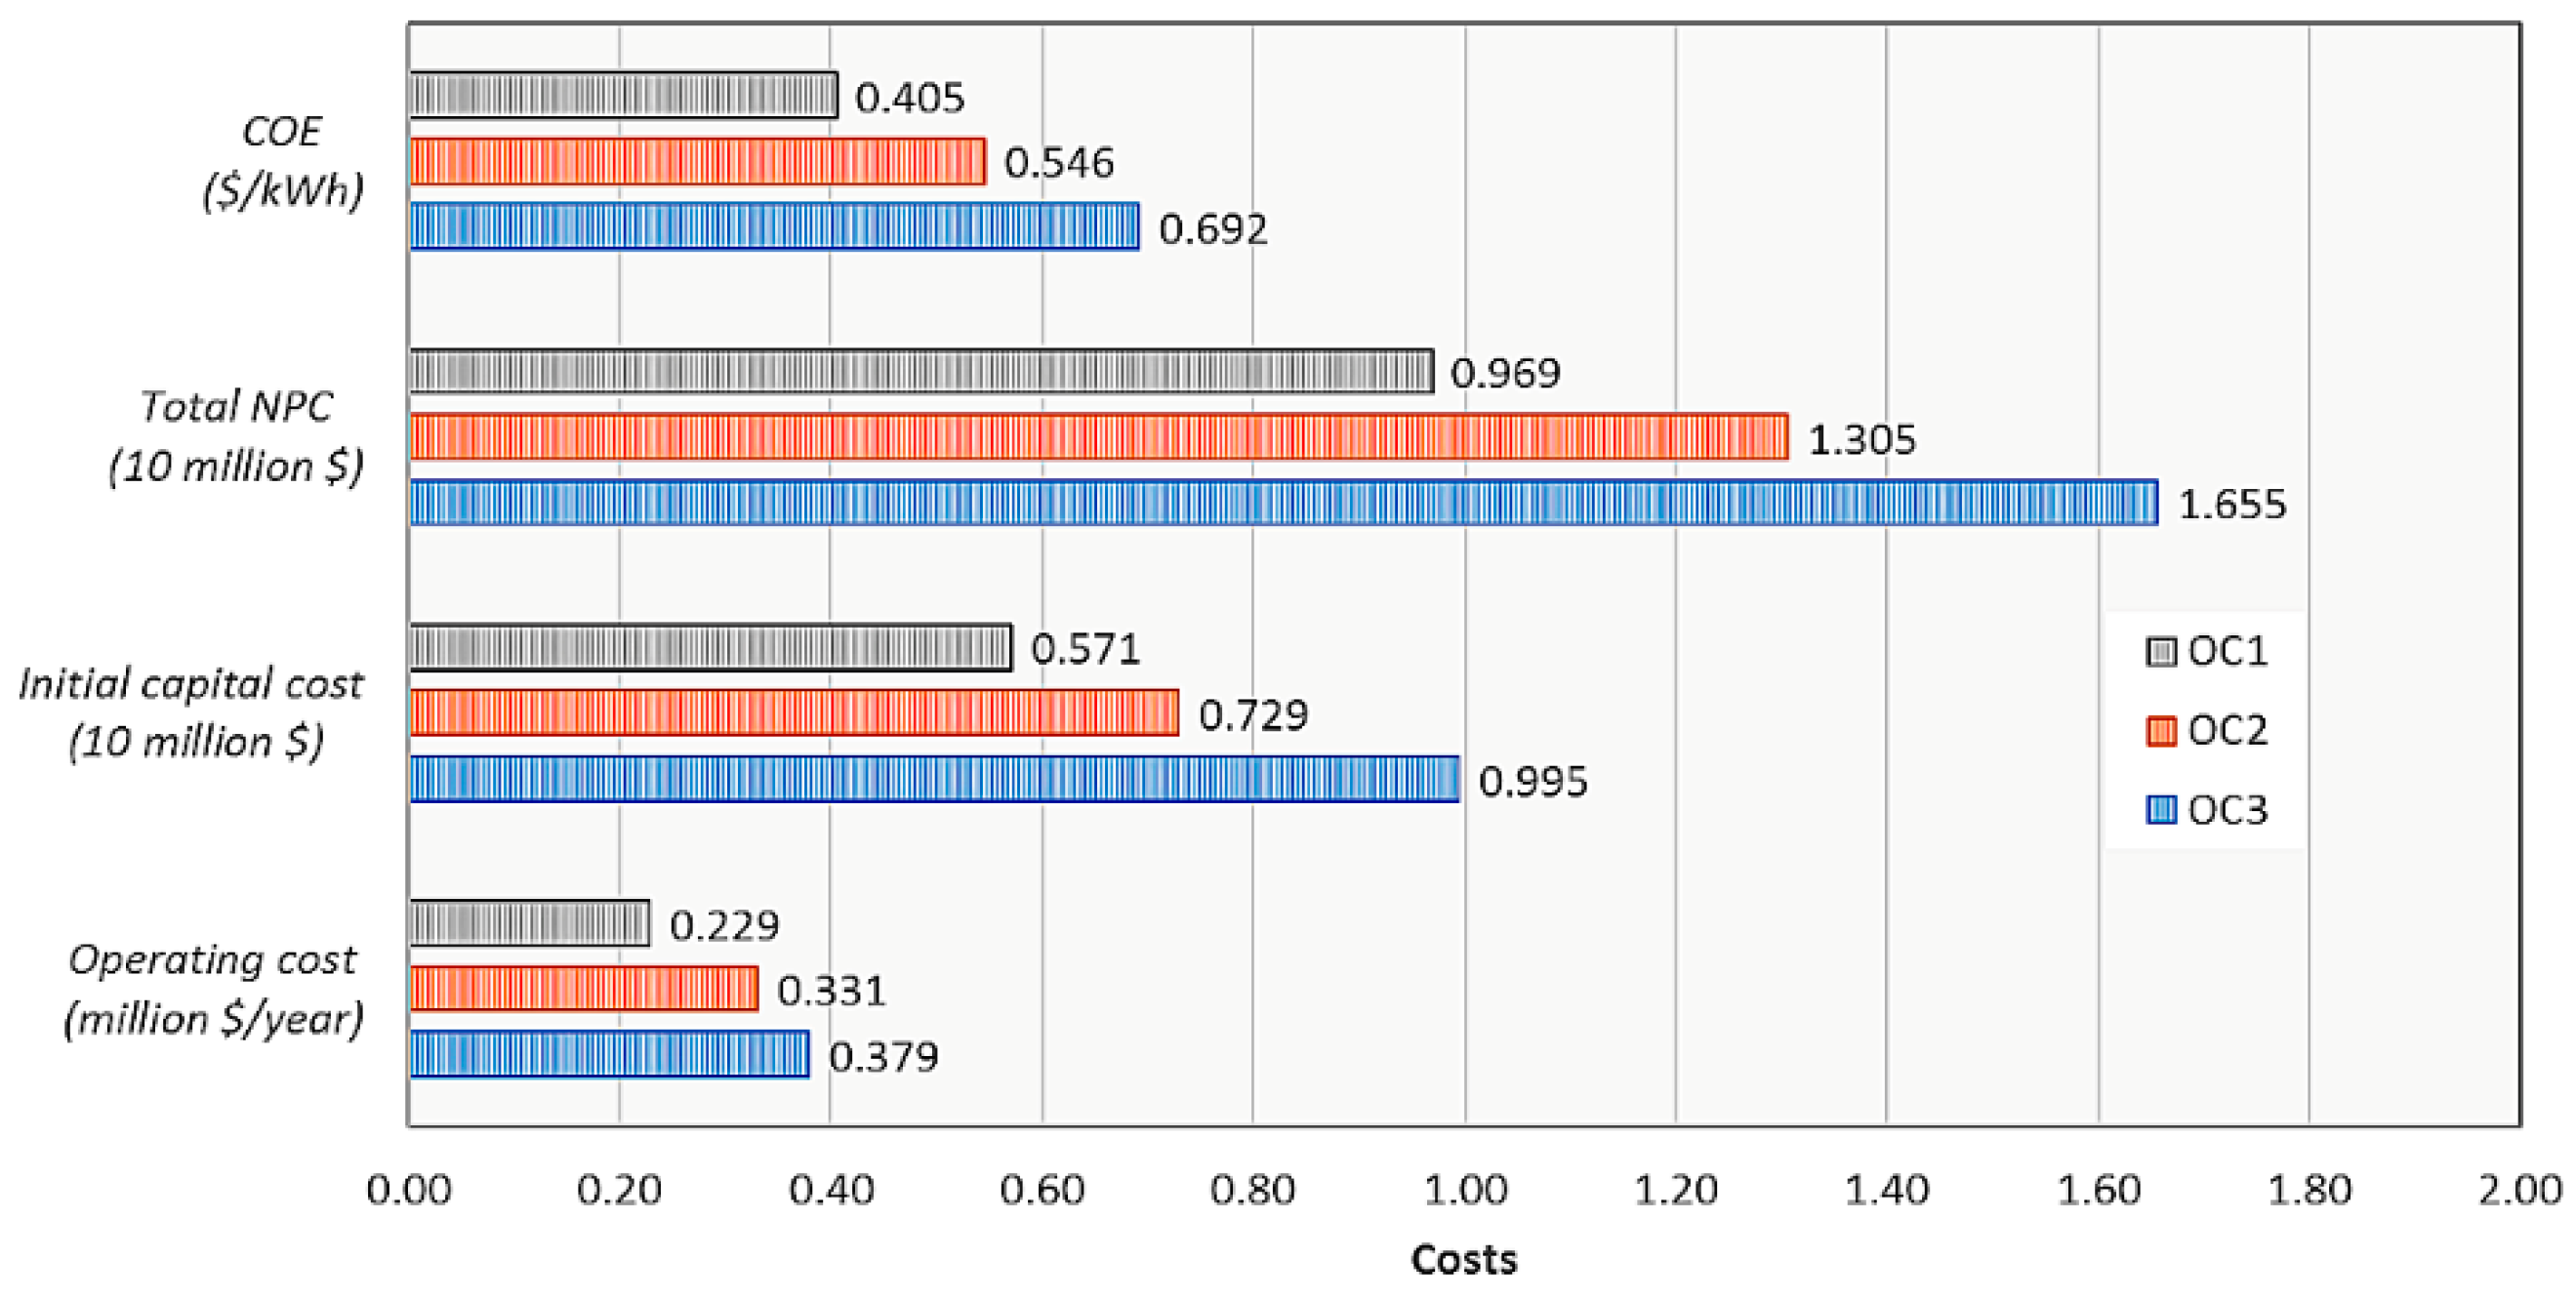
As shown in
Table 3 and
Figure 7, OC1 displays the lowest degrees of COE and NPC. This means that using both wind and solar energy resources achieves greater economic feasibility than using a single renewable energy resource.
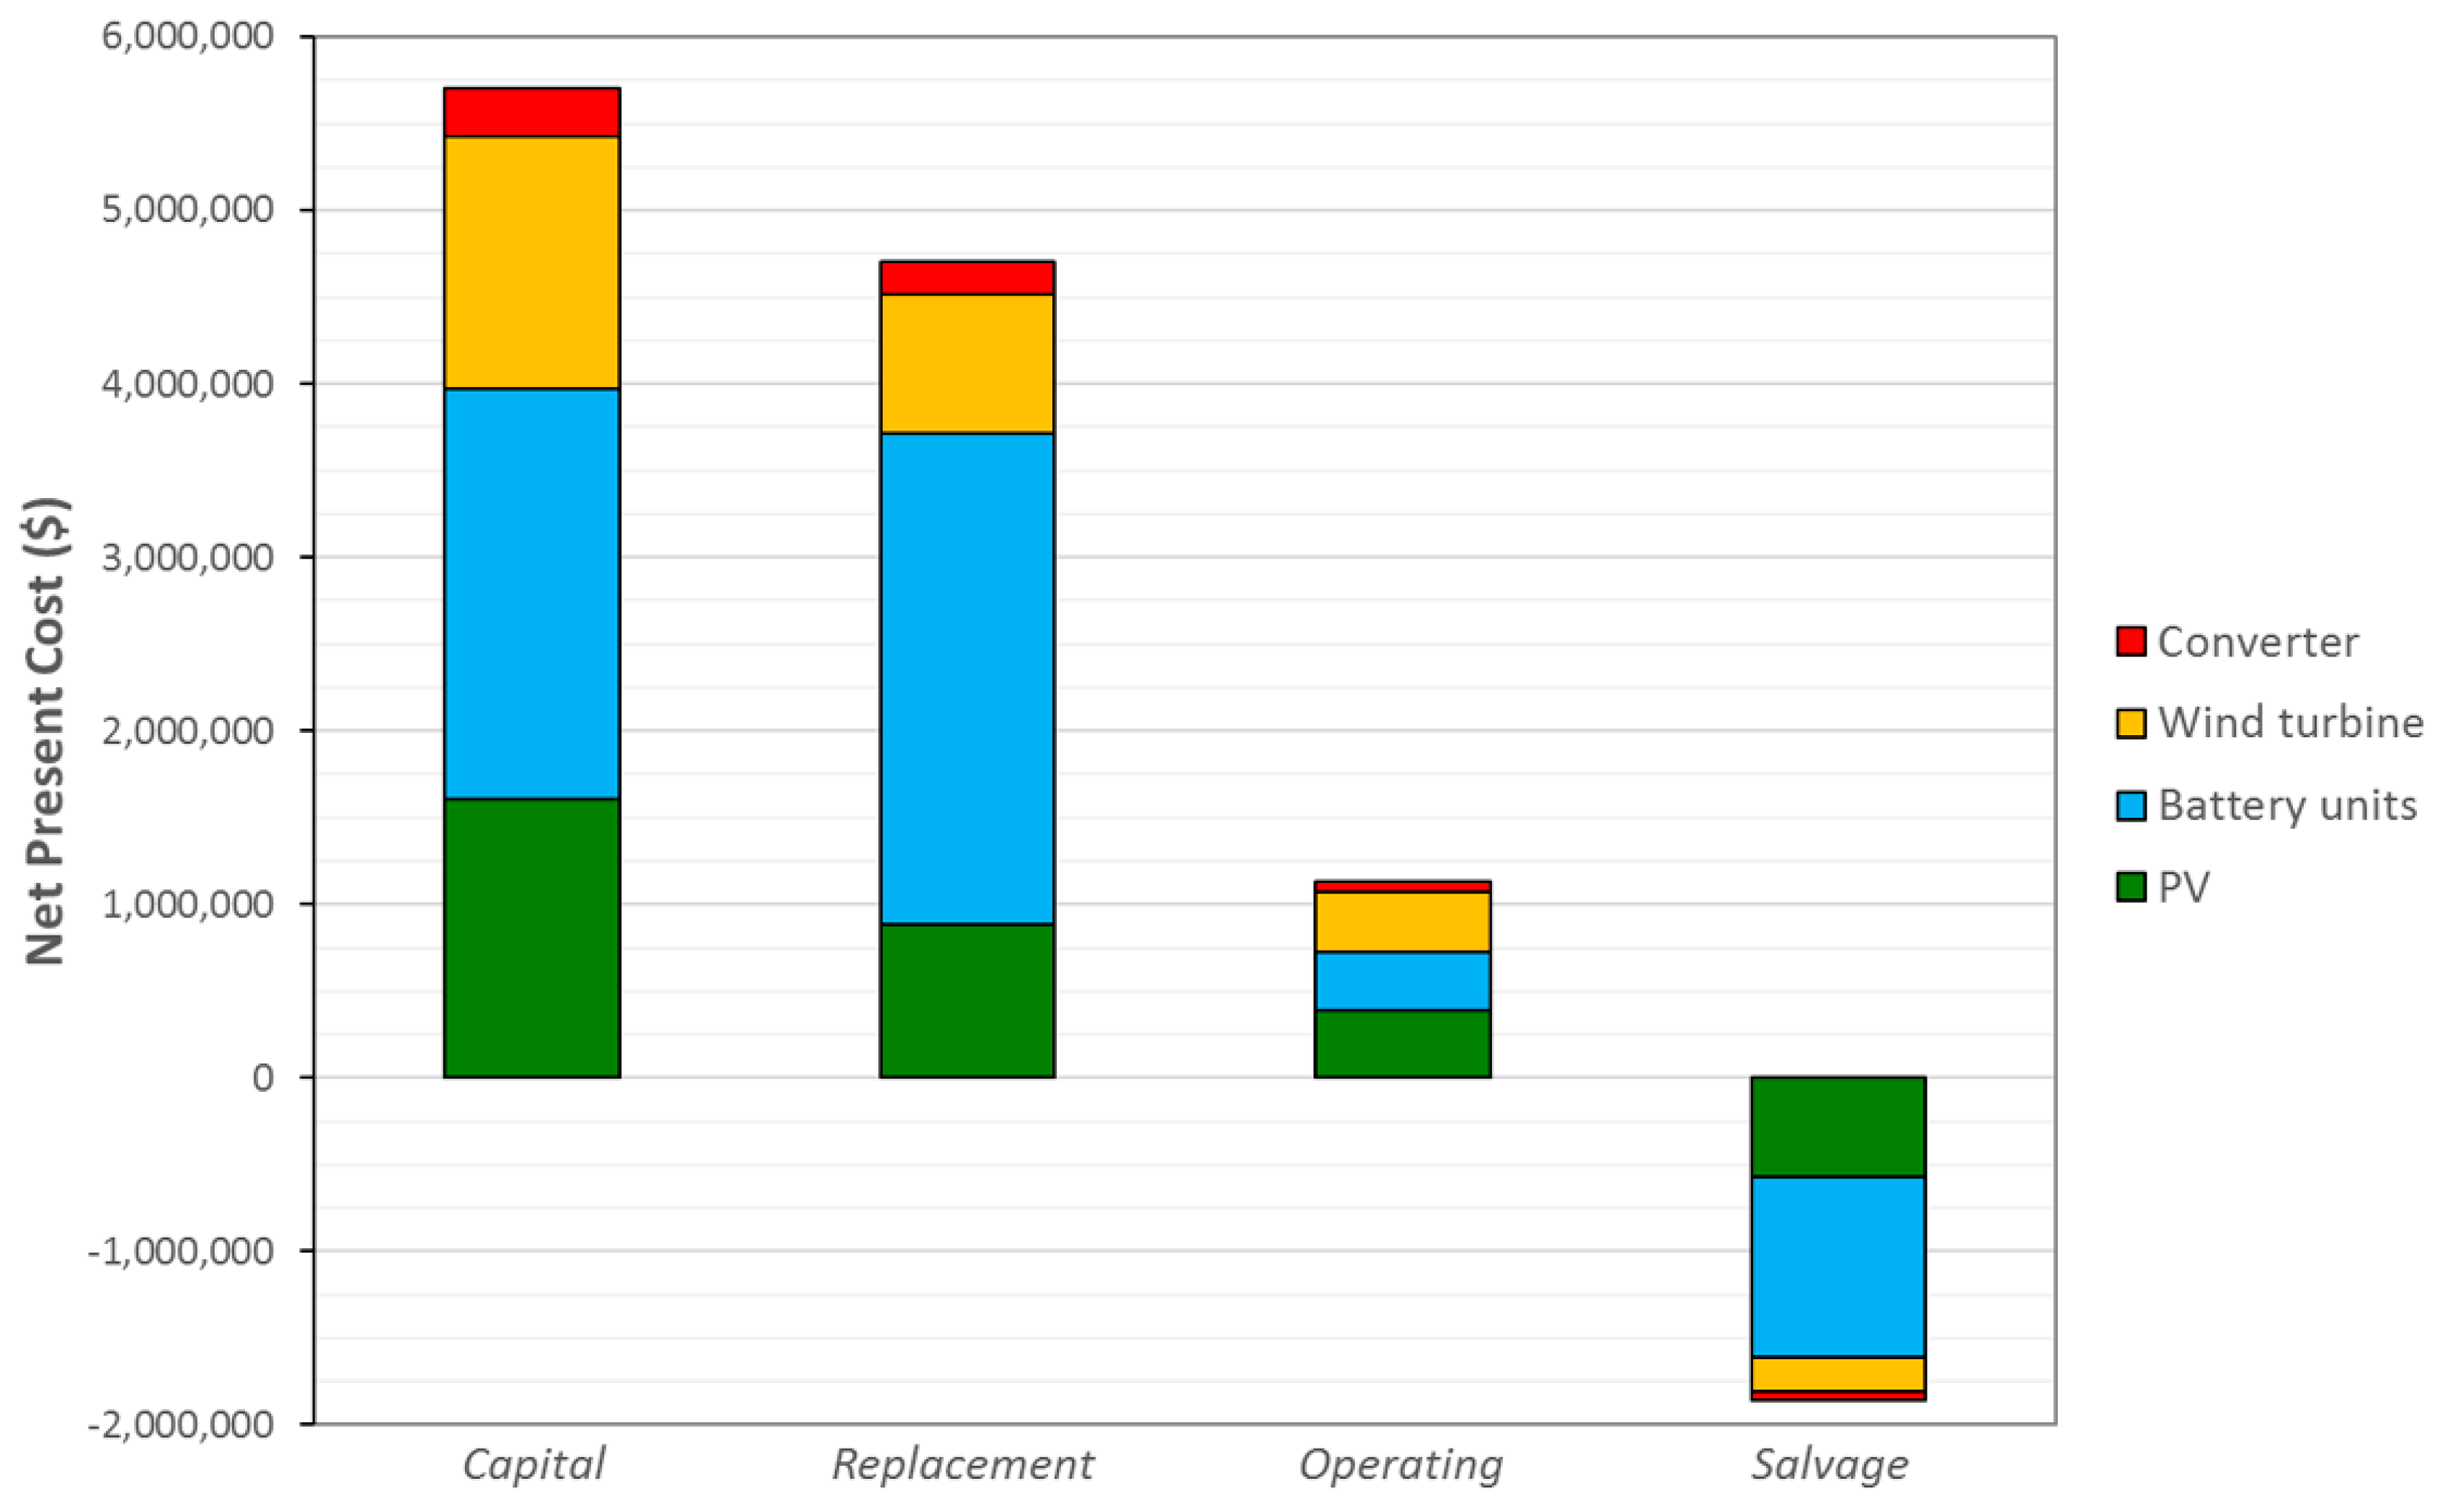
Figure 8 presents the cash flow of OC1, based on the analysis of the NPC, while
Figure 9 shows the monthly electricity production of renewable energy resources from OC1. As shown in
Figure 10, the batteries in the system are used extensively, because the suggested system does not have a grid connection.
In order to create a “green stadium”, this study presents optimal configurations for JWCS in South Korea. To obtain the most economical and optimal configurations, the current study uses the HOMER software package to analyze renewable energy resources. The main results of the simulation are as follows:
First, the simulation results yield three optimal configurations: wind/PV/battery/converter (OC1), wind/battery/converter (OC2), and PV/battery/converter (OC3). Second, OC1, which comprises wind turbines, PV arrays, batteries, and a converter, obtains the lowest degrees of COE ($0.405 per kWh), total NPC ($9,687,156), initial capital ($5,707,970), and operating cost ($228,516 per year), compared with OC2 and OC3. Third, all optimal configurations achieve a renewable fraction of 100%. Fourth, although OC2 and OC3—which depend mainly on wind turbines and PV arrays, respectively—achieve generally acceptable COE levels ($0.546 per kWh and $0.692 per kWh, respectively), using multiple renewable sources is more beneficial in developing independent renewable electricity generation than focusing on just one of the available renewable energy resources.
6. Discussion and Conclusions
Following the 2002 FIFA World Cup, a major event held partly in South Korea, several local governments that manage the stadiums built for the World Cup have grappled with the efficient utilization of these stadiums. Although all the stadiums have brought in professional soccer clubs, their revenues are inadequate to cover all the stadiums’ operational and maintenance costs. Therefore, the local government of Seogwipo City is attempting to build renewable energy facilities for JWCS, including the creation of an independent electricity generation system for the stadium. The current study proposes a hybrid wind/PV/battery/converter system to respond to the electricity demand of JWCS. Using the HOMER software, potential configurations of optimal renewable electricity systems are proposed. Both COE and NPC are used as economic criteria for the configurations.
The three optimal configurations achieved a 100% renewable fraction with COE levels of $0.405, $0.546, and $0.692 per kWh, respectively. Considering the findings of prior simulation studies ($0.420 per kWh for the Palari site in India, $0.409 and $0.422 per kWh for the Binalood region in Iran) [
4,
20], the suggested systems for JWCS can achieve viable results. The simulation and results of the present study can contribute to a better understanding of the possibilities of renewable energy resources and future planning for JWCS. In addition, the results can form a baseline for turning the venue into a “Green Stadium”. Moreover, the configuration which employed multiple energy resources is more economic than the configurations which selected one of the potential energy resources.
Even though there are major costs involved in installing renewable electricity generation facilities for JWCS, these facilities can contribute effectively in maintaining the stadium in the long term. Moreover, considering that this study did not consider a grid connection to facilitate selling of the electricity generated by the suggested system, the stadium could achieve an even better economic performance if such a grid connection were considered.
In addition, because the initial capital costs contribute to more than 58% of the NPC costs in all configurations with the battery units as the most expensive components, the gradual plans should be prepared. One of the possible plans is to preferentially install and operate PV panels and wind turbines before the installation and operation of the battery units. Moreover, the following points can be considered:
The various supporting plans conducted by the governments can be applied.
Because the current price of the midnight electricity is significantly low, using PV panels can take priority over installing and operating other suggested components.
In order to minimize the capacity and costs of an electric converter, other wind turbine models which can be connected to the AC load can be considered.
Several notable limitations remain to be investigated by future studies. First, this study does not consider any supporting policies or plans being developed in South Korea. Such policies can have significant effects on the implementation of renewable power generation systems [
21,
22,
23]. Second, although the results of the simulation are optimized using mathematical methods, other optimal solutions using different criteria may achieve a better economic performance for JWCS [
6]. Third, this study does not consider any natural disasters; because JWCS is close to the sea [
9], there may be unexpected consequences from natural disasters. These shortcomings can be addressed in future studies, using the results of the current study as a baseline.


