
Sustainability Investigation of Resource-Based Cities in Northeastern China

 ,
,  ,
, 
Abstract
:1. Introduction
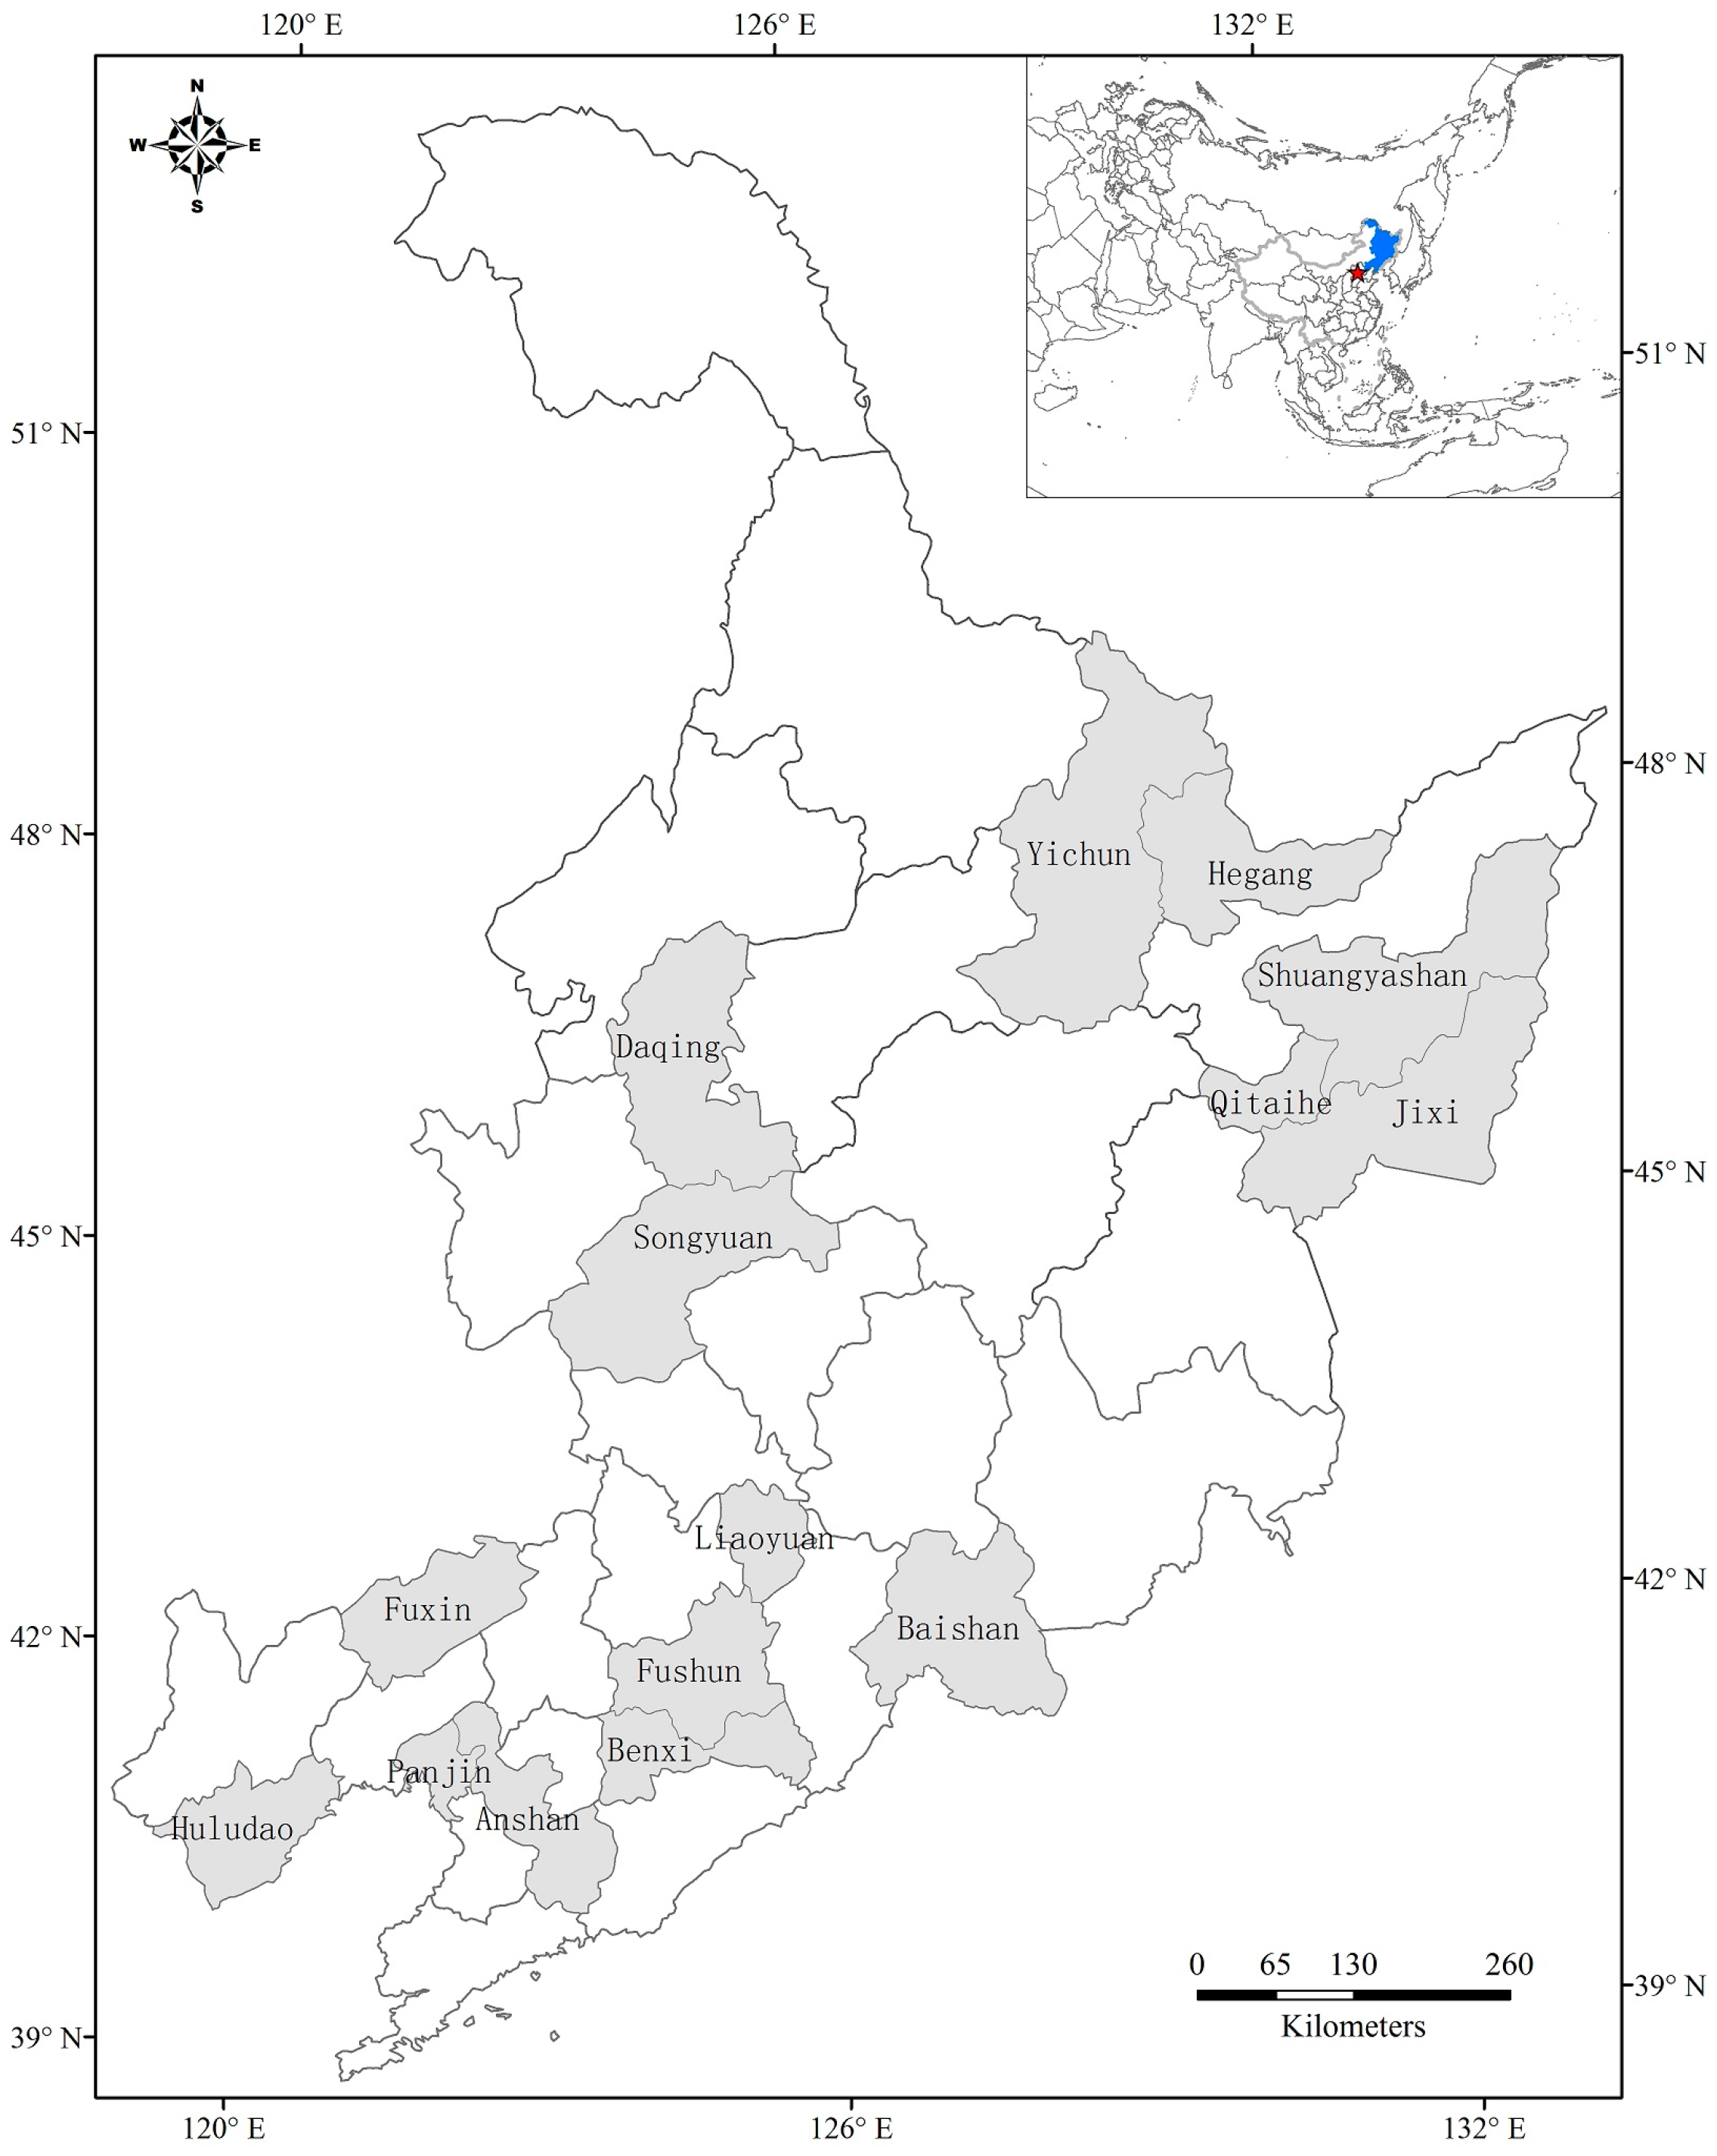
2. Studied Cases
3. Methods
3.1. Methodology: TOPSIS
3.2. Index and Data Processing
4. Results
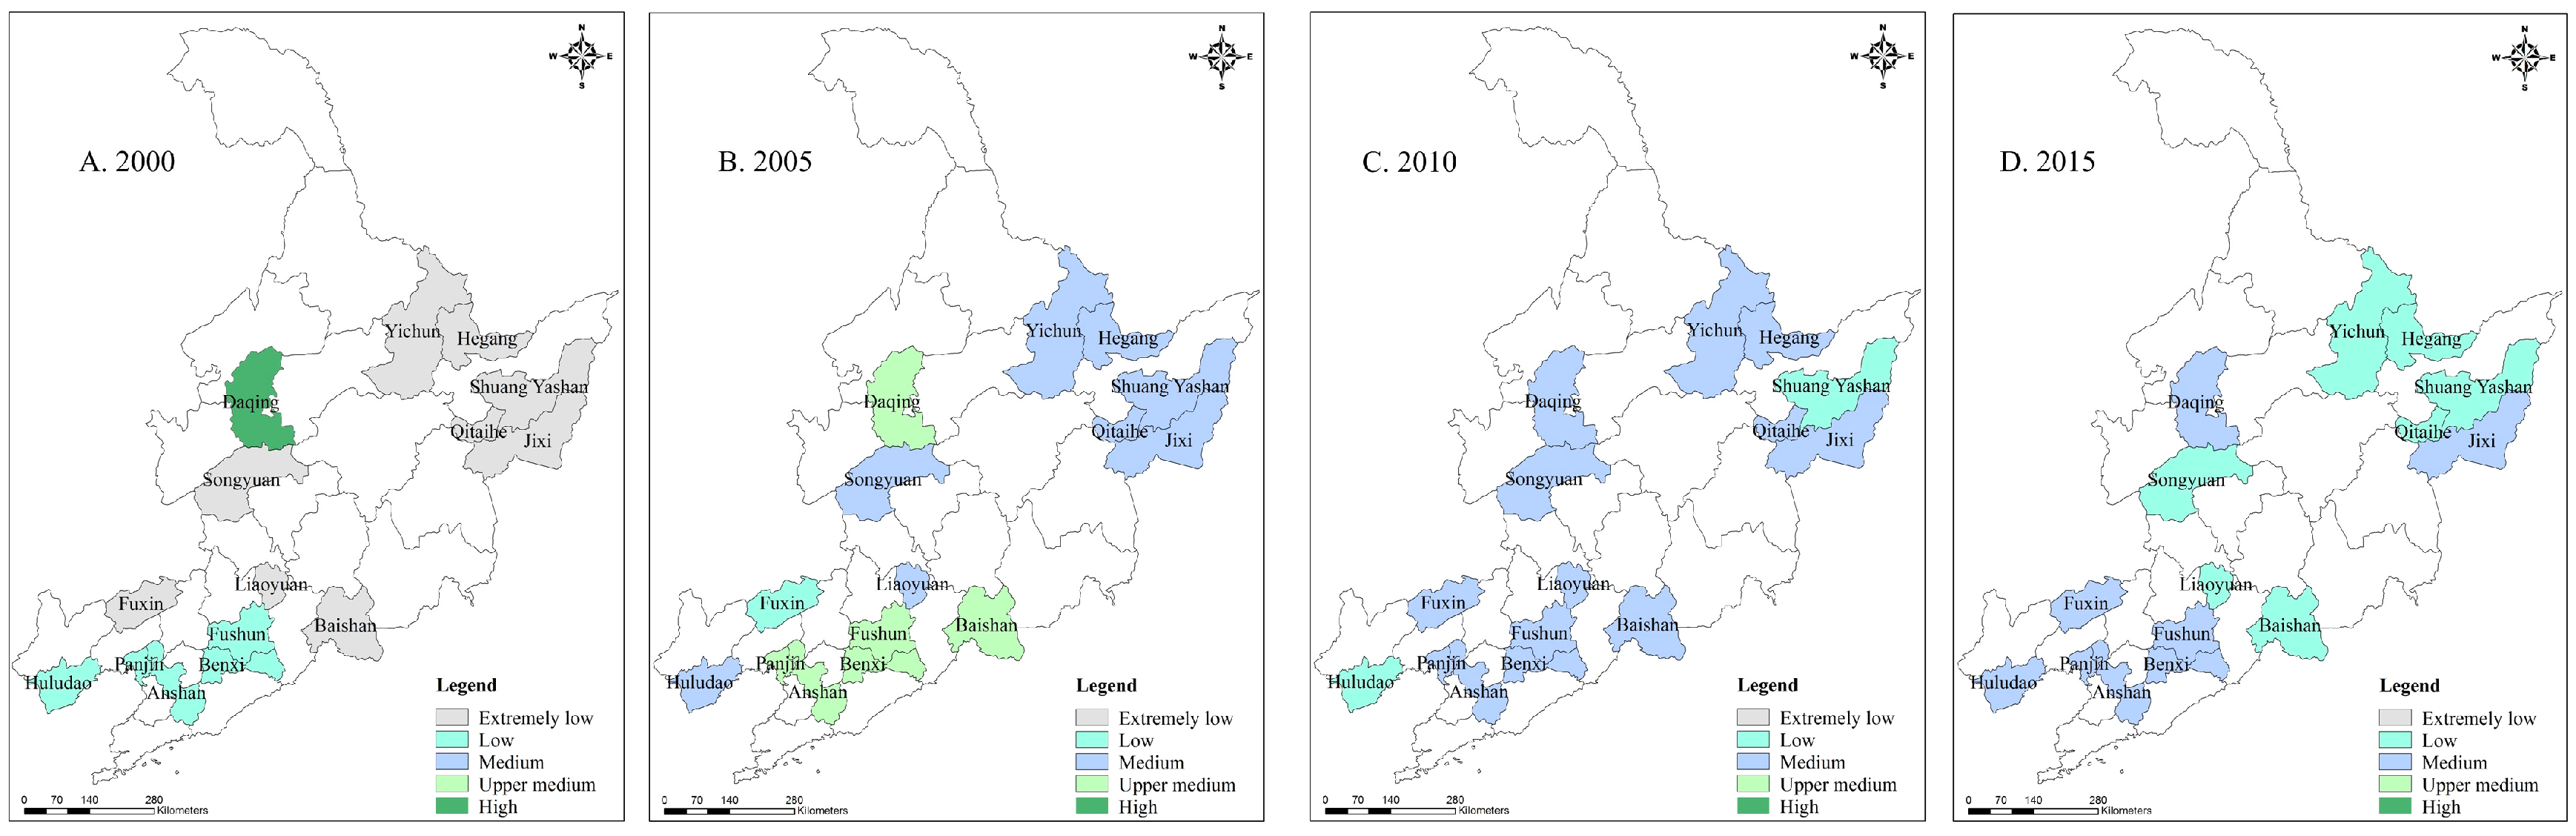
4.1. Calculation Results and Grouping
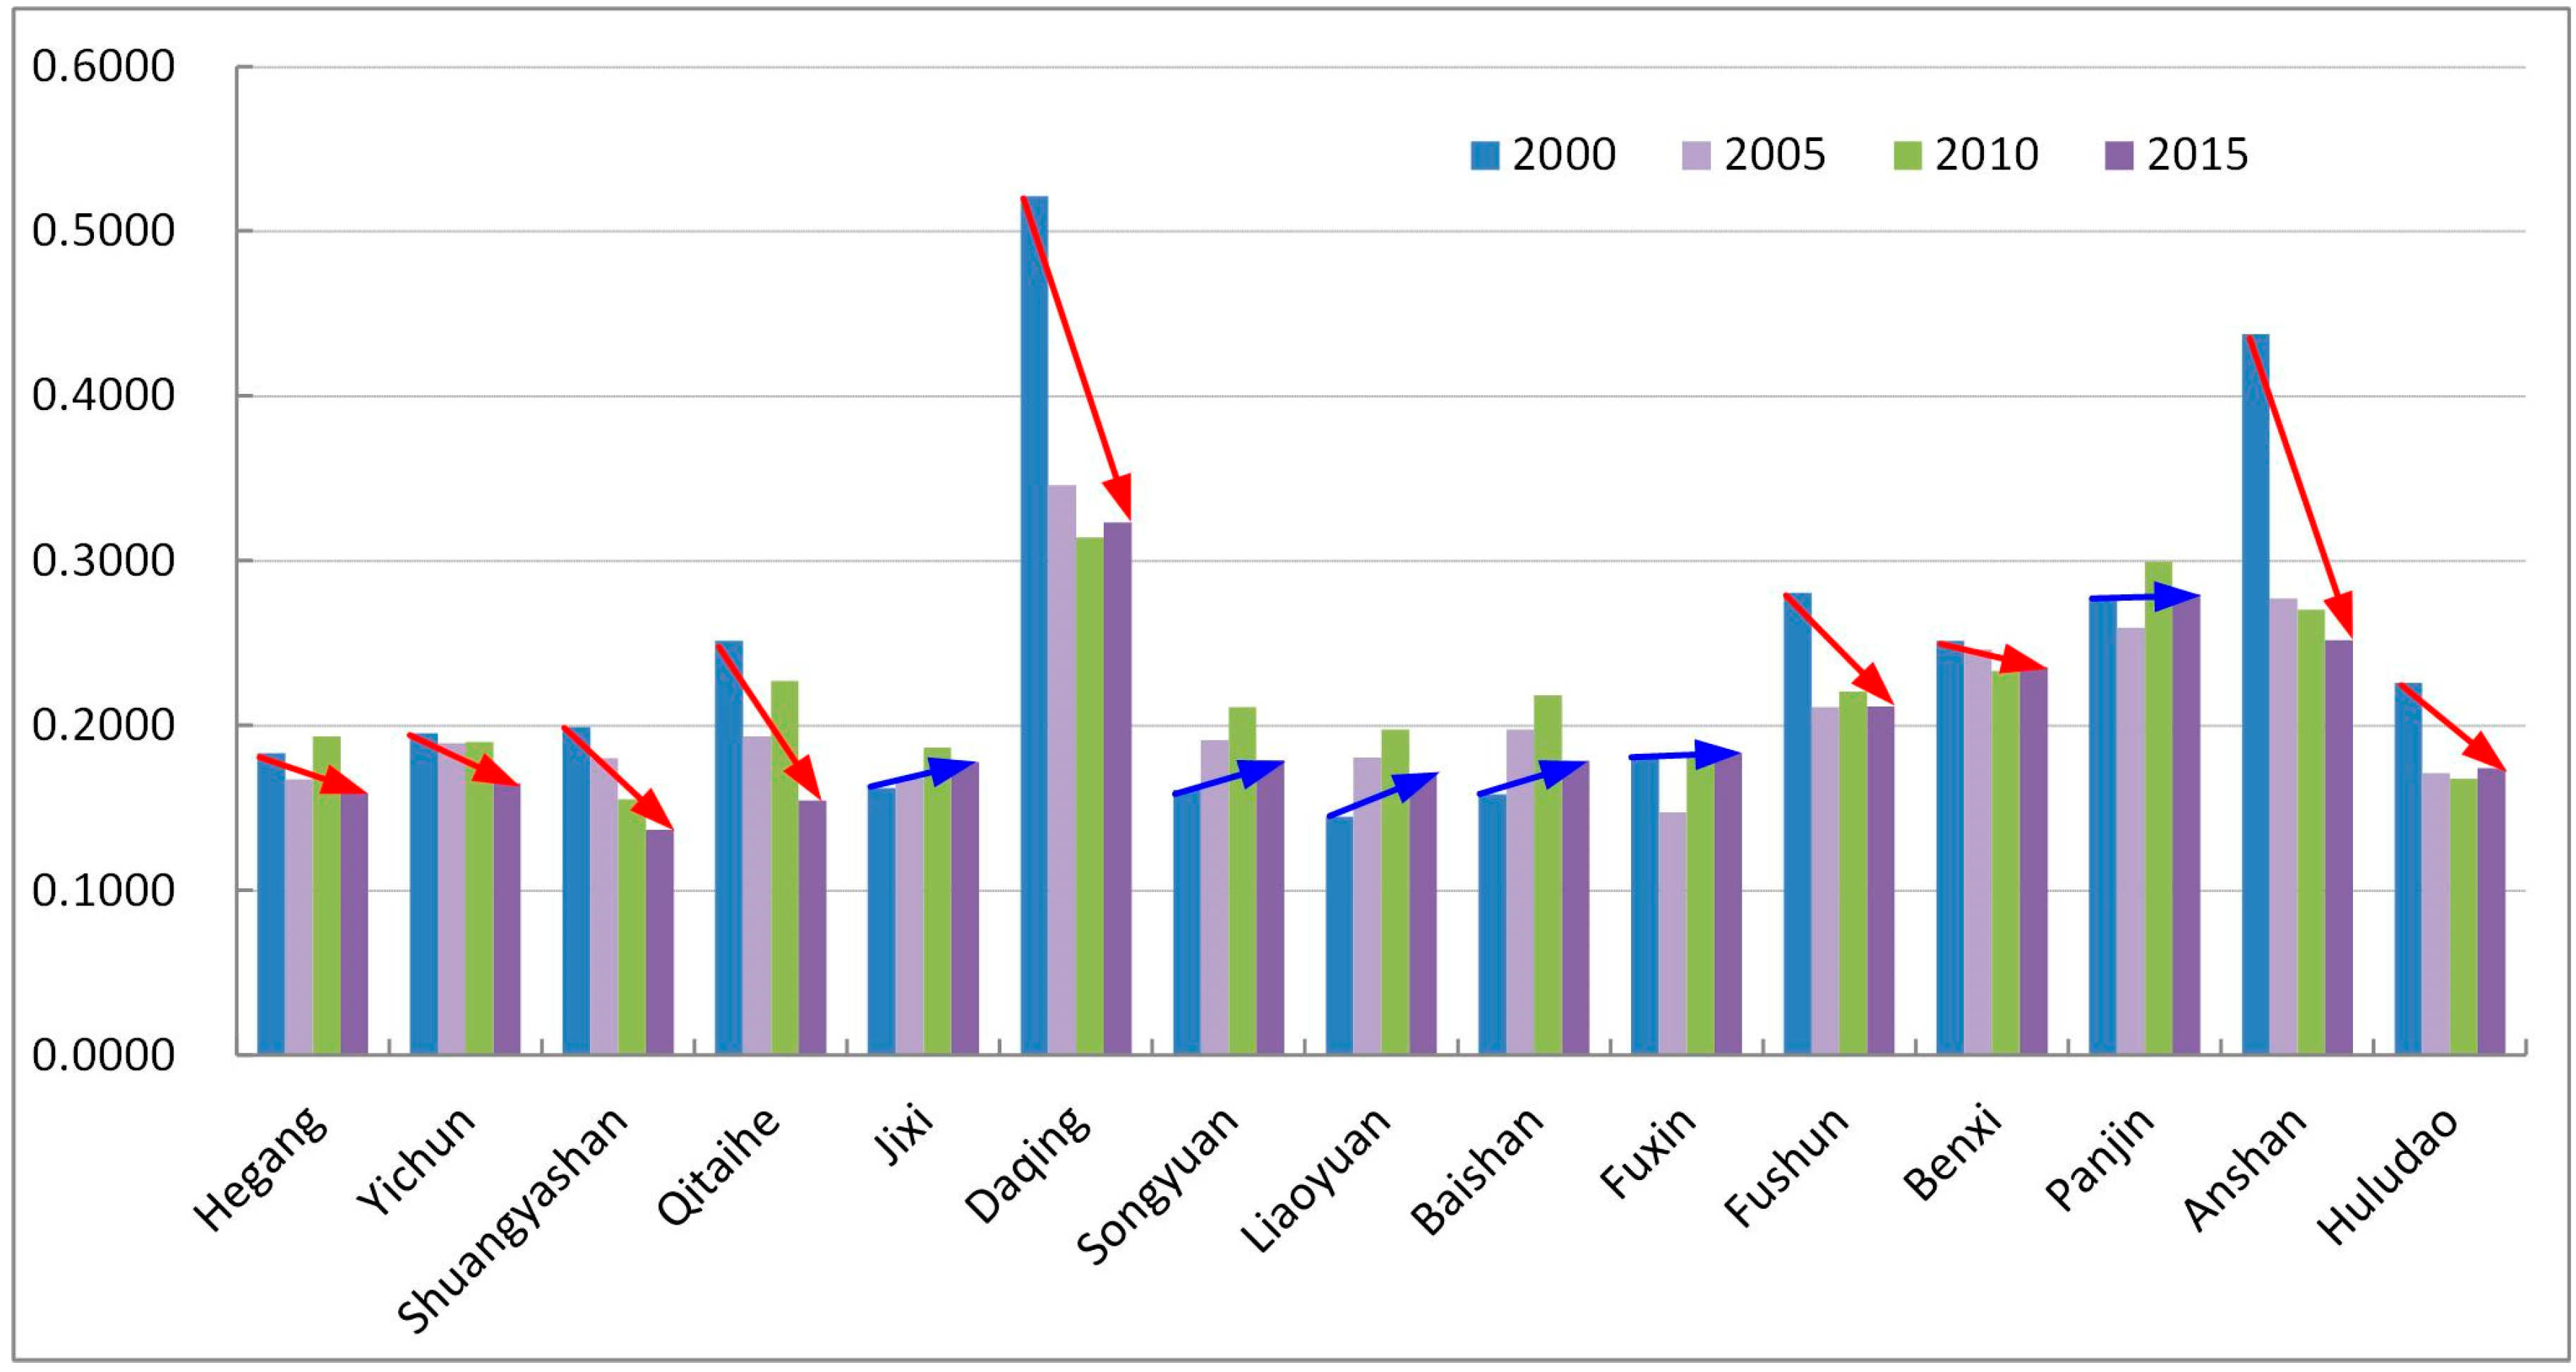
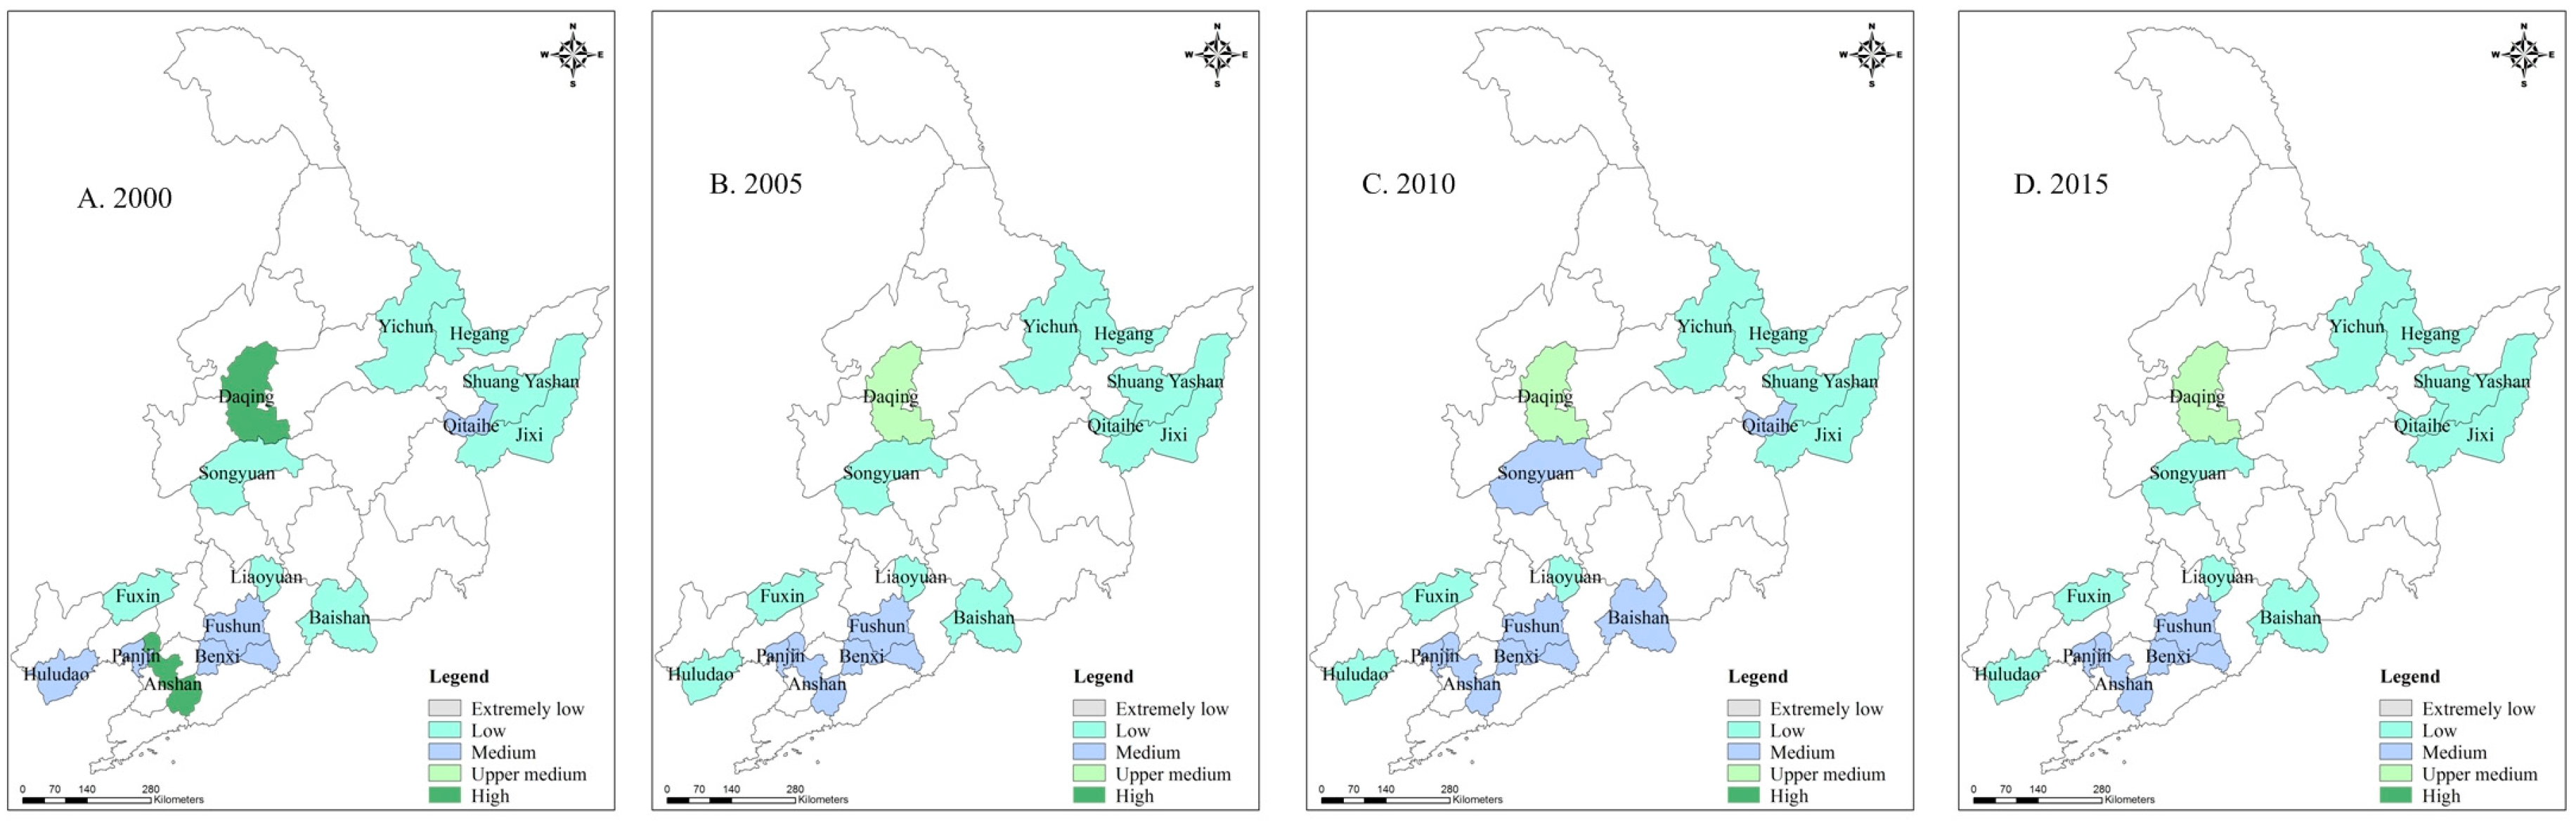
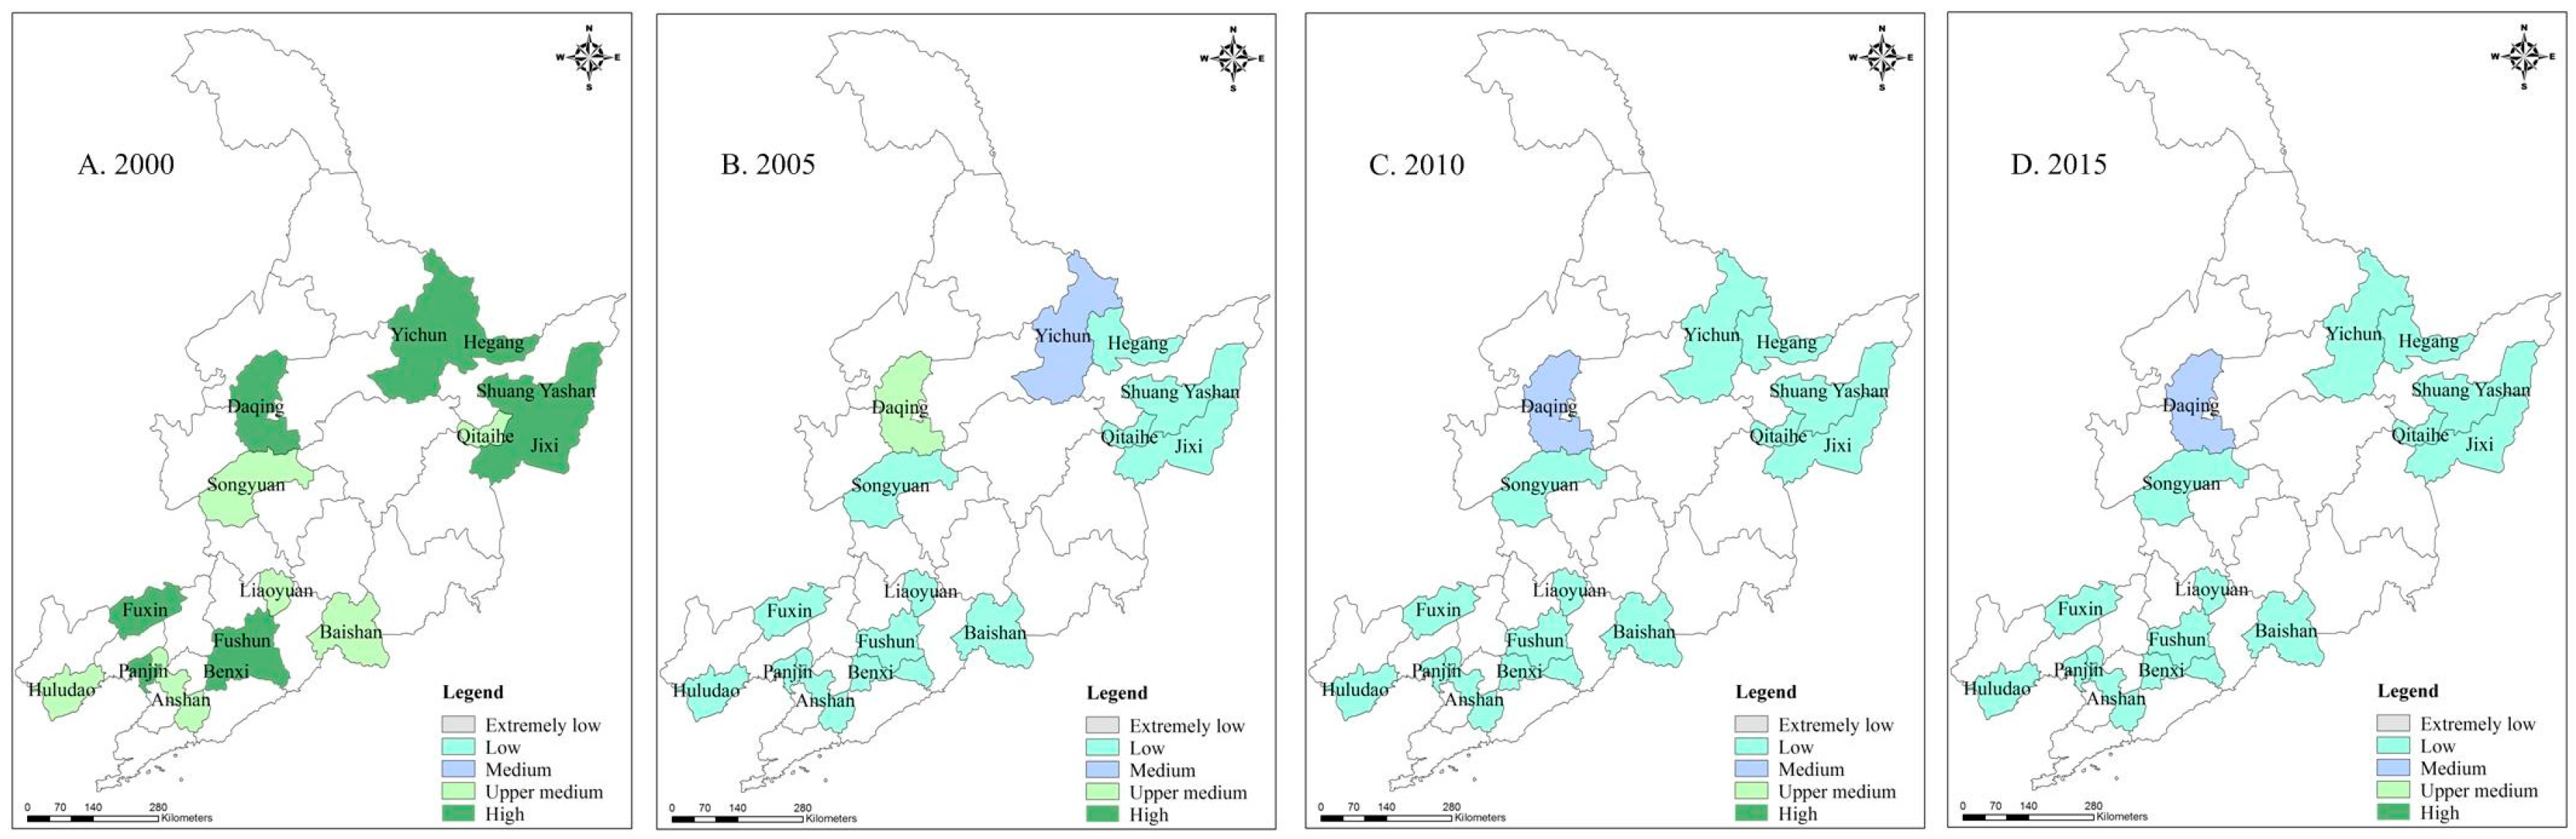
4.2. Comprehensive Sustainability and Ranking
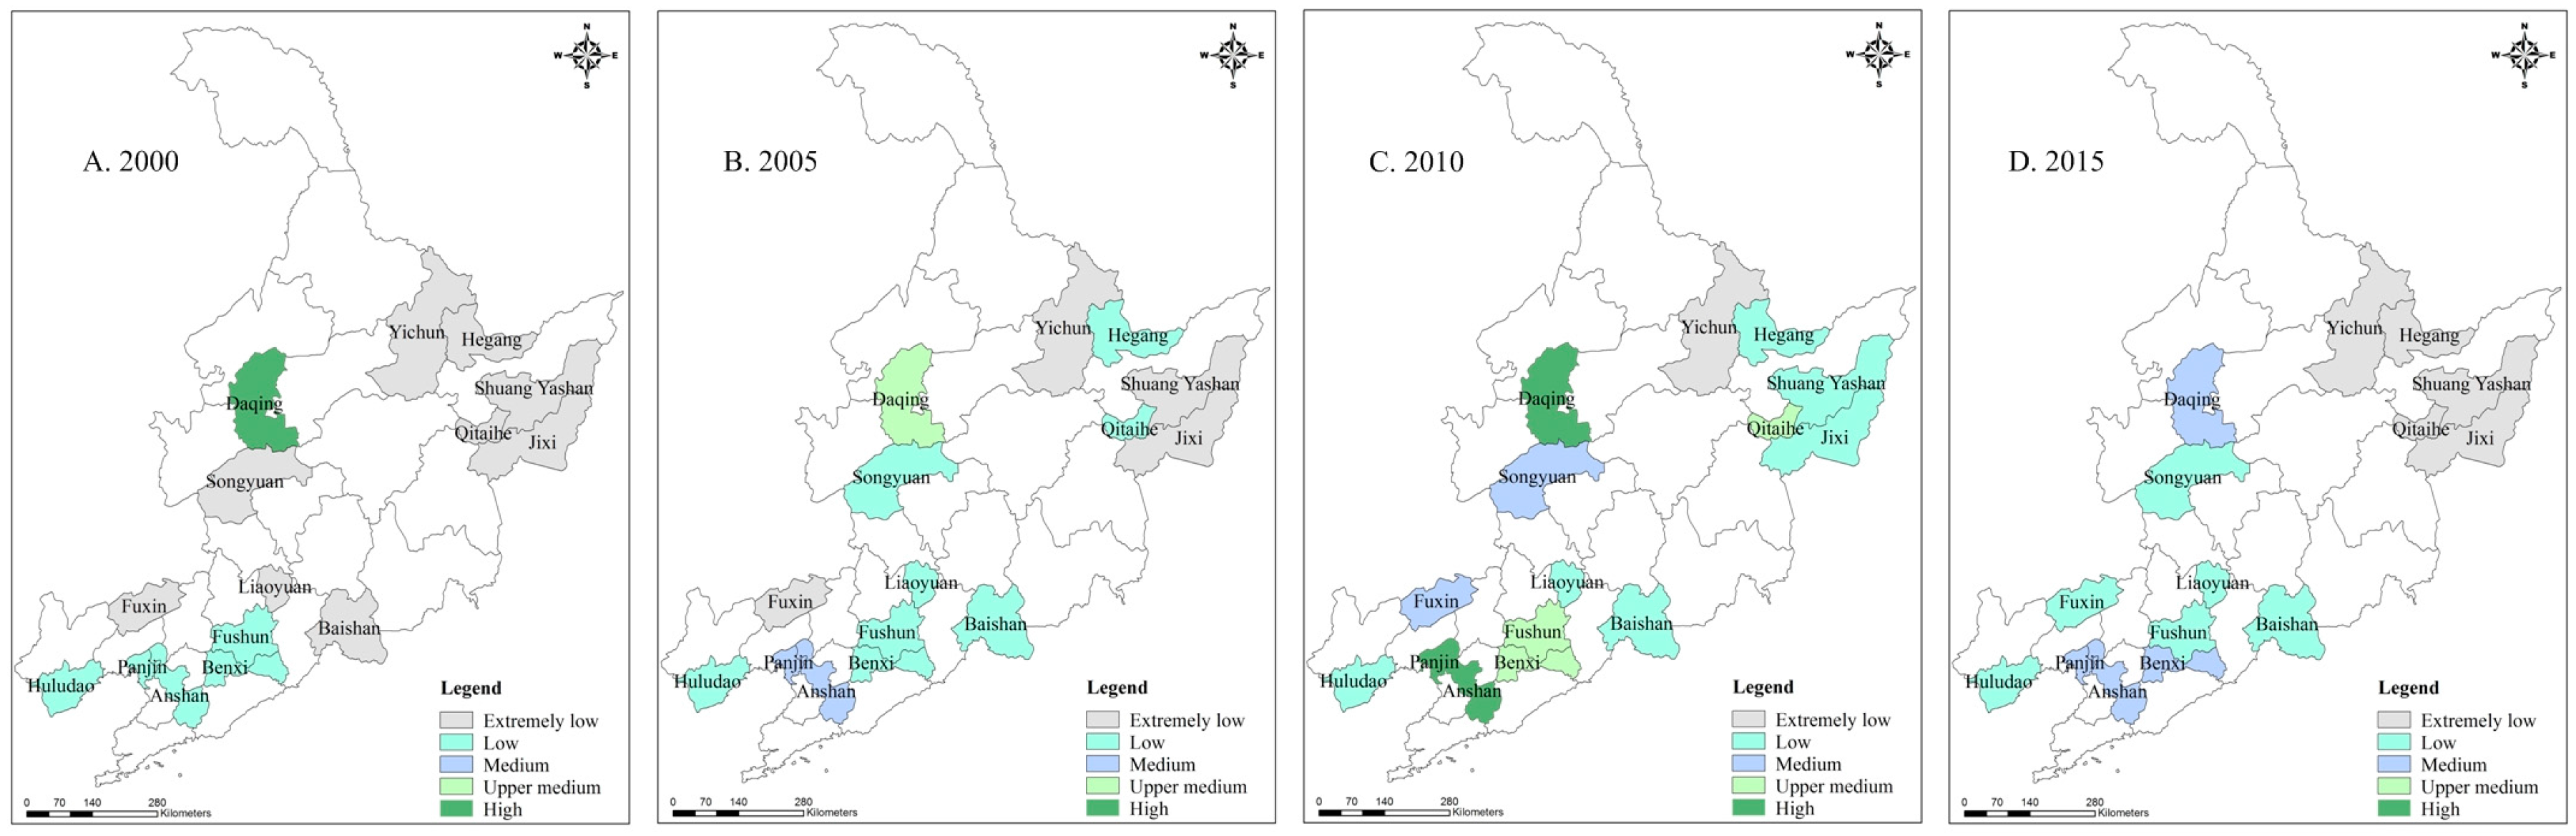
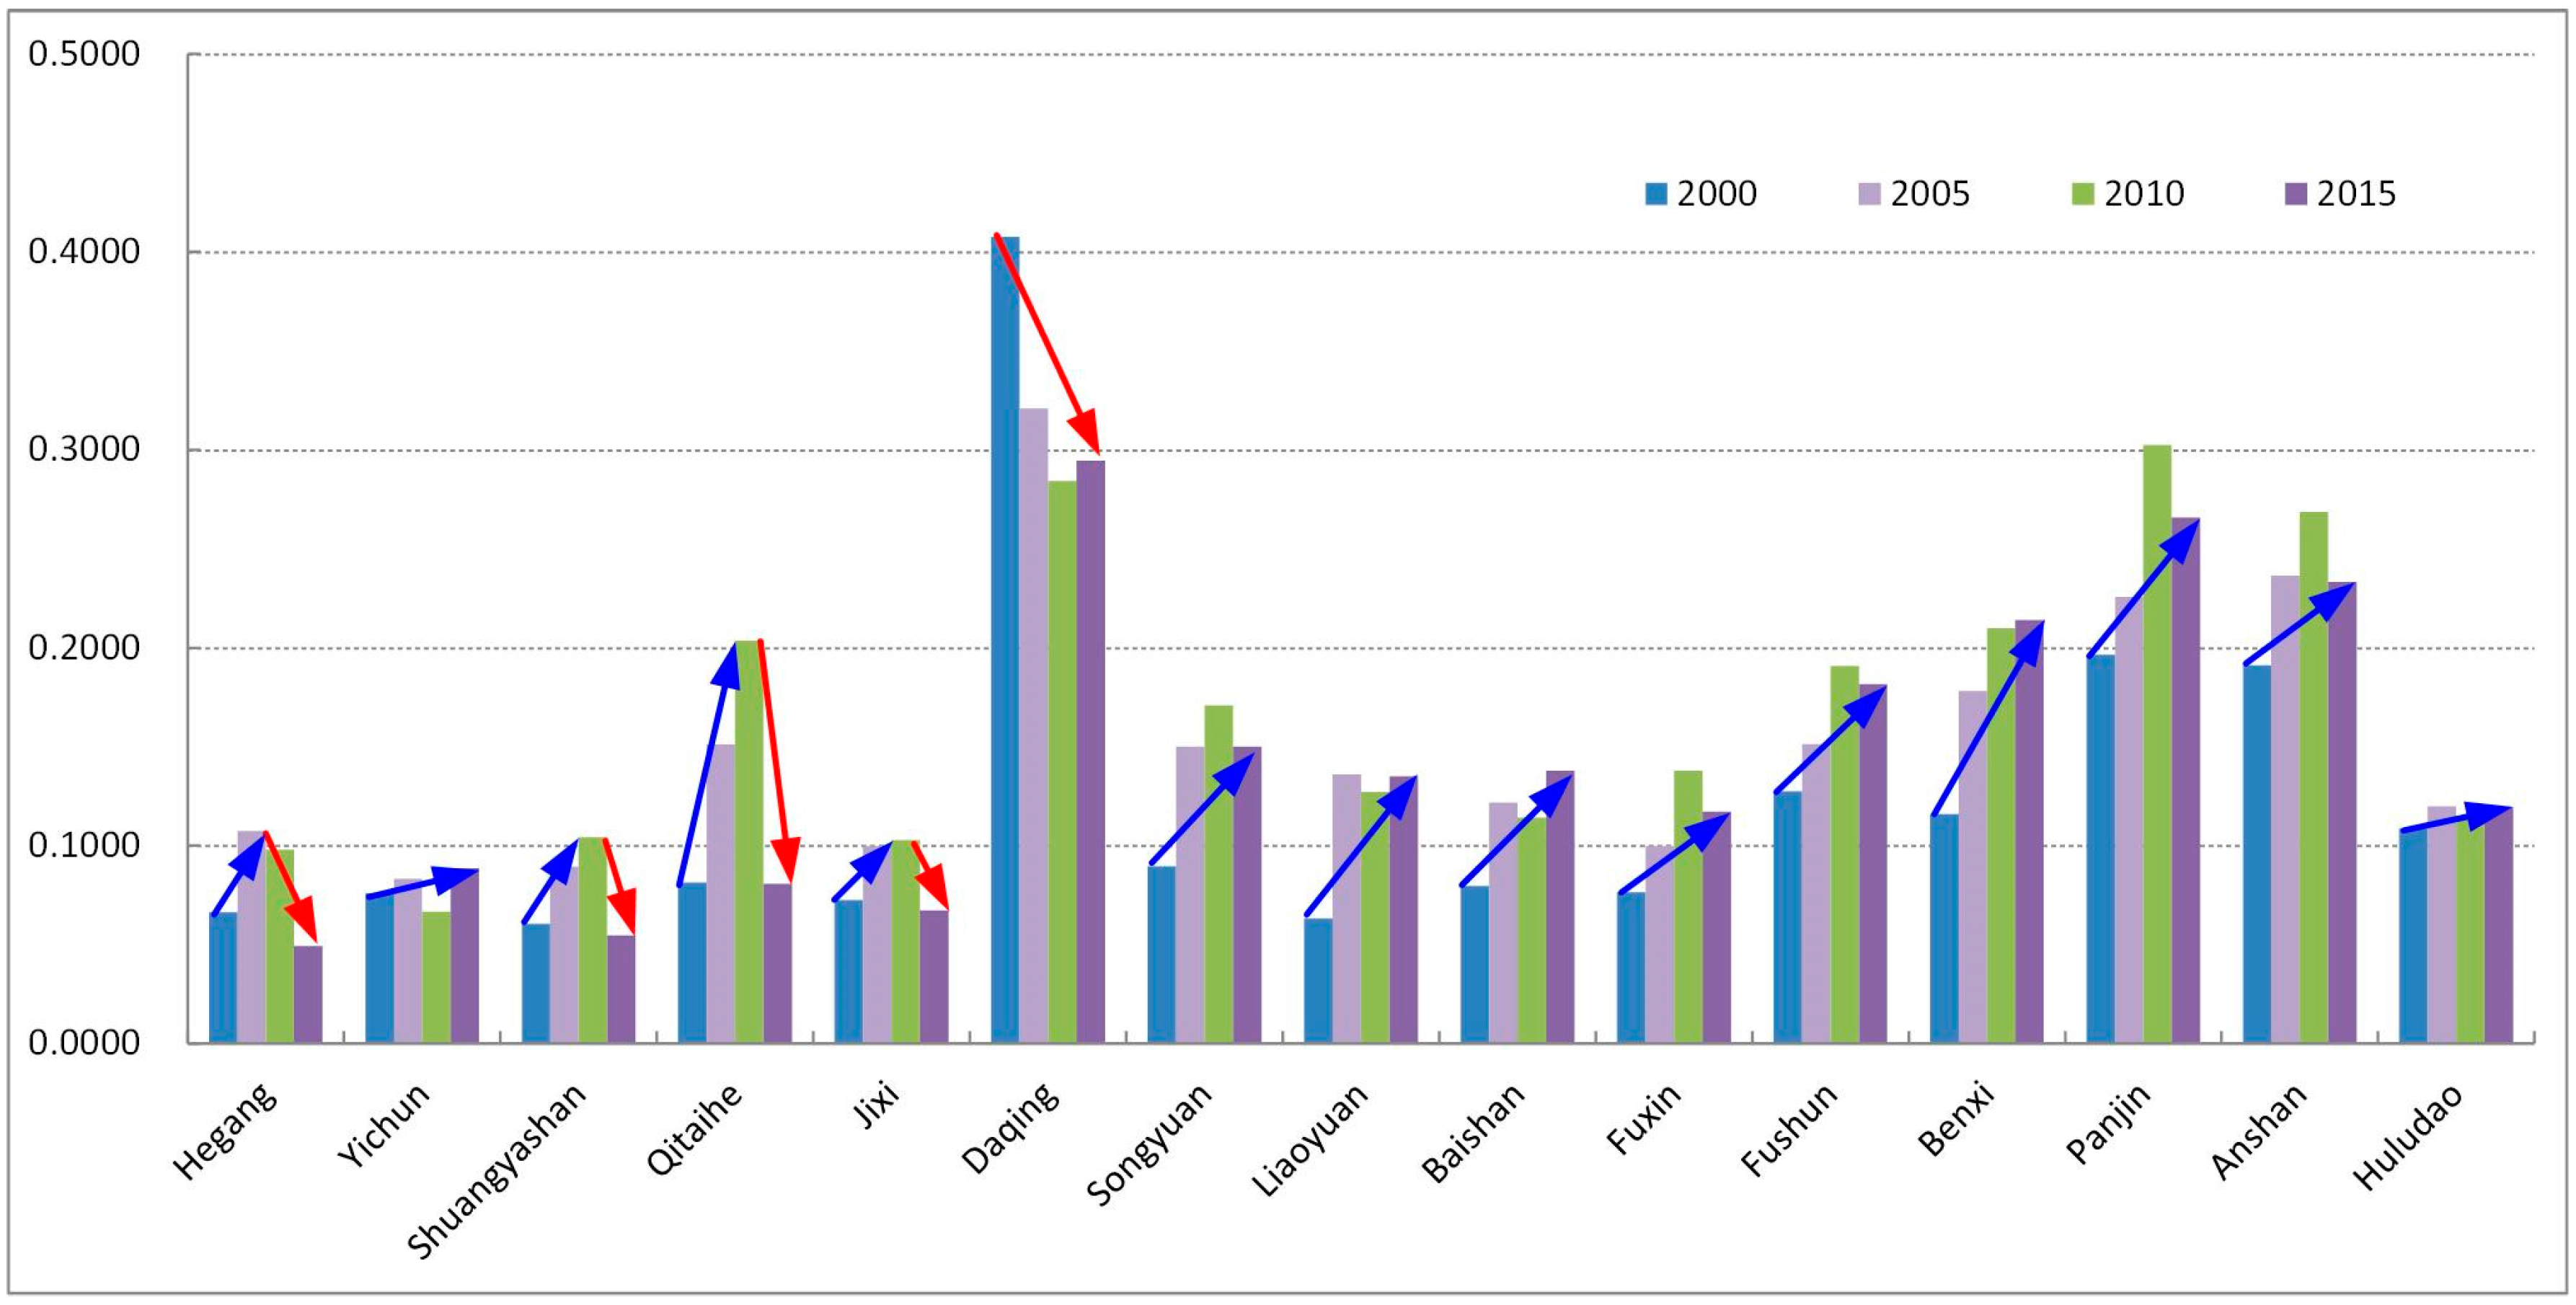
4.3. Economic Subsystem
4.4. Social Subsystem
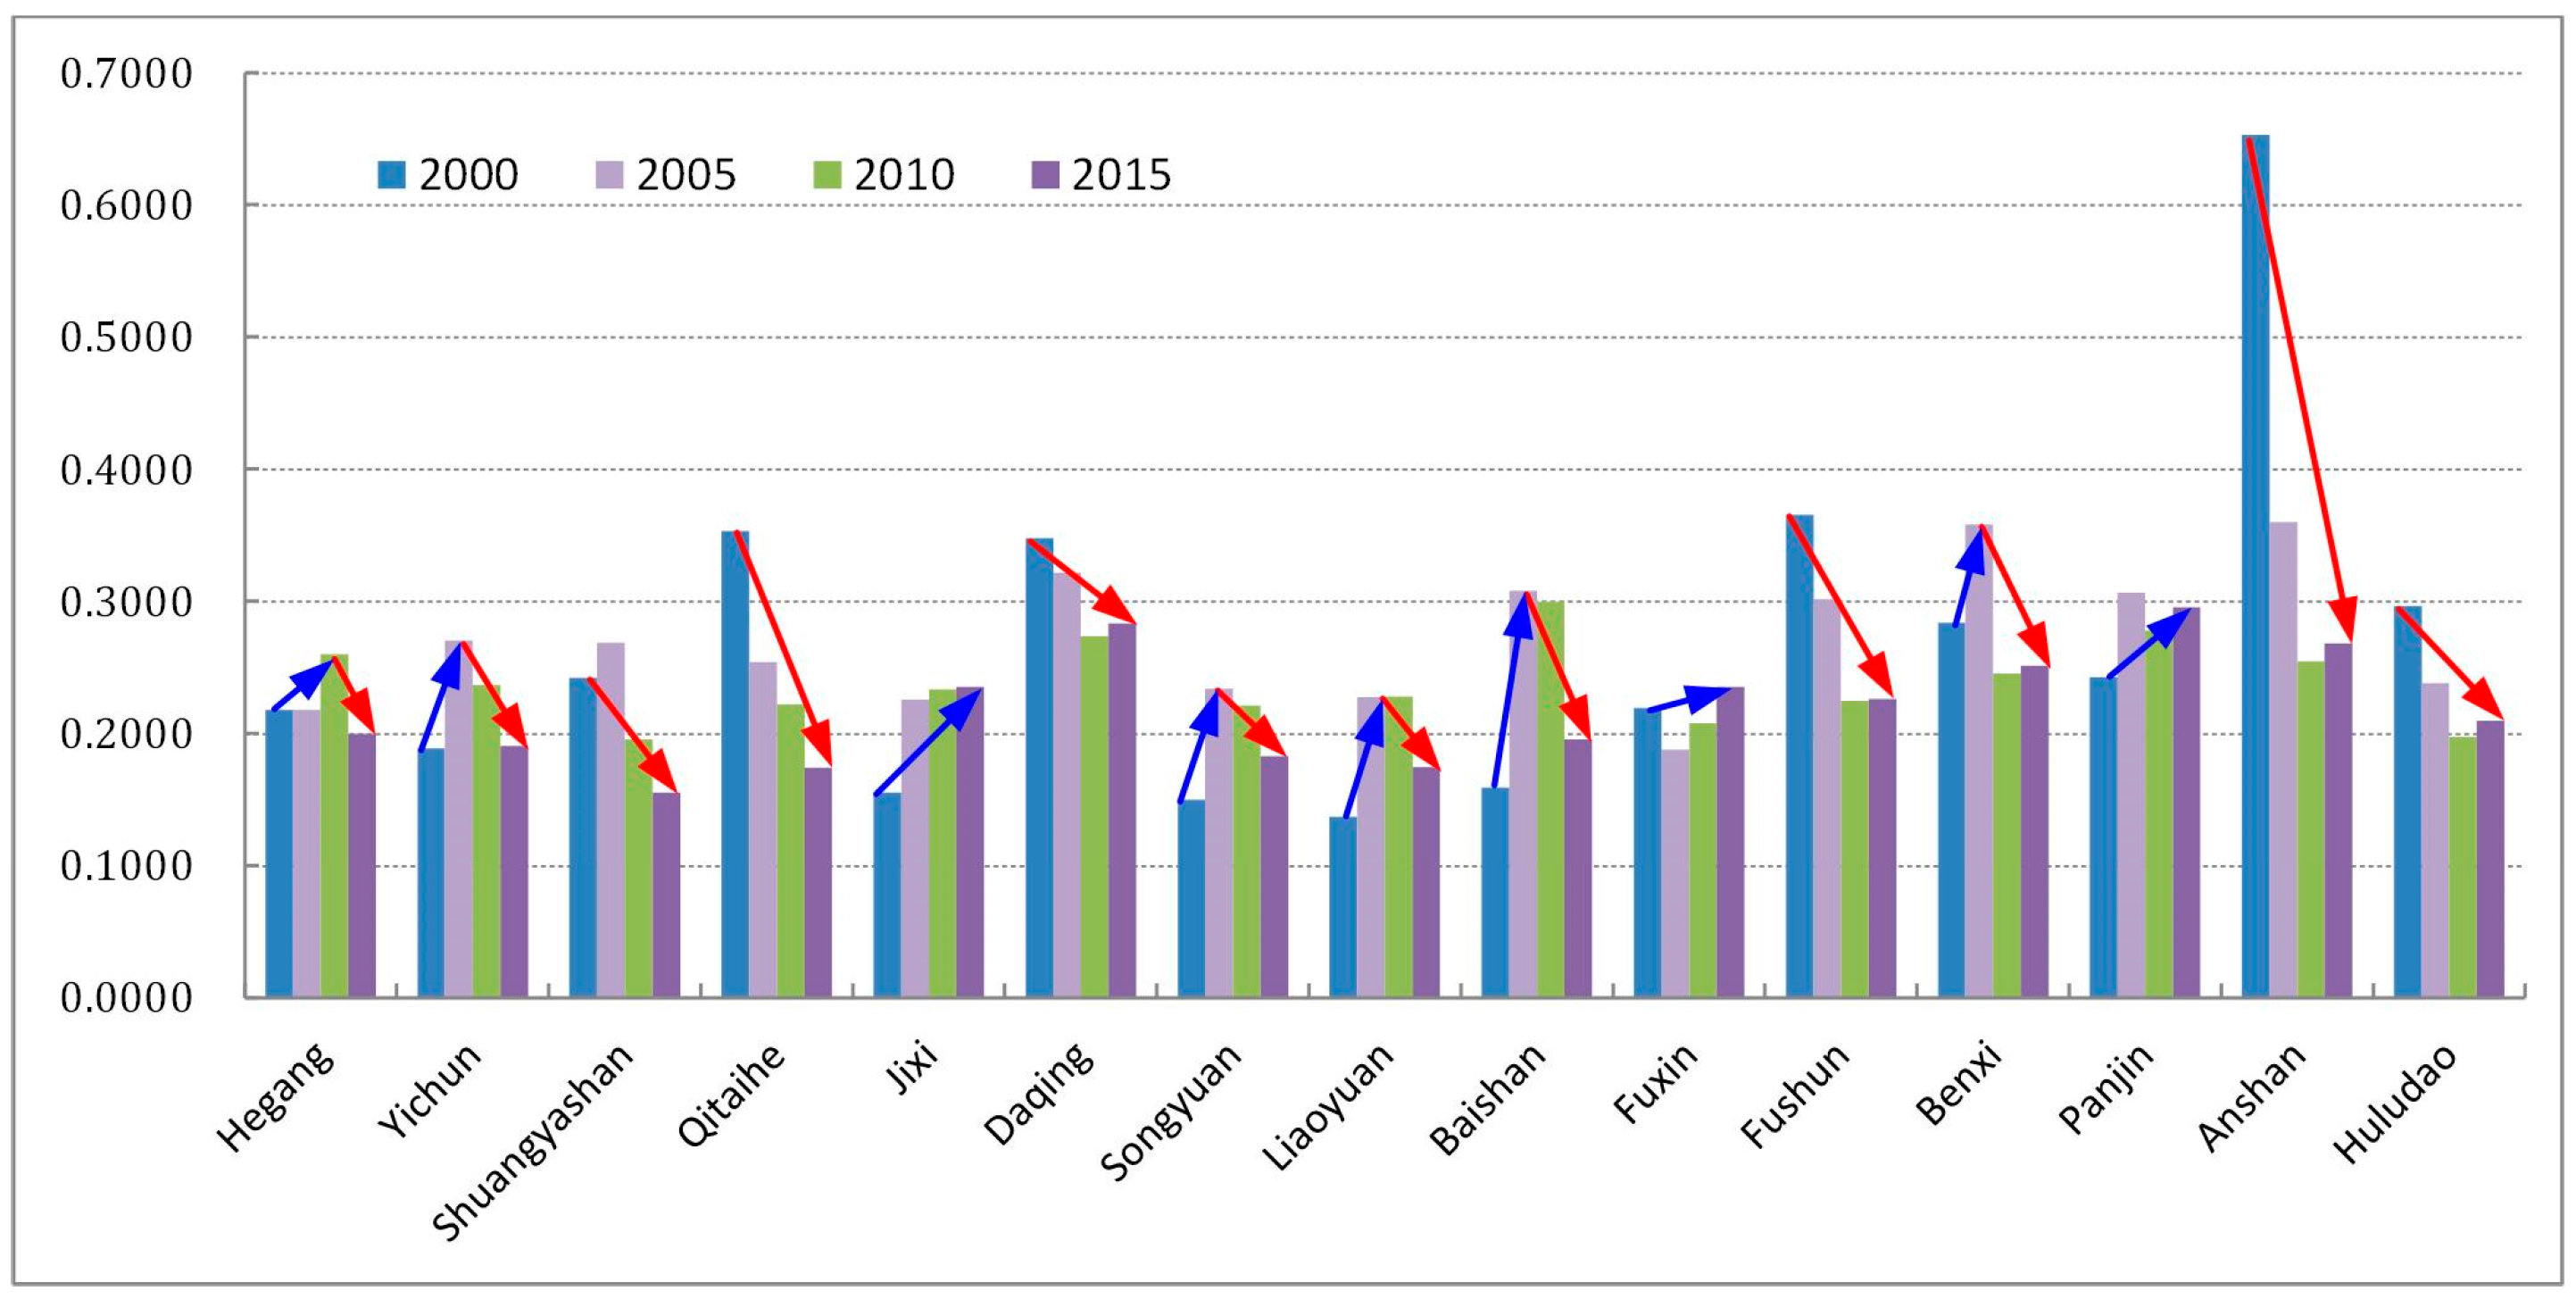
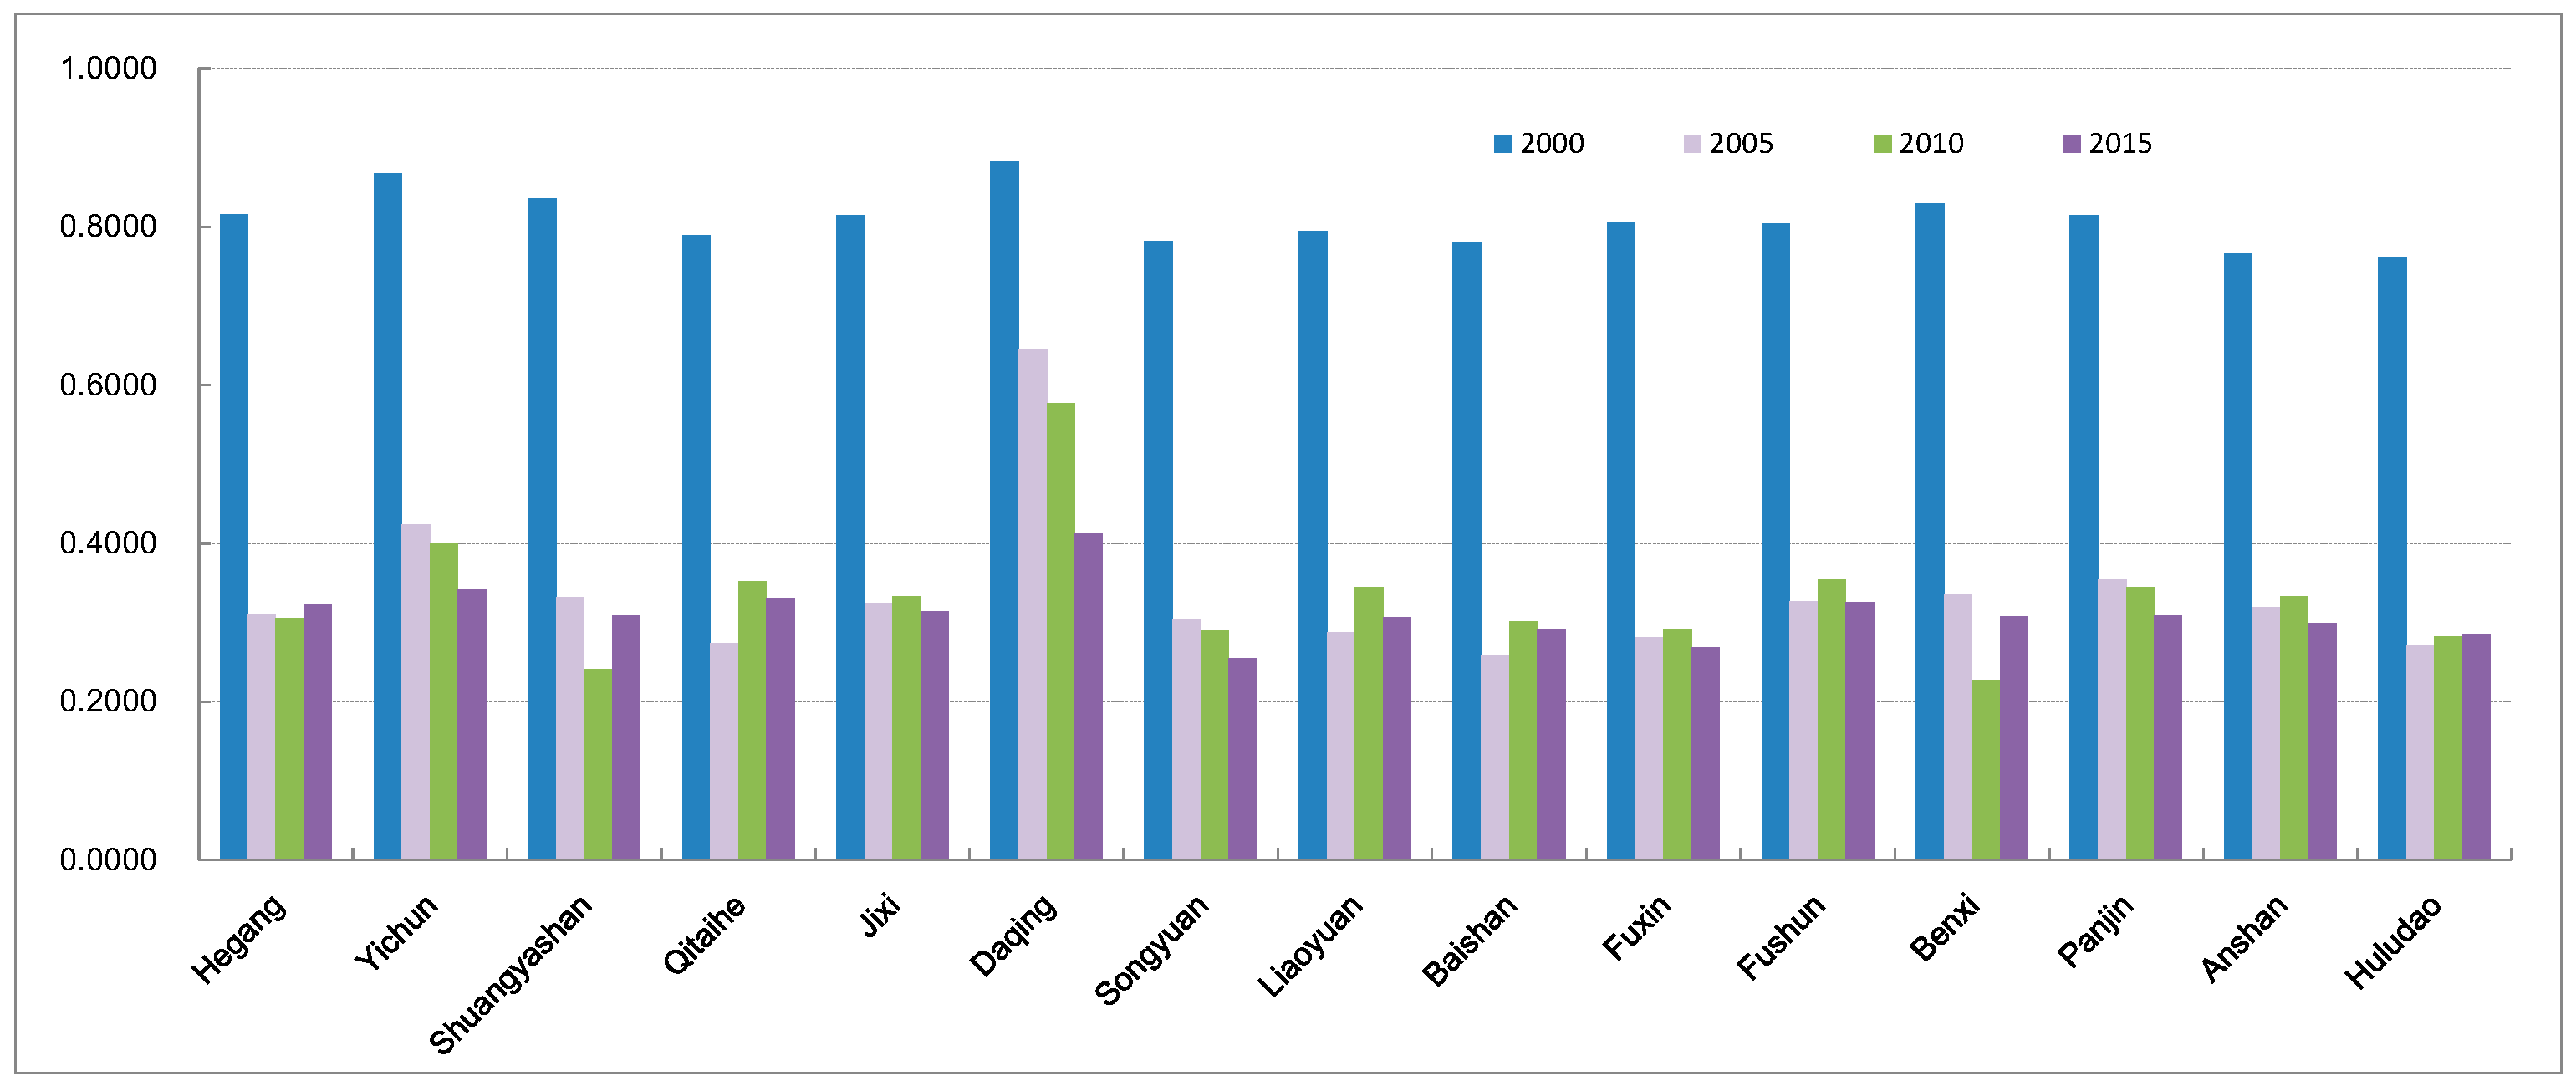
4.5. Environmental Subsystem
5. Discussions and Conclusions
Acknowledgments
Author Contributions
Conflicts of Interest
References
- Li, H.; Long, R.; Chen, H. Economic transition policies in Chinese resource-based cities: An overview of government efforts. Energy Policy 2013, 55, 251–260. [Google Scholar] [CrossRef]
- Yu, C.; de Jong, M.; Cheng, B. Getting depleted resource-based cities back on their feet again—The example of Yichun in China. J. Clean. Prod. 2016, 134, 42–50. [Google Scholar] [CrossRef]
- The State Council of China. Sustainable Development Plan for Resources-Based Cities in China (2013–2020). [File Number: State Council, 2013/43]. Available online: http://www.gov.cn/zwgk/2013-12/03/content_2540070.htm (accessed on 10 July 2016).
- CPC Central Committee and State Council. Certain Opinions Regarding the Comprehensive Revival of Old Industrial Bases Including the Northeast. 2016. Available online: http://www.gov.cn/zhengce/2016-04/26/content_5068242.htm (accessed on 10 August 2016). [Google Scholar]
- Brown, M.T.; Ulgiati, S. Emergy assessment of global renewable sources. Ecol. Model. 2016, 339, 148–156. [Google Scholar] [CrossRef]
- Xue, B.; Chen, X.; Geng, Y.; Yang, M.; Yang, F.; Hu, X. Emergy-based study on eco-economic system of arid and semi-arid region: A case of Gansu province, China. J. Arid Land 2010, 2, 207–213. [Google Scholar]
- Pan, Y.; Li, H. Sustainability evaluation of end-of-life vehicle recycling based on emergy analysis: A case study of an end-of-life vehicle recycling enterprise in China. J. Clean. Prod. 2016, 131, 219–227. [Google Scholar] [CrossRef]
- Odum, H.T. Environmental Accounting: Emergy and Environmental Decision Making; John Wiley & Sons: New York, NY, USA, 1995. [Google Scholar]
- Amaral, L.P.; Martins, N.; Gouveia, J.B. A review of emergy theory, its application and latest developments. Renew. Sustain. Energy Rev. 2016, 54, 882–888. [Google Scholar] [CrossRef]
- Gallia, A.; Giampietro, M.; Goldfinger, S.; Lazarusd, E.; Lind, D.; Saltellie, A.; Wackernageld, M.; Müller, F. Questioning the Ecological Footprint. Ecol. Indic. 2016, 69, 224–232. [Google Scholar] [CrossRef]
- Dunning, C. 230 Indicators Approved for SDG Agenda. Available online: http://www.cgdev.org/blog/230-indicators-approved-sdg-agenda (accessed on 10 August 2016).
- Liu, J. China’s road to sustainability. Science 2010, 328, 50. [Google Scholar] [CrossRef] [PubMed]
- Zhang, L.; Xu, Y.; Yeh, C.-H.; Liu, Y.; Zhou, D. City sustainability evaluation using multi-criteria decision making with objective weights of interdependent criteria. J. Clean. Prod. 2016, 131, 491–499. [Google Scholar] [CrossRef]
- Egilmez, G.; Gumus, S.; Kucukvar, M. Environmental sustainability benchmarking of the U.S. and Canada metropoles: An expert judgment-based multi-criteria decision making approach. Cities 2015, 42, 31–41. [Google Scholar] [CrossRef]
- Li, Y.; Beeton, R.J.S.; Halog, A.; Sigler, T. Evaluating urban sustainability potential based on material flow analysis of inputs and outputs: A case study in Jinchang City, China. Resour. Conserv. Recycl. 2016, 110, 87–98. [Google Scholar] [CrossRef]
- Zeng, L.; Wang, B.; Fan, L.; Wu, J. Analyzing sustainability of Chinese mining cities using an association rule mining approach. Resour. Policy 2016, 49, 394–404. [Google Scholar] [CrossRef]
- Tang, X.; Zhang, B.; Höök, M.; Feng, L. Forecast of oil reserves and production in Daqing oilfield of China. Energy 2010, 35, 3097–3102. [Google Scholar] [CrossRef]
- Fan, Z.; Huang, X.; Tan, L.; Yang, X.; Zhang, H.; Zhou, D.; Liu, Q.; Cao, B. A study of iron deposits in the Anshan area, China based on interactive inversion technique of gravity and magnetic anomalies. Ore Geol. Rev. 2014, 57, 618–627. [Google Scholar] [CrossRef]
- Hwang, C.-L.; Yoon, K. Multiple Attribute Decision Making—Methods and Applications a State-of-the-Art Survey; Springer: Berlin/Heidelberg, Germany, 1981. [Google Scholar]
- Jahanshahloo, G.R.; Lotfi, F.H.; Izadikhah, M. Extension of the TOPSIS method for decision-making problems with fuzzy data. Appl. Math. Comput. 2006, 181, 1544–1551. [Google Scholar] [CrossRef]
- Wu, K.J.; Tseng, M.L.; Chiu, A.S.F. Using the Analytical Network Process in Porter’s Five Forces Analysis–Case Study in Philippines. Procedia Soc. Behav. Sci. 2012, 57, 1–9. [Google Scholar] [CrossRef]
- Quadros, S.G.R.; Nassi, C.D. An evaluation on the criteria to prioritize transportation infrastructure investments in Brazil. Transp. Policy 2015, 40, 8–16. [Google Scholar] [CrossRef]
- Javid, J.R.; Nejat, A.; Hayhoe, K. Selection of CO2 mitigation strategies for road transportation in the United States using a multi-criteria approach. Renew. Sustain. Energy Rev. 2014, 38, 960–972. [Google Scholar] [CrossRef]
- Park, D.; Kim, Y.; Um, M.-J.; Choi, S.-U. Robust Priority for Strategic Environmental Assessment with Incomplete Information Using Multi-Criteria Decision Making Analysis. Sustainability 2015, 7, 10233–10249. [Google Scholar] [CrossRef]
- Chen, Y.; Li, K.W.; Liu, S.F. An OWA-TOPSIS method for multiple criteria decision analysis. Expert Syst. Appl. 2011, 38, 5205–5211. [Google Scholar] [CrossRef]
- Kim, G.; Park, C.S.; Yoon, K.P. Identifying investment opportunities for advanced manufacturing systems with comparative integrated performance measurement. Int. J. Prod. Econ. 1997, 50, 23–33. [Google Scholar] [CrossRef]
- Shih, H.S.; Shyur, H.H.; Lee, E.S. An extension of TOPSIS for group decision making. Math. Comput. Model. 2007, 45, 801–813. [Google Scholar] [CrossRef]
- Nădăban, S.; Dzitac, S.; IDzitac, I. Fuzzy TOPSIS: A General View. Procedia Comput. Sci. 2016, 91, 823–831. [Google Scholar] [CrossRef]
- Behzadian, M.; Otaghsara, S.K.; Yazdani, M.; Ignatius, J. A state-of the-art survey of TOPSIS applications. Expert Syst. Appl. 2012, 39, 13051–13069. [Google Scholar] [CrossRef]
- Çetinkaya, C.; Özceylan, E.; Erbas, M.; Kabak, M. GIS-based fuzzy MCDA approach for siting refugee camp: A case study for southeastern Turkey. Int. J. Disaster Risk Reduct. 2016, 18, 218–231. [Google Scholar] [CrossRef]
- Morteza, Z.; Reza, F.M.; Seddiq, M.M.; Sharareh, P.; Jamal, G. Selection of the optimal tourism site using the ANP and fuzzy TOPSIS in the framework of Integrated Coastal Zone Management: A case of Qeshm Island. Ocean Coast. Manag. 2016, 130, 179–187. [Google Scholar] [CrossRef]
- Dace, E.; Blumberga, D. How do 28 European Union Member States perform in agricultural greenhouse gas emissions? It depends on what we look at: Application of the multi-criteria analysis. Ecol. Indic. 2016, 71, 352–358. [Google Scholar] [CrossRef]
- Zhang, L.; Xue, B.; Geng, Y.; Ren, W.; Lu, C. Emergy-based city’s sustainability assessment: Indicators, features and findings. Sustainability 2014, 6, 952–966. [Google Scholar] [CrossRef]
- Lynch, A.J.; Andreason, S.; Eisenmen, T.; Robinson, J.; Stelf, K.; Birch, E.L. Sustainable Urban Development Indicators for the United States. Available online: http://penniur.upenn.edu/uploads/media/sustainable-urban-development-indicators-for-the-united-states.pdf (accessed on 1 August 2016).
- Tobias, M.; Xue, B. Sustainability in China: Bridging Global Knowledge with Local Action. Sustainability 2015, 7, 3714–3720. [Google Scholar]
- Rametsteiner, E.; Pülzl, H.; Alkan-Olsson, J.; Frederiksen, P. Sustainability indicator development—Science or political negotiation? Ecol. Indic. 2011, 11, 61–70. [Google Scholar] [CrossRef]
- Michael, F.L.; Noor, Z.Z.; Figueroa, M.J. Review of urban sustainability indicators assessment—Case study between Asian countries. Habitat Int. 2014, 44, 491–500. [Google Scholar] [CrossRef]
- Wong, C. A framework for ‘City Prosperity Index’: Linking indicators, analysis and policy. Habitat Int. 2015, 45, 3–9. [Google Scholar] [CrossRef]
- Ding, X.; Zhong, W.; Shearmur, R.G.; Zhang, X.; Huisingh, D. An inclusive model for assessing the sustainability of cities in developing countries—Trinity of Cities’ Sustainability from Spatial, Logical and Time Dimensions (TCS-SLTD). J. Clean. Prod. 2015, 109, 62–75. [Google Scholar] [CrossRef]
- UNEP. Sustainable Development Goals. Available online: https://sustainabledevelopment.un.org/sdgs (accessed on 5 August 2016).
- Liaoning Bureau of Statistics. Liaoning Provincial Statistical Yearbook (2001–2015); China Statistics Press: Beijing, China, 2001–2015. [Google Scholar]
- Jilin Bureau of Statistics. Jilin Provincial Statistical Yearbook (2001–2015); China Statistics Press: Beijing, China, 2001–2015. [Google Scholar]
- Heilongjiang Bureau of Statistics. Heilongjiang Provincial Statistical Yearbook (2001–2015); China Statistics Press: Beijing, China, 2001–2015. [Google Scholar]
- Grimm, N.B.; Faeth, S.H.; Golubiewski, N.E.; Redman, C.L.; Wu, J.; Bai, X.; Briggs, J.M. Global change and the ecology of cities. Science 2008, 319, 756–760. [Google Scholar] [CrossRef] [PubMed]
- Pani, N. Resource cities across phases of globalization: Evidence from Bangalore. Habitat Int. 2009, 33, 114–119. [Google Scholar] [CrossRef]
- He, S.Y.; Lee, J.; Zhou, T.; Wu, D. Shrinking cities and resource-based economy: The economic restructuring in China’s mining cities. Cities 2017, 60, 75–83. [Google Scholar] [CrossRef]
- Dong, S.; Li, Z.; Li, B.; Xue, M. Problems and strategies of industrial transformation of China’s resource-based cities. China Population. Resour. Environ. 2007, 17, 12–17. [Google Scholar]
- Grabher, G. The weakness of strong ties: The lock-in of regional development in the Ruhr area. In The Embedded Firm: On the Socioeconomics of Industrial Networks; Grabher, G., Ed.; Routledge: London, UK; New York, NY, USA, 1993; pp. 255–277. [Google Scholar]
- The State Council. Opinions on Promoting the Sustainable Development of Resources-Based Cities. Available online: http://www.gov.cn/zwgk/2013-12/03/content_2540070.htm (accessed on 10 August 2016). (In Chinese)
- The Central Committee of the Communist Party of China and the State Council. Opinions on the Strategy of Revitalizing Northeast China and Other Old Industrial Bases. Available online: http://www.chinabaike.com/law/zy/0978/1419299.html (accessed on 10 August 2016). (In Chinese)
- National Development and Reform Commission. Plan of Revitalizing Northeast China. Available online: http://www.sdpc.gov.cn/fzgggz/fzgh/ghwb/gjjgh/200709/P020150630514153248052.pdf (accessed on 10 August 2016). (In Chinese)
- Xue, B. Honing the Climate Change Message. Science 2015, 348, 872. [Google Scholar] [CrossRef] [PubMed]
- Xue, B.; Mitchell, B.; Geng, Y.; Ren, W.; Müller, K.; Ma, Z.; de Oliveira, J.A.P.; Fujita, T.; Tobias, M. A review on China’s pollutant emissions reduction assessment. Ecol. Indic. 2014, 38, 272–278. [Google Scholar] [CrossRef]


| Province | Case Cities | Main Resources (Reserves, Unit) a | Population (104) | Area (km2) | Per-Capita GDP (US Dollar) b |
|---|---|---|---|---|---|
| Heilongjiang | Hegang | Coal (3 bt); Graphite (600 mt) | 110 | 14,784 | 3941 |
| Yichun | Gold (120 t); Iron ore (3.16 mt) | 121 | 39,017 | 3288 | |
| Shuangyashan | Coal (11.7 bt); Magnetite (120 mt) | 147 | 22,483 | 4719 | |
| Qitaihe | Marble (140 mt); Ineral resources (2.2 bt) | 93 | 6221 | 3810 | |
| Jixi | Coal (6.4 bt); Graphite (490 mt) | 181 | 23,040 | 4561 | |
| Daqing | Oil (8–10 bt); Natural gas (858–4290 bm3) | 293 | 22,161 | 16,329 | |
| Jilin | Songyuan | Oil shale (77.5 bt) | 278 | 22,000 | 9095 |
| Liaoyuan | Coal (0.17 bt); Limestone (35 mt) | 121 | 5125 | 9928 | |
| Baishan | Coal (38 mt); Diatomite (42 mt); Dolomite (30 mt) | 125 | 17,485 | 8807 | |
| Liaoning | Fuxin | Coal (1 bt) | 189 | 10,445 | 4884 |
| Fushun | Coal (1.42 bt); Iron ore (234 mt) | 216 | 11,271 | 9401 | |
| Benxi | Iron ore (2.7 bt); Limestone (210 mt); Solvent (130 mt) | 151 | 8413 | 10,862 | |
| Panjin | Oil (2.1 bt); Natural gas (178 bm3) | 129 | 4084 | 14,152 | |
| Anshan | Iron ore (7.54 bt); Magnetite (3.37 bt); | 346 | 9252 | 10,866 | |
| Huludao | Coal (380 mt); Molybdenum (310 mt) | 280 | 10,302 | 4524 |
| Comprehensive Layer | System Layer | Indicator Layer (Indicator, [Code]) | Unit | Index Properties |
|---|---|---|---|---|
| Sustainability | Economic subsystem | GDP growth rate [C1] | % | Positive |
| Per capita GDP [C2] | Yuan/per capita | Positive | ||
| Per capita revenues [C3] | Yuan/per capita | Positive | ||
| Total retail sales of consumer goods [C4] | Billion | Positive | ||
| Gross fixed asset formation [C5] | Billion | Positive | ||
| Output value of farming, forestry, husbandry, and fishery [C6] | Million | Positive | ||
| Secondary industry production per GDP [C7] | % | Positive | ||
| Tertiary industry production per GDP [C8] | % | Positive | ||
| Total export-import volume [C9] | USD | Positive | ||
| Social subsystem | Registered urban unemployment rate [C10] | % | Negative | |
| Natural population growth rate [C11] | ‰ | Positive | ||
| Urban per capita disposable income [C12] | Yuan | Positive | ||
| Investment in environmental protection as a proportion of GDP [C13] | % | Positive | ||
| Personnel in population health institutions [C14] | Person/104 people | Positive | ||
| Average number of beds per million people [C15] | Piece | Positive | ||
| Education spending [C16] | Million | Positive | ||
| Technology spending [C17] | Million | Positive | ||
| Environmental subsystem | Ratio green coverage of built up areas [C18] | ha | Positive | |
| Per capita green area [C19] | m2 | Positive | ||
| Industrial wastewater effluent [C20] | % | Negative | ||
| Industrial SO2 emissions [C21] | T | Negative | ||
| Industrial smoke and dust emissions [C22] | T | Negative |
| Indicator’s Code | Weight Value | |||
|---|---|---|---|---|
| 2000 | 2005 | 2010 | 2015 | |
| C1 | 0.0141 | 0.0312 | 0.0342 | 0.0180 |
| C2 | 0.0567 | 0.0607 | 0.0483 | 0.0514 |
| C3 | 0.0960 | 0.0448 | 0.0462 | 0.0544 |
| C4 | 0.0798 | 0.0800 | 0.0759 | 0.0767 |
| C5 | 0.0656 | 0.0896 | 0.0738 | 0.0747 |
| C6 | 0.0516 | 0.0503 | 0.0460 | 0.0516 |
| C7 | 0.0336 | 0.0283 | 0.0209 | 0.0246 |
| C8 | 0.0149 | 0.0176 | 0.0193 | 0.0179 |
| C9 | 0.1639 | 0.1485 | 0.1392 | 0.1346 |
| C10 | 0.0123 | 0.0230 | 0.1945 | 0.0196 |
| C11 | 0.0264 | 0.0219 | 0.0290 | 0.0254 |
| C12 | 0.0177 | 0.028 | 0.0286 | 0.0470 |
| C13 | 0.0540 | 0.0365 | 0.0403 | 0.0350 |
| C14 | 0.0180 | 0.0223 | 0.0250 | 0.0250 |
| C15 | 0.0259 | 0.0249 | 0.0240 | 0.0219 |
| C16 | 0.0670 | 0.0623 | 0.0510 | 0.0581 |
| C17 | 0.0795 | 0.0810 | 0.1187 | 0.1195 |
| C18 | 0.0458 | 0.0526 | 0.0612 | 0.0603 |
| C19 | 0.0297 | 0.0419 | 0.0421 | 0.0340 |
| C20 | 0.0120 | 0.0110 | 0.0116 | 0.0105 |
| C21 | 0.0162 | 0.0203 | 0.0278 | 0.0194 |
| C22 | 0.0193 | 0.0222 | 0.0180 | 0.0198 |
| Cities | 2000 | 2005 | 2010 | 2015 |
|---|---|---|---|---|
| Hegang | 0.1830 | 0.1671 | 0.1935 | 0.1587 |
| Yichun | 0.1951 | 0.1890 | 0.1898 | 0.1651 |
| Shuangyashan | 0.1988 | 0.1801 | 0.1553 | 0.1366 |
| Qitaihe | 0.2515 | 0.1934 | 0.2270 | 0.1544 |
| Jixi | 0.1620 | 0.1679 | 0.1865 | 0.1779 |
| Daqing | 0.5211 | 0.3457 | 0.3141 | 0.3232 |
| Songyuan | 0.1607 | 0.1909 | 0.2111 | 0.1790 |
| Liaoyuan | 0.1448 | 0.1804 | 0.1975 | 0.1708 |
| Baishan | 0.1581 | 0.1974 | 0.2181 | 0.1786 |
| Fuxin | 0.1817 | 0.1474 | 0.1813 | 0.1832 |
| Fushun | 0.2806 | 0.2112 | 0.2205 | 0.2113 |
| Benxi | 0.2512 | 0.2460 | 0.2330 | 0.2354 |
| Panjin | 0.2775 | 0.2593 | 0.2993 | 0.2798 |
| Anshan | 0.4375 | 0.2770 | 0.2702 | 0.2517 |
| Huludao | 0.2257 | 0.1710 | 0.1676 | 0.1740 |
| Cities | 2000 | 2005 | 2010 | 2015 |
|---|---|---|---|---|
| Hegang | 0.0665 | 0.1074 | 0.0980 | 0.0492 |
| Yichun | 0.0758 | 0.0832 | 0.0666 | 0.0887 |
| Shuangyashan | 0.0607 | 0.0894 | 0.1042 | 0.0548 |
| Qitaihe | 0.0813 | 0.1512 | 0.2035 | 0.0808 |
| Jixi | 0.0725 | 0.0998 | 0.1027 | 0.0673 |
| Daqing | 0.4076 | 0.3210 | 0.2844 | 0.2947 |
| Songyuan | 0.0897 | 0.1501 | 0.1709 | 0.1501 |
| Liaoyuan | 0.0633 | 0.1360 | 0.1272 | 0.1349 |
| Baishan | 0.0795 | 0.1219 | 0.1143 | 0.1379 |
| Fuxin | 0.0765 | 0.0997 | 0.1378 | 0.1171 |
| Fushun | 0.1274 | 0.1514 | 0.1909 | 0.1816 |
| Benxi | 0.1160 | 0.1782 | 0.2099 | 0.2142 |
| Panjin | 0.1964 | 0.2257 | 0.3025 | 0.2657 |
| Anshan | 0.1911 | 0.2366 | 0.2686 | 0.2333 |
| Huludao | 0.1086 | 0.1200 | 0.1147 | 0.1194 |
| Cities | 2000 | 2005 | 2010 | 2015 |
|---|---|---|---|---|
| Hegang | 0.2182 | 0.2180 | 0.2598 | 0.1999 |
| Yichun | 0.1887 | 0.2703 | 0.2365 | 0.1906 |
| Shuangyashan | 0.2421 | 0.2685 | 0.1958 | 0.1555 |
| Qitaihe | 0.3532 | 0.2540 | 0.2220 | 0.1740 |
| Jixi | 0.1556 | 0.2256 | 0.2336 | 0.2354 |
| Daqing | 0.3476 | 0.3219 | 0.2738 | 0.2831 |
| Songyuan | 0.1498 | 0.2339 | 0.2211 | 0.1826 |
| Liaoyuan | 0.1371 | 0.2277 | 0.2281 | 0.1744 |
| Baishan | 0.1591 | 0.3080 | 0.2996 | 0.1957 |
| Fuxin | 0.2196 | 0.1879 | 0.2078 | 0.2353 |
| Fushun | 0.3654 | 0.3014 | 0.2250 | 0.2264 |
| Benxi | 0.2838 | 0.3580 | 0.2454 | 0.2512 |
| Panjin | 0.2429 | 0.3066 | 0.2778 | 0.2954 |
| Anshan | 0.6529 | 0.3598 | 0.2545 | 0.2682 |
| Huludao | 0.2967 | 0.2382 | 0.1973 | 0.2098 |
| Cities | 2000 | 2005 | 2010 | 2015 |
|---|---|---|---|---|
| Hegang | 0.8151 | 0.3113 | 0.3052 | 0.3231 |
| Yichun | 0.8673 | 0.4241 | 0.3994 | 0.3426 |
| Shuangyashan | 0.8356 | 0.3319 | 0.2409 | 0.3087 |
| Qitaihe | 0.7888 | 0.2737 | 0.3516 | 0.3315 |
| Jixi | 0.8147 | 0.3240 | 0.3325 | 0.3135 |
| Daqing | 0.8829 | 0.6450 | 0.5769 | 0.4129 |
| Songyuan | 0.7823 | 0.3030 | 0.2910 | 0.2540 |
| Liaoyuan | 0.7943 | 0.2874 | 0.3444 | 0.3066 |
| Baishan | 0.7803 | 0.2591 | 0.3013 | 0.2915 |
| Fuxin | 0.8052 | 0.2809 | 0.2917 | 0.2680 |
| Fushun | 0.8039 | 0.3259 | 0.3536 | 0.3256 |
| Benxi | 0.8295 | 0.3350 | 0.2277 | 0.3069 |
| Panjin | 0.8149 | 0.3549 | 0.3452 | 0.3090 |
| Anshan | 0.7656 | 0.3187 | 0.3330 | 0.2989 |
| Huludao | 0.7603 | 0.2709 | 0.2821 | 0.2850 |
| Layers | Extremely Low | Low | Medium | Upper Medium | High |
|---|---|---|---|---|---|
| Comprehensive | (0, 0.1] | (0.1, 0.2] | (0.2, 0.3] | (0.3, 0.4] | (0.4, 1] |
| economic subsystem | (0, 0.1] | (0.1, 0.2] | (0.2, 0.3] | (0.3, 0.4] | (0.4, 1] |
| Social subsystem | (0, 0.1] | (0.1, 0.2] | (0.2, 0.3] | (0.3, 0.4] | (0.4, 1] |
| Environmental subsystem | (0, 0.2] | (0.2, 0.4] | (0.4, 0.6] | (0.6, 0.8] | (0.8, 1] |
© 2016 by the authors; licensee MDPI, Basel, Switzerland. This article is an open access article distributed under the terms and conditions of the Creative Commons Attribution (CC-BY) license (http://creativecommons.org/licenses/by/4.0/).
Share and Cite
Lu, C.; Xue, B.; Lu, C.; Wang, T.; Jiang, L.; Zhang, Z.; Ren, W. Sustainability Investigation of Resource-Based Cities in Northeastern China. Sustainability 2016, 8, 1058. https://doi.org/10.3390/su8101058
Lu C, Xue B, Lu C, Wang T, Jiang L, Zhang Z, Ren W. Sustainability Investigation of Resource-Based Cities in Northeastern China. Sustainability. 2016; 8(10):1058. https://doi.org/10.3390/su8101058
Chicago/Turabian StyleLu, Chengpeng, Bing Xue, Chenyu Lu, Ting Wang, Lu Jiang, Zilong Zhang, and Wanxia Ren. 2016. "Sustainability Investigation of Resource-Based Cities in Northeastern China" Sustainability 8, no. 10: 1058. https://doi.org/10.3390/su8101058