Article

Rubber Plantation Expansion Related Land Use Change along the Laos-China Border Region

1
Research & Development Center for Grass and Environment, Beijing Academy of Agricultural and Forestry Sciences, Beijing 100097, China
2
Institute of Geographic Sciences and Natural Resources Research, Chinese Academy of Sciences, Beijing 100101, China
*
Author to whom correspondence should be addressed.
Sustainability 2016, 8(10), 1011; https://doi.org/10.3390/su8101011
Submission received: 16 June 2016 / Revised: 24 September 2016 / Accepted: 27 September 2016 / Published: 11 October 2016
(This article belongs to the Section Environmental Sustainability and Applications)

Abstract

:
Spatial-temporal changes of land use and land cover in Luang Namtha Province in northern part of Laos was analyzed using Landsat TM (Thematic Mapper)/ETM+ (Enhanced Thematic Mapper) images from 1990 to 2010 since the opening of the Boten border adjacent to China. The results showed that: (1) “forest land—cultivated land—grassland” was the primary landscape structure. Woodland was the major land cover type, while paddy field was the dominant land use type replaced by rubber plantation in 2010; (2) since the opening of the border crossings in 1994, the rate and intensity of land use change were accelerated and enhanced gradually, especially in the recent decade. Woodland decreased significantly, while shrubland, rubber plantation and swidden land increased obviously. Rubber plantation and swidden land showed the fastest growth derived from woodland and shrubland, indicating continuous human activities and slash-and-burn farming; and (3) during 1990–2010, swidden land was mainly located in northern mountainous areas with frequently increased changing spatial distribution in the recent decade. Rubber plantation was mainly distributed in the border region of China and Laos with the expansion from the border region into the non-frontier of Laos with Luang Namtha City as the center. Woodland reduction was so obvious along the Kunming-Bangkok highway.

1. Introduction

Land use and land cover change (LUCC) is one of the important focuses in the area of global environmental change research because it is not only the significant component but also the major reason of global changes [1,2]. Currently, LUCC is focusing on key areas, which have the important strategic roles in global changes (e.g., tropical rainforest), hot spots, which have active artificial and natural driving force (e.g., Beijing City), and vulnerable regions that have the fragile ecological environment features (e.g., ecotone between agriculture and animal husbandry) [3]. Along with the openness of neighboring countries and the enhancement of economic trade, border regions with geopolitical and geo-economic advantages with a special role in the international political and economic environment undergo dramatic LUCC, which significantly influences border security and ecological security. Therefore, border regions have undoubtedly become the hot and critical areas for LUCC research. It is of great academic and practical significance for studying LUCC in the frontier regions [4,5].
LUCC is a complex process subjected to the interactions between natural and social systems at different spatial and temporal scales. Border regions usually with homogenous natural landscape but different socio-economic systems have gained much attention in the field of LUCC studies, such as land cover and landscape pattern change in the trans-boundary areas of Eastern Europe [6], quantitative estimates of land cover in Israel-Egypt border arid regions [7], LUCC and ecological security in the trans-boundary China-North Korea [8], and LUCC and its environmental effects in the border region of China, Laos, Myanmar [4,9,10,11]. With the opening up of the border in northern Laos, multiple geo-economic cooperation mechanisms were launched, including the “Golden Economic Quadrangle Region” in the borders of China, Laos, Myanmar and Thailand in 1993, and the China-ASEAN (Association of Southeast Asian Nations) Free Trade Area in 2010, etc. Therefore, LUCC in northern Laos becomes increasingly extensive and dramatic [12]. Regional major economies influence the mode of trade, the movement of people, as well as local farming systems and livelihoods in northern Laos [13]. Specifically, land use in northern Laos is likely to be affected by the improvement of Road Number 3 (R3), or the international economic corridor called as the Kunming-Bangkok Highway [5,12]. The rate and intensity of land use change are accelerated and enhanced gradually after that highway construction [12,14]. Roads and paved highways provide an economic impetus for industrial logging, agribusiness, mining, and tourism, which are the main driving forces of LUCC in tropical rainforests [15].
LUCC is driven by synergetic factor combinations of resource scarcity, changing opportunities created by markets, external policy intervention, loss of adaptive capacity, and changes in social organization and attitudes [16]. Alternatively, large-scale plantation and intensive agricultural projects increase migrant involvement with commercial cultivation, often at the expense of indigenous people near the forest frontier, where land conflicts follow exist [17,18]. For centuries, swidden cultivation (also referred as shifting or slash-and-burn cultivation), being a rational economic and environmental choice for farmers, has been one of the most important land use systems in the humid tropical uplands [19,20]. Northern Laos severely restricted geographically and socioeconomically was the main distribution area of that farming method [21,22]. Since the implementation of REDD (Reducing Emissions from Deforestation in Developing countries) by the United Nations, an increasing attention has been given to swidden agriculture in the humid tropics nationally and internationally. The dominant land categories are forest land and grassland in northern Laos [23], and rainfed paddy predominates in agricultural land. However upland rice cultivation through swiddening accounts for 48.9% of rice fields [24]. Tropical deforestation is largely driven by changing economic factors, which are linked to social, political, and infrastructural changes [25,26,27]. Furthermore, it is negatively correlated with population growth, poverty, and swidden cultivation [28,29]. The area of traditional upland agriculture and swidden farming has decreased, while permanent intensive agriculture has increased, and commercial agricultural production of cash crops rose at the expense of subsistence agricultural production [30]. The most extensive and rapid change in the uplands of northern Laos is the expansion of smallholder rubber plantation, encouraged by governmental land use policy, which is a result of increasing integration with the regional economies of Southeast Asia, particularly southern China [31]. Much of the upland areas that have been converted to rubber plantation in the region are historically associated with swidden cultivation [25,32,33]. Rubber plantation was established in 1994 in Luang Namtha Province, and displayed a rapid pace since 2003 in responding to high rubber prices due to the growth in demand from China [34]. The area of forest land decreased greatly, and followed by bamboo and grassland. However, the area of unstocked forest, slash and burn and rice paddy land increased in the trans-boundary Laos-China Biodiversity Conservation Area that is called the Namha National Biodiversity Conservation Areas [11].
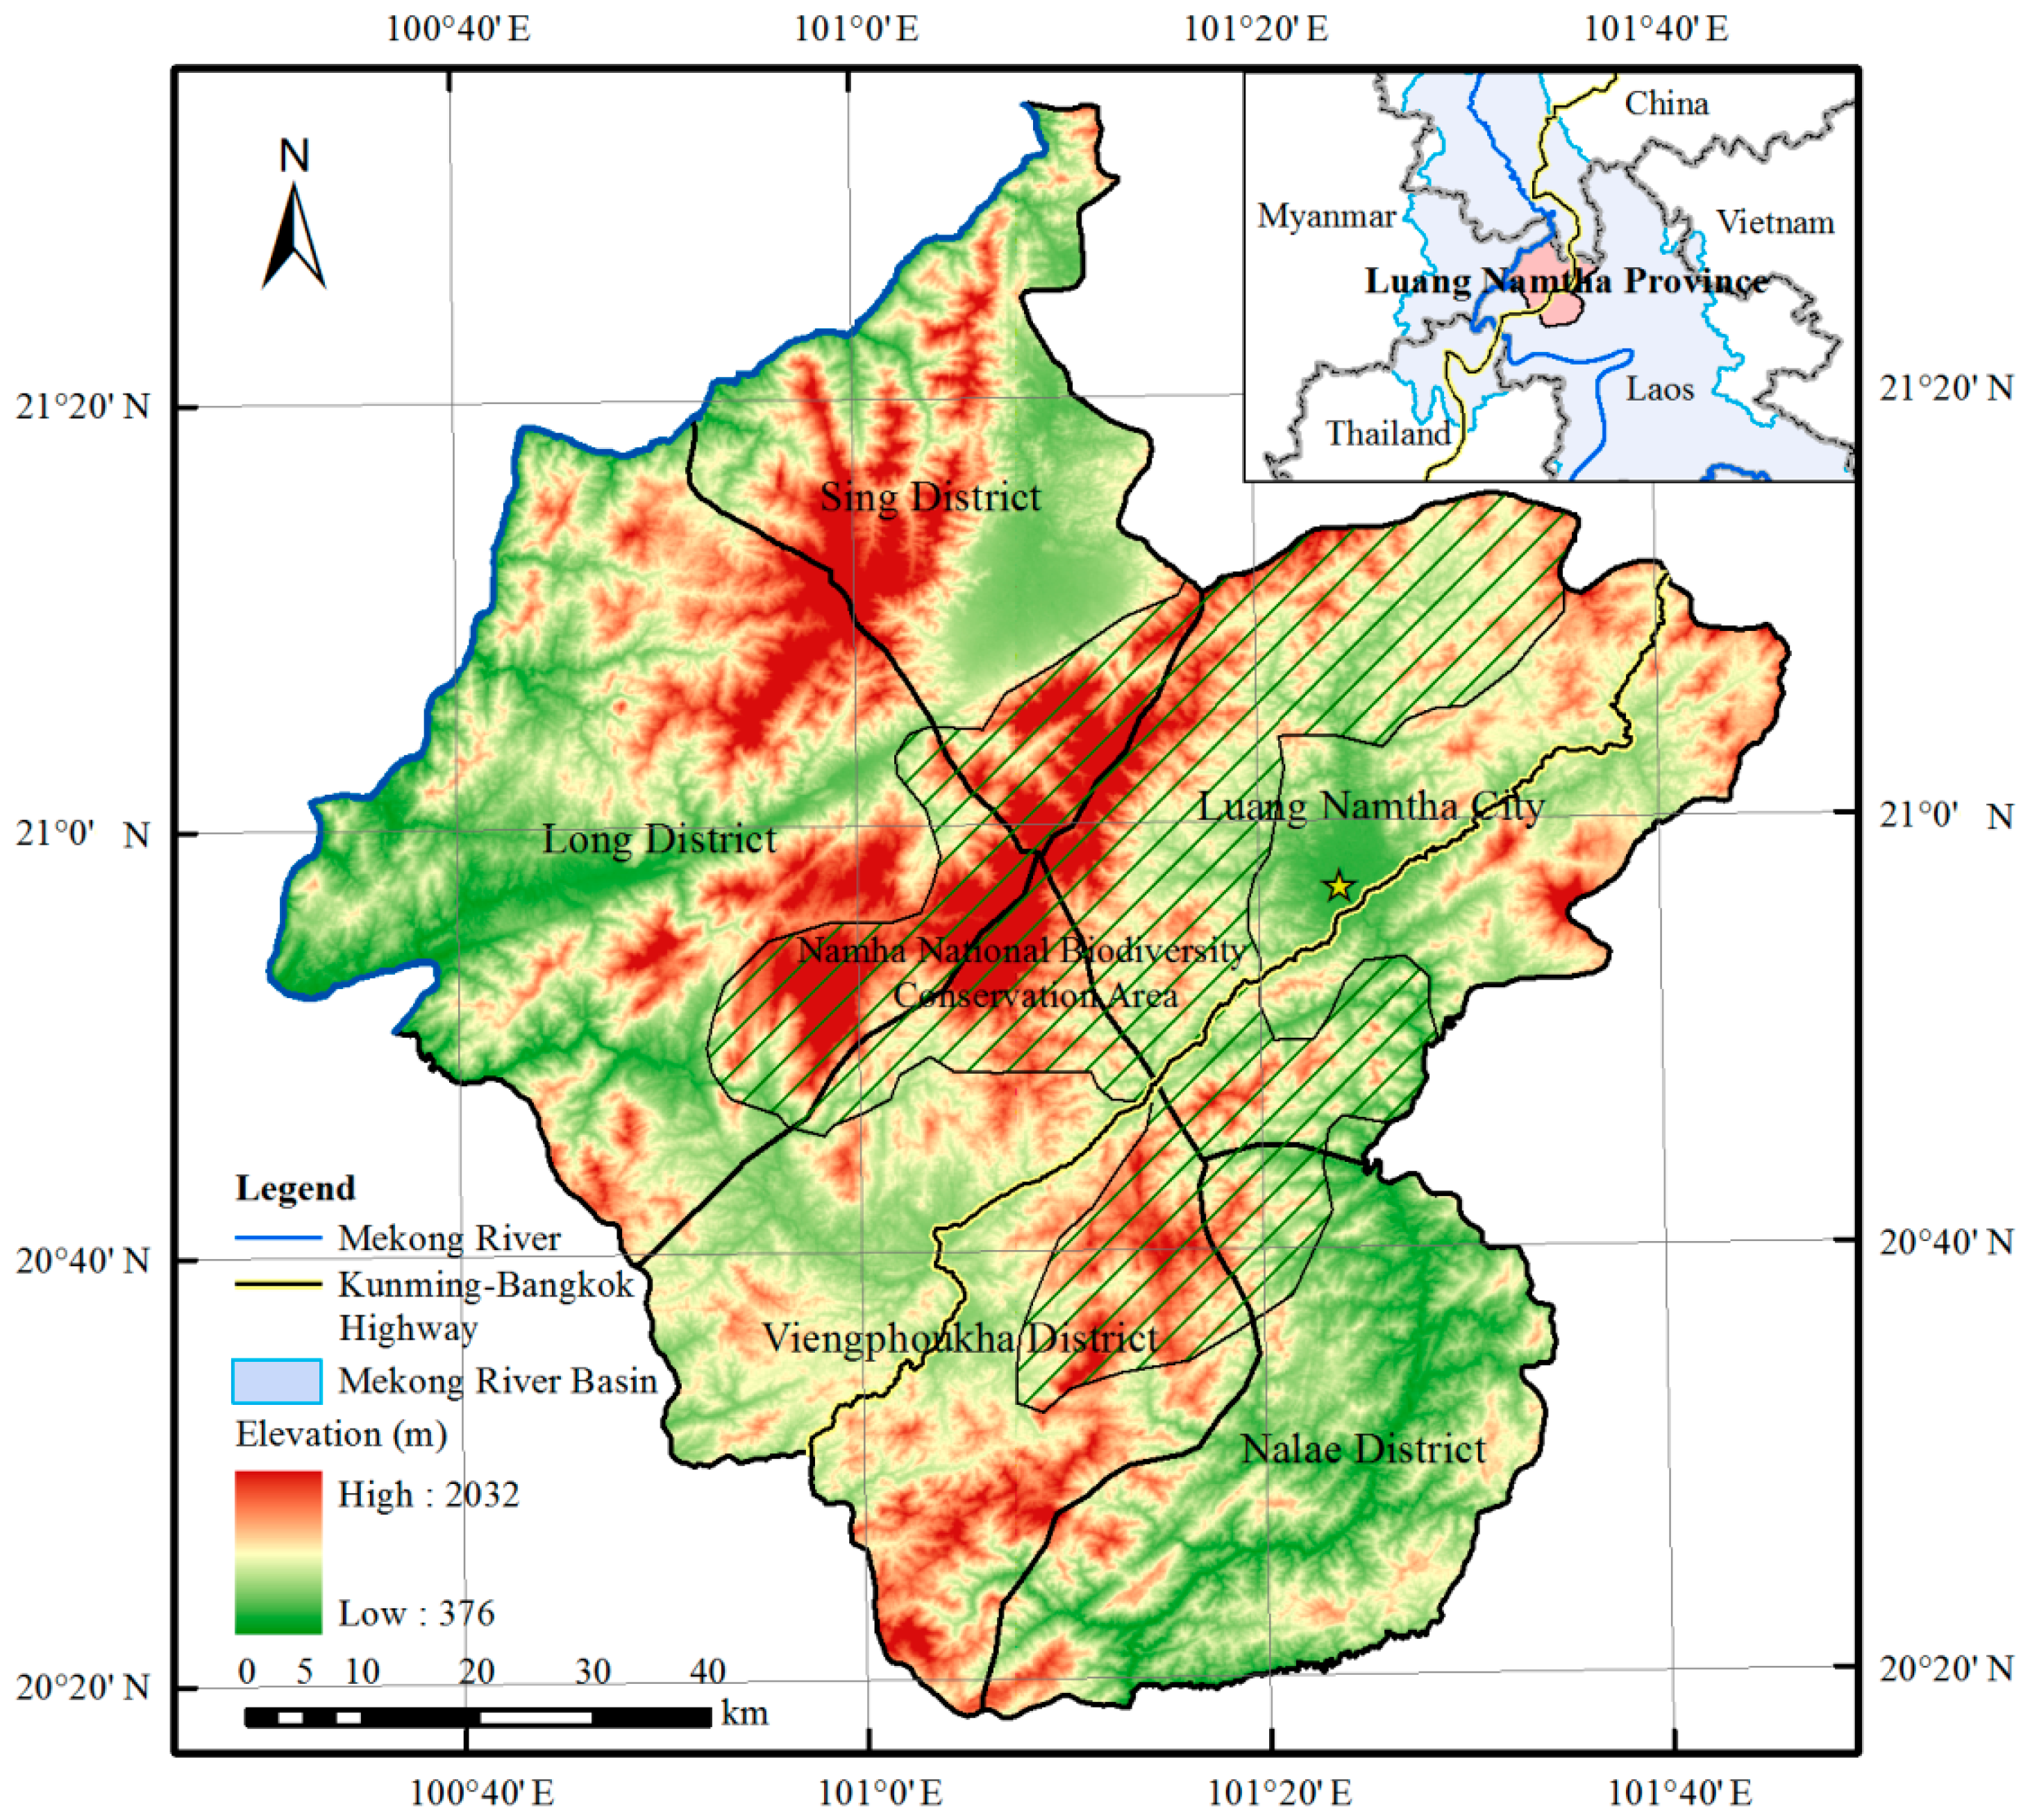
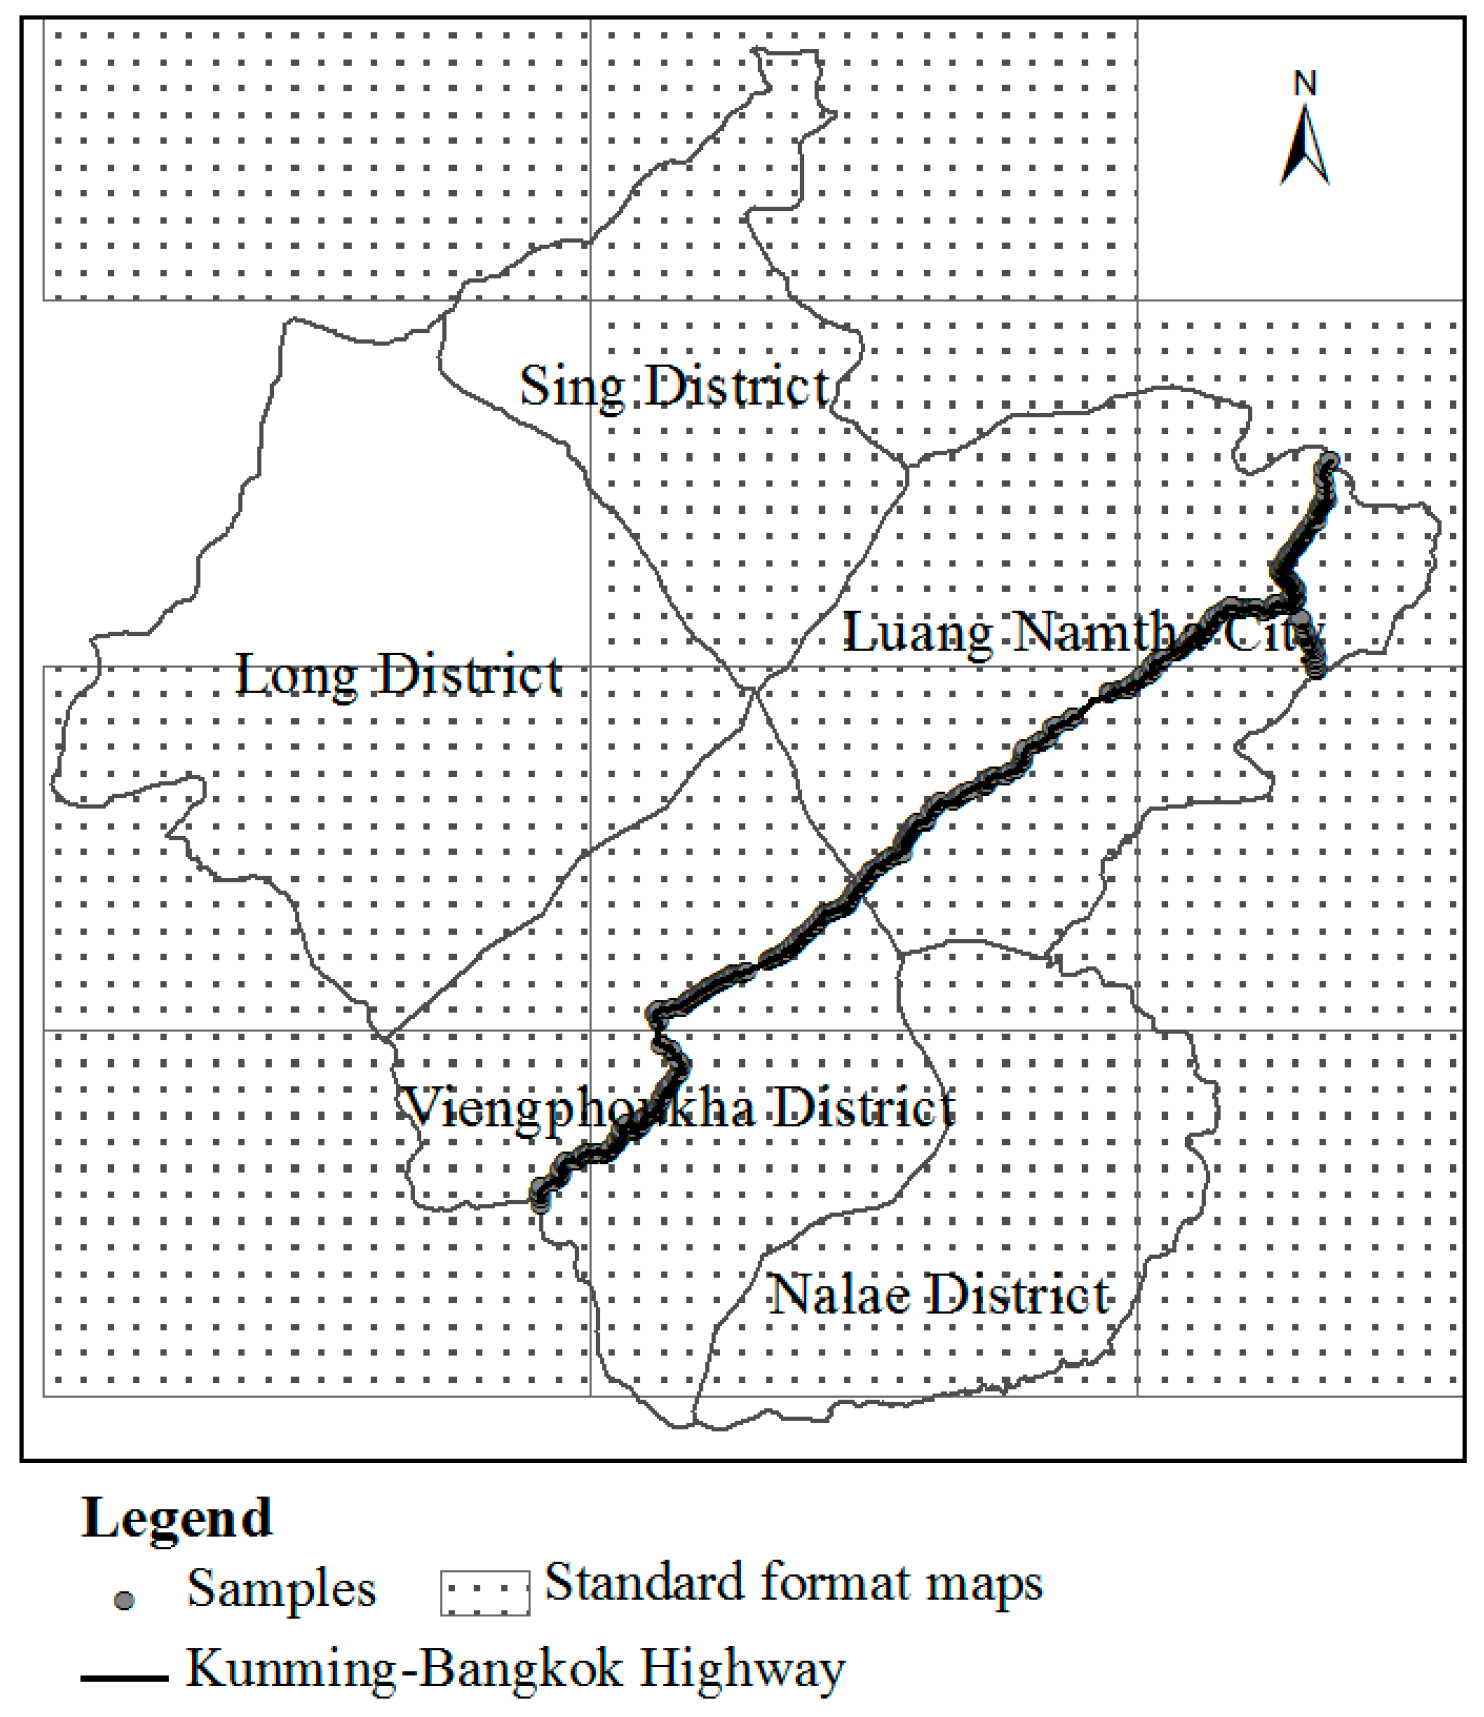
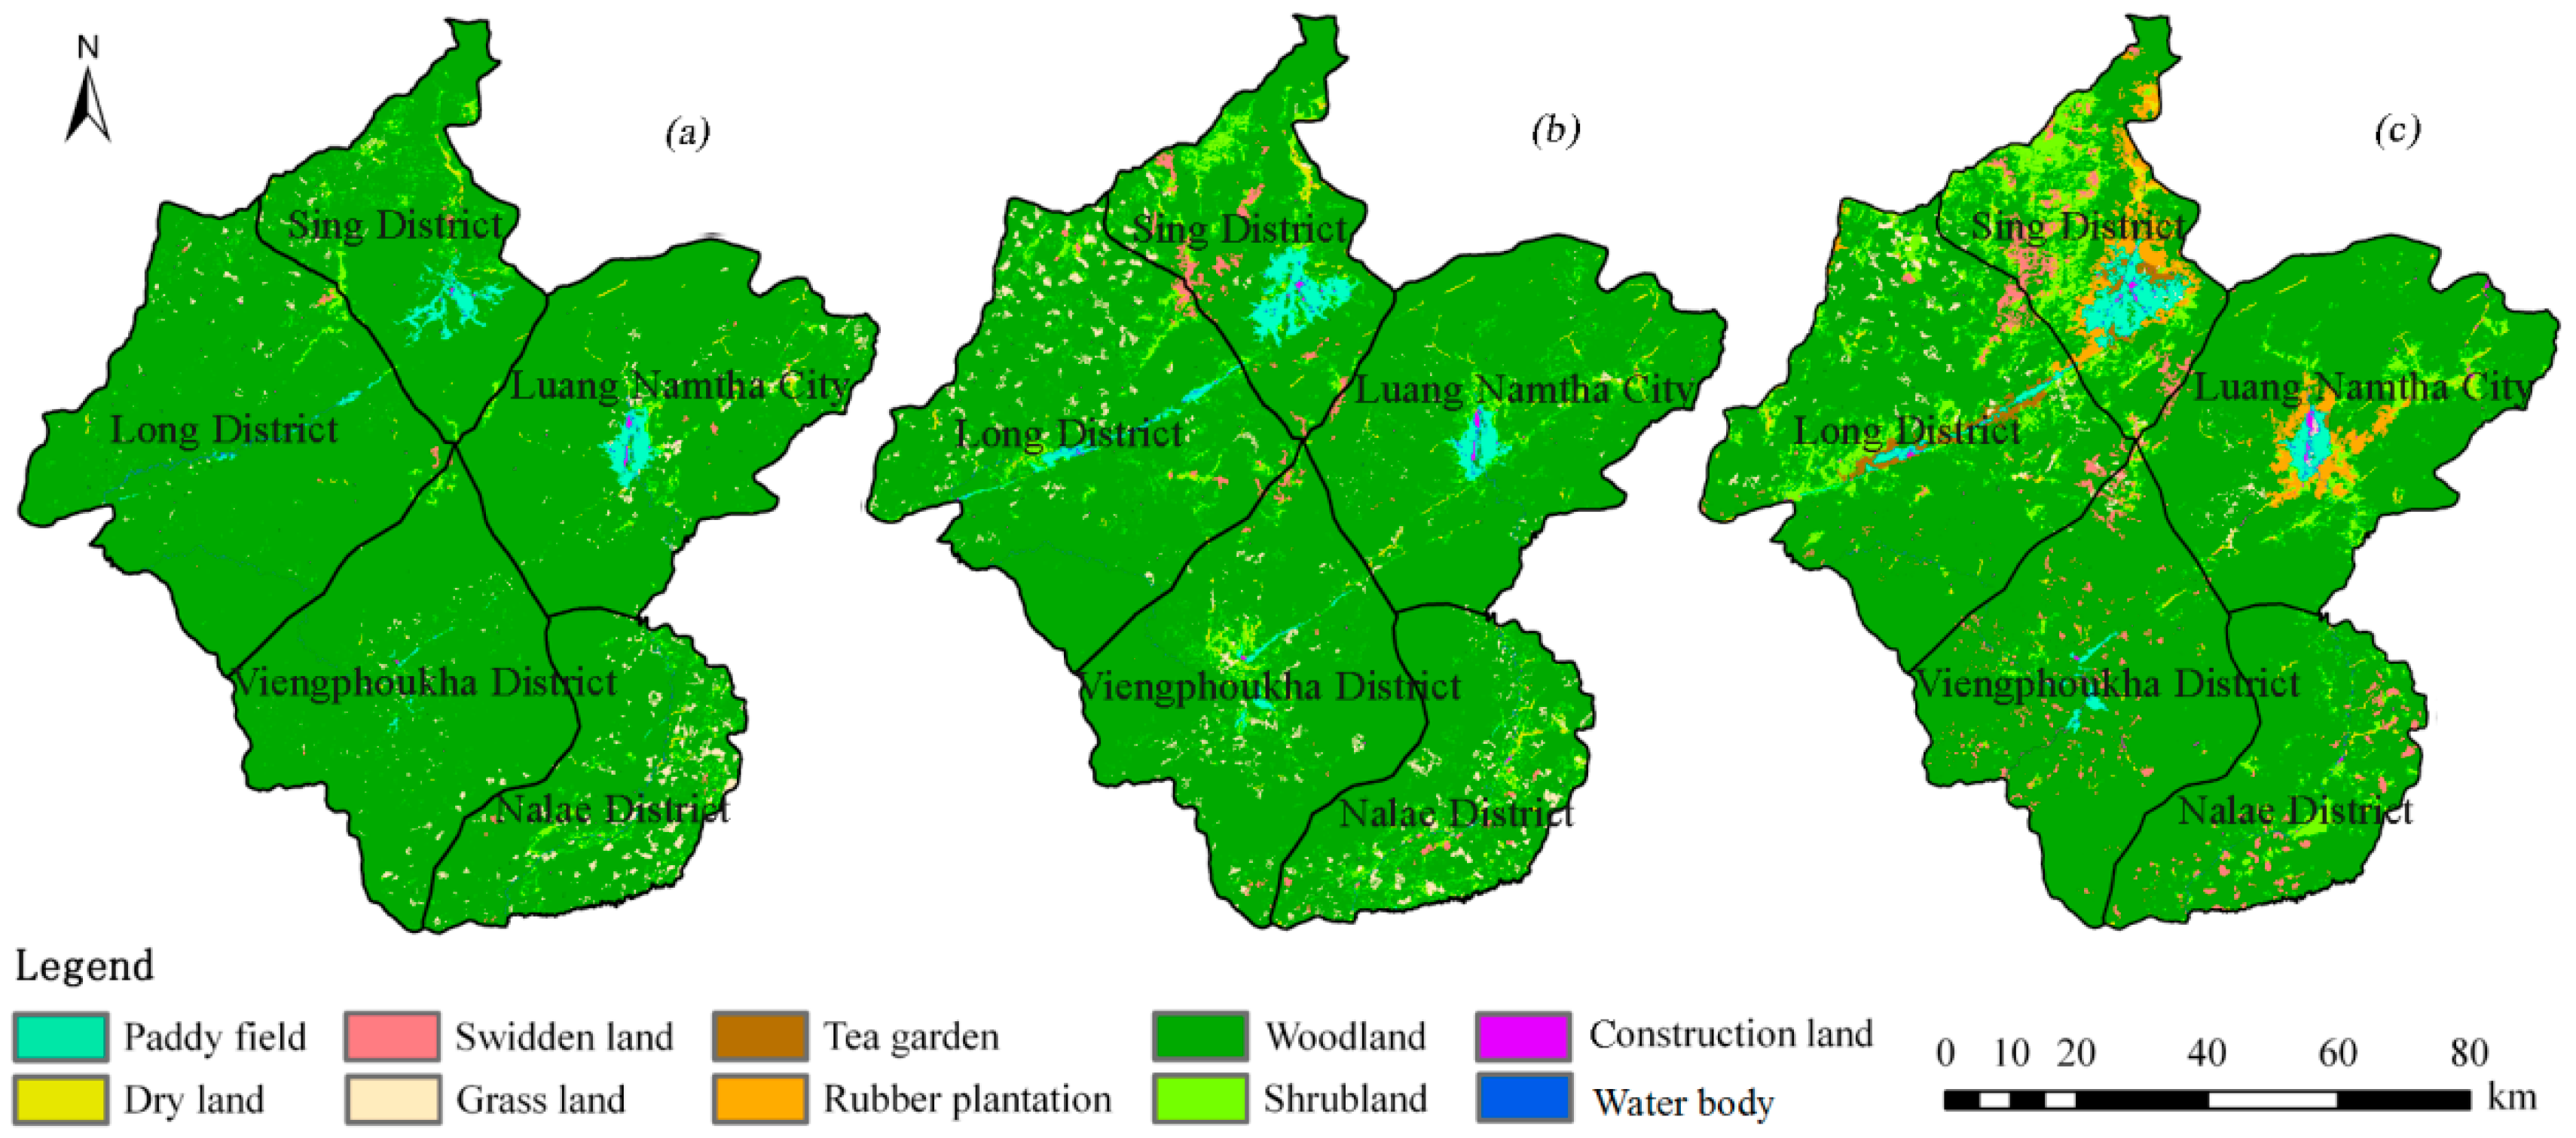
Understanding LUCC in the border region has tremendous implication for land management and planning and border security. It is significant for sustainable development of international trade and commerce. Luang Namtha Province has been constantly experiencing LUCC since the opening of the Boten border in 1994. Land use and land cover classification maps were extracted by interpreting Landsat TM/ETM+ images in 1990, 2000 and 2010 using decision tree classification method. LUCC was analyzed from the perspectives of structure, type conversion, and spatial pattern. The objective of this study was to find out the main changing characteristics of swidden land and rubber plantation systematically for decision support and scientific basis of sustainable land use management and ecological environment protection in Luang Namtha Province of northern Laos.

2. Materials and Methods

2.1. Study Area

Luang Namtha Province (20°18′~21°35′N, 100°30′~101°48′E) is located in the northern region of Laos within the Mekong river basin, covering an area of approximately 9325 km2, accounting for 4% of the total national territory area. It shares a border of 140 km with China in the north, 130 km with Myanmar in the west (the Mekong River as the border), 230 km with Oudomxay Province in the east and 100 km with Bokeo Province in the southwest. The province is divided into five administrative districts, namely Luang Namtha (capital), Sing, Long, Viengphoukha, and Nalae (Figure 1). This region has a tropical monsoon climate, with an annual mean temperature of 25.75 °C and an annual average precipitation of 1500 mm. In general, the rainy season is from May to October, which accounts for more than 80% of the annual precipitation, while the dry season is from November to April along with slash-and-burn farming activities [10]. Forest resources are abundant in this province. The Namha National Biodiversity Conservation Area established by the Ministry of Agriculture and Forestry of Laos is accounting for 23.85% of the province, which borders with the Shiang Yong Protected Area in Yunnan Province in China [35]. Tropical monsoon forest and rainforest are the main vegetation types, followed by some evergreen and deciduous forest, open mixed broadleaved and needle leaved forest, and dense bamboo in north border with China. In 2010, there were 164,310 inhabitants according to the Lao Statistics Bureau.
Luang Namtha Province is a commerce center among China, Laos, and Thailand. The Kunming–Bangkok highway, an international passage in mainland Southeast Asia, was constructed in 1992 for linking international trade and commerce. The road section in Laos, with overall length of 229 km and 138 km in Luang Namtha Province, usually called the R3 highway, was built from the Boten International Checkpoint (on the border to China) to Huay Sai in Bokeo Province (on the border to Thailand) between 2004 and 2008. The province has developed as a sustainable cultural and eco-tourism destination with the help of neighbouring countries, and several organizations and the Lao National Tourism Administration. The province is one of the main sugar cane and rubber producing areas in Laos with numerous plantations, and shifting cultivation is widely practiced as an economic necessity [36].

2.2. Data Sources and Preprocessing

Landsat TM/ETM+ images in 1990, 2000, and 2010 were used to interpret and classify land use and land cover. The data was obtained from United States Geological Survey (USGS). In order to facilitate the interpretation time window for different land types, NDVI (Normalized Difference Vegetation Index) time-series data generated from MODIS (Moderate-resolution Imaging Spectroradiometer) Terra 8-day composite 250 m time-series products (MOD09Q1) from January to December in 2010 was used. According to the MODIS-NDVI time series analyses of different land use types, all Landsat images were acquired during the dry season between January and April for rubber plantation and swidden land extraction [37] (Table 1).
ASTER GDEM (Advanced Spaceborne Thermal Emission and Reflection Radiometer Global Digital Elevation Model) with 30 m resolution and topographic maps with the scale of 1:100,000 were obtained, respectively, from the Computer Network Information Center, Chinese Academy of Sciences, and Library of Institute of Geographic Sciences and Natural Resources Research, Chinese Academy of Sciences (Figure 2). About 440 field survey samples along the R3 highway with geotagged pictures acquired in Luang Namtha Province on 25 February and 17 March in 2013 (Figure 2). The GlobCover2009 datasets of Laos with 300 m resolution in 2009 were derived from the European Space Agency and used for understanding land cover of Laos.
Based on GDEM, the topographic maps and field survey samples, Landsat TM images were rectified to Albers Conical Equal Area projection system in 2010. The process adopted the cubic convolution resampling method and the polynomial transform geometric correction method. The other images were registered to the 2010 images using an image-to-image registration technique with the rectification RMS (Root Mean Square) errors less than 0.5 pixels.

2.3. Land Use and Land Cover Classification System

Classification system of land use and land cover was determined by actual situation of land resource in the study area and the interpretation ability of Landsat images. It mainly referred to FAO (Food and Agriculture Organization)/UNEP (United Nations Environment Programme), the land cover classification system and the land resource classification system formulated by Chinese Academy of Science. The classification system included six primary classes and 10 secondary classes, and mainly focused on cultivated land, orchard land, forest land, which were the types with more human activity interventions (Table 2).

2.4. Methodology

LUCC is composed of temporal change, spatial change and quality change [38]. This study analyzed the quantitative, typological and spatial changes of land use and land cover through adopting different indices and methods via overlay analysis under GIS, statistical analysis and measurement analysis. Specifically, structural change of land use and land cover types in Luang Namtha Province selected the indices of acreage, structure, and the single land use dynamic degree (K) [39]. Aiming to reflect the overall structural changes of land use and land cover, the comprehensive land use dynamic degree model (S) and the land use degree comprehensive index model (La) were chosen [14,39]. Matrix of transition probability and contribution probability were used to analyze the type change of land use and land cover in different periods [40]. Based on the overlay analysis method, the spatial change features of land use and land cover types were explored in the study area.
The rate of land use change reveals the land use changes magnitude of different types according to the indices of K and S [39]. The formulas are defined below:
K = A i t 2 A i t 1 A i t 1 × 1 t 2 t 1 × 100 %
S = i = 1 n ( A i t 1 U A i ) / i = 1 n A i t 1 / ( t 2 t 1 ) × 100 %
where Ait1 and Ait2 are the acreage of land cover type i in the start and end of the study period, respectively. UAi is the acreage of land cover type i with no transition. t1 and t2 refer to the start and end of the study period. t2t1 is the duration length of the study period, and it represents the annual rate of land use and land cover change in this duration. n is the amount of land use and land cover types.
Intensity of land use change reflects the disturbance degree of human activities on land cover. The rating index of land use intensity is divided according to the land use intensity degree resulting from mankind. That is, unused land is 1, forest land, grassland and watershed are 2, farmland and orchard land are 3, and construction land is 4. The value range of the land use degree comprehensive index model (La) is between 100 and 400. The larger the value, the greater the land use intensity [41]. The equation is listed as follows:
L a = 100 × i = 1 n A i × C i
where La is the land use degree comprehensive index. Ai is the rating index of land use intensity of class i. Ci refers to the class i as the percentage of the total area.

3. Results and Analyses

3.1. Classification and Accuracy Assessment

The decision tree model for land use and land cover classification was built based on the features of original spectrum, normalization, tasselled cap transformation, texture, shape, terrain, and class-related characteristics. Based on field survey samples and GlobCover2009 datasets, classification accuracy in 2010 was evaluated through the indices of producer’s accuracy, user’s accuracy and overall accuracy [42] (Table 3). Overall accuracy of classification in 2010 was 86.59%. Paddy field, swidden land, rubber plantation, and woodland had the higher classification accuracy over 85%, while tea garden and grassland had the lower classification accuracy. Using the same confusion matrix evaluation method, the overall accuracies of classification were 85.72% and 87.41% in 1990 and 2000, respectively. The classification accuracies satisfied the quality demands of spatial analyses with the resultant maps (Figure 3).

3.2. Structural Changes of Land Use and Land Cover

3.2.1. Type Scale

Based on three classification maps in 1990, 2000 and 2010, the quantitative characteristics of land use and land cover types in Luang Namtha Province were analyzed through the indices of acreage, structure, and K of different categories to reveal the general features of structural changes. The structure of land use and land cover in the study area consisted of forest land-cultivated land-grassland. Among them, woodland was the major land cover type with the proportion over 80%, while paddy field was the dominant land use type replaced by rubber plantation in 2010 with 2.39% (Table 4). The structure features explained well this province being the main distribution area of tropical rain forest with rich forest resources and low population density (about 18 persons per square kilometer). Between 1990 and 2010, forest land declined by 5.42%, while cultivated land and orchard land increased by 3.47% and 3.11% respectively, which indicated the effects of human activities on LUCC become more frequently and obviously.
To be specific, the area of all land types increased with the exception of woodland, grassland and water body during 1990–2010 (Table 3). Woodland had the largest reduction of 1105.48 km2, while rubber plantation and swidden land had the largest increment of 2.39% accordingly. Swidden land increased fastest at an annual growth rate of 172.95%, followed by shrubland with 30.65%. Grassland decreased with the fastest annual rate of 5.54%. Paddy field, being the dominant cultivated land type, increased at an annual growth rate of 6.74% from 1990 to 2000 (except for 2010), but far below the increment of swidden land, about 233.45 km2. Dry land or rainfed land was mainly used to grow corn and cassava accounting for 30% together [43]. The primary food crop was rice, and slash-and-burn was still the main farming practice. In addition, rubber plantation increased rapidly in the border region with China, coupled with tea garden between 2000 and 2010 respectively, illustrating the expansion of economic plantation since the border opening. In contrast to woodland, shrubland increased from 195.39 km2 to 194.21 km2 with an annual growth rate of 30.65%, indicating the reduction of natural forest and increasing of man-made forest in the past 20 years.
During 1990–2000 (T1), apart from woodland and water body, the other land types showed an increasing trend. Woodland reduced by the maximum acreage of 536.94 km2, while shrubland increased about 306.95 km2. Swidden land had the fastest growth rate of 56.56%, while water body had the fastest reduction of 1.88%.
During 2000–2010 (T2), except for paddy field, grassland, woodland and water body, the remaining types showed a slightly rising trend. Shrubland increased by 291.87 km2 holding the largest amplification, while woodland had the maximum reduction of 568.54 km2. Rubber plantation increased rapidly with the largest annual growth rate of 1140.72%, just opposite to the change of grassland. Compared with T1, the growth rate of swidden land, dry land, shrubland, construction land declined in this decade, and deceleration rate of woodland inclined. The results indicated that the period of swidden farming was shortened and changed into the permanent farming gradually. Changes in swidden land were consistent with national policies about encouragement of economic plantation development, implementation of natural forest protection, and prohibition on slash-and-burn farming [10,44,45].

3.2.2. Landscape Scale

The overall speed and intensity characteristics of LUCC in Luang Namtha Province were analyzed by calculating the indices of S and La of different land types (Figure 4). During 1990–2010, the S value increased from 35.37% to 38.30%, indicating the rate of LUCC was accelerated gradually, especially in the recent decade. Meanwhile, La value rose from 201.76 to 208.66 with increments of 2.01 in T1 and 4.89 in T2, which illustrated that land use intensity was enhanced obviously because of human activities disturbance on LUCC.

3.3. Types Changes of Land Use and Land Cover

The transfer and cumulative matrix of LUCC in Luang Namtha Province from 1990 to 2010 showed that (Table 5 and Table 6):
(1)
Paddy field showed a rising trend of transfer rate from 10.24% in T1 to 21.14% in T2. It was mainly converted into woodland, shrubland and construction land in T1 and tea garden and rubber plantation in T2 with transfer proportion 68.07% and 58.29% respectively. The cumulative rate of paddy field increased by 28.19%, and woodland and shrubland were the major conversion source of paddy field. Dry land reflected an upward trend in transfer rate from 22.76% to 45.18%, and mainly changed into woodland, shrubland and rubber plantation in T2. The same with paddy field, woodland and shrubland were the main contribution sources. The conversion proportion of swidden land decreased from 88.84% to 64.07%. Woodland and shrubland were both transformed from swidden land and transformed into swidden land with proportion 60% and 30% approximately. Meanwhile, there were some transition between dry land and swidden land because of land use intensity enhancing.
(2)
Tea garden did not involve land use conversion as it had been planted in recent years in this province, while rubber plantation merely converted into woodland with a transfer rate of 13.85% in T2. Woodland and shrubland were the major sources for those commercial plantations development with cumulative probability over 80%. Furthermore, paddy field contributed 17.49% to tea garden, and the cumulative proportions of woodland and shrubland showed the opposite trend. Rubber plantation became more widespread in the national border region through conversion from shrubland and not by destroying the natural forest.
(3)
Transition occurred among grassland, shrubland, and woodland generally, indicating more active natural succession of vegetation. Woodland and shrubland presented the increasing trend of transfer rate since the opening of the border. To be specific, woodland was mainly converted into shrubland, rubber plantation and grassland, while increased from shrubland and grassland through natural recovering. Shrubland was mainly transferred into woodland, swidden land and rubber plantation—about 70%—while others were developed into dry land and tea garden. The primary source of shrubland was woodland with a cumulative rate more than 75%. The impact of human activities on vegetation conversion was intensified and more notable. The main source of economic value in Luang Namtha Province was developed by exploitating natural resources since the opening of the border in the 1990s.

3.4. Spatial Changes of Land Use and Land Cover

Spatial changes of land use and land cover were divided into three categories, including the persistence for the unchanged types, reduction for the decreased types, and expansion for the increased types, through GIS overlay analysis. Given the proportion of land types, the spatial changes of paddy field, swidden land, rubber plantation, woodland, shrubland were analyzed respectively (Figure 5). According to previous conclusions, the intensity of LUCC in the recent decade was increased by human activities. Rubber plantation expansion was obvious between 2000 and 2010. Therefore, we analyzed spatial pattern changes of those five types to find out the different spatial changing characteristics in T1 and T2.
Paddy fields were mainly distributed in flat areas (Figure 5a,b). Sing District had the largest area of paddy field, while the Nalae District had the smallest. Paddy field persistence and expansion were the dominant spatial changing types. Swidden land was mainly located in northern mountainous areas of Luang Namtha Province with the largest area in Sing and Viengphoukha District (Figure 5c,d). Swidden land expansion was the major spatial changing type in the last 20 years. Most of the paddy field expansion occurred in Sing and Long District in T1. Furthermore, swidden land expansion was mainly distributed in Sing District converted from woodland and shrubland, which indicated that human activities were frequent, such as slashing and burning. Paddy field reduction occurred mostly in Luang Namtha City, mainly converted into woodland and construction land. In T2, paddy field expansion was located in Sing District, while the significant reduction was in Sing District and Luang Namtha City with transformation into tea gardens and rubber plantations. Swidden land had remarkable spatial changes during this period. Swidden land expansion was distributed in almost all of districts except for Luang Namtha City. For nearly a decade of the obvious expansion trend of swidden land, it was illustrated that human activities became more significant. Swidden land reduction occurred in the Sing District and was mainly transformed into forest land, which indicated that natural recovery was common after slash-and-burn practices.
Rubber plantation was mainly distributed in the border region of China and Laos, with the largest area in Sing District and Luang Namtha City (Figure 5e). During 2000–2010, rubber plantations expanded from the border region into non-frontier region of Luang Namtha Province with the center being Luang Namtha City. Woodland was the dominant land cover type in Luang Namtha Province (Figure 5f,g). Apart from the Namha National Biodiversity Conservation Areas, there were significant spatial changes of woodland in other regions during the last 20 years. Woodland reduction was mainly distributed in northern part of three districts and the areas along the Kunming-Bangkok highway. Sing district had the largest decline area of woodland in the northern mountainous area, with the proportion decreasing from 14.52% in T1 to 29.34% in T2. Nalae District had the most frequent spatial changes of woodland in the southern part of Luang Namtha Province. Similar to spatial change characteristics of woodland, shrubland also changed frequently with the characteristics similar to swidden land but opposite to woodland (Figure 5h,i). Woodland and swidden land reduction and shrubland expansion had high coincidence spatially. The reason for that phenomenon could be explained in two aspects, one was because the main source of shrubland was woodland, and the other was shrubland converted from swidden land relying on natural recovery transforming into woodland simultaneously.

4. Conclusions and Discussion

Spatial-temporal changes of land use and land cover in Luang Namtha Province were investigated since the opening of the Boten border adjacent to China from 1990 to 2010. Structure change, type change and distribution change were analyzed, respectively. This research aimed to understand the use of natural resources using LUCC analyses, and provide the basic support for land resource development and ecological environmental protection.
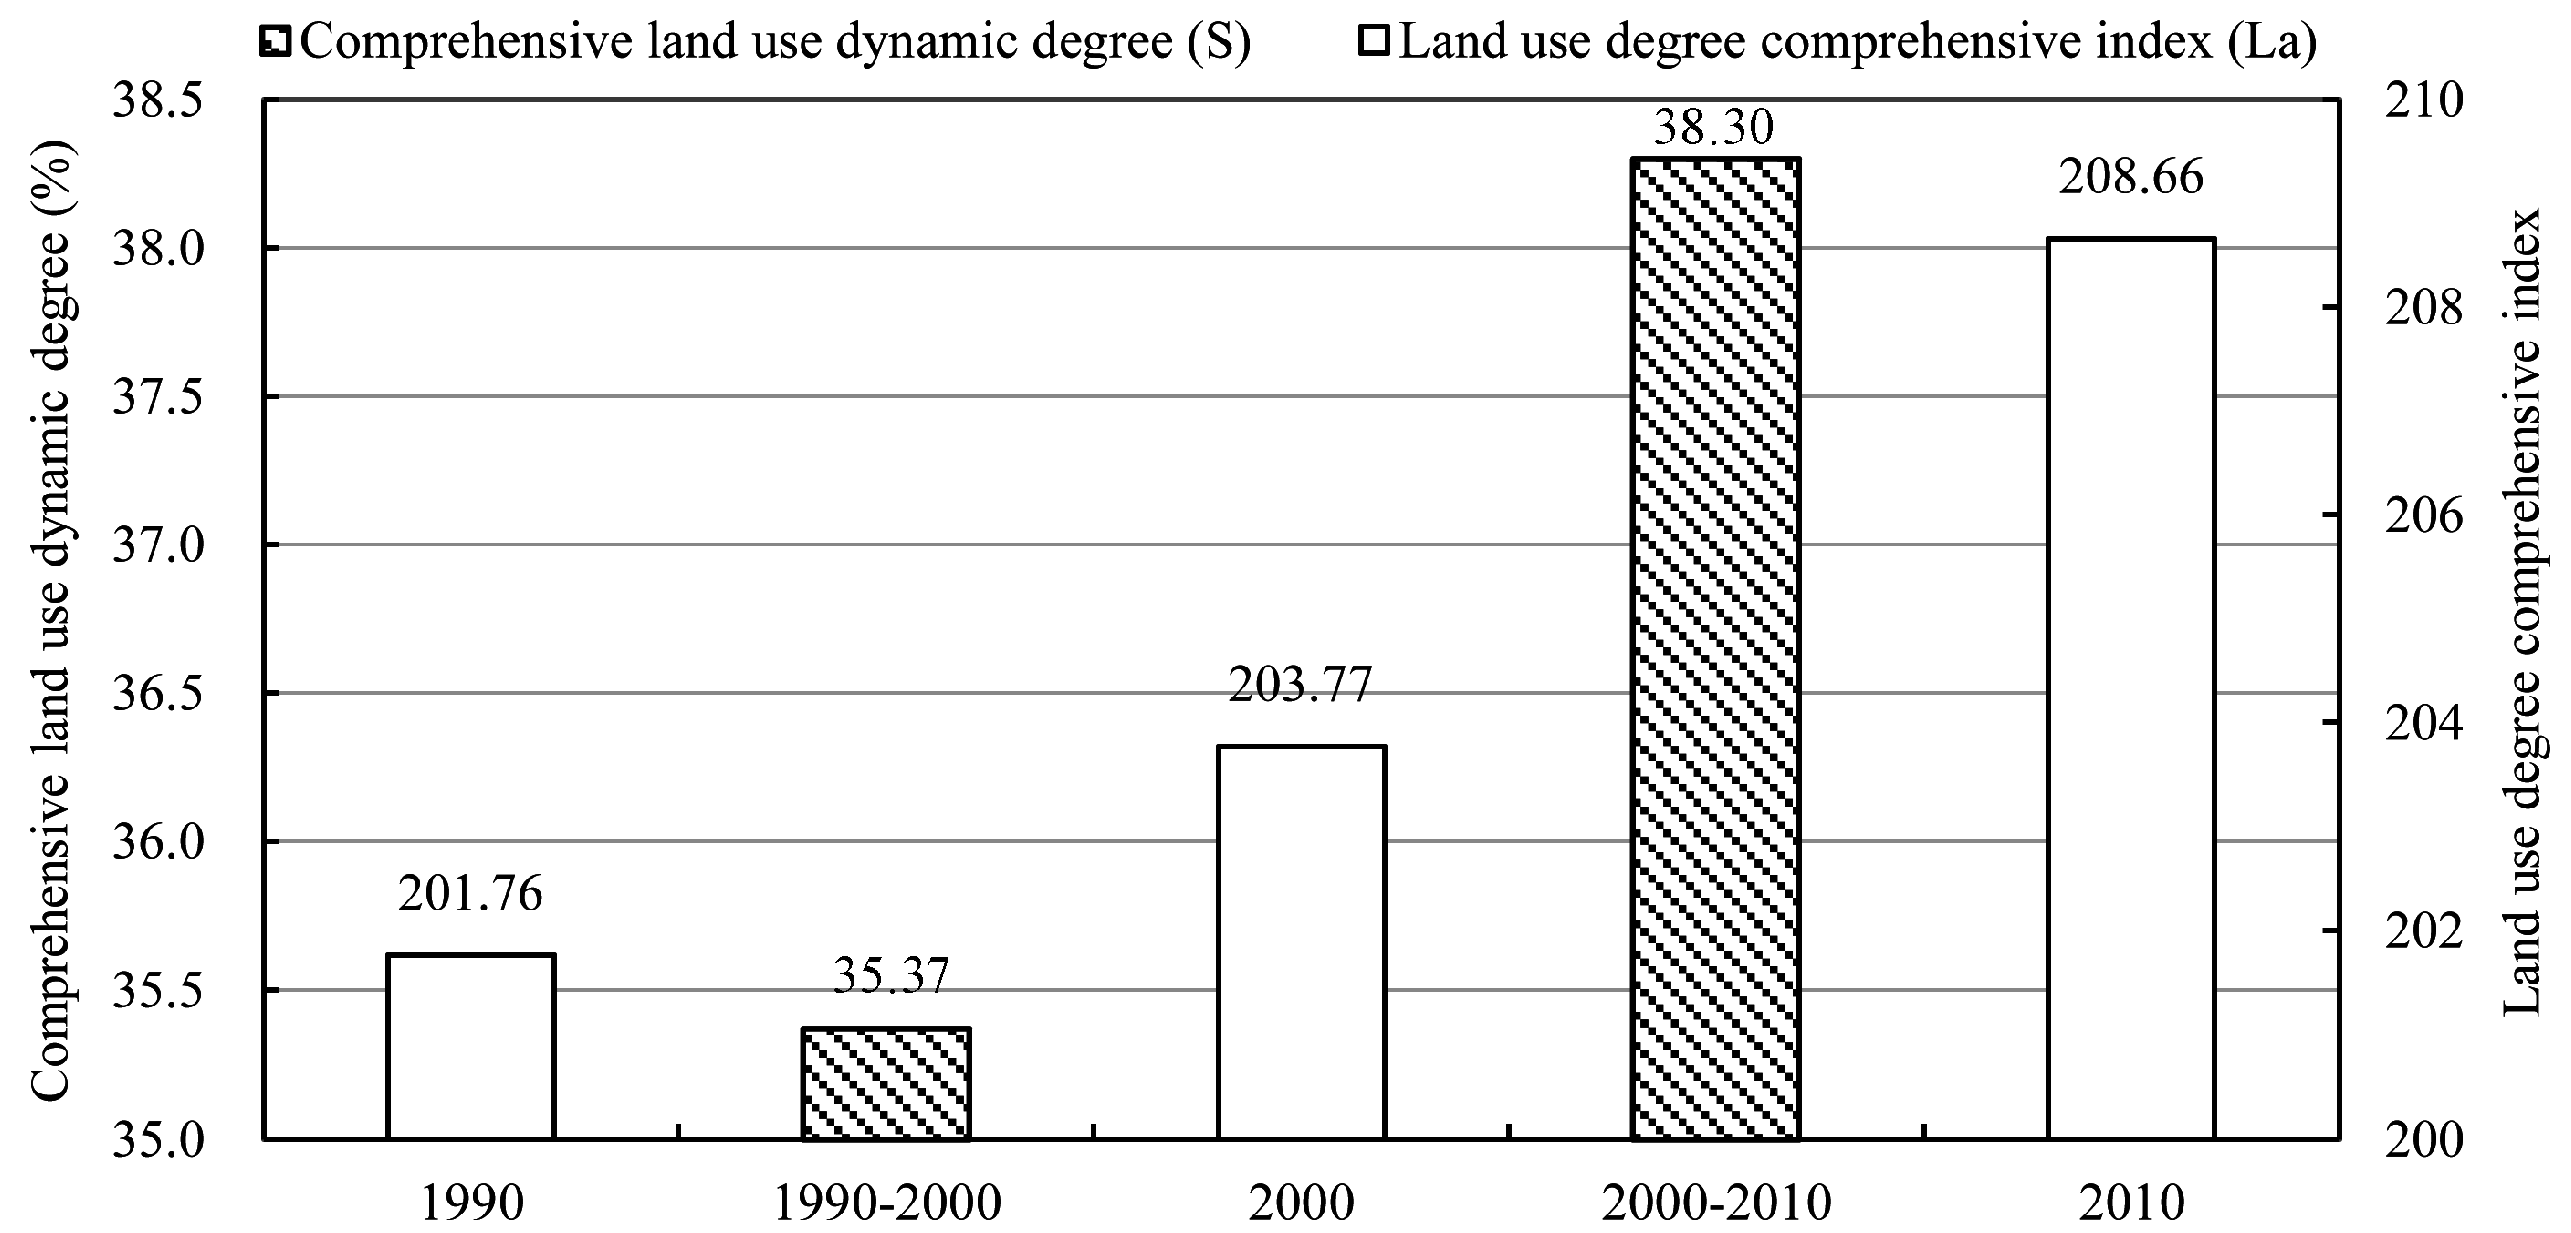
Land use intensity was enhanced obviously because of the disturbance of human activities on LUCC [
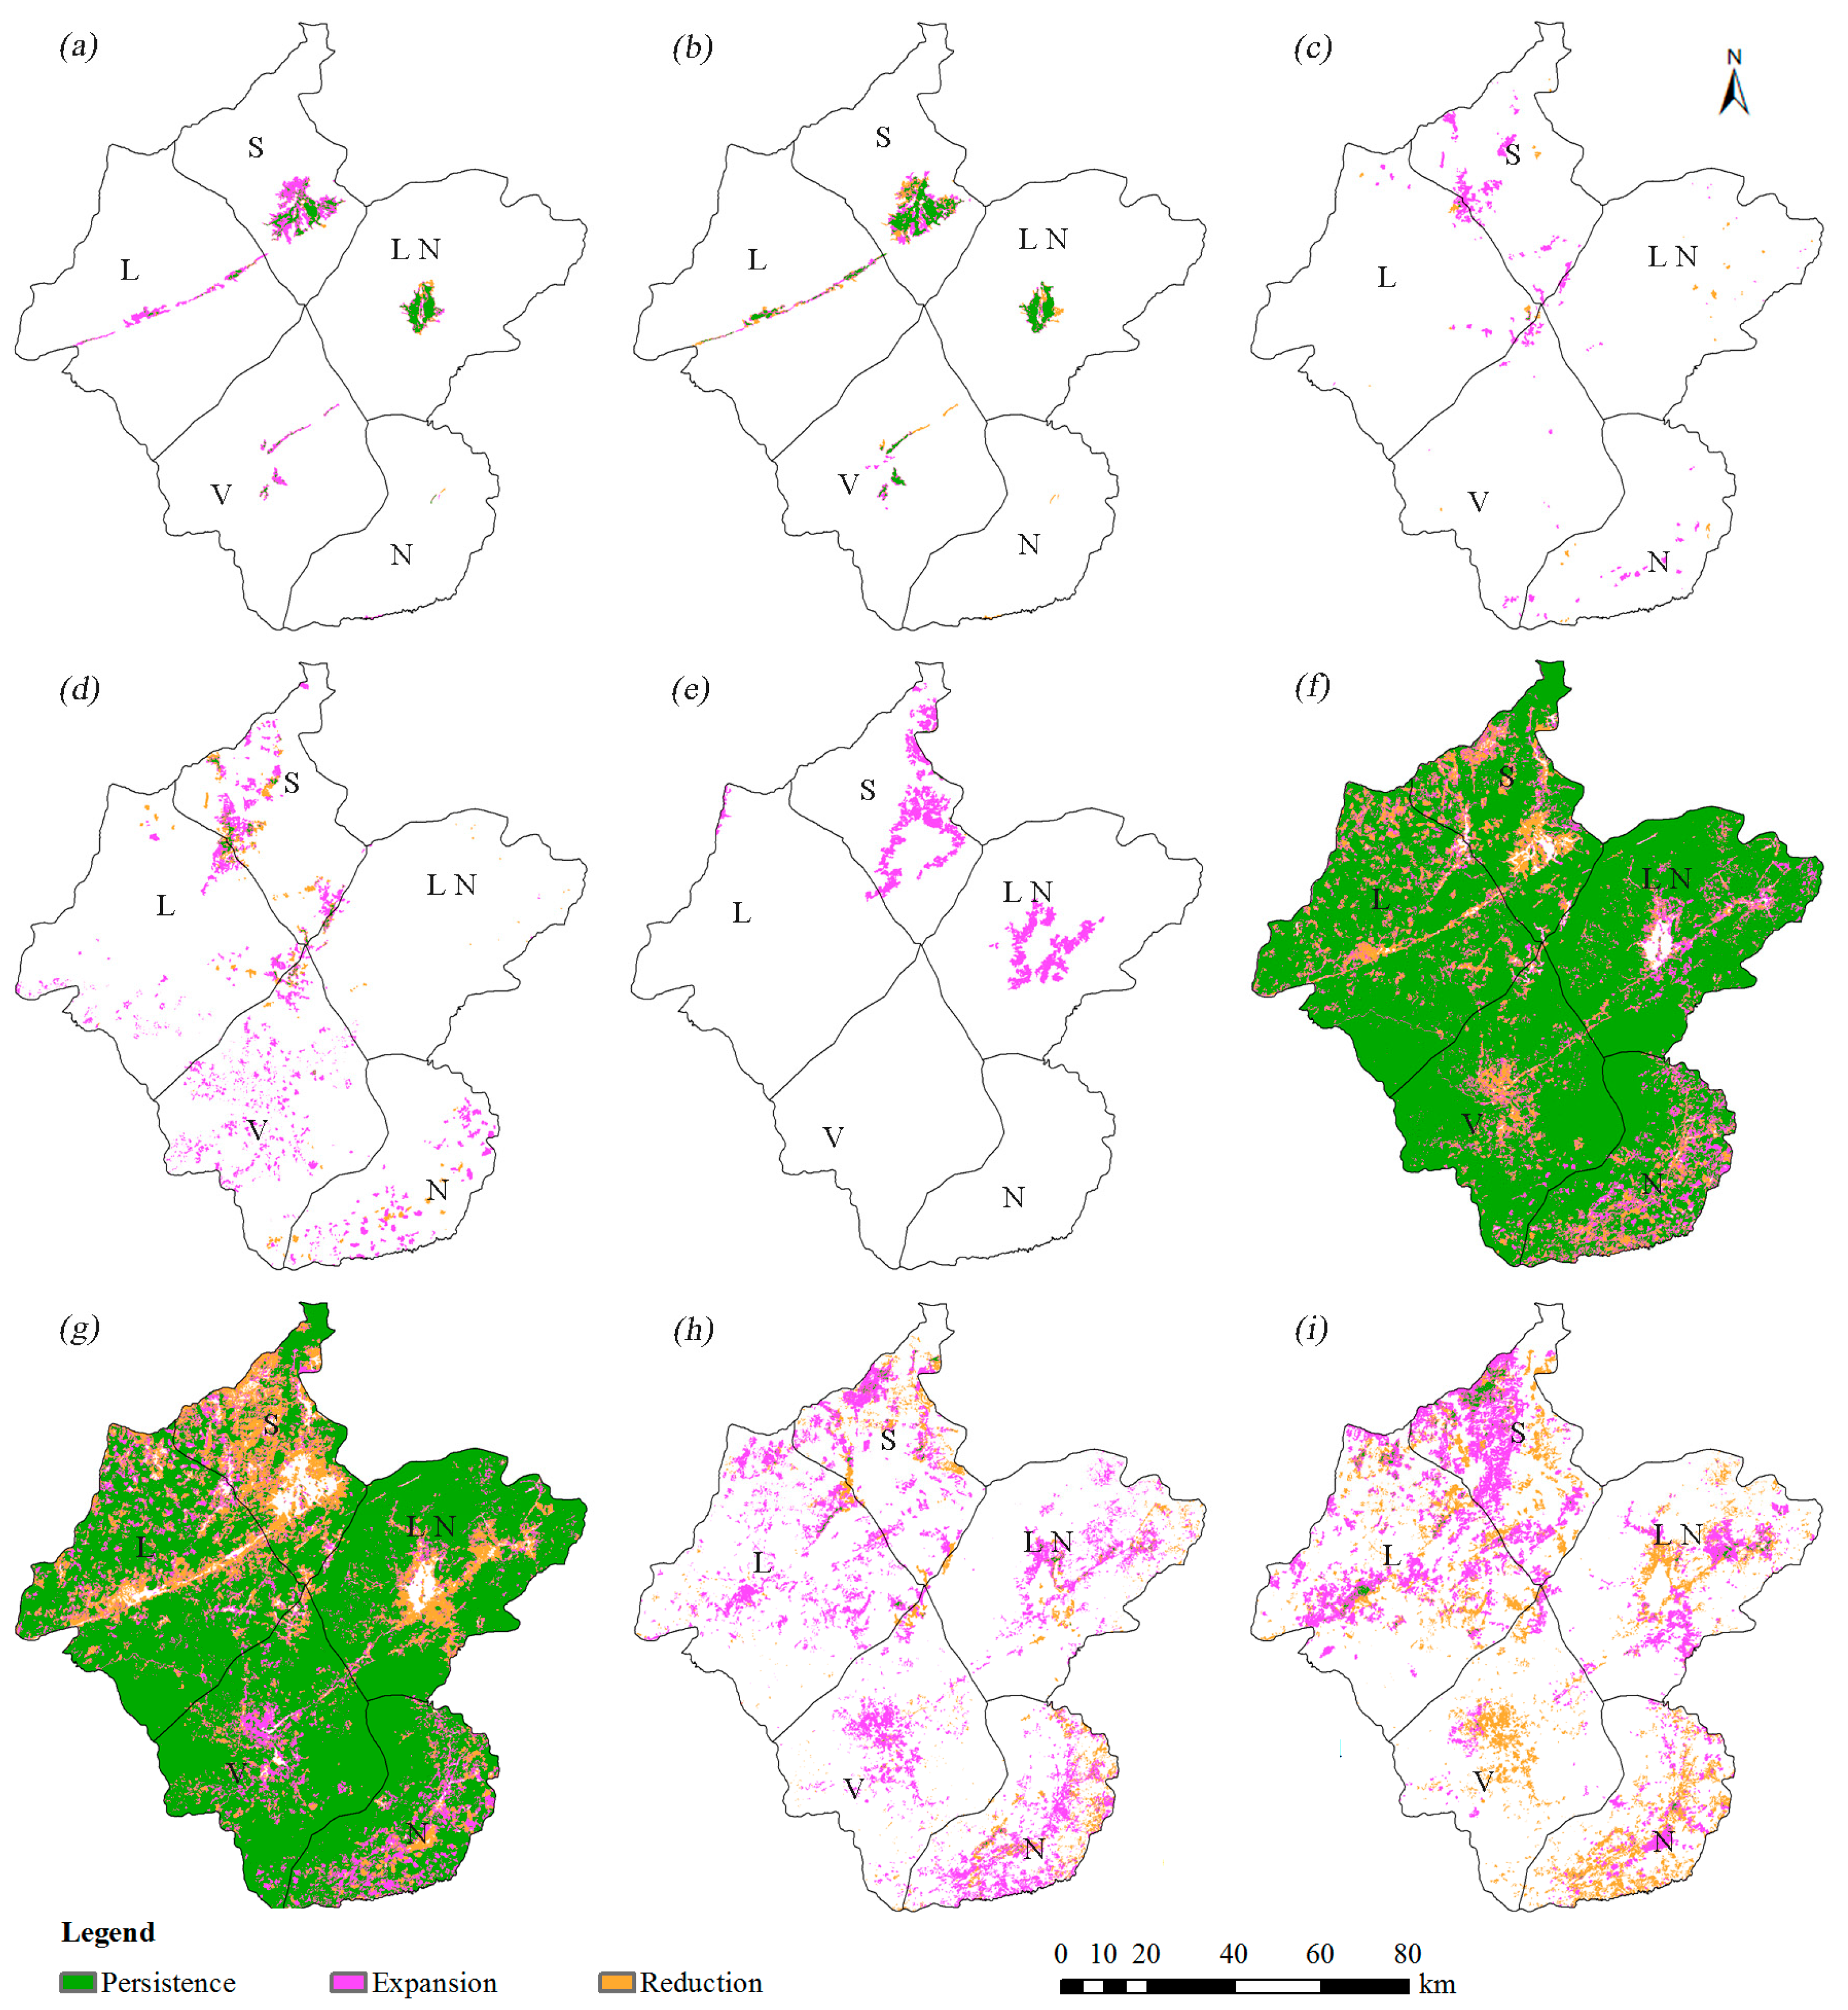
30], especially in the recent decade. The land use degree comprehensive index increased from 201.76 to 208.66, and the comprehensive land use dynamic degree increased from 35.37% to 38.30%. Woodland, shrubland, rubber plantation, swidden land and paddy field changed significantly in distribution from 1990 to 2010. As the dominant land use type during 1990–2000, paddy field was replaced by rubber plantation in 2010 with 2.39%. Rubber plantation, shrubland, swidden land, and construction land showed significant expansion, but obvious reduction in woodland in the same period. Woodland was mainly converted into shrubland, rubber plantation and grassland, with a small proportion of natural recovery from grassland. Woodland reduction was so obvious, especially in northern part of three districts (e.g., Sing District, Long District, and Luang Namtha City) and the areas along the Kunming–Bangkok highway [12]. Population growth and swidden agriculture were the primary causes of deforestation [17,29,32]. Rubber plantation was mainly distributed in the border region of China and Laos with the expansion from the border region into the non-frontier of Laos with Luang Namtha City as the center. This phenomenon was similar to the expansion features in Xishuangbanna, China [37,46]. Economic interests and national policies were the primary causes of rubber expansion [10,16,32,45,46,47]. Swidden land was mainly located in northern mountainous areas, where the obvious expansion indicated human activities have frequently impacted slashing and burning cultivation in the recent decade [33,48]. As a traditional farming practice in tropical regions, the increment of swidden land was mainly resulted due to poverty [19,22,48].
In this study, we focused on LUCC in Luang Namtha Province, the border region of China and Laos, and obtained the land use and land cover classification maps since the opening of the Boten border crossings with higher spatial resolution (30 m) and longer temporal scale (20 years). Most of the existing studies had lower spatial precision and an older temporal scale [9,30,33,45]. Research performed mainly focused on changes of the structure and type conversion, while we analyzed LUCC from the perspectives of structure, type conversion and spatial pattern [23,33]. We paid more attention to the changes of swidden land and rubber plantation, which were affected significantly by human activities [24,31,32,47,48]. In light of the quality of Landsat images and limited field samples, accuracy assessment of land use and land cover classification maps should be improved further, especially for the grassland and tea garden. For the vegetation types with obvious growth cycles, higher spatial resolution remote sensing images and multi-temporal Landsat images can obviously improve the classification accuracy [46]. References from the Xishuangbanna region that have similar geographical environment and classification data of “The Second National Land Resource Survey”, and more field survey samples obtained in the future will be used to improve the classification accuracy based on our research projects. This study has primarily focused on the spatial-temporal of LUCC and land use intensity, while analyses of the driving forces of natural and human factors (e.g., terrain, policy, soil characteristics) and stakeholders should be carried out in future research. The Kunming-Bangkok highway across the Namha National Biodiversity Conservation Areas becomes the major driving force of land use and land cover change and economic development in the future because of different international cooperation mechanisms. However, the road construction is a great challenge for biodiversity and ecological environment protection. More related dynamic research and measures should be carried out for avoiding negative ecological effects.
Located in the northern part of Laos, Luang Namtha Province is adjoined to Xishuangbanna in southwest China with abundance in land, heat, water, biodiversity, and humanity resources. Meanwhile, as the frontier region adjacent to the border to China in Laos, land use and land cover will greatly be affected by Chinese border agricultural policies, especially rubber plantation expansion [10,47]. Investments from China, Vietnam, Thailand, etc. in rubber plantations in Laos have been obviously increasing since 2004 [32,49]. Laos is devoted to becoming an important exporter of natural rubber in 2020 [50]. Furthermore, with the “Opium Poppy Substitution Planting” (OPSP) being an important filing of cooperation in the neighboring countries of the “Golden Triangle,” vital projects supported by national and international organizations and more frequent economic exchanges after the establishment of China-ASEAN Free Trade Area, there is no doubt that land use and land cover will be changed more extensively and dramatically, especially in rubber plantation [10,32]. More attention should be paid to growing potential evaluation of rubber plantations in the border region of China, Laos, and Myanmar. Based on scenario analysis, simulations of LUCC should be enhanced in northern Laos to analyse future potential environmental consequences and to help planning for land resource development and ecological environmental protection in the border region of China and Laos. Simultaneously, environmental effects of LUCC should be studied with more detailed data from investigation to experiments, especially in hydrology and ecosystems. As a developing region, along with the international political-economic cooperation, LUCC in northern Laos will undoubtedly affect the geopolitical and economic environment.

Acknowledgments

This work was supported by the National Natural Science Foundation of China under Grant No. 41271117 and No. 41301090; Project funded by China Postdoctoral Science Foundation under Grant No. 2016M591112; and Project supported by Beijing Postdoctoral Research Foundation.

Author Contributions

All authors contributed substantially to all aspects of this article. Xiaona Liu was responsible for the main part of the research design, data analysis and writing of the article. Moreover, Zhiming Feng and Luguang Jiang contributed important aspects regarding the research design. Zhiming Feng and Peng Li contributed field information on land use and land cover in northern Laos. Peng Li revised the article critically and systematically. All authors checked and contributed to the final text.

Conflicts of Interest

The authors declare no conflict of interest.

References

  1. Li, X.B. Explanation of land use changes. Prog. Geogr. 2002, 21, 195–203. [Google Scholar]
  2. Turner, B.L., II; Skole, D.; Sanderson, S.; Jackson, T. Land Use and Land Cover Change; IGBP Report No. 35 and IHDP Report No. 7; IGBP: Stockholm, Sweden, 1995. [Google Scholar]
  3. Lambin, E.F.; Baulies, X.; Bockstael, N.; Fischer, G.; Krug, T. Land-Use and Land-Cover Change (LUCC) Implementation Strategy; IGBP Report No. 48 and IHDP Report No. 10; IGBP: Stockholm, Sweden, 1999. [Google Scholar]
  4. Liu, M.L.; Qi, Q.W.; Liu, J.F.; Zou, X.P.; Li, J. Spatial-temporal changes of the land use/cover and its ecological effect analysis in trans boundary Yunnan province. Yunnan Geogr. Environ. Res. 2006, 18, 1–5. [Google Scholar]
  5. Liu, X.N.; Feng, Z.M.; Jiang, L.G. Review of land use and land cover change of Golden Economic Quadrangle Region in the border of China, Laos, Myanmar and Thailand. Prog. Geogr. 2013, 32, 191–202. [Google Scholar]
  6. Kuemmerle, T.; Radeloff, V.C.; Perzanowski, K.; Hostert, P. Cross-border comparison of land cover and landscape pattern in Eastern Europe using a hybrid classification technique. Remote Sens. Environ. 2006, 103, 449–464. [Google Scholar] [CrossRef]
  7. Qin, Z.; Li, W.; Burgheimer, J.; Karnieli, A. Quantitative estimation of land cover structure in an arid region across the Israel-Egypt border using remote sensing data. J. Arid Environ. 2006, 66, 336–352. [Google Scholar] [CrossRef]
  8. Zhang, Q. Study on Land Use/Land Cover Change and Ecological Security in Changbai Mountain’s Area in the China-DPRK’s Boundary. Master’s Thesis, Northeast Normal University, Changchun, China, 2009. [Google Scholar]
  9. Chanhda, H.; Wu, C.F.; Ye, Y.M.; Ayumi, Y. GIS based land suitability assessment along Laos-China border. J. For. Res. 2010, 21, 343–349. [Google Scholar] [CrossRef]
  10. Liu, X.N.; Feng, Z.M.; Jiang, L.G.; Li, P.; Liao, C.H.; Yang, Y.Z.; You, Z. Rubber plantation and its relationship with topographical factors in the border region of China, Laos and Myanmar. J. Geogr. Sci. 2013, 23, 1019–1040. [Google Scholar] [CrossRef]
  11. Chanhda, H.; Ye, Y.M.; Yoshida, A. Forest land use change at Trans-Boundary Laos-China Biodiversity Conservation Area. J. Geogr. Sci. 2010, 20, 889–898. [Google Scholar]
  12. Liu, X.N. Study on Land Use and Land Cover Change in the Border Region of China, Laos and Myanmar. Ph.D. Thesis, Institute of Geographic Sciences and Natural Resources Research, CAS, Beijing, China, 2013. [Google Scholar]
  13. Lyttleton, C.; Cohen, P.; Rattanavong, H.; Thongkhamhane, B.; Sisaerngrat, S. Watermelons, Bars and Trucks: Dangerous Intersections in Northwest Lao PDR; Institute for Cultural Research of Laos and Macquarie University: Vientiane, Laos, 2004. [Google Scholar]
  14. Cao, Z.W.; Ma, Y.X.; Li, H.M.; Guo, Z.F.; Liu, W.J. Land use and land cover change analysis on main roadsides in Xishuangbanna. J. Mt. Sci. Engl. 2006, 24, 284–290. [Google Scholar]
  15. William, L.F.; Miriam, G.; Susan, G.W.L. Impacts of roads and linear clearings on tropical forests. Trends Ecol. Evol. 2009, 24, 659–669. [Google Scholar]
  16. Lambin, E.F.; Geist, H.J.; Lepers, E. Dynamics of land-use and land-cover change in tropical regions. Annu. Rev. Env. Resour. 2003, 28, 205–241. [Google Scholar] [CrossRef]
  17. Xu, J.C.; Fox, J.; Lu, X.; Podger, N.; Leisz, S.; Ai, X.H. Effects of swidden cultivation, state Policies, and customary institutions on land cover in a Hani village, Yunnan, China. Mt. Res. Dev. 1999, 19, 123–132. [Google Scholar]
  18. Lambin, E.F.; Turner, B.L.; Geist, H.J.; Agbola, S.B.; Angelsen, A.; Bruce, J.W.; Coomes, O.T.; Dirzo, R.; Fischer, G.; Folke, C.; et al. The causes of land-use and land-cover change: Moving beyond the myths. Glob. Environ. Chang. 2001, 11, 261–269. [Google Scholar] [CrossRef]
  19. Fox, J.M. How blaming’ slash and burn’ farmers is deforesting mainland Southeast Asia. Asia Pac. Issues 2000, 47, 1–8. [Google Scholar]
  20. Mertz, O. The relationship between length of fallow and crop yields in shifting cultivation: A rethinking. Agrofor. Syst. 2002, 55, 149–159. [Google Scholar] [CrossRef]
  21. Roder, W.; Phengchanh, S.; Keoboulapha, B. Relationships between soil, fallow period, weeds and rice yield in slash-and-burn systems of Laos. Plant Soil 1995, 176, 27–36. [Google Scholar] [CrossRef]
  22. Mertz, O.; Padoch, C.; Fox, J.; Cramb, R.A.; Leisz, S.J.; Lam, N.T.; Vien, T.D. Swidden change in Southeast Asia: Understanding causes and consequences. Hum. Ecol. 2009, 37, 259–264. [Google Scholar] [CrossRef]
  23. Yoshida, A.; Chanhda, H.; Ye, Y.M.; Liang, Y.R. Ecosystem service values and land use change in the opium poppy cultivation region in Northern Part of Lao PDR. Acta Ecol. Sin. 2010, 30, 56–61. [Google Scholar] [CrossRef]
  24. Yamamoto, Y.; Oberthür, T.; Lefroy, R. Spatial identification by satellite imagery of the crop–fallow rotation cycle in Northern Laos. Environ. Dev. Sustain. 2009, 11, 639–654. [Google Scholar] [CrossRef]
  25. Hecht, S.B. Environment, development, and politics: Capital accumulation and the livestock sector in Amazonia. World Dev. 1985, 13, 663–684. [Google Scholar] [CrossRef]
  26. Richards, J.F.; Tucker, R.P. World Deforestation in the Twentieth Century; Duke University Press: Durham, NC, USA, 1988. [Google Scholar]
  27. Chaplot, V.; Coadou, L.B.E.; Silvera, N.; Valentin, C. Spatial and temporal assessment of linear erosion in catchments under sloping lands of Northern Laos. Catena 2005, 63, 167–184. [Google Scholar] [CrossRef]
  28. Mather, A.S.; Needle, C.L. The relationships of population and forest trends. Geogr. J. 2000, 166, 2–13. [Google Scholar] [CrossRef]
  29. Geist, H.J.; Lambin, E.F. Proximate causes and underlying driving forces of tropical deforestation. BioScience 2002, 52, 143–150. [Google Scholar] [CrossRef]
  30. Thongmanivong, S.; Fujita, Y. Recent land use and livelihood transitions in Northern Laos. Mt. Res. Dev. 2006, 26, 237–244. [Google Scholar] [CrossRef]
  31. Manivong, V.; Cramb, R.A. Economics of smallholder rubber expansion in Northern Laos. Agrofor. Syst. 2008, 74, 113–125. [Google Scholar] [CrossRef]
  32. Ziegler, A.D.; Fox, J.M.; Xu, J.C. The rubber juggernaut. Science 2009, 324, 1024–1025. [Google Scholar] [CrossRef] [PubMed]
  33. Fox, J.M.; Vogler, J.B. Land-use and land-cover change in montane mainland Southeast Asia. Environ. Manag. 2005, 36, 394–403. [Google Scholar] [CrossRef] [PubMed]
  34. Alton, C.; Bluhm, D.; Sannanikone, S. Para Rubber in Northern Laos: The Case of Luangnamtha; Lao-German Program: Vientiane, Laos, 2005. [Google Scholar]
  35. Ministry of Agriculture and Forestry (MAF). Fourth National Report of the Conservation Biological Diversity; Ministry of Agriculture and Forestry: Vientiane, Laos, 2010.
  36. International Monetary Fund (IMF). Lao People’s Democratic Republic: Second Poverty Reduction Strategy Paper; International Monetary Fund: Washington, DC, USA, 2008. [Google Scholar]
  37. Liu, X.N.; Feng, Z.M.; Jiang, L.G.; Zhang, J.H. Rubber plantations in Xishuangbanna: Remote sensing identification and digital mapping. Resour. Sci. 2012, 34, 1769–1780. [Google Scholar]
  38. Zhu, H.Y.; He, S.J.; Zhang, M. GIS spatial analysis and its application in the research of land use change. Prog. Geogr. 2001, 20, 104–110. [Google Scholar]
  39. Wang, X.L.; Bao, Y.H. Study on the methods of land use dynamic change research. Prog. Geogr. 1999, 18, 81–87. [Google Scholar]
  40. Shi, P.J.; Chen, J.; Pan, Y.Z. Landuse change mechanism in Shenzhen city. Acta Geogr. Sin. 2000, 55, 151–160. [Google Scholar]
  41. Deng, R. Construction and protection of ecological environment in Xishuangbanna district. Yunnan Environ. Sci. 2004, 23, 133–134. [Google Scholar]
  42. Olofsson, P.; Foody, G.M.; Herold, M.; Stehman, S.V.; Woodcock, C.E.; Wulder, M.A. Good practices for estimating area and assessing accuracy of land change. Remote Sens. Environ. 2014, 148, 42–57. [Google Scholar] [CrossRef]
  43. Ministry of Agriculture and Forestry (Laos). Available online: http://www.maf.gov.la/ (accessed on 21 September 2012).
  44. Li, H.M.; Ma, Y.X.; Aide, T.M.; Liu, W.J. Past, present and future land-use in Xishuangbanna, China and the implications for carbon dynamics. For. Ecol. Manag. 2008, 255, 16–24. [Google Scholar] [CrossRef]
  45. Zhe, L.; Jefferson, M.F. Mapping rubber tree growth in mainland Southeast Asia using time-series MODIS 250 m NDVI and statistical data. Appl. Geogr. 2012, 32, 420–432. [Google Scholar]
  46. Liu, X.N.; Feng, Z.M.; Jiang, L.G.; Zhang, J.H. Spatial-Temporal Pattern Analysis of Land Use and Land Cover Change in Xishuangbanna. Resour. Sci. 2014, 36, 233–244. [Google Scholar]
  47. Li, P.; Feng, Z.M. Review of remote sensing monitoring and socioeconomic and environmental impacts of rubber plantation expansion in Laos in the geoeconomic context. Prog. Geogr. 2016, 35, 286–294. [Google Scholar]
  48. Liao, C.H.; Feng, Z.M.; Li, P.; Zhang, J.H. Monitoring the spatio-temporal dynamics of swidden agriculture and its effects on vegetation recovery using Landsat imagery in northern Laos. J. Geogr. Sci. 2015, 25, 1218–1234. [Google Scholar] [CrossRef]
  49. Hicks, C.; Voladeth, S.; Shi, W.Y.; Zhong, G.F.; Sun, L.; Tu, P.Q.; Kalina, M. Rubber Investments and Market Linkages in Lao PDR: Approaches for Sustainability; The Sustainable Mekong Research Network: Bangkok, Thailand, 2009; p. 167. [Google Scholar]
  50. Kokmila, K.; Yoo, S.; Lee, S. Selection of suitable areas for rubber tree (Hevea brasiliensi) plantation using GIS data in Laos. For. Sci. Technol. 2010, 6, 55–66. [Google Scholar] [CrossRef]
Figure 1. The location and topography of the study area.
Sustainability 08 01011 g001
Figure 2. Field survey samples with topographic maps in Luang Namtha Province, Laos.
Sustainability 08 01011 g002
Figure 3. The classification maps of land use and land cover in 1990 (a); 2000 (b); and 2010 (c) in Luang Namtha Province.
Sustainability 08 01011 g003
Figure 4. Comprehensive dynamic change of land use and land cover in Luang Namtha Province.
Sustainability 08 01011 g004
Figure 5. Spatial distribution of land use and land cover changes in Luang Namtha Province between 1990 and 2010. (a) Paddy field in T1; (b) paddy field in T2; (c) swidden land in T1; (d) swidden land in T2; (e) rubber plantation in T2; (f) woodland in T1; (g) woodland in T2; (h) shrubland in T1; (i) shrubland in T2. Note: S: Sing District; L: Long District; L N: Luang Namtha City; V: Viengphoukha District; N: Nalae District.
Sustainability 08 01011 g005
Table 1. List of Landsat TM/ETM+ remote sensing images.
DatasetPath/RowDateSensorsResolution (m)
1990129/4525 March 1989TM30
129/4625 March 1989TM30
130/4527 January 1989TM30
130/463 February 1989TM30
2000129/4523 March 2000ETM+15
129/467 March 2000ETM+15
130/4514 March 2000ETM+15
130/4614 March 2000ETM+15
2010129/457 February 2010TM30
129/4615 April 2011TM30
130/4514 February 2010TM30
130/4622 April 2011TM30
Table 2. Classification system of land use and land cover.
Primary ClassCode 1Secondary ClassCode 2Definition
Cultivated land1Paddy field11With water and irrigation facilities ensuring, cultivated land plants rice, lotus and other aquatic crops, including the land carries out planting rice and rainfed crops rotation.
Dry land12Cultivated land plants rainfed crops without water and irrigation facilities guarantee, or rainfed crops can grow with irrigation in normal year generally, mainly arable land to grow vegetables.
Swidden land13Cultivated land from slash-and-burn farming method.
Orchard land2Tea garden21Orchard land planting tea.
Rubber plantation22Orchard land planting natural rubber forest.
Grassland3Grassland30Land grows herbs predominantly, mainly referring to the land with vegetation recovering from the slash-and-burn cultivation.
Forest land4Woodland41Woodland with tree canopy density ≥0.2, including mangrove forest and bamboo forest land.
Shrubland42Forest land with tree canopy density <0.2, including open forest land, burned area, nursery and etc.
Construction land5Construction land50Artificial construction land, including urban land, rural residential land, and other construction land.
Water body6Water body60Land for natural water bodies and water conservancy facilities.
Table 3. Classification accuracy of land use and land cover in 2010.
Class CodeProducer’s Accuracy (%)User’s Accuracy (%)Class CodeProducer’s Accuracy (%)User’s Accuracy (%)
1191.5593.573065.0653.13
1282.4280.794186.1089.91
1395.4696.334281.7676.59
2175.8168.355082.7285.59
2288.6787.416098.2399.37
Overall accuracy (%)86.59
Table 4. The structure features of land use and land cover change from 1990 to 2010 in Luang Namtha Province.
Class Code199020002010K (%)
A (km2)P (%)A (km2)P (%)A (km2)P (%)T1T2T3
11102.261.10175.051.88171.221.847.12−0.226.74
1230.060.3258.600.6361.340.669.490.4710.41
1312.920.1485.990.92236.372.5356.5617.49172.95
21 67.270.72
22 1.940.02223.242.39 1140.72
30204.892.20261.102.8091.460.982.74−6.50−5.54
418724.5293.568187.5887.807619.0481.71−0.62−0.69−1.27
42195.392.09502.345.39794.218.5215.715.8130.65
509.420.1015.430.1624.000.266.385.5515.48
6045.540.4936.970.4036.850.39−1.88−0.03−1.91
Note: A: the total area; P: the proportion of area; T1 represents the period from 1990 to 2000, T2 represents the period from 2000 to 2010, T3 represents the period from 1990 to 2010.
Table 5. Transfer matrix of LUCC (Land use and land cover change) in Luang Namtha Province (%).
Class Code11121321223041425060
T1T2T1T2T1T2T1T2T1T2T1T2T1T2T1T2T1T2T1T2
1189.7678.86 0.98 6.72 5.600.121.354.152.772.821.412.461.810.690.50
120.373.5177.2454.82 0.56 1.88 6.33 1.0613.1218.866.9810.841.661.870.630.27
13 0.720.0611.1635.93 1.293.4957.8836.3128.9524.21
22 86.15 13.85
300.40 0.600.310.623.18 0.06 0.808.465.2869.6577.8720.0412.320.110.110.120.07
410.880.260.340.250.641.90 0.480.021.952.700.7490.7886.914.527.350.050.080.070.08
421.511.382.261.1413.998.25 2.860.038.343.862.0749.3149.7128.7725.550.160.450.110.25
507.515.980.981.76 0.75 1.24 0.9514.5614.682.515.4574.4469.19
604.275.300.740.63 0.40 0.81 0.700.450.8225.0511.883.534.790.260.2965.7074.38
Note: T1 represents the period from 1990 to 2000; T2 represents the period from 2000 to 2010.
Table 6. Cumulative matrix of LUCC in Luang Namtha Province (%).
Class Code11121321223041425060
T1T2T1T2T1T2T1T2T1T2T1T2T1T2T1T2T1T2T1T2
1152.4480.63 2.79 17.49 4.470.052.590.050.060.570.3116.2513.21.902.39
120.061.2039.652.39 0.14 1.64 1.69 0.680.050.150.420.803.224.540.510.43
13 0.160.091.6813.07 0.063.280.090.410.742.62
22 0.75
300.47 2.101.341.473.52 0.22 0.956.6315.031.742.678.184.051.501.210.680.53
4143.8312.4549.8933.2265.0665.67 58.6797.1272.8490.2966.5396.7393.3478.5375.7330.9026.8615.8318.71
421.694.057.539.3531.7917.54 21.372.8819.102.8911.401.183.2811.1916.162.039.380.593.37
500.400.540.150.44 0.17 0.08 0.160.020.030.050.1145.3344.37
601.111.130.570.38 0.06 0.44 0.120.080.330.140.060.320.220.770.4480.4974.57
Note: T1 represents the period from 1990 to 2000; T2 represents the period from 2000 to 2010.

