
Effect of Phase Change Materials (PCMs) Integrated into a Concrete Block on Heat Gain Prevention in a Hot Climate


Abstract
:1. Introduction
2. Materials and Methods
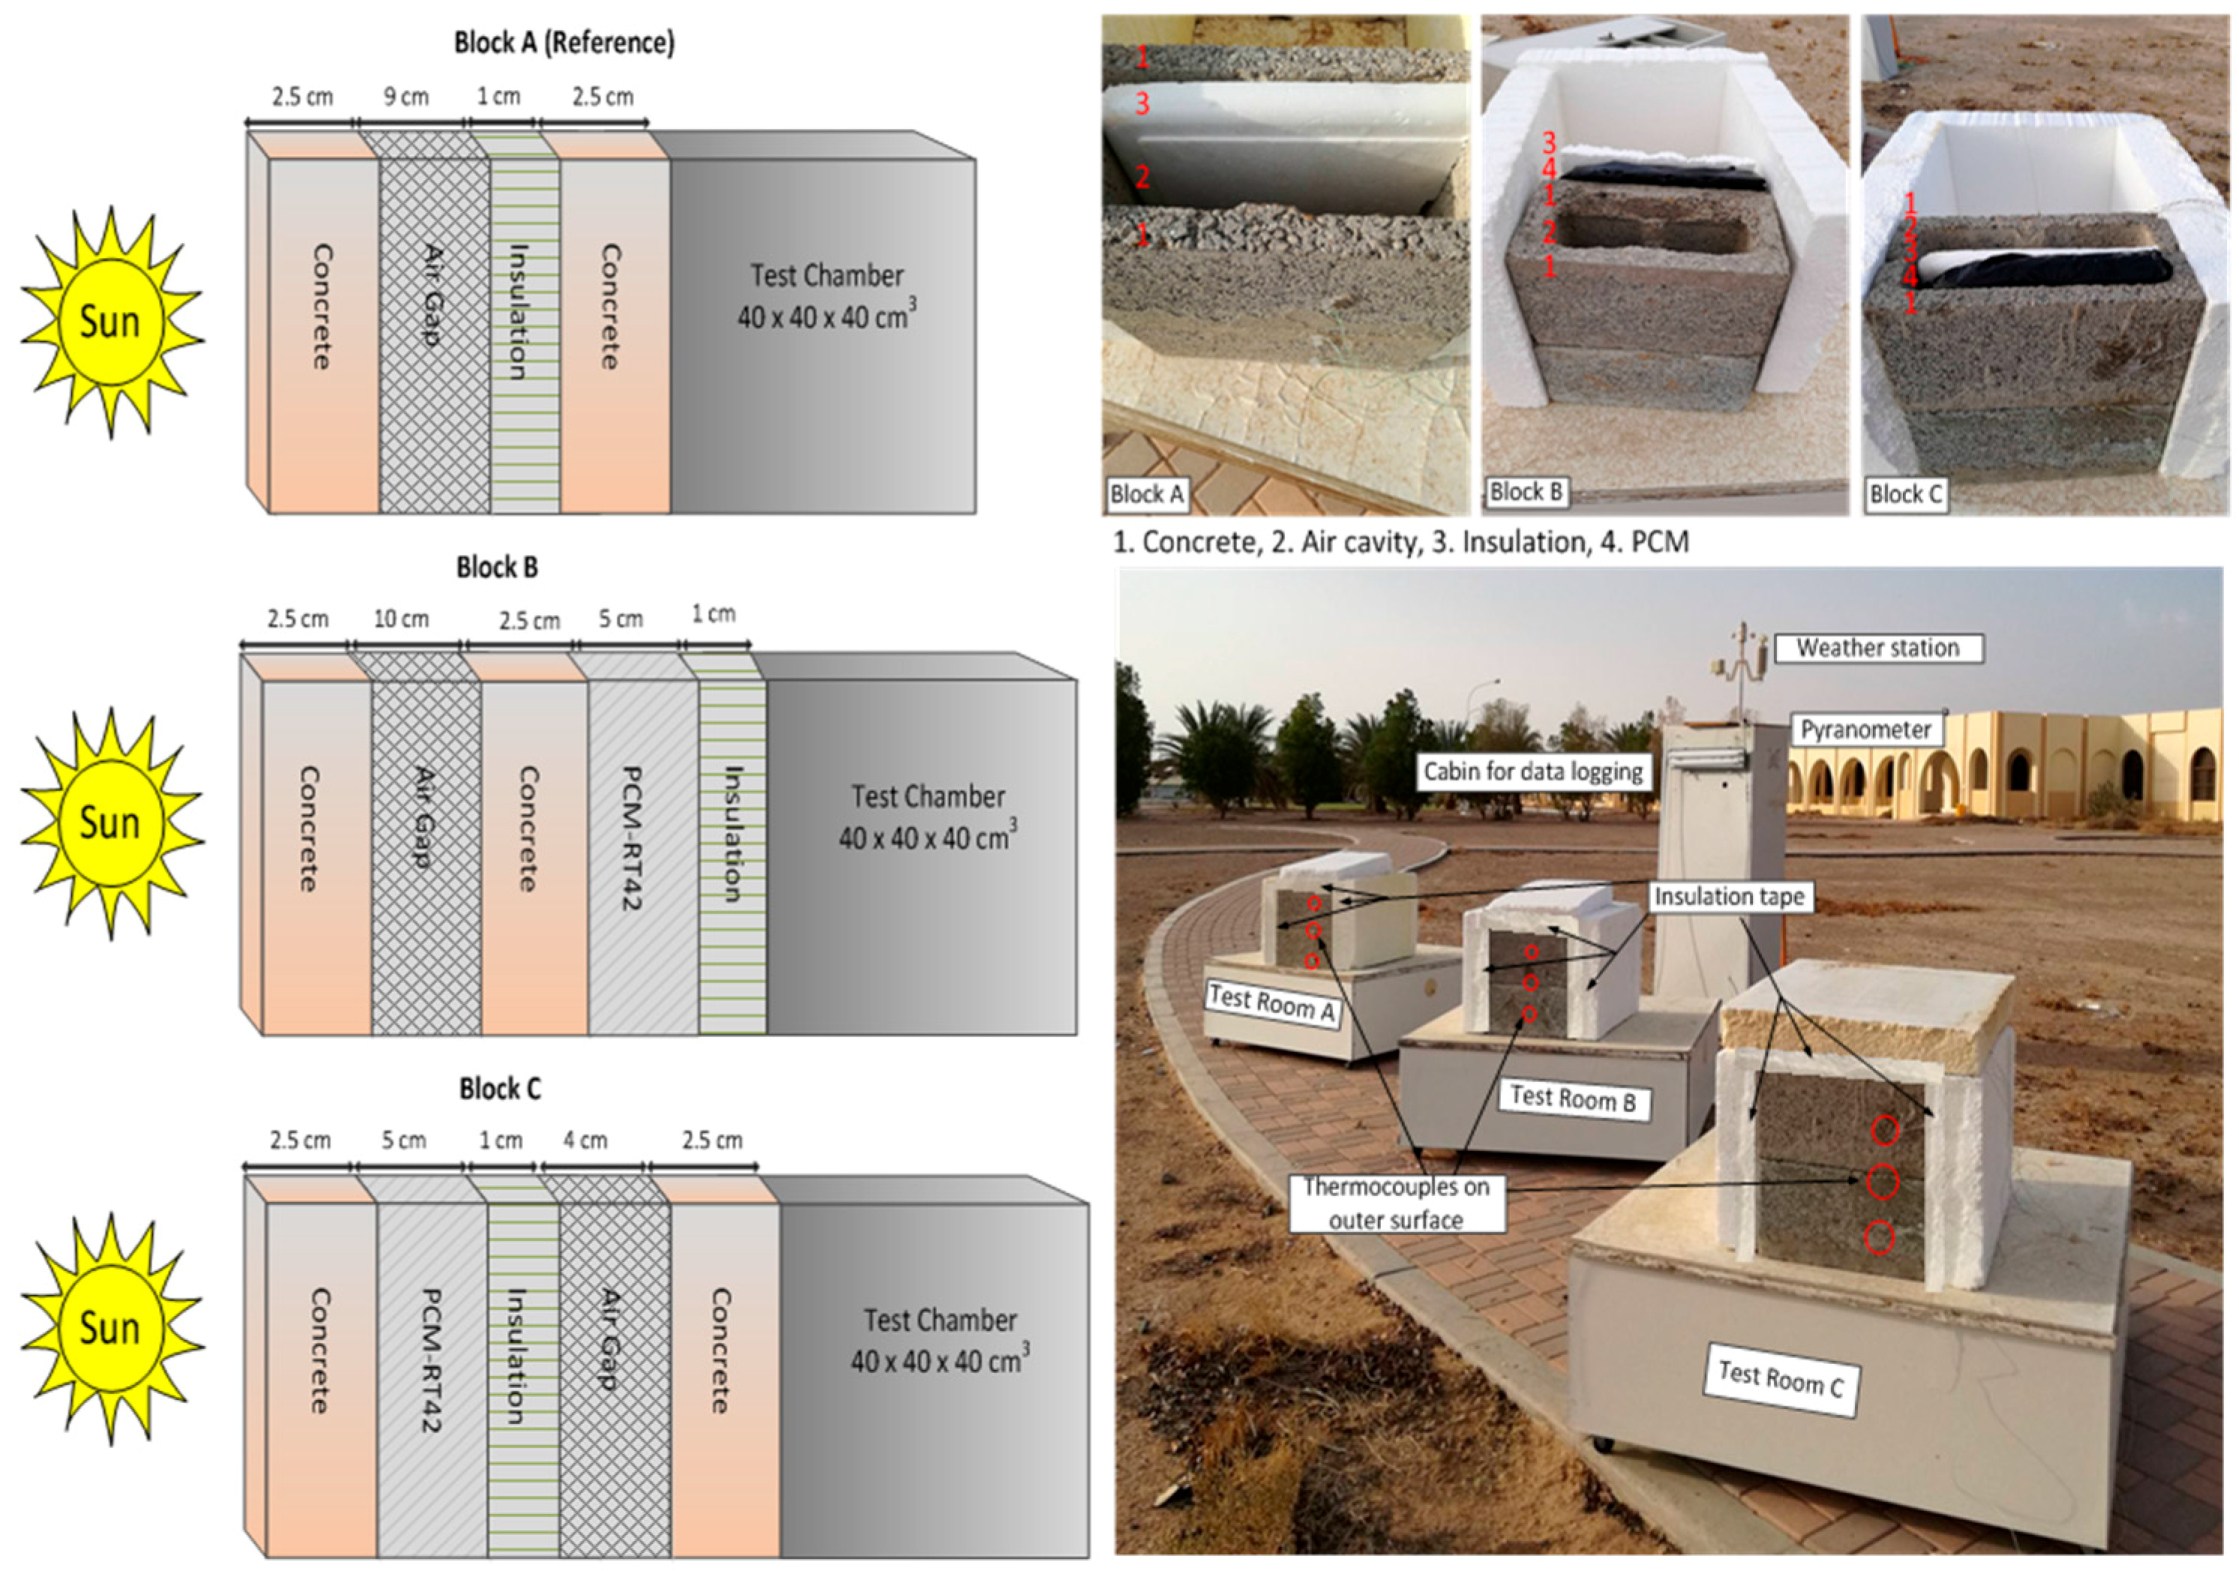
2.1. Selection of Experimental Parameters
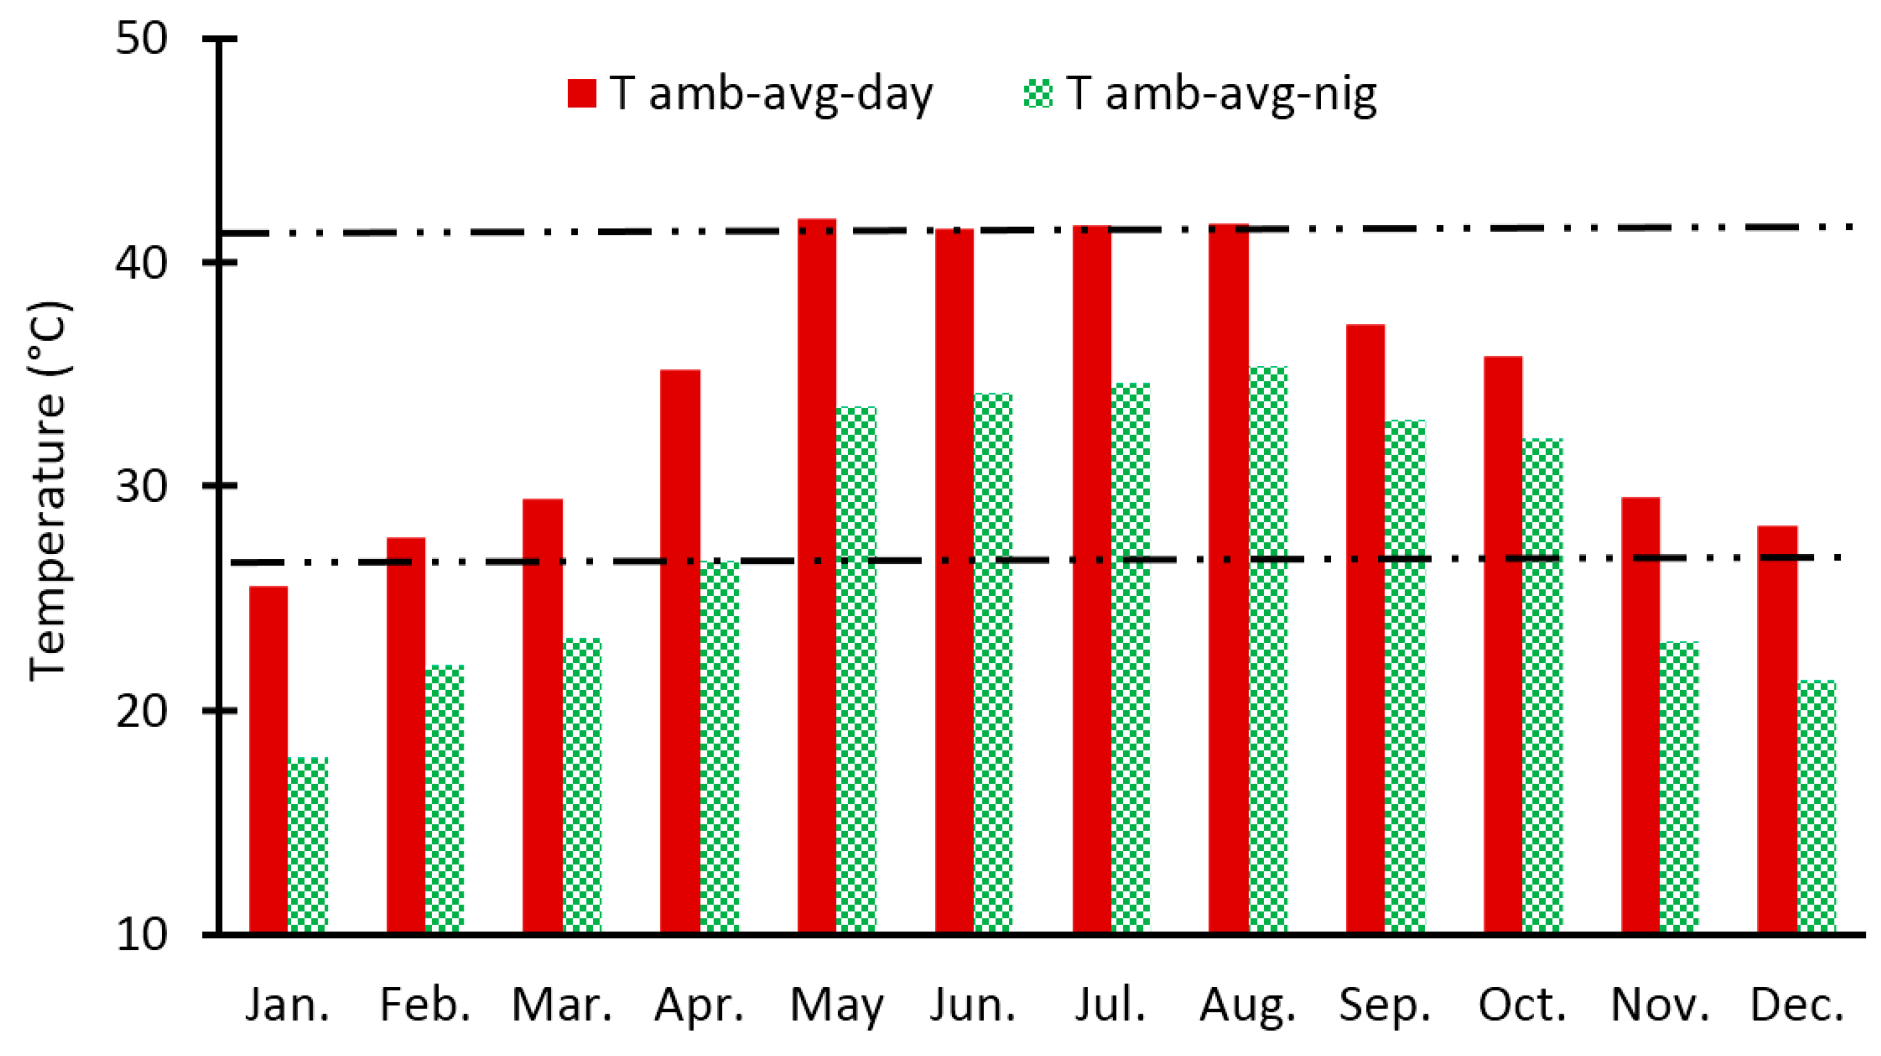
2.2. Selection of the Time for Experimentation
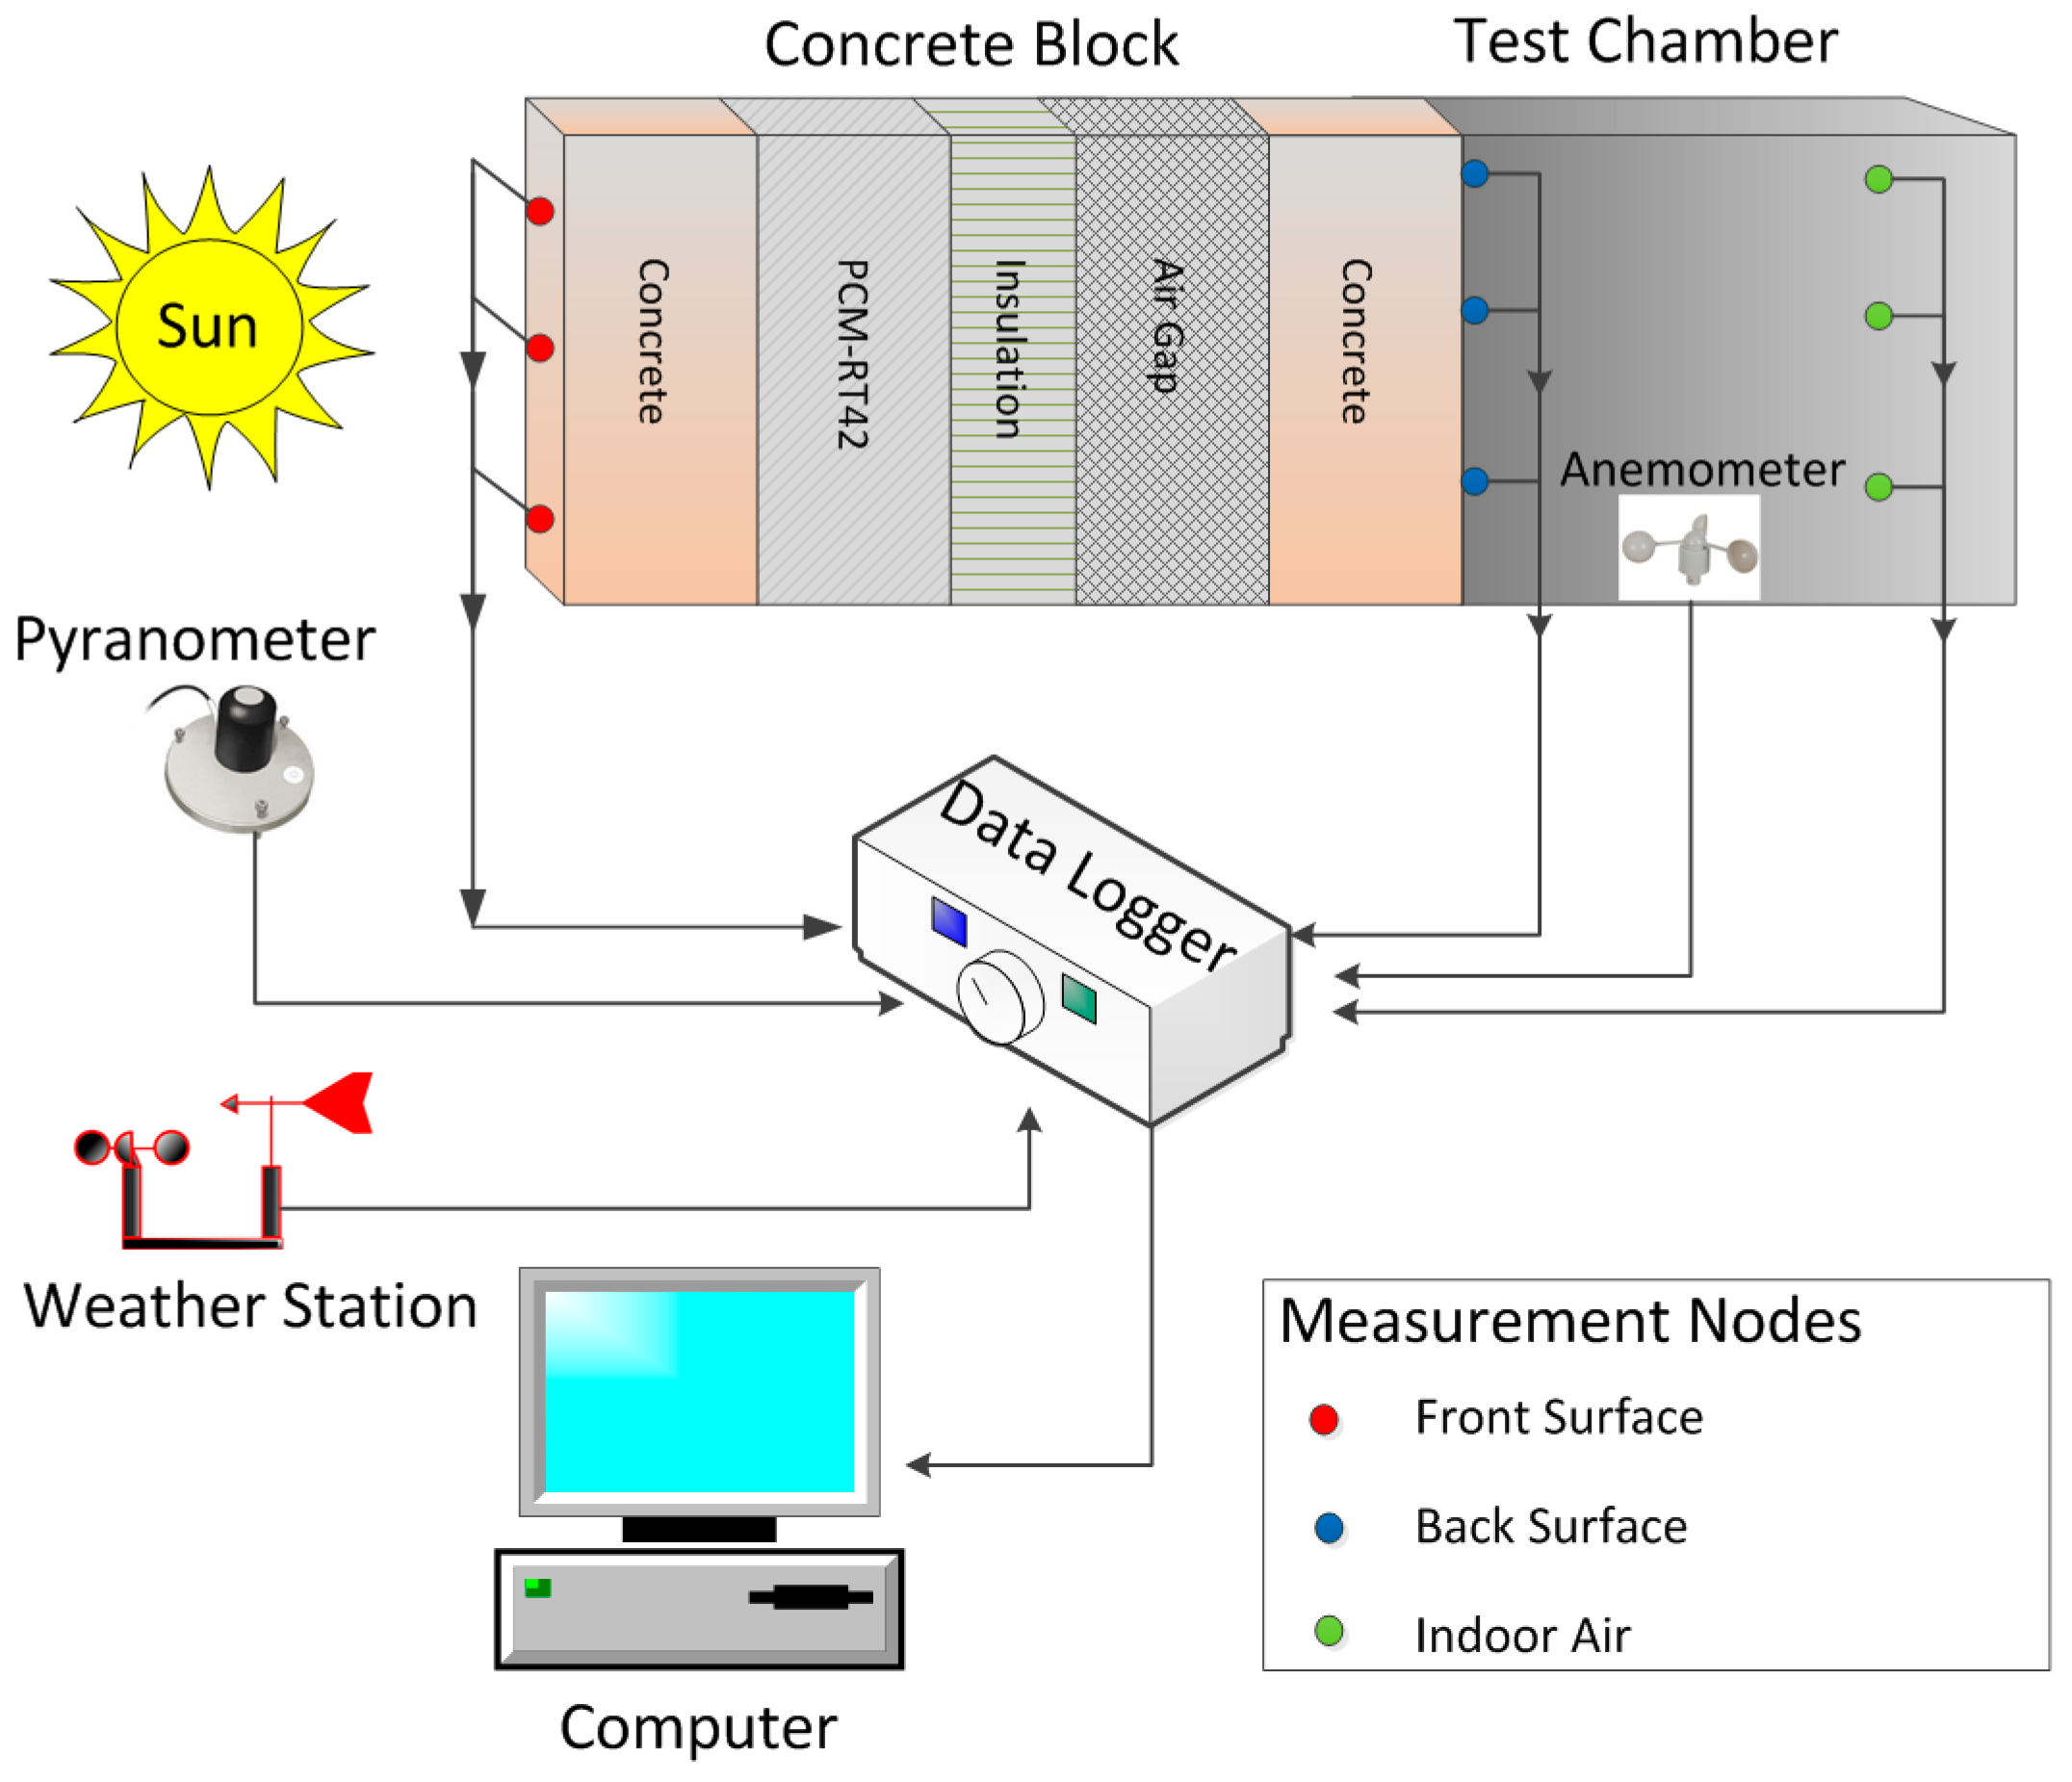
2.3. Methodology
3. Results
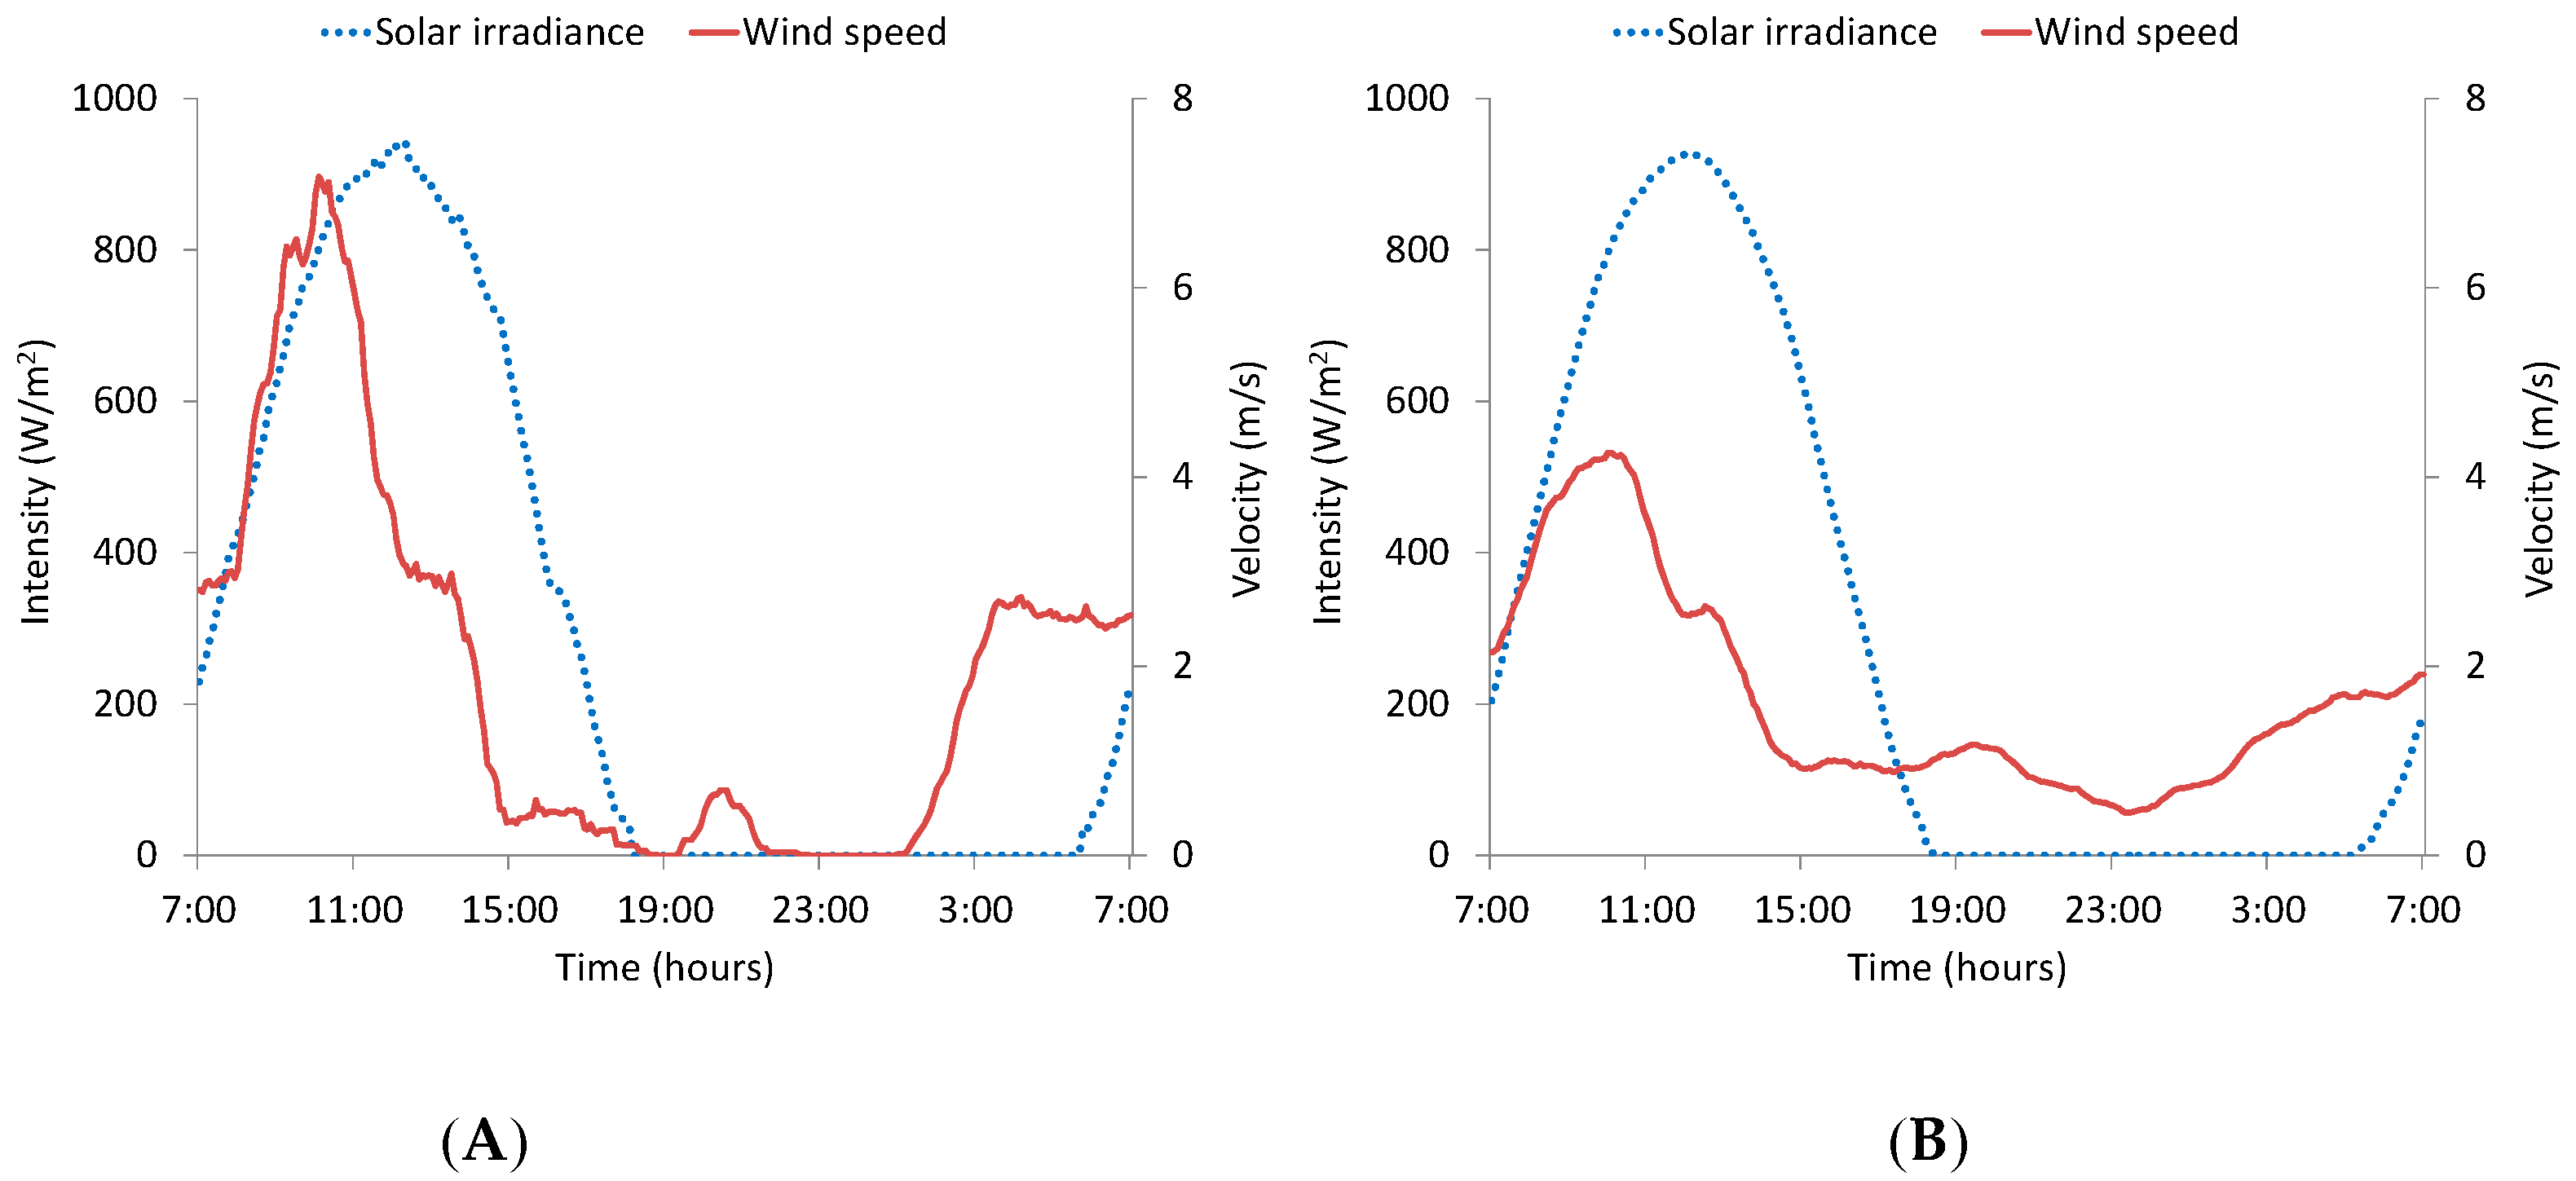
3.1. Weather Data
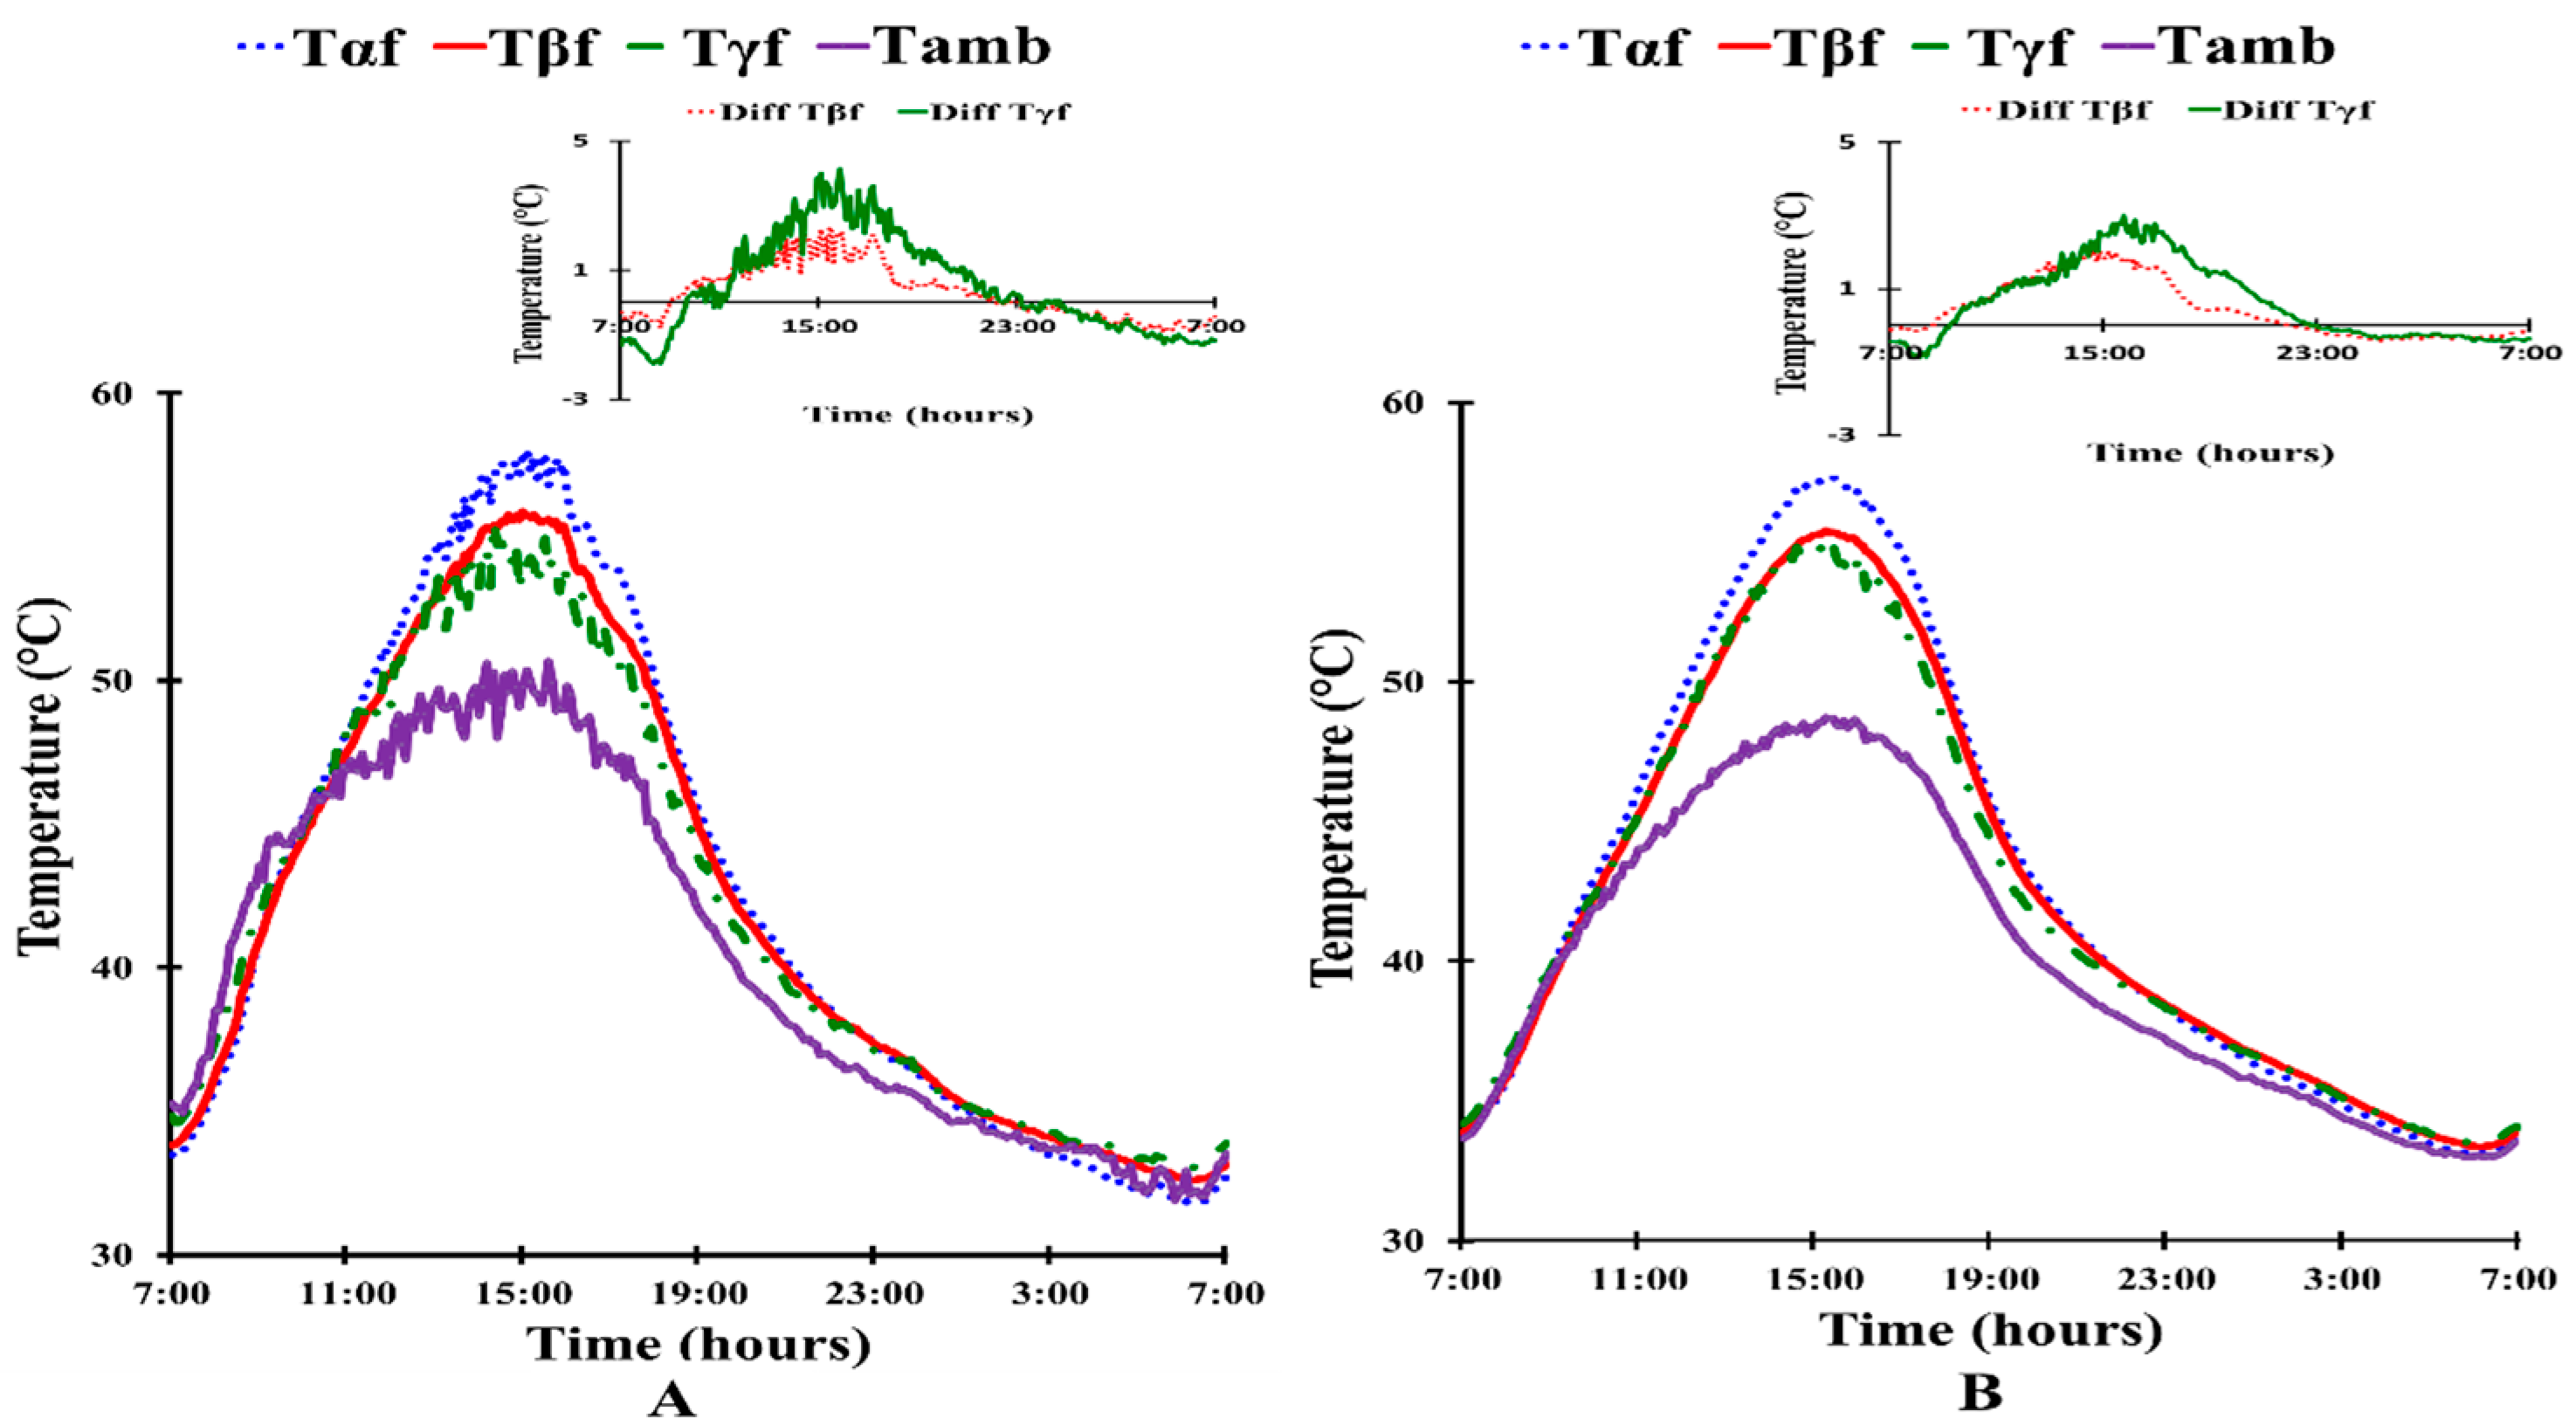
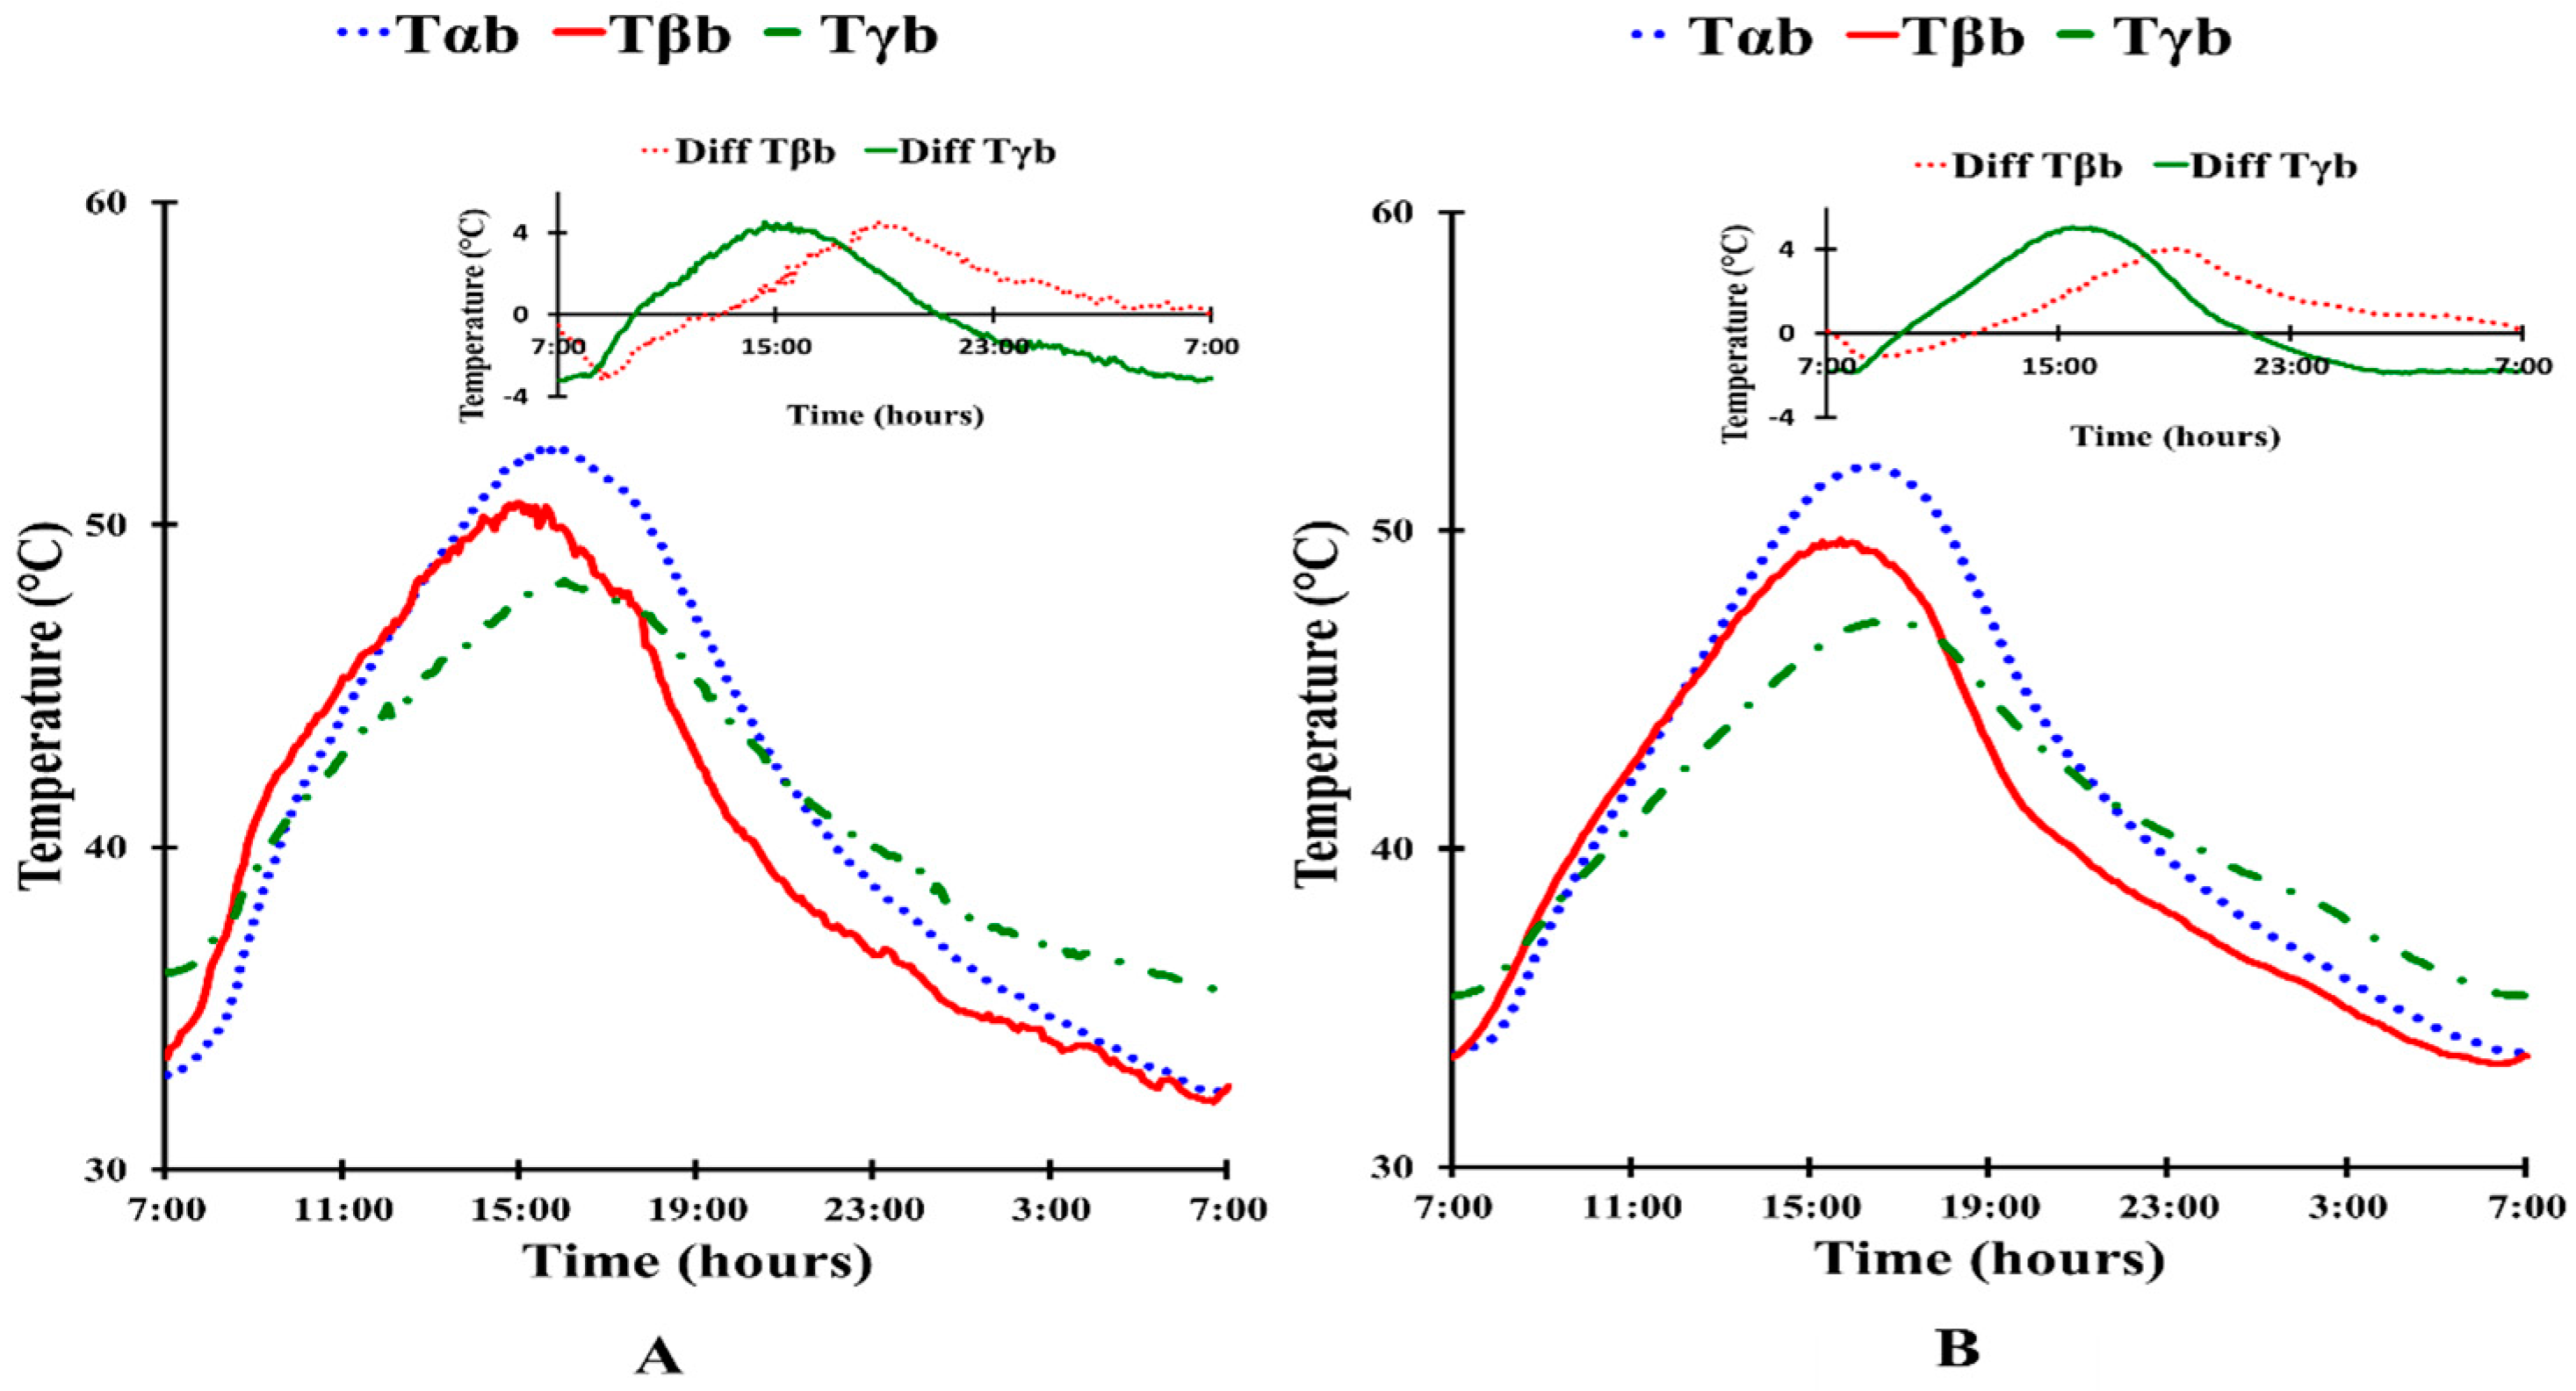
3.2. Temperature Drop
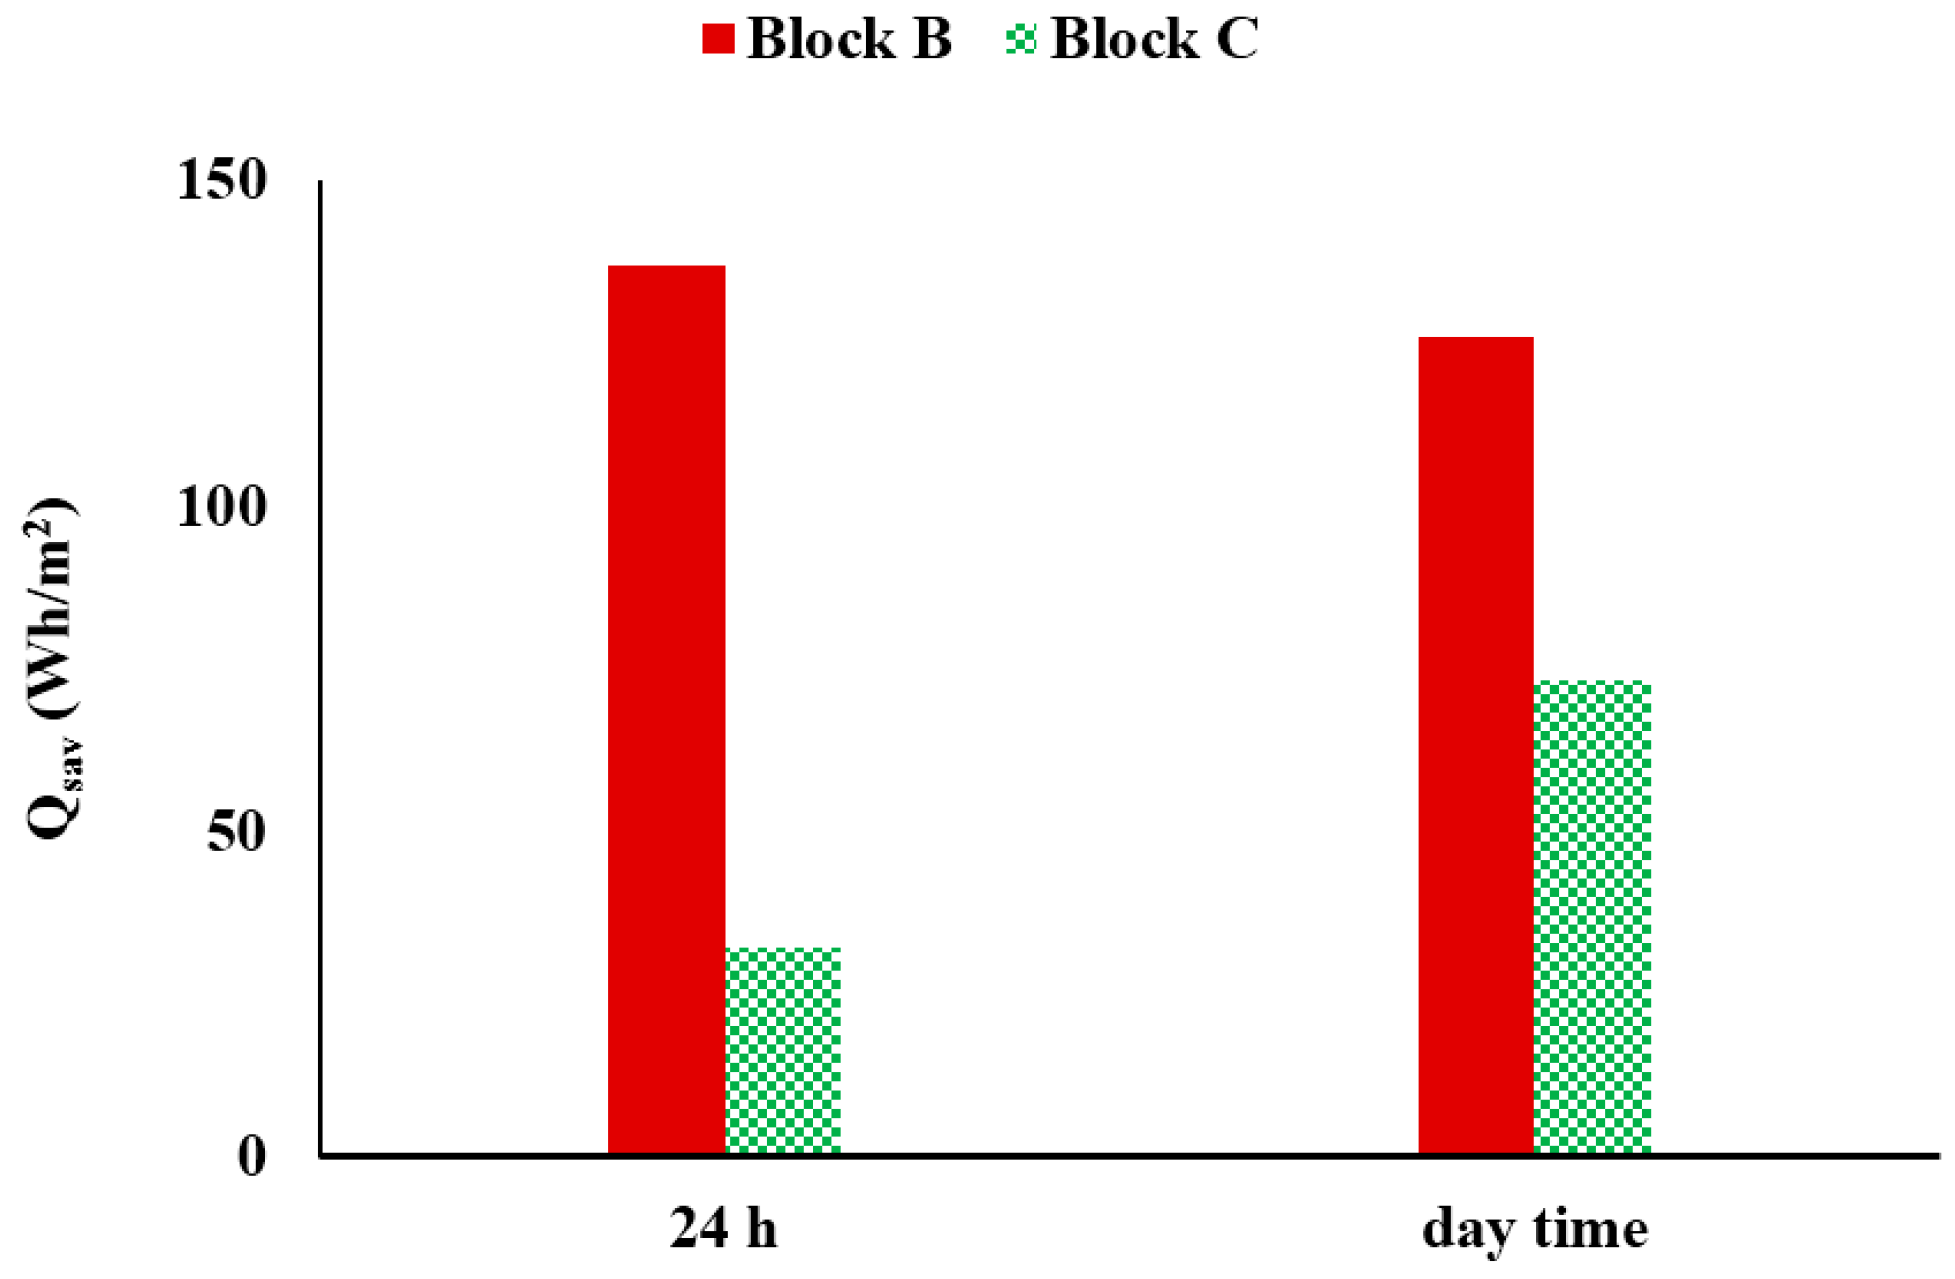
3.3. Reduction in Heat Gain
3.4. Research Limitations
- (1)
- The experiments were carried out in the peak summer conditions and are limited to 14 days only. Although the prevalent weather in Al Ain is hot, there are months that are mild to cool. Therefore, the net heat gain prevented in the peak of summer is expected to drop when aggregated for the whole year.
- (2)
- The experiments were conducted without studying leakage of the PCM over repeated cycles at the time scale of a year. This will be an important consideration for future research.
- (3)
- Natural or forced convection heat removal from the air cavity is not incorporated in the research, undermining the PCM re-solidification.
- (4)
- The scale of the experiment is very small and would be less representative of a building.
- (5)
- The authors plan to address all the stated limitations in future research.
4. Conclusions
Acknowledgments
Author Contributions
Conflicts of Interest
Nomenclature
| A | Surface area of the concrete block (m2) |
| CV | Coefficient of variation (%) |
| G | Global solar radiation intensity incident on the surface (W/m2) |
| hc | Convective heat transfer coefficient (W/m2·K) |
| HVAC | Heating, ventilation & air conditioning |
| m | Mass of the concrete block (kg) |
| PCM | Phase change material |
| Q | Heat transfer rate (W/m2) |
| Qin | Incident solar energy (Wh/m2) |
| SD | Population standard deviation |
| T | Temperature (°C) |
| t | time (h) |
| vw | Wind speed (m/s) |
| Subscripts | |
| α | Reference block A |
| β | Block B |
| γ | Block C |
| f | Front surface |
| b | Back surface |
| i | Indoor air |
References
- International Energy Agency. Key World Energy Statistics 2014; Chirat: Paris, France, 2014. [Google Scholar]
- U.S. Greenhouse Gas Inventory Report: 1990–2014. US Environmental Protection Agency. Available online: http://www.epa.gov/climatechange/emissions/usinventoryreport.html (accessed on 16 September 2016).
- Directive 2010/31/eu of the European Parliament and of the Council of 19 May 2010 on the Energy Performance of Buildings. Available online: http://eur-lex.europa.eu/LexUriServ/LexUriServ.do?uri=OJ:L:2010:153:0013:0035:EN:PDF (accessed on 16 September 2016).
- U.S. Energy Information Administration. Issues in International Energy Consumption Analysis: Canadian Energy Demand. Available online: https://www.eia.gov/analysis/studies/international/consumption/pdf/canadian_resconsump.pdf (accessed on 16 September 2016).
- U.S. Environmental Protection Agency. Draft Inventory of U.S. Greenhouse Gas Emissions and Sinks: 1990–2014; Environmental Protection Agency: Washington, DC, USA, 2016.
- UK Building Regulations and EU Directives. Zero Carbon Homes and Nearly zero Energy Buildings; Zero Carbon Hub: London, UK, 2014. [Google Scholar]
- Ulgen, K. Experimental and theoretical investigation of effects of wall’s thermophysical properties on time lag and decrement factor. Energy Build. 2002, 34, 273–278. [Google Scholar] [CrossRef]
- Kontoleon, K.J.; Bikas, D.K. The effect of south wall’s outdoor absorption coefficient on time lag, decrement factor and temperature variations. Energy Build. 2007, 39, 1011–1018. [Google Scholar] [CrossRef]
- Asan, H. Numerical computation of time lags and decrement factors for different building materials. Build. Environ. 2006, 41, 615–620. [Google Scholar] [CrossRef]
- Di Perna, C.; Stazi, F.; Casalena, A.U.; D’Orazio, M. Influence of the internal inertia of the building envelope on summertime comfort in buildings with high internal heat loads. Energy Build. 2011, 43, 200–206. [Google Scholar] [CrossRef]
- Aste, N.; Angelotti, A.; Buzzetti, M. The influence of the external walls thermal inertia on the energy performance of well insulated buildings. Energy Build. 2009, 41, 1181–1187. [Google Scholar] [CrossRef]
- De Gracia, A.; Cabeza, L.F. Phase change materials and thermal energy storage for buildings. Energy Build. 2015, 103, 414–419. [Google Scholar] [CrossRef]
- Raja, I.A.; Nicol, J.F.; McCartney, K.J.; Humphreys, M.A. Thermal comfort: Use of controls in naturally ventilated buildings. Energy Build. 2001, 33, 235–244. [Google Scholar] [CrossRef]
- Zhou, D.; Zhao, C.Y.; Tian, Y. Review on thermal energy storage with phase change materials (PCMs) in building applications. Appl. Energy 2012, 92, 593–605. [Google Scholar] [CrossRef] [Green Version]
- Evers, A.C.; Medina, M.A.; Fang, Y. Evaluation of the thermal performance of frame walls enhanced with paraffin and hydrated salt phase change materials using a dynamic wall simulator. Build. Environ. 2010, 45, 1762–1768. [Google Scholar] [CrossRef]
- Fang, Y. A Comprehensive Study of Phase Change Materials (PCMs) for Building Walls Applications. Ph.D. Thesis, University of Kansas, Lawrence, KS, USA, 9 March 2009. [Google Scholar]
- Mathieu-Potvin, F.; Gosselin, L. Thermal shielding of multilayer walls with phase change materials under different transient boundary conditions. Int. J. Ther. Sci. 2009, 48, 1707–1717. [Google Scholar] [CrossRef]
- Diaconu, B.M.; Cruceru, M. Novel concept of composite phase change material wall system for year-round thermal energy savings. Energy Build. 2010, 42, 1759–1772. [Google Scholar] [CrossRef]
- Huang, M.J.; Eames, P.C.; Hewitt, N.J. The application of a validated numerical model to predict the energy conservation potential of using phase change materials in the fabric of a building. Sol. Energy Mater. Sol. Cells 2006, 90, 1951–1960. [Google Scholar] [CrossRef]
- Lee, K.O.; Medina, M.A.; Raith, E.; Sun, X. Assessing the integration of a thin phase change material (PCM) layer in a residential building wall for heat transfer reduction and management. Appl. Energy 2015, 137, 699–706. [Google Scholar] [CrossRef]
- Jin, X.; Medina, M.A.; Zhang, X. On the placement of a phase change material thermal shield within the cavity of buildings walls for heat transfer rate reduction. Energy 2014, 73, 780–786. [Google Scholar] [CrossRef]
- Selka, G.; Korti, A.N.; Abboudi, S. Dynamic thermal behavior of building using phase change materials for latent heat storage. Therm. Sci. 2014, 19, 134. [Google Scholar] [CrossRef]
- Soares, N.; Gaspar, A.R.; Santos, P.; Costa, J.J. Experimental evaluation of the heat transfer through small PCM-based thermal energy storage units for building applications. Energy Build. 2016, 116, 18–34. [Google Scholar] [CrossRef]
- Royon, L.; Karim, L.; Bontemps, A. Thermal energy storage and release of a new component with PCM for integration in floors for thermal management of buildings. Energy Build. 2013, 63, 29–35. [Google Scholar] [CrossRef]
- Soares, N.; Samagaio, A.; Vicente, R.; Costa, J. Numerical simulation of a PCM shutter for buildings space heating during the winter. In Proceedings of the World Renewable Energy Congress-Sweden, Linköping, Sweden, 8–13 May 2011; Linköping University Electronic Press: Linköping, Sweden; pp. 1797–1804.
- Kośny, J.; Biswas, K.; Miller, W.; Kriner, S. Field thermal performance of naturally ventilated solar roof with PCM heat sink. Sol. Energy 2012, 86, 2504–2514. [Google Scholar] [CrossRef]
- Lee, K.O.; Medina, M.A. Using phase change materials for residential air conditioning peak demand reduction and energy conservation in coastal and transitional climates in the State of California. Energy Build. 2016, 116, 69–77. [Google Scholar] [CrossRef]
- Campbell, K.R.; Sailor, D.J. Phase change materials as thermal storage for high performance homes. In Proceedings of the ASME 2011 International Mechanical Engineering Congress and Exposition, Denver, CO, USA, 11–17 November 2011; pp. 809–818.
- Heim, D.; Wieprzkowicz, A. Positioning of an isothermal heat storage layer in a building wall exposed to the external environment. J. Build. Perform. Simul. 2016. [Google Scholar] [CrossRef]
- Evola, G.; Marletta, L.; Sicurella, F. Simulation of a ventilated cavity to enhance the effectiveness of PCM wallboards for summer thermal comfort in buildings. Energy Build. 2014, 70, 480–489. [Google Scholar] [CrossRef]
- Neeper, D.A. Thermal dynamics of wallboard with latent heat storage. Sol. Energy 2000, 68, 393–403. [Google Scholar] [CrossRef]
- Heim, D.; Clarke, J.A. Numerical modelling and thermal simulation of PCM–gypsum composites with ESP-r. Energy Build. 2004, 36, 795–805. [Google Scholar] [CrossRef]
- Hasan, A.; McCormack, S.J.; Huang, M.J.; Norton, B. Characterization of phase change materials for thermal control of photovoltaics using Differential Scanning Calorimetry and Temperature History Method. Energy Convers. Manag. 2014, 81, 322–329. [Google Scholar] [CrossRef]
- Hasan, A.; Alnoman, H.; Rashid, Y. Impact of integrated photovoltaic-phase change material system on building energy efficiency in hot climate. Energy Build. 2016, 130, 495–505. [Google Scholar] [CrossRef]
- Rubitherm. Available online: http://www.rubitherm.eu/media/products/datasheets/Techdata_-RT42_EN_09052016.PDF (accessed on 5 August 2016).
- Apogee Instruments. Specification Sheet. Available online: http://www.apogeeinstruments.co.uk/content/SP-100-200-spec-sheet.pdf (accessed on 5 August 2016).
- National Instruments. Available online: http://sine.ni.com/nips/cds/view/p/lang/en/nid/205621 (accessed on 5 August 2016).
- Sharples, S.; Charlesworth, P.S. Full-scale measurements of wind-induced convective heat transfer from a roof-mounted flat plate solar collector. Sol. Energy 1998, 62, 69–77. [Google Scholar] [CrossRef]
- Cabeza, L.F.; Castellon, C.; Nogues, M.; Medrano, M.; Leppers, R.; Zubillaga, O. Use of microencapsulated PCM in concrete walls for energy savings. Energy Build. 2007, 39, 113–119. [Google Scholar] [CrossRef]
- Zhou, G.; He, J. Thermal performance of a radiant floor heating system with different heat storage materials and heating pipes. Appl. Energy 2015, 138, 648–660. [Google Scholar] [CrossRef]
- Hasan, A.; McCormack, S.J.; Huang, M.J.; Sarwar, J.; Norton, B. Increased photovoltaic performance through temperature regulation by phase change materials: Materials comparison in different climates. Sol. Energy 2015, 115, 264–276. [Google Scholar] [CrossRef]


| Properties | Melting Point (°C) | Congealing Point (°C) | Latent Heat (KJ/kg) | Specific Heat Capacity (KJ/kg·K) | Heat Conductivity (W/m·K) | Density (kg/m3) | Volume Expansion | Flash Point (°C) |
|---|---|---|---|---|---|---|---|---|
| PCM-RT42 [35] | 38–42 | 42–37 | 145% ± 7.5% | 2 | 0.2 | 880 s 760 l | 12.5% | 186 |
| Polystyrene | 240 | NA | NA | 1.3–1.5 | 0.032 | NA | NA | 350 |
| Epoxy Resin | 130 | NA | NA | 1 | 1.26 | 2.09 | 34 × 10−6/K | 350 |
| Days | 1 | 2 | 3 | 4 | 5 | 6 | 7 | 8 | 9 | 10 | 11 | 12 | 13 | 14 | Mean | SD 1* | CV 2* | |
|---|---|---|---|---|---|---|---|---|---|---|---|---|---|---|---|---|---|---|
| G | Total (Wh/day) | 717 | 713 | 679 | 713 | 740 | 722 | 704 | 727 | 709 | 705 | 727 | 717 | 719 | 711 | 709 | 14 | 1.9% |
| Max. (Wm−2) | 944 | 917 | 907 | 922 | 980 | 950 | 919 | 975 | 907 | 914 | 958 | 950 | 939 | 934 | 944 | 23 | 2.5% | |
| vw (m/s) | Max. | 7.2 | 6.1 | 5.2 | 5.3 | 4.1 | 5.3 | 5.3 | 3.6 | 3.4 | 3.3 | 3.5 | 5.6 | 5.7 | 5.1 | 5.2 | 1.1 | 21.4% |
| Avg. | 1.9 | 1.6 | 2.1 | 2.3 | 1.8 | 1.8 | 1.6 | 1.1 | 1.2 | 1.1 | 1.5 | 2.0 | 1.9 | 1.2 | 1.7 | 0.4 | 21.8% | |
| Tamb (°C) | Max. | 50.7 | 50.6 | 51.1 | 48.9 | 48.8 | 48.2 | 48.8 | 50.7 | 50.6 | 50.6 | 49.7 | 49.1 | 49.7 | 51.0 | 49.6 | 0.9 | 1.9% |
| Min. | 31.9 | 32.3 | 31.5 | 30.9 | 31.1 | 31.2 | 33.1 | 33.0 | 32.9 | 33.1 | 34.0 | 33.9 | 33.7 | 33.2 | 32.4 | 1.0 | 3.2% | |
| Avg. | 40.6 | 40.5 | 39.7 | 38.5 | 38.5 | 38.2 | 40.0 | 41.2 | 40.8 | 41.1 | 40.9 | 40.3 | 40.3 | 41.2 | 39.7 | 1.0 | 2.5% | |
| Tαf (°C) | Max. | 58.0 | 58.2 | 58.1 | 56.8 | 56.5 | 56.4 | 56.6 | 59.3 | 57.7 | 58.9 | 58.0 | 57.0 | 57.9 | 59.9 | 58.1 | 1.0 | 1.8% |
| Avg. | 42.6 | 43.1 | 42.7 | 41.5 | 41.3 | 41.4 | 42.6 | 43.5 | 43.2 | 43.9 | 43.7 | 43.0 | 42.9 | 43.7 | 42.6 | 0.8 | 1.9% | |
| Tβf (°C) | Max. | 55.9 | 55.8 | 56.1 | 54.3 | 54.0 | 53.8 | 54.3 | 57.1 | 55.5 | 56.9 | 56.2 | 55.0 | 55.6 | 57.8 | 55.8 | 1.2 | 2.1% |
| Avg. | 42.3 | 42.7 | 42.4 | 41.0 | 40.8 | 40.8 | 42.3 | 43.1 | 42.7 | 43.4 | 43.3 | 42.5 | 42.5 | 43.2 | 42.1 | 0.9 | 2.1% | |
| Diff. | 2.3 | 2.5 | 2.2 | 2.8 | 2.5 | 2.7 | 2.5 | 2.6 | 2.2 | 2.1 | 2.2 | 2.3 | 2.6 | 2.3 | 2.5 | 0.2 | 8.3% | |
| Tγf (°C) | Max. | 55.6 | 55.4 | 56.4 | 54.2 | 54.5 | 53.8 | 54.9 | 56.8 | 56.5 | 57.7 | 56.7 | 56.4 | 56.3 | 58.6 | 56.2 | 1.3 | 2.3% |
| Avg. | 42.1 | 42.4 | 41.8 | 40.7 | 40.5 | 40.5 | 42.0 | 42.9 | 42.6 | 43.4 | 43.2 | 42.4 | 42.3 | 43.4 | 41.9 | 1.0 | 2.3% | |
| Diff | 4.1 | 4.3 | 3.9 | 4.5 | 4.1 | 4.7 | 4.7 | 4.1 | 3.3 | 4.2 | 3.7 | 3.6 | 3.7 | 3.6 | 4.0 | 0.4 | 10.2% | |
| Tαb (°C) | Max. | 52.4 | 52.7 | 52.8 | 51.5 | 50.7 | 50.9 | 51.1 | 53.2 | 52.0 | 53.4 | 52.7 | 51.4 | 52.1 | 54.3 | 52.5 | 1.0 | 1.9% |
| Avg. | 41.6 | 41.9 | 41.4 | 40.2 | 40.1 | 40.0 | 41.5 | 42.5 | 42.1 | 42.6 | 42.7 | 41.9 | 41.8 | 42.6 | 41.1 | 0.9 | 2.2% | |
| Tβb (°C) | Max. | 50.7 | 50.4 | 51.0 | 49.2 | 48.4 | 48.3 | 48.6 | 51.2 | 50.2 | 50.9 | 50.3 | 49.3 | 49.7 | 51.4 | 49.9 | 1.0 | 2.0% |
| Avg. | 40.5 | 40.8 | 40.1 | 38.8 | 38.8 | 38.6 | 40.3 | 41.4 | 41.1 | 41.5 | 41.3 | 40.6 | 40.6 | 41.4 | 40 | 1.0 | 2.4% | |
| Diff. | 4.5 | 4.2 | 4.6 | 4.6 | 4.6 | 5.6 | 4.0 | 5.0 | 4.2 | 4.4 | 4.3 | 4.0 | 4.3 | 5.0 | 4.6 | 0.4 | 9.3% | |
| Tγb (°C) | Max. | 48.3 | 48.3 | 48.0 | 46.5 | 45.9 | 45.4 | 46.3 | 47.9 | 47.6 | 47.3 | 47.3 | 47.0 | 47.3 | 49.1 | 47.2 | 1.0 | 2.1% |
| Avg. | 41.5 | 41.7 | 41.0 | 39.7 | 39.6 | 39.2 | 40.7 | 41.6 | 41.1 | 41.3 | 41.6 | 41.0 | 41.2 | 42.1 | 40.6 | 0.8 | 2% | |
| Diff | 4.5 | 4.7 | 5.3 | 5.2 | 5.0 | 5.7 | 5.2 | 5.8 | 4.7 | 6.3 | 5.6 | 4.6 | 5.1 | 5.6 | 5.1 | 0.5 | 9.7% | |
| Tαi (°C) | Max. | 51.6 | 51.3 | 51.9 | 50.4 | 49.5 | 49.6 | 50.0 | 52.7 | 51.6 | 52.2 | 51.6 | 50.6 | 50.8 | 53.1 | 51.3 | 1.1 | 2.1% |
| Avg. | 40.9 | 41.1 | 40.5 | 39.4 | 39.3 | 39.2 | 40.7 | 41.8 | 41.6 | 42.0 | 41.9 | 41.1 | 41.1 | 41.9 | 40.6 | 0.9 | 2.3% | |
| Tβi (°C) | Max. | 50.8 | 50.6 | 51.1 | 49.4 | 48.4 | 48.3 | 48.7 | 51.2 | 50.4 | 51.1 | 50.3 | 49.4 | 49.6 | 51.3 | 49.8 | 1.0 | 2.0% |
| Avg. | 40.4 | 40.7 | 40.0 | 38.7 | 38.7 | 38.5 | 40.1 | 41.3 | 41.0 | 41.3 | 41.2 | 40.5 | 40.5 | 41.3 | 39.9 | 1.0 | 2.4% | |
| Diff. | 1.7 | 1.6 | 1.6 | 1.9 | 1.8 | 2.1 | 1.7 | 2.4 | 2.1 | 2.8 | 1.9 | 2.1 | 2.1 | 2.5 | 2.2 | 0.3 | 15.5% | |
| Tγi (°C) | Max. | 49.4 | 49.3 | 49.0 | 47.7 | 46.8 | 46.5 | 47.3 | 49.2 | 48.6 | 48.2 | 48.3 | 47.9 | 48.0 | 49.6 | 48 | 1.0 | 2.0% |
| Avg. | 40.9 | 41.2 | 40.4 | 39.1 | 39.0 | 38.8 | 40.3 | 41.4 | 41.1 | 41.3 | 41.4 | 40.7 | 40.8 | 41.6 | 40.2 | 0.9 | 2.3% | |
| Diff | 3.3 | 3.0 | 3.8 | 3.4 | 3.7 | 3.9 | 3.4 | 4.2 | 3.7 | 4.4 | 3.9 | 3.2 | 3.5 | 3.9 | 3.7 | 0.4 | 10.2% |
© 2016 by the authors; licensee MDPI, Basel, Switzerland. This article is an open access article distributed under the terms and conditions of the Creative Commons Attribution (CC-BY) license (http://creativecommons.org/licenses/by/4.0/).
Share and Cite
Hasan, A.; Al-Sallal, K.A.; Alnoman, H.; Rashid, Y.; Abdelbaqi, S. Effect of Phase Change Materials (PCMs) Integrated into a Concrete Block on Heat Gain Prevention in a Hot Climate. Sustainability 2016, 8, 1009. https://doi.org/10.3390/su8101009
Hasan A, Al-Sallal KA, Alnoman H, Rashid Y, Abdelbaqi S. Effect of Phase Change Materials (PCMs) Integrated into a Concrete Block on Heat Gain Prevention in a Hot Climate. Sustainability. 2016; 8(10):1009. https://doi.org/10.3390/su8101009
Chicago/Turabian StyleHasan, Ahmad, Khaled A. Al-Sallal, Hamza Alnoman, Yasir Rashid, and Shaimaa Abdelbaqi. 2016. "Effect of Phase Change Materials (PCMs) Integrated into a Concrete Block on Heat Gain Prevention in a Hot Climate" Sustainability 8, no. 10: 1009. https://doi.org/10.3390/su8101009