Article

The Impacts of Land Use Change on Residents’ Living Based on Urban Metabolism: A Case Study in Yangzhou City of Jiangsu Province, China

School of Public Administration, China University of Geosciences, Wuhan 430074, China
*
Author to whom correspondence should be addressed.
Sustainability 2016, 8(10), 1004; https://doi.org/10.3390/su8101004
Submission received: 19 July 2016 / Revised: 22 September 2016 / Accepted: 4 October 2016 / Published: 9 October 2016

Abstract

:
Land use change is one of the fundamental influence factors of human life and well-being. The land use change due to the unprecedented urbanization in China not only causes an increase of resource consumption and threatens food security, but also affects the people’s living standard which deserves our attention. This study aims to reveal the impacts of land use change on residents’ living standard in Yangzhou based on urban metabolism by sensitivity and regression analysis. Results showed that during the period from 1995 to 2014, the flux of emergy increased about 156.56% and the ratio of fuels & electricity emergy flow had increased from 2.86% to 9.20% due to energy demands getting larger, while the built-up land increased by 415.05 km2 and the cultivated land reduced by 417.24 km2. Sensitivity analysis showed that the expansion of built-up land improved residents’ living standards and enriched their material life, while people’s lives were also increasingly dependent on energy consumption and sustainability was being reduced. The regression analysis indicated that people’s lifestyles were transforming to economical and intensive utilization of resources with the built-up area expansion. The results can provide feasible recommendations for land use planning and urban development from the aspect of human life and well-being.

1. Introduction

The land is the material foundation of human survival and development, the labor materials of social production, and the basic labor materials of agricultural production. Therefore, land use change exerts an essential effect on people’s lives and human well-being. According to the rapid development of urbanization, a rising number of people live in urban areas rather than in rural areas. In 2014, 54% of the world’s population was located in urban areas, and by 2050, 66% of the world’s population is projected to be located in urban areas [1]. Urban areas will become the major living environment for most of the world’s population in the future [2]. As a consequence of urbanization, great changes have taken place in land use. The built-up area is fast expanding and the cultivated land is continuously decreasing, and that has had a significant influence on people’s daily lives.
Urban areas are semi-open ecosystems that must exchange the materials and energy needed to maintain their operation, and eject the wastes they generate to the outside environment [3]. As with similar processes of urban operation, people’s lives in urban areas are also a metabolism process in which people consume the necessities of life, such as food and energy, and discharge waste to the external environment at the same time. The metabolic process plays a determinative effect on the level and quality of people’s lives, which decides the amount of various energies and materials consumed by people. Therefore, to understand the trends in its metabolism, where energy and materials are used as inputs and waste as the output, it is very important to investigate the change of people’s living standards.
Emergy-based urban metabolism provides a method for evaluating the quality of people’s lives. Since Wolman (1965) first proposed the concept of urban metabolism [4], research studies have been carried out by scholars across the world. Early researchers use the method of material-flow to calculate the energy in urban metabolism. However, using the material-flow method for urban metabolism ignored the other forms of energy contained in the materials and services. In order to remedy the defects, H.T. Odum introduced the emergy theory to comprehensively elaborate the internal energy and resources of a system. Emergy, which is different from energy, is the total energy input required in forming process of a certain kind of product, resource, or service [5]. The city is regarded as a heterotrophic ecosystem in H.T. Odum’s emergy theory, and the theory uses the method of quantitative analysis to describe the different forms and qualities of energy and its relationship among society, the economy, and the external environment [6]. Urban metabolism based on emergy analysis has become a hot research topic in academia; for example, Song et al. used emergy theory and the Slack Based Model to analyze the urban metabolic development in Beijing from 2001 to 2010 [7], Mellino et al. investigated urban metabolism and urbanization processes over time (1990–2006) in the Campania Region to assess the environmental worth and quality of lands [8], and Zhang et al. conducted a socio-economic metabolism analysis based on emergy analysis to assess the sustainability of Qingyang city [9].
To analyze the consumption and accumulation of material and energy under the background of land use change, the International Human Dimensions Program on Global Environmental Change (IHPD) defined the discussion between land use change and social metabolism as the core plan for global change [3]. In recent years, some scholars have carried out preliminary attempts in this field. Lee et al. adopted a spatial system modeling method for the Taipei Metropolitan Region to simulate the spatial-temporal dynamics of socio-economic metabolism and land use change [10]. Huang et al. analyzed the relationship between urban metabolism and land use by correlation analysis and regression analysis [3], and Vega-Azamar et al. used emergy synthesis to assess the sustainability of the residential land use of seven boroughs on the Island of Montreal [11]. However, most of the previous research chose the resource consumption, asset accumulation, and waste emission of the whole area or city as the focus, while the study of the effects of land use change on urban metabolism of residents’ lives is still in its infancy.
In this paper, we analyzed the flows of the emergy in residents’ lives by urban metabolism and introduced a set of emergy-based indices for evaluating the metabolic structure, intensity, and efficiency during 1995 to 2014 in Yangzhou. Then we analyzed the land use change of the study area by numerical analysis and the dynamic degree of land use. We then attempted to reveal the impacts of land use change on the urban metabolism of residents’ lives by sensitivity analysis and regression analysis. Thus, this work provides an overview of the change of residents’ lives based on urban metabolism and land use change in Yangzhou. The results can offer new ideas for land administration and urban planning, and provide a frame of reference for enhancing the quality of life of people in urban areas.

2. Study Area and Data Sources

2.1. Study Area

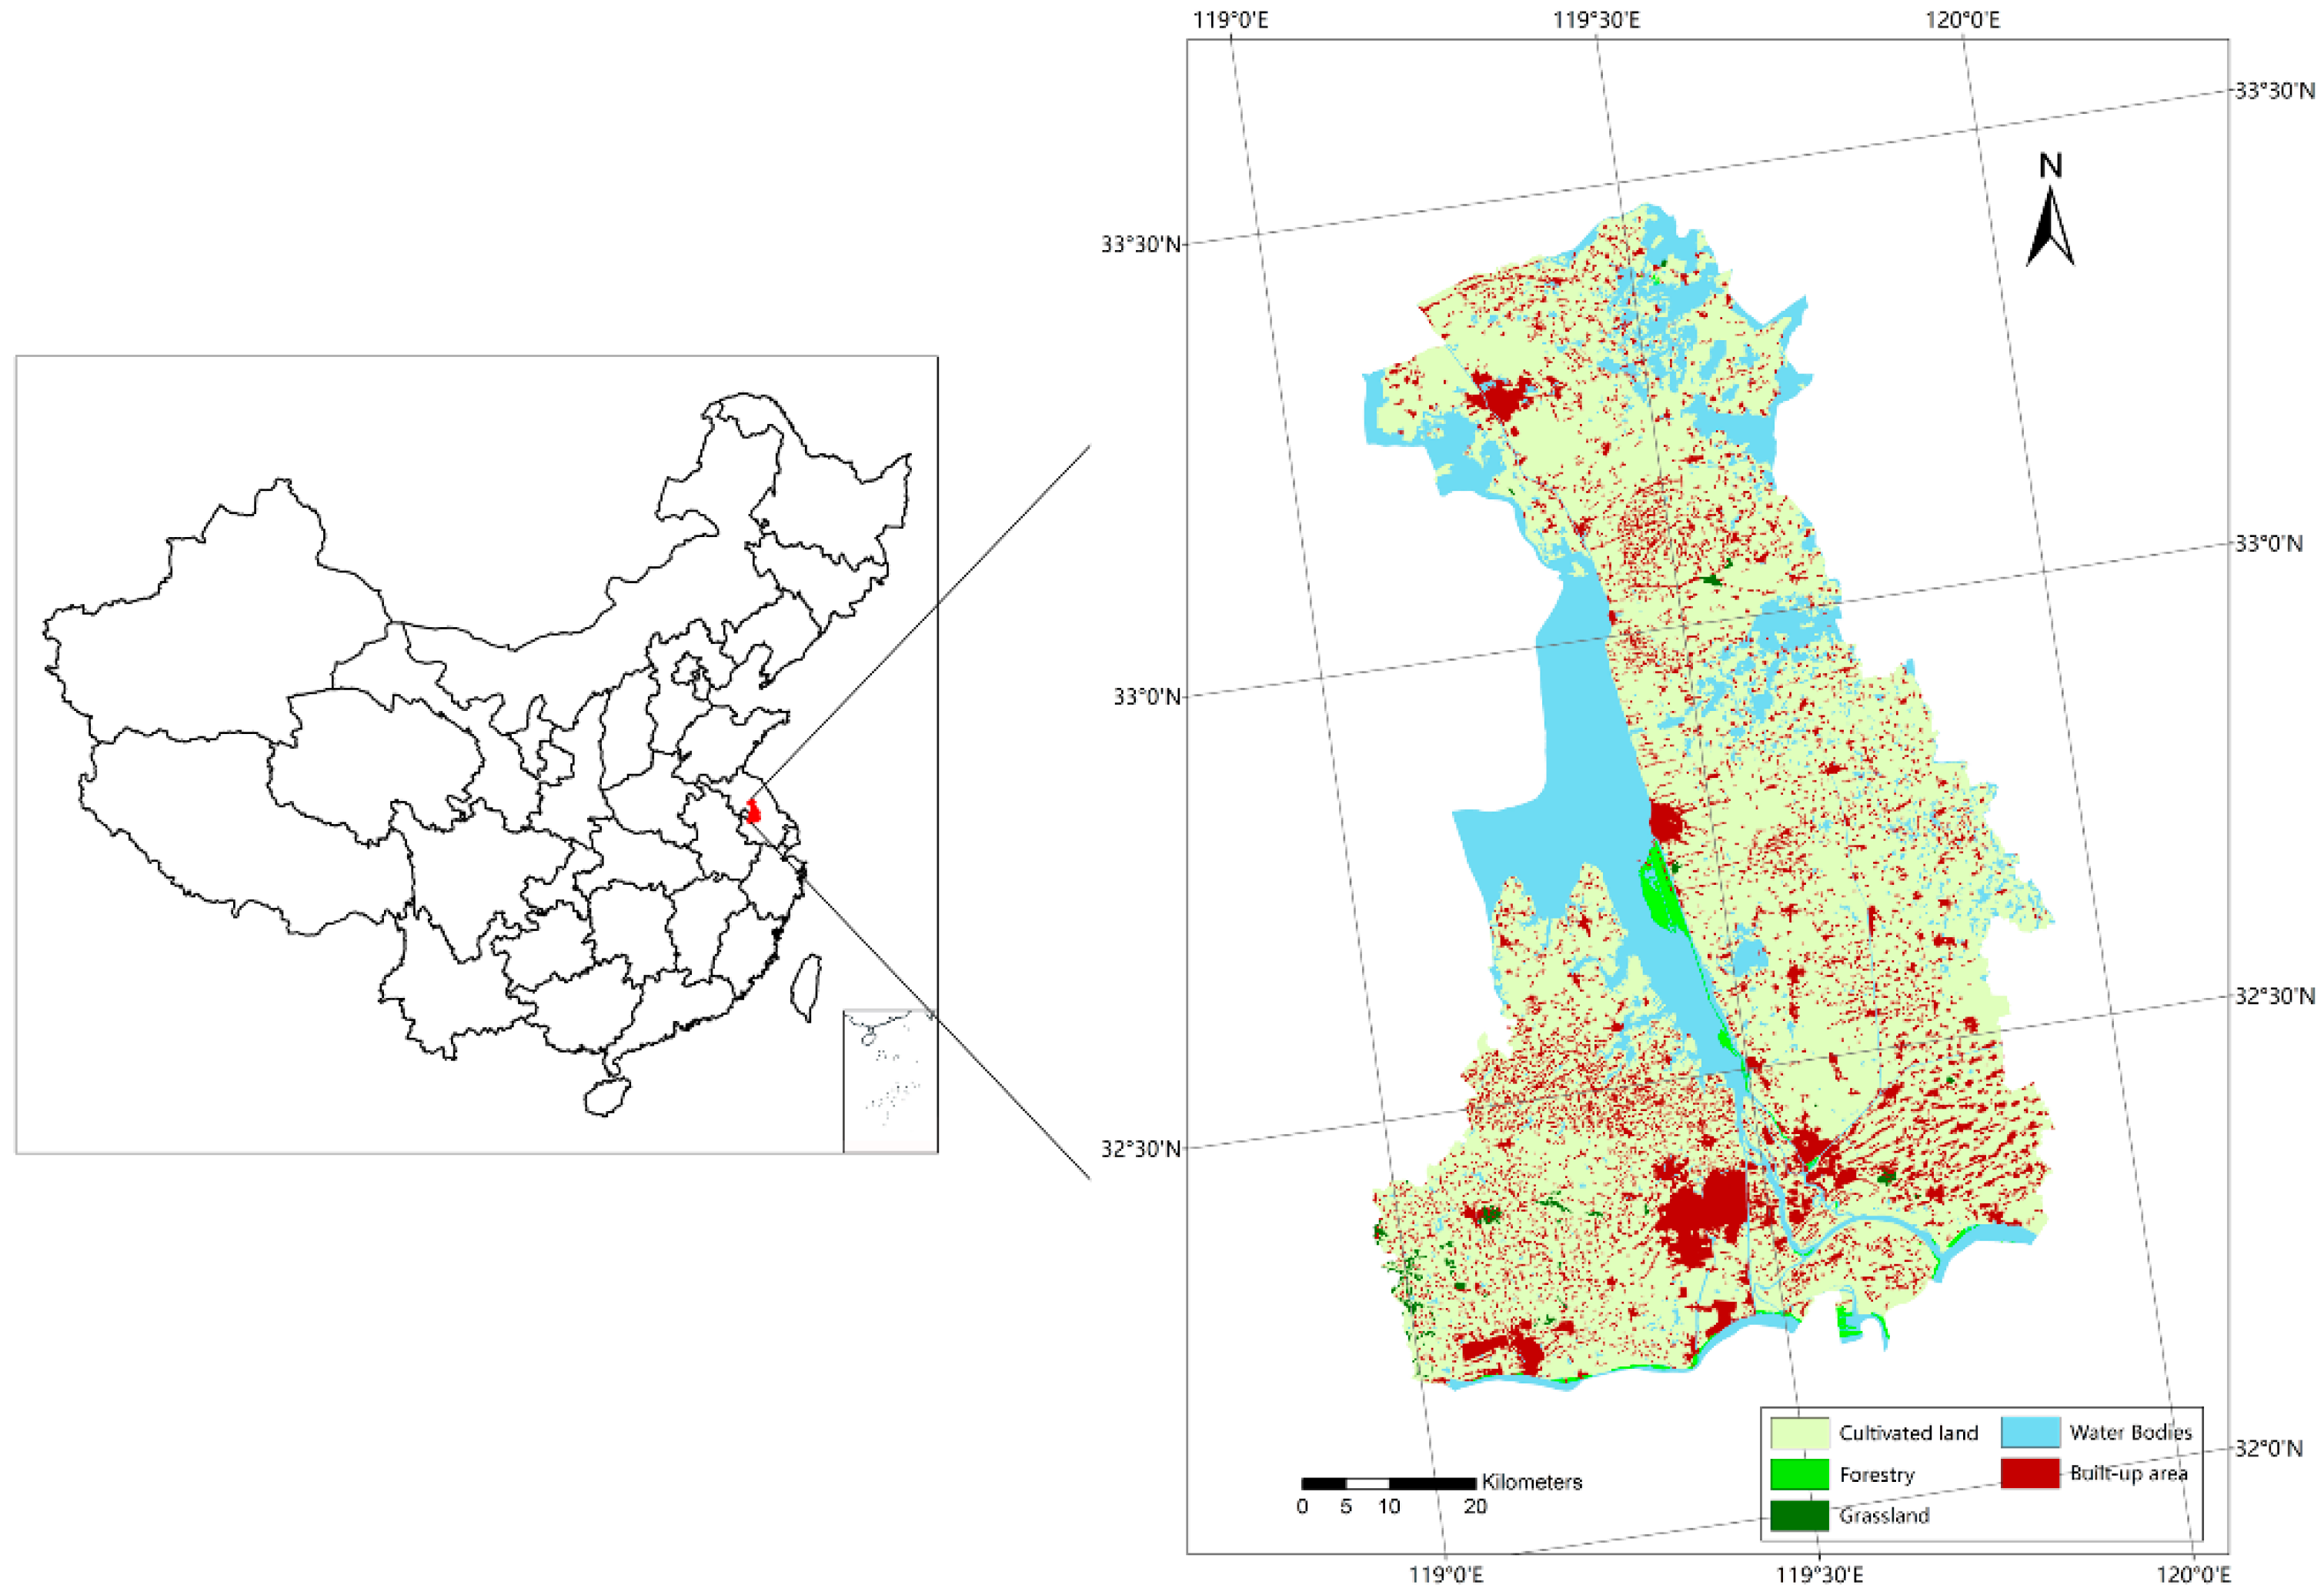
Yangzhou is a prefecture-level city of the Jiangsu province, which is one of the most developed regions in China. It is located between 119°01′–119°54′ E and 32°15′–33°25′ N, covering the Hanjiang district, Guangling district, Jiangdu district, Yizheng city, Gaoyou city, and Baoying county (Figure 1). Yangzhou covers an area of over 6634 km2. The terrain of Yangzhou is high in the west and lower in the east, most of which is less than 2 m above sea level.
Since the reform and expansion in China, Yangzhou has been developing fast in a comprehensive way. Due to the mild climate with plenty of rainfall, Yangzhou is a fertile region which is famous for rice cultivation and fisheries. It is one of important internal commodity foodstuff bases which plays an important role in the national agriculture industry. At the same time, with its privileged geographical location and good economic foundation, Yangzhou is also one of the more developed cities in China with dynamic economic growth. In addition, unlike other economically developed cities, Yangzhou has done a great job in the protection of the environment; the city won the UN Habitat Scroll of Honor in 2006. Demographically, the percentage of the urban population in the study area increased rapidly from 42.7% in 2000, to 51.3% in 2008, and then to 61.2% in 2014, according to the official statistical data of National Bureau of Statistics. Meanwhile, great changes have taken place regarding land use in Yangzhou. Based on the land use data extracted from remote sensing images, the total area of cultivated land was 4625.27 km2 in 1995, which decreased by 417.24 km2 to 4208.43 km2 in 2014. However, the built-up area had greatly increased from 731.68 km2 to 1146.73 km2 during this same period. The area of forestry declined slightly from 25.88 km2 to 25.19 km2 and the area of grassland decreased from 48.34 km2 to 41.10 km2, while the area of water bodies increased from 1196.67 km2 to 1207.05 km2 during the period from 1995 to 2014. Regarding rapid development and land use change, Yangzhou is a representative study area to explore the impacts of land use change on the urban metabolism of human life.

2.2. Data Sources

The land use data used in this paper were provided by the Data Center for Resources and Environmental Sciences, Chinese Academy of Sciences (RESDC) [12]. Six land use maps from 1995, 2000, 2005, 2008, 2011, and 2014 were utilized to analyze the urban expansion and cultivated land loss in Yangzhou. The land use data sources from 1995, 2000, 2005, and 2008 were used for four-period remote sensing data (Landsat-TM digital image). The maps are land cover vector data generated by field investigation and human-computer-interaction interpretation. The dataset was based on the land use maps at a scale of 1:100,000, using the classification system of 6 classes of first level (i.e., cultivated land, water bodies, built-up area, forestry, grassland and unused land) and 25 classes of second level according to land use status, which relied on the China land use/land cover remote sensing classification system by Liu et al. [13]. The land use data sources of 2011 and 2014 were the changing data of the land utilization. The maps of 2011 and 2014 were transformed to the China land use/land cover remote sensing classification system which was the same as the other maps.
The data used in the emergy calculations were from the Yangzhou Statistical Year Book [14,15,16,17,18,19]. We can find the statistical data of the regional economy and social development in the Yangzhou Statistical Year Book, which comprehensively and systematically reflected the changes of the economy, society, science, and technology in Yangzhou.

3. Methodology

3.1. Conceptual Model of Urban Metabolism Based On Emergy

Urban metabolism is a metabolic process of urban systems, including the material input, transformation, storage and waste discharge [20]. Cities are modelled as organisms with metabolism. The urban metabolism approach is an evaluation of the state of the urban ecological system. It is an effective means to quantify the inputs of energy, water, food, and other materials, as well as the waste output [21]. It has been widely adopted as a framework because it provides an effective way to gain information on energy efficiency, the recycling of materials, waste management, and the infrastructure characteristics of an urban system [22]. However, due to the incommensurability of various materials and resources, the methods that should be used in urban metabolism to quantitatively calculate the inputs and outputs is still a major issue.
The emergence of the concept of emergy by H.T. Odum in 1986 provided us with a new way to address this issue. According to Odum’s idea of energy hierarchy, all energy transformations of the geo-biosphere can be arranged in an ordered series to form an energy hierarchy [23]. Emergy, which is the amount of energy demanded directly or indirectly by the production of any product or service, has a common unit of measure—solar emjoules (seJ) [24]. In order to solve the problem of different types of energy not being accounted for, Odum used transformity to transform different kinds of resources to solar emjoules for comparison. The formula [25] is given as:
Em = τEx
where Em refers to the emergy of one material or energy, τ refers to the emergy transformity of material or energy, and Ex refers to the available joules of one material or energy. The transformity of different materials and energies are different; higher transformity means more solar energy consumed to produce one product or service. Odum et al. calculated the transformity of minerals and energy, discussed the calculation method of transformity, and then drew a conclusion that due to the changes of energy absorption with earth movement, the baseline value of transformity was also changing [26,27,28,29,30].
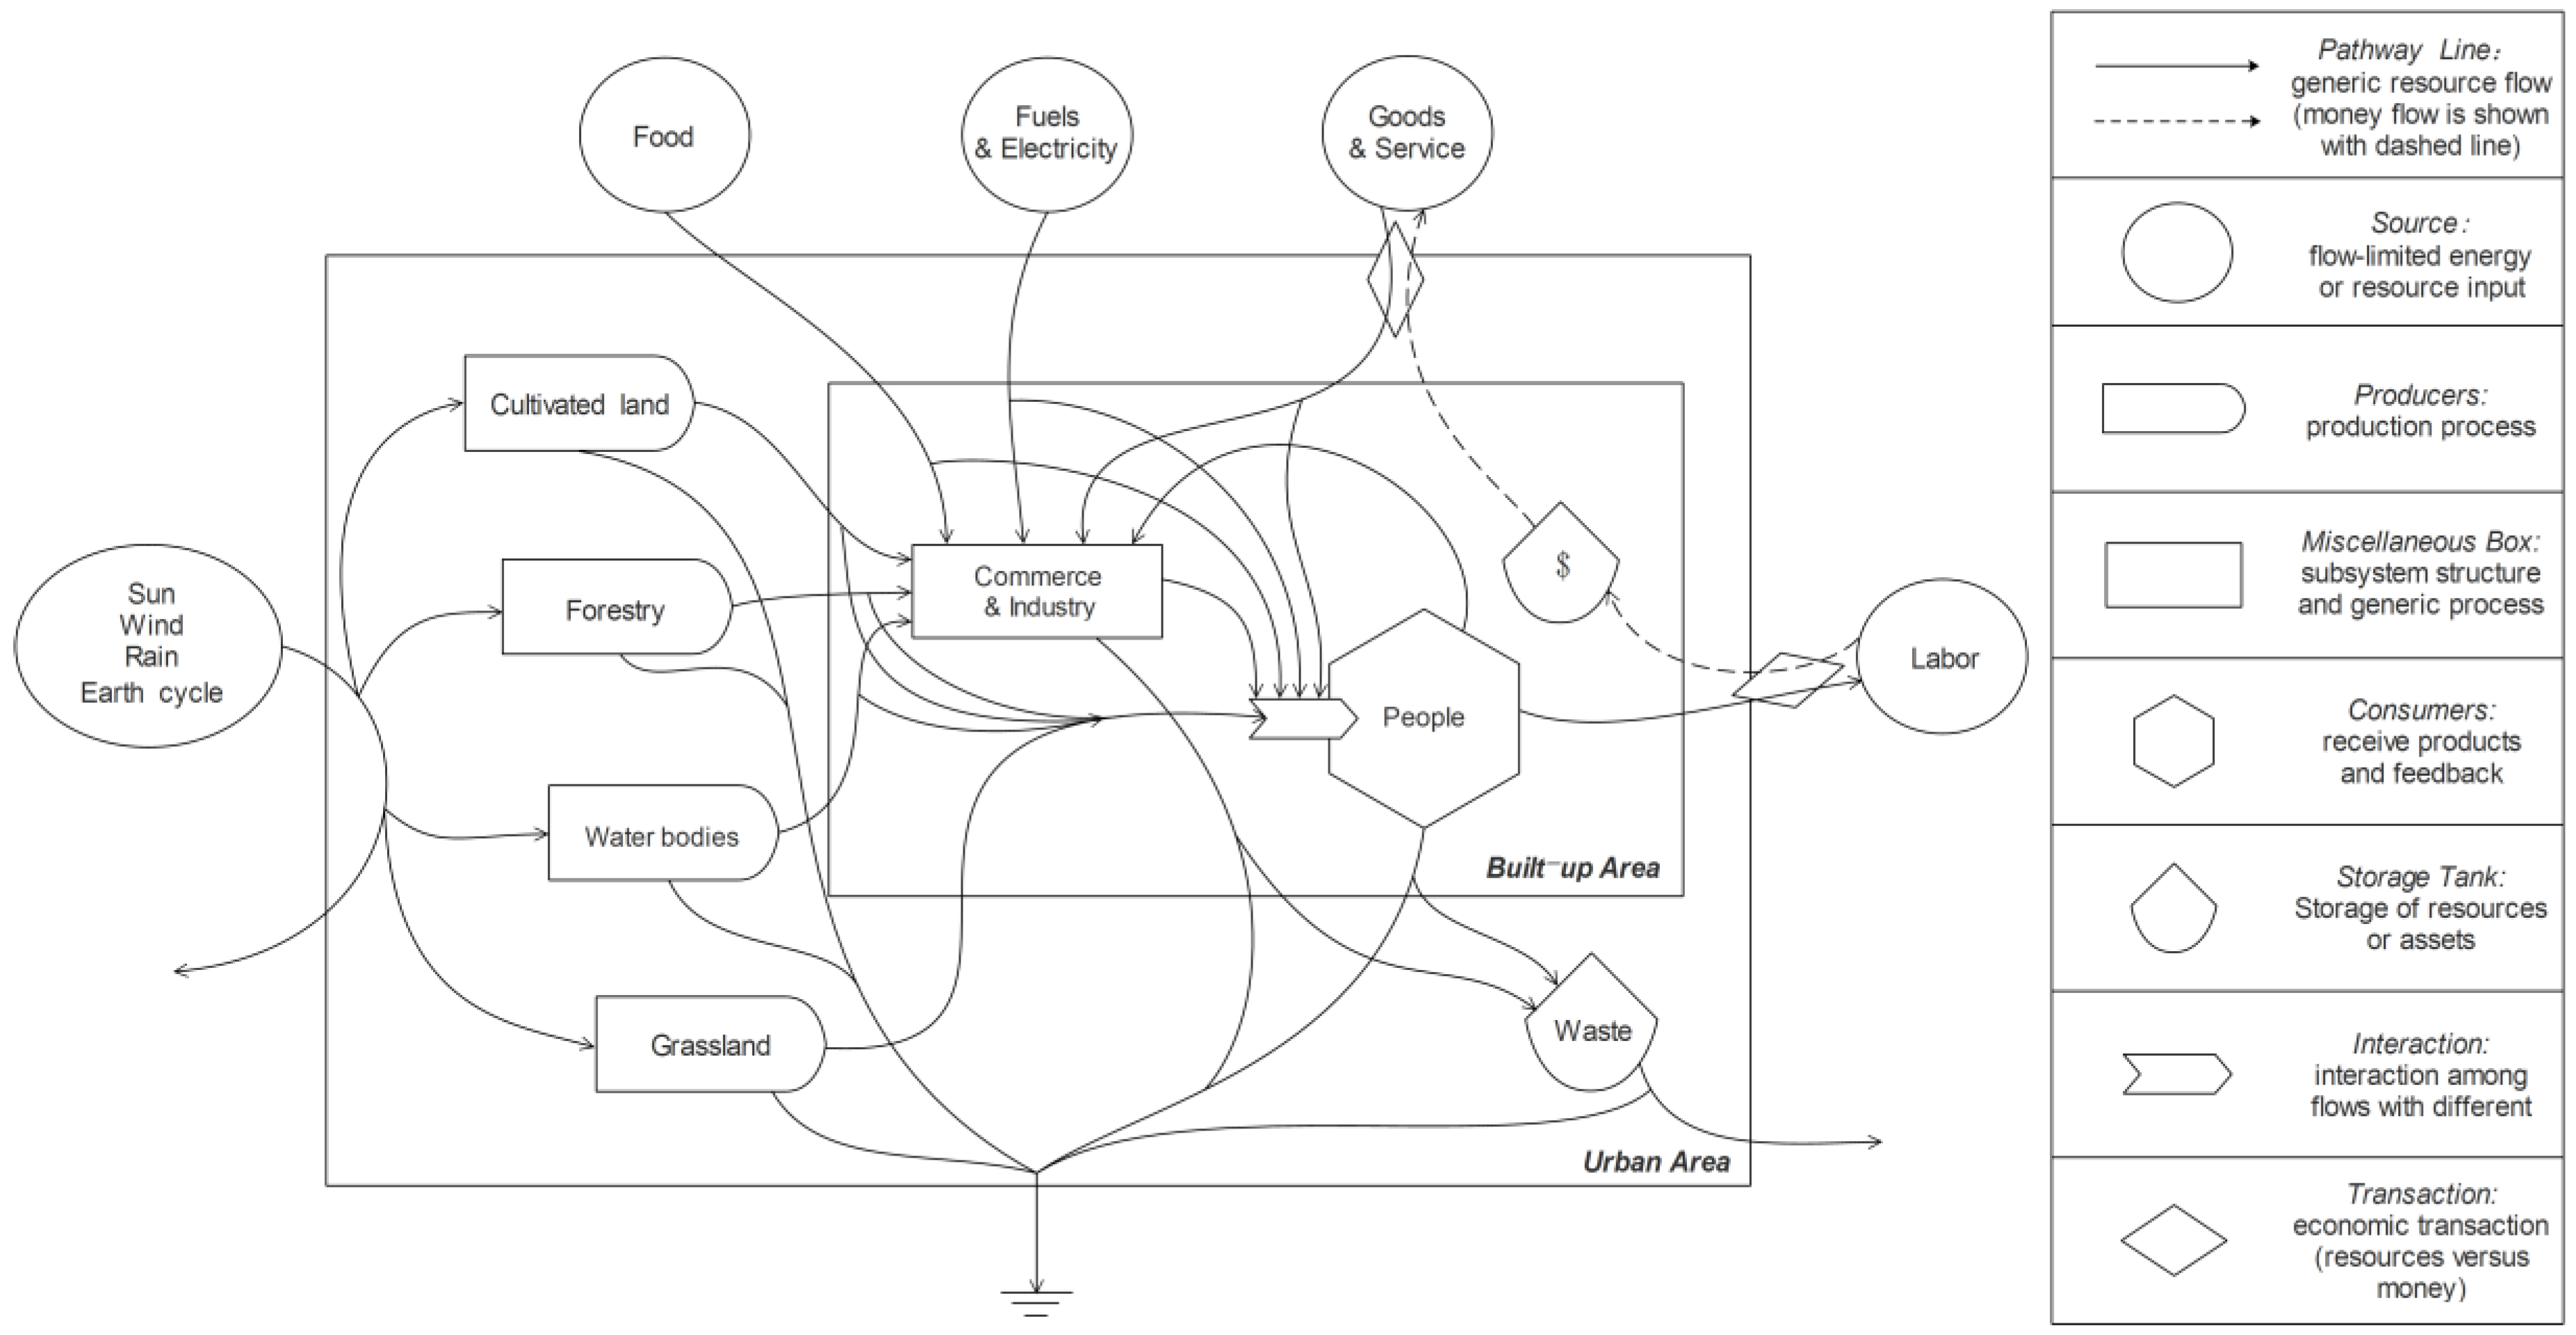
Cities are areas of intensive human activity. By regarding residents’ lives in urban areas as a socio-economic-ecological subsystem, in this paper we have analyzed the inputs and outputs of the subsystem, and established an urban socio-economic system integrated with land use, as shown in Figure 2.
Except for renewable resources, there are many other inputs that are essential for human life, such as food, goods and services, fuels and electricity, and so on, which are called sources of the system. The materials and energies from the sources flow to people, which are called consumers. People live in built-up areas and consume plenty of local resources and material inputs. The cultivated land in an urban area is a productive system which receives energy from renewable resources and provides agricultural products through photosynthesis and other chemical reactions, from which these products are then exported to people. The ecological land includes grassland, forests, and bodies of water, and it provides green space and improves the ecological environment for human life. Except the part that directly flow to people, the rest of the materials and energies from cultivated land, forestry, and bodies of water through the generic process of commerce and industry first, and then flow to the people. As to the outputs, people engaged in different jobs by exporting physical and mental labor. After the consumption process, people discharge waste from the inner environment to the outside. The storage tank of waste stores the materials and energies discharged by consumers and exports them to the outside of system according to the energy conservation principle. Moreover, there is another form of energy flow which is called money flow. It flows to people by the transaction with labor and then through another transaction with goods and services, which reflects the basic process of people’s work and consumption. According to the second law of thermodynamics, the dissipation of energy is inevitable during the conversion process. Therefore, the heat sink is connected with the producers, consumers, the generic process, and the storage tank.
The urban metabolic emergy of human life that was analyzed in this paper includes the emergy of renewable resources (R), local non-renewable resources (N), and purchased (imported) resources (F). The renewable resources (R) include solar radiation, wind, earth cycle, geopotential and chemical present in rain, which are formed naturally. Considering that the solar radiation, wind, earth cycle, and rain are derived from the same process, we only take the maximum emergy into account to avoid repetitive computation [31]. Local non-renewable resources (N) mainly include topsoil loss. The purchased (imported) resources (F) consist of food, goods, services, electricity, and fuels which are necessities for human life from the external environment.

3.2. Emergy-Based Evaluation System of Urban Metabolism

First, we selected three indices (metabolic structure, intensity, and efficiency) to evaluate the urban metabolic status [11]. These three indices can systematically describe the status and characteristics of the system of urban metabolism, and they can also help us analyze the overall change of the metabolic efficiency to evaluate the level and quality of people’s lives, which may provide beneficial guidance and reference for the research and practice of urban metabolism.
The metabolic structure and intensity were divided into sub-classes to facilitate a better analysis, as shown in Table 1.
The metabolic structure reflects the structural characteristics of urban metabolism, including the flux and the emergy export-oriented ratio. Flux (U) is the total amount of the system emergy, which consists of renewable resources (R), local non-renewable resources (N), and purchased (imported) resources (F), and the emergy export-oriented ratio indicates the metabolic system’s dependence on external conditions.
The metabolic intensity describes the quantity of resources that everyone can use and the change of purchasing power of the money in the system. The per capita emergy and emergy-to-money ratio reflect the metabolic intensity. Per capita emergy is the emergy ownership of each person, which includes the standard of living and the intensity of resource utilization. Higher value of per capita emergy reflects the high level per capita capacity to purchase emergy. The growth of the per capita emergy value reflects the growth of the material living level of residents in the urban area. Additionally, the emergy-to-money ratio is the comprehensive consideration of the ability of the emergy purchasing power of money. A higher value of the emergy-to-money ratio means that the unit of money has a stronger capability to purchase emergy.
The emergy sustainability index represents the metabolic efficiency. The emergy sustainability index is the system output efficiency under per emergy unit environmental load pressure, which reflects the coordination degree of the social-economic development and ecological environment in urban metabolism [32].

3.3. Analysis of Land Use Change

After the land use structure and the changes of the area of the different types of land during the study period were evaluated on the Arc INFO platform (ERSI, Redlands, CA, USA), numerical analysis was applied to examine their relationship. We evaluated the impact of land-use change on urban metabolism from the aspect of the land use dynamic degree.
The land use dynamic degree is the rate of change of a certain type of land area during a period of time [33], which is used to describe the dynamic change of land use. The formula is given as:
R d = X e n d X s t a r t X s t a r t × 1 T × 100 %
where Rd refers to the land use dynamic degree, Xend and Xstart represent the areas of a specific land use type at the beginning and end of the study, and T refers to the study period.

3.4. Sensitivity Analysis of Urban Metabolism and Land Use Change

In order to evaluate the impact of land use change on urban metabolism, we built a sensitivity evaluation model to calculate the sensitivity of the metabolic indices to land use change. The sensitivity analysis is an analytical method that studies the impacts of one changing factor on one or a set of key indicators from the perspective of quantitative analysis. Its purpose is to explain the variation of key indicators affected by the change of one factor. The sensitivity evaluation can help us to discuss the influence of land use change of different types for the quantitative change of the urban environmental ratio and the emergy sustainability. The formula is given as:
β = [ ( E e n d E s t a r t ) / E s t a r t ] / [ ( L e n d L s t a r t ) / L s t a r t ]
where β refers to the value of sensitivity, Eend and Estart represent the emergy-based indices at the beginning and end of the study, and Lend and Lstart represent the areas of a specific land use type at the beginning and end of the study. The results of the sensitivity evaluation indicate the response of the emergy-based indices to land use change. If β < 0, it shows that there is an inverse change between the emergy-based indices and land use, which means that the emergy-based indices are not sensitive to land use change. If β > 0, it shows that emergy-based indices and land use are directly related, which means that the emergy-based indices are influenced by the land use change. A higher value of β indicates a higher sensitivity of the emergy-based indices to land use change, and it shows that small changes of land use can cause large fluctuations of the emergy-based indices.

3.5. Regression Analysis of Urban Metabolism and Land Use Change

To analyze the relationship between variables and forecast the variation tendency, regression analysis was adopted. According to the fitness of the regression curve, we chose the best model to explore the impacts of the land use change on the emergy-based indices and its future changing trend. On the other hand, because intensive and compact use are trends in energy utilization, metabolic intensity and efficiency are very important indices to evaluate the urban metabolism system. From the aspect of land use change, the built-up land is the essential factor that is closely related to residents’ lives. Based on the above, we tried regression fitting of the built-up area with per capita emergy, the emergy-to-money ratio, and the emergy sustainability index by using different mathematic models in the software SPSS 20.0 (SPSS, Chicago, IL, USA), to find the change in the variation of the emergy-based indices of peoples’ standard of living and sustainability.

4. Results and Discussion

4.1. Emergy-Based Evaluation of Urban Metabolism

We used the data on materials, energy, and capital flows in Yangzhou from 1995 to 2014 to calculate the solar emergy of renewable resources, nonrenewable resources, and purchased (imported) resources.
The emergy of one material or energy can be calculated using Equation (1).
The original data of sunlight is calculated according to:
E x = α × X
where Ex refers to the available joules of one material or energy, α represent the mean annual sun radiation and X represent the total area of Yangzhou.
The original data of wind can be measured by:
E x = θ × X
where θ represent the kinetic energy of the wind.
The original data of rain (geopotential) is calculated by:
E x = X × H × μ × g × P
where H refers to the average elevation, μ refers to the annual rainfall, g represent the acceleration of gravity, and P is the water density.
The original data of rain (chemical) is calculated by:
E x = X × μ × G × P
where μ refers to the annual rainfall, G represent the Gibbs free energy of rain, and P is the water density.
The original data of the earth cycle can be measured by:
E x = X × H f
where Hf refers to the heat flux.
The original data of topsoil loss is measured by:
E x = X a × S e × O m × O e
where Xa refers to the area of cultivated land, Se represent the rate of the soil erosion, Om is the organic content of a unit mass of soil, and Oe represent the organic matter energy.
The original data of other materials or energies are calculated according to:
E x = Q × C e
where Q refers to the consumption of material or energy, and Ce represent the conversion coefficient of energy.
The emergy of economic inputs can then be measured in monetary terms:
E m = ( E m e r g y / $ ) × M
where M represents a particular economic input (usually in USD), Emergy is the total emergy used by the region being studied, and $ is the GDP of the region.
In this paper, we adopted 15.83 × 1024 seJ as the planetary baseline value for annual emergy input [28]. The data of solar transformity are from Liu [24], Huang [3], and Zhang [4]. The solar emergy values of each item are shown in Table 2.
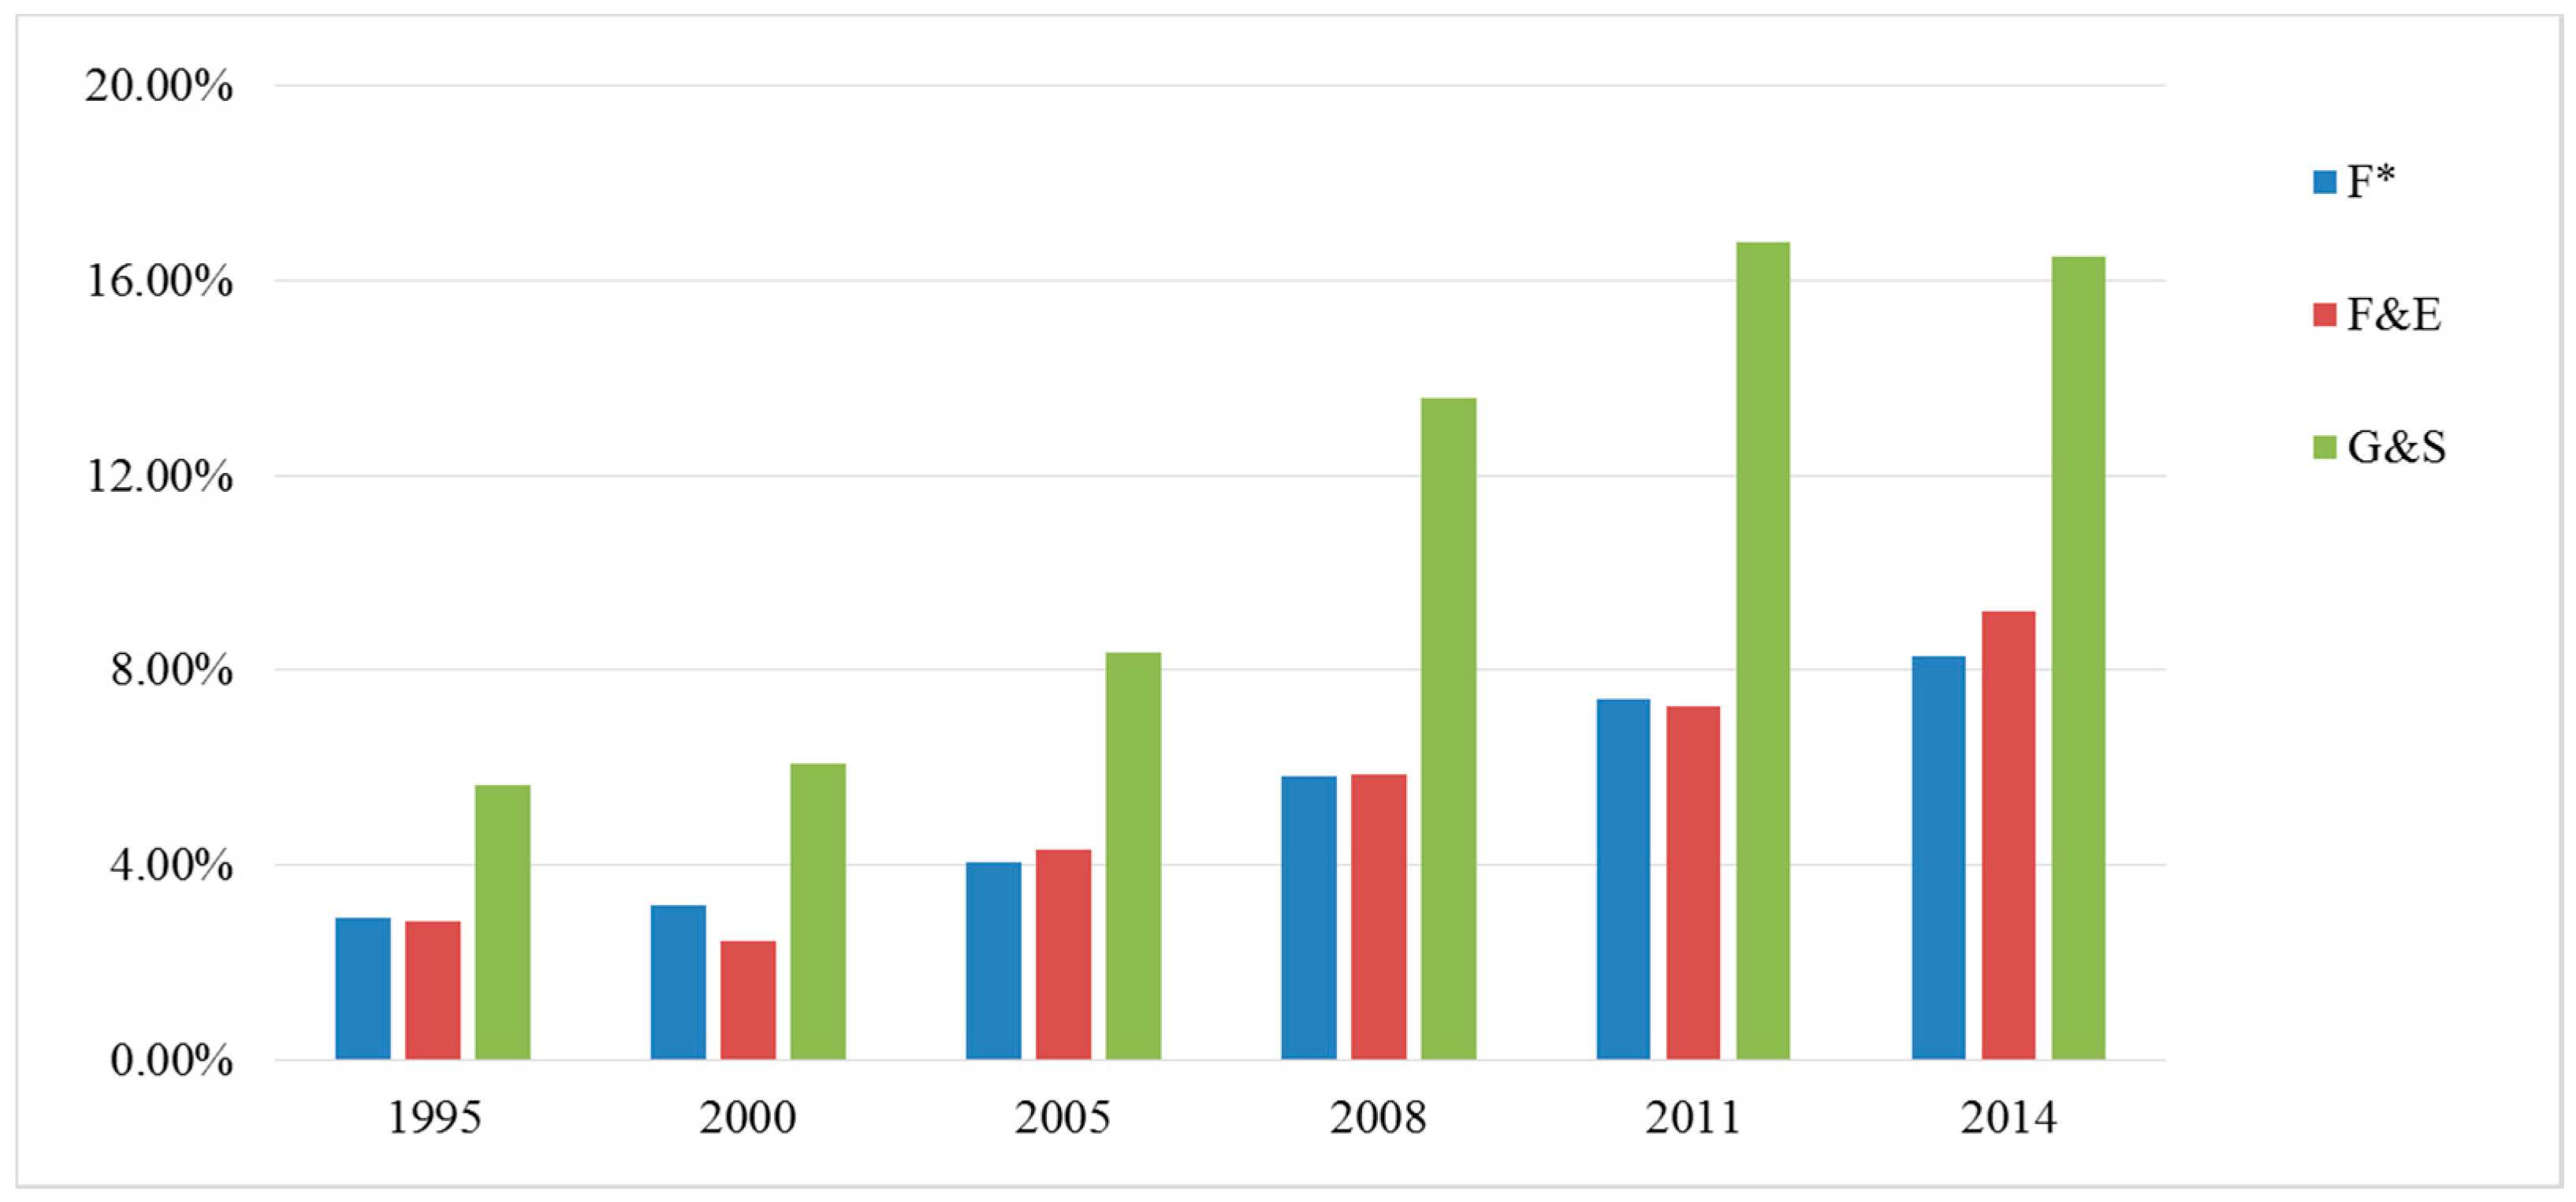
In the study area, F turned into a dominant flow sustaining the daily activities in Yangzhou, representing 11.43% of U in 1995 to 33.98% of U in 2014. Figure 3 shows the main aggregated emergy flows as a percentage of U, of which food is F*, fuels and electricity are F&E, and goods and services are G&S.
The three main aggregated emergy flows (food, fuels and electricity, goods and services) all increased to some degree. The aggregated emergy flow of food increased from 2.91% in 1995 to 8.28% in 2014. The aggregated emergy flow of fuels & electricity increased significantly from 2.86% in 1995 to 9.20% in 2014. The aggregated emergy flow of goods & services also had a significant increase from 5.65% in 1995 to 16.51% in 2014. The changing percentages showed that all the main aggregated emergy flows had obvious changes from 1995 to 2014. People’s standard of living in Yangzhou increasingly relied on the large supply of food, resource utilization, and goods and services. This revealed that human beings were pursuing a richer material life and higher spiritual enjoyment with the economic development and evolution of the society.
Table 3 presents the indices for evaluating the urban metabolic status of Yangzhou. From 1995 to 2014, the U of Yangzhou increased about 156.56%, which showed that the emergy flux of people’s lives in Yangzhou had a remarkable development. In 2014, the imported resource emergy accounted for 33.98% of U, which increased by 2.97-fold during the study period, and showed that the living standards in Yangzhou had greatly improved from 1995 to 2014. It also showed that the development of people’s lives in Yangzhou was highly dependent on imported resources.
Per capita emergy increased 142.45% from 3.41 × 10¹⁶ in 1995 to 4.86 × 10¹⁶ in 2014, which showed that the living standard of urban residents had improved; on the other hand, it also revealed that the resource utilization was increasingly intense. The improvement of social and economic conditions was still based on a large amount of resource consumption. The emergy-to-money ratio was on the decline from 5.30 × 10¹³ in 1995 to 1.62 × 10¹³ in 2014. It showed that the power of money to purchase emergy was gradually decreasing. The emergy sustainability index had sharply declined from 55.40 in 1995, to 27.11 in 2005, and to 11.45 in 2008, which decreased about 79.33% during this period. However, it began to decrease slowly between 2011 and 2014, which was 7.07 in 2011 and 6.05 in 2014. The variation tendency of the emergy sustainability index revealed that the degree of coordination between the social-economic development and the ecological environment in the urban metabolism system was still at a lower level.

4.2. Analysis of Land Use Change

By using the graphic editor function and the spatial analysis faculty of the Arc INFO platform, the status of land use in Yangzhou was analyzed, including land area and land use structure.
The total urban land area of Yangzhou is 6628.49 km2. The structure of land use is presented in Figure 4. The area of cultivated land decreased each year from 1995 and the proportion of bodies of water increased to 19.02% in 2008, and then decreased to 18.21% in 2014. The variation of the area of grassland and forests was relatively minor. The proportion of unused land was only 0.004% in 1995, and its effect on land use was negligible. The years between 2005 and 2011 was a significant period in which the built-up area expanded by encroaching on the cultivated land, in which the proportion increased from 11.74% in 2005 to 16.77% in 2011. With the development of urbanization, a large number of people tend to flock to the city. Hence, more built-up land will be needed and cultivated land will continue to be reduced.
We then used Formula (2) to calculate the Rd values of each type of land, shown in Table 4.
As shown in Table 4, the rate of cultivated land decline accelerated from 1995 to 2011, which was about −0.235% during 1995–2005, −0.58% during 2005–2008, and −1.55% during 2008–2011. However, in the period of 2011–2014, the rate had slowed down considerably, and was only −0.18%. Meanwhile, the built-up area was enlarging, and the rate of expansion increased, which was 0.28% during 1995–2000, 0.98% during 2000–2005, 3.35% during 2005–2008, and 9.92% during 2008–2011. It showed that the rate of built-up area expansion was faster than that of the cultivated land reduction. However, the rate of built-up area expansion decreased to 1.05% during 2011–2014. The area of bodies of water had increased during 1995–2008, and then decreased during 2008–2014, and the rate of increase was gradually reduced during 1995–2008. Because of the small area occupied by woodland and grassland, the variation of forests and grassland was not obvious during 1995–2008, but they both decreased during 2008–2014.
From Table 4, we can see that the variation of the built-up area expansion. From 1995–2005 there was a stage of steady growth, which kept growing at under 1% per year. Then the built-up area expansion entered a fast development stage during the next 6 years between 2005 and 2011, which grew at an average rate of 6% per year. In the 3 years after 2011, it reverted to a steady growth stage with the growth rate of 1% per year. This showed that urbanization, which caused the expansion of the built-up area, was the main driving force of land use change in Yangzhou city. Because of the policy of expanding domestic demand in China after 2008, the urbanization of Yangzhou city entered a period of rapid development. Due to the expansion of the built-up area and the decrease of the cultivated land that were caused by urbanization, people’s lives and human well-being in Yangzhou city experienced a great change during this period.
Furthermore, the land use change is also related to the population dynamics, excluding urbanization and economic development. According to the last demographic survey, the urban population of Yangzhou grew slowly in the 10 years from 2005 to 2014. The urban population of Yangzhou was 2,221,800 in 2005, and increased to 2,318,400 in 2014. The rate of population increase was 4.35% and the annual growth rate was 0.44%. Yangzhou is one of the most developed cities in China, and the per capita GDP had surpassed 12,000 US dollars in 2014. Due to the one-child policy and the developed economy, the rate of ageing populations was 17.8% in 2008, which was above average in China. As a consequence, the impact of population dynamics on emergy-based indices was minimal in Yangzhou and this paper focused on the impact of land use change.

4.3. Sensitivity Analysis of Urban Metabolism and Land Use Change

According to Section 4.2, the change of the cultivated land and the built-up area were the most critical changes during the period from 1995–2014. We selected the change of the cultivated land and the built-up area as the typical changes to evaluate the impact of land use change on urban metabolism. As shown in Table 5 and Table 6, we calculated β between the change of the cultivated land/built-up area and the land emergy-based indices.
The level of sensitivity was divided into 4 levels:
β ≤ 0 indicated non-sensitivity, the changes of emergy-based indices and land use had no synchronization characteristics;
② 0 < β ≤ 15 indicated low-sensitivity;
③ 15 < β ≤ 30 indicated mid-sensitivity;
β > 30 indicated high-sensitivity.
The β of U to cultivated land was negative during 1995–2011, which showed that it was non-sensitive in this period. During 2011–2014, the β of U to cultivated land increased to 1.66, which showed that it was low-sensitivity. The sensitivity of the emergy export-oriented ratio to the cultivated land were non-sensitive from 1995 to 2014. The change of β of the per capita emergy to the cultivated land had no obvious regularity, but generally the per capita emergy was non-sensitive to the cultivated land. The sensitivity of the emergy-to-money ratio to the cultivated land changed from non-sensitivity, to high-sensitivity, and then to mid-sensitivity. The sensitivity of the emergy sustainability index to the cultivated land first increased from low-sensitivity to high-sensitivity, and then decreased to low-sensitivity. During 2005–2008, the β of emergy sustainability index was 49.54, which reached the maximum value.
The β of U to the built-up area was 22.82 during 1995–2000, and it decreased to less than 15 during 2000–2011, and then decreased further to −1.38 during 2011–2014. The sensitivity of the emergy export-oriented ratio to the built-up area changed from low-sensitivity to high-sensitivity and then to low-sensitivity. During 2005–2008, the β of the emergy export-oriented ratio to the built-up area was 35.96, which reached its maximum value. From a general view, the β of the per capita emergy to the built-up area was positive during most of the study period. The sensitivity of the emergy-to-money ratio to the built-up area changed from low-sensitivity during 1995–2000 to non-sensitivity during 2000–2014. The emergy sustainability index was non-sensitive to the built-up area during the whole study period.
The results of the sensitivity analysis showed that the built-up area had a more significant effect on the total emergy change of urban metabolism compared to the cultivated land. Nevertheless, the substantial correlation between the built-up area and U had been diminishing with the urban expansion. At the same time, the β of the emergy export-oriented ratio and the per capita emergy indicated similar trends while the cultivated land decreased and the built-up area increased. This showed that the emergy flux, emergy export-oriented ratio, and the per capita emergy had a positive correlation with the built-up area. However, with the rapid development of urbanization, this influence weakened. The results also revealed that the increase of the built-up land had negative impacts on the emergy-to-money ratio and the emergy sustainability index. With the urban area expansion, people’s living standards improved significantly and their material lives became richer, while the people's lives were also increasingly dependent on external resources and material inputs. On the other hand, the sensitivity analysis showed that the ecological-economic efficiency and long term sustainability of the system was reduced, with the area of cultivated land decreasing.
4.4. Regression Analysis of Urban Metabolism and Land Use Change

Considering that built-up area is the most important carrier for people’s lives, we studied the quantitative relation between the built-up area and the emergy-based indices by establishing a regression analysis model based on mathematical statistics with different models in the software SPSS 20.0. From the aspects of emergy intensity and efficiency, we quantitatively explored the impacts of the built-up area expansion on the per capita emergy, emergy-to-money ratio, and the emergy sustainability index. According to the results of the curve estimation, we found that the best model was the quadratic regression equation for all the research parameters; the curves are shown in Figure 5.
From Figure 5a, we found that when the built-up area increased, the per capita emergy initially increased and then it started to decrease after the built-up area was about 1050 km2. Figure 5b,c showed that the emergy-to-money ratio and the emergy sustainability index appeared to indicate negative growth when the built-up area increased. However, the reduced slope of the regression curve illustrated that the emergy-to-money ratio and the emergy sustainability index decreased more rapidly at first, and then slowly with the increased built-up area. When the development of urbanization reached a certain level, the downward trend of the emergy-to-money ratio was mitigated. Although the emergy-to-money ratio and the emergy sustainability index were non-sensitive to the built-up area, the built-up area expansion slowed the decline of the emergy-to-money ratio, and the emergy sustainability index slowed down while the built-up area was expanding, which was similar to the diminishing marginal utility law.

5. Conclusions

In this paper, the impacts of land use change on residents’ lives were examined by using emergy-based urban metabolism and statistical analysis. Yangzhou city was selected as the case study area due to its obvious land use change, typical improvement of its residents’ lives, and its rapid economic growth. We calculated the emergy-based indices to analyze the interactions between land use and urban metabolism, based on sensitivity analysis and regression analysis. The conclusions of this research are summarized as follows.
The results of the emergy-based indices showed that the emergy-to-money ratio and the emergy sustainability index gradually decreased with the increase of resource consumption. It reflected that with the improvement of living standards, the energy demands were getting larger and larger. Due to the scarcity of energy, the purchasing power of emergy gradually shrank although the per capita income of residents increased. We suggest that it is necessary to emphasize the intensive utilization of natural resources, and exploit clean and renewable energy for sustainable urban development.
In land use change of Yangzhou city, the cultivated land reduction and the built-up land increase had the most significant effects on urban metabolism of residents’ lives. With the urban area expansion, the change of U and per capita emergy showed that the standard of living of residents had improved. Urbanization promoted the prosperity of the industry and commerce, thus enriching people's material lives. However, the cultivated land reduction threatened food security. Therefore, the expansion of the city scale should not be uncontrolled. We should avoid the extensive utilization of land and guarantee food security.
The combination of emergy-based urban metabolism and land use analysis revealed the change of the residents’ living patterns with urban expansion. According to the analysis results of urban metabolism and land use change, the expansion process of Yangzhou city was divided into two stages. In the early stage of urbanization, the increase of per capita emergy and the reduction of the emergy-to-money ratio and the emergy sustainability index showed that the residents’ living patterns were too extensive and consumed a great deal of resources. At a certain stage of development, the per capita emergy started to decrease and the reduction of the emergy-to-money ratio and the emergy sustainability index also gradually slowed down. This indicated that the residents’ living patterns appeared to transform in the direction of sustainable development and an ecological “low-carbon lifestyle”. Additionally, the concept of urban land use was changing towards the intensive utilization of land resources. Moreover, to improve the quality of people’s lives and realize the sustainable development of urban social economy and land use, we suggest that it is necessary to control the scale of built-up areas and strengthen the protection of cultivated land. The policy makers and land use planners should further implement the policy of economical and intensive land use, especially in construction land planning and approval. We also need to enhance the quality of cultivated land and cut down on environmental pollution.
Renewable resources, nonrenewable resources, and purchased (imported) resources were under consideration in this research. However, due to the limited annual statistical data, the waste emission was not taken into account. To achieve efficient use of land resources and sustainable urban development, we need further research that involves macro analysis of people's lives and land use change on the temporal and spatial scales. We need to explore more methods to analyze the effect of land use change on people’s lives. This can provide new ideas for land use planning and urban development. Finally, this study provides a basis for solving urban problems which threaten people’s quality of life.

Acknowledgments

This work was supported by the National Natural Science Foundation of China. (Grant No. 71225005).

Author Contributions

Zhanqi Wang conceived and designed the research. Ji Chai wrote the paper. Bingqing Li analyzed the data.

Conflicts of Interest

The authors declare no conflict of interest.

References

  1. United Nations. World Urbanization Prospects, the 2014 Revision; United Nations: New York, NY, USA, 2014; pp. 5–10. [Google Scholar]
  2. Song, W.; Deng, X.Z. Effects of urbanization-induced cultivated land loss on ecosystem services in the North China Plain. Energies 2015, 8, 5678–5693. [Google Scholar] [CrossRef]
  3. Huang, Q.; Zheng, X.; Hu, Y. Analysis of land-use emergy indicators based on urban metabolism: A case study for Beijing. Sustainability 2015, 76, 7473–7491. [Google Scholar] [CrossRef]
  4. Zhang, Y.; Yang, Z.F.; Liu, G.Y.; Yu, X.Y. Emergy analysis of the urban metabolism of Beijing. Ecol. Model. 2011, 222, 2377–2384. [Google Scholar] [CrossRef]
  5. Odum, H.T. Emergy in ecosystems. In Poluin Ned. Ecosystem Theory and Application; John Wiley & Sons: New York, NY, USA, 1986; pp. 337–369. [Google Scholar]
  6. Lu, Y.; Chen, B. A review on urban metabolism: Connotation and methodology. Acta Ecol. Sin. 2015, 35, 2438–2451. [Google Scholar]
  7. Song, T.; Cai, J.M.; Xu, H.; Deng, Y.; Niu, F.Q.; Yang, Z.S.; Du, S.S. Urban metabolism based on emergy and slack based model: A case study of Beijing, China. Chin. Geogr. Sci. 2015, 25, 113–123. [Google Scholar] [CrossRef]
  8. Mellino, S.; Ulgiati, S. Mapping the evolution of impervious surfaces to investigate landscape metabolism: An emergy–GIS monitoring application. Ecol. Inform. 2015, 26, 50–59. [Google Scholar] [CrossRef]
  9. Zhang, Z.L.; Chen, X.P.; Heck, P. Emergy-based regional socio-economic metabolism analysis: An application of data envelopment analysis and decomposition analysis. Sustainability 2014, 6, 8618–8638. [Google Scholar] [CrossRef]
  10. Lee, C.; Huang, S.; Chan, S. Synthesis and spatial dynamics of socio–economic metabolism and land use change of Taipei Metropolitan Region. Ecol. Model. 2009, 220, 2940–2959. [Google Scholar] [CrossRef]
  11. Vega-Azamar, R.E.; Romero-Lopez, R.; Glaus, M.; Oropeza-Garcia, N.A.; Hausler, R. Sustainability Assessment of the Residential Land Use in Seven Boroughs of the Island of Montreal, Canada. Sustainability 2015, 7, 2454–2472. [Google Scholar] [CrossRef]
  12. Wang, Z.Q.; Li, B.Q.; Yang, J. Impacts of Land Use Change on the Regional Climate: A Structural Equation Modeling Study in Southern China. Adv. Meteorol. 2015, 2015, 563673. [Google Scholar] [CrossRef]
  13. Liu, J.Y.; Liu, M.L.; Zhuang, D.F.; Zhang, Z.X.; Deng, X.Z. Study on spatial pattern of land-use change in China during 1995–2000. Sci. China Ser. D 2003, 46, 373–382. [Google Scholar]
  14. Statistical Bureau of Yangzhou. Yangzhou Statistical Year Book, 1996; China Statistics Press: Beijing, China, 1996; pp. 38–46. (In Chinese)
  15. Statistical Bureau of Yangzhou. Yangzhou Statistical Year Book, 2001; China Statistics Press: Beijing, China, 2001; pp. 50–58. (In Chinese)
  16. Statistical Bureau of Yangzhou. Yangzhou Statistical Year Book, 2006; China Statistics Press: Beijing, China, 2006; pp. 52–60. (In Chinese)
  17. Statistical Bureau of Yangzhou. Yangzhou Statistical Year Book, 2009; China Statistics Press: Beijing, China, 2009. (In Chinese)
  18. Statistical Bureau of Yangzhou. Yangzhou Statistical Year Book, 2012; China Statistics Press: Beijing, China, 2012; pp. 59–70. (In Chinese)
  19. Statistical Bureau of Yangzhou. Yangzhou Statistical Year Book, 2015; China Statistics Press: Beijing, China, 2015; pp. 89–98. (In Chinese)
  20. Zhang, Y.; Yang, Z.F. Eco-efficiency of urban material metabolism: A case study of Shenzhen. Acta Ecol. Sin. 2007, 27, 3124–3131. [Google Scholar] [CrossRef]
  21. Kalmykova, Y.; Rosado, L.; Patricio, J. Urban economies resource productivity and decoupling: Metabolism trends of 1996–2011 in Sweden, Stockholm, and Gothenburg. Environ. Sci. Technol. 2015, 49, 8815–8823. [Google Scholar] [CrossRef] [PubMed]
  22. Kennedy, C.; Cuddihy, J.; Engel-Yan, J. The changing metabolism of cities. J. Ind. Ecol. 2007, 11, 43–59. [Google Scholar] [CrossRef]
  23. Brown, M.T.; Ulgiati, S. Energy quality, emergy, and transformity: H.T. Odum’s contributions to quantifying and understanding systems. Ecol. Model. 2004, 178, 201–213. [Google Scholar] [CrossRef]
  24. Liu, G.Y.; Yang, Z.F.; Chen, B. Urban metabolism process based on emergy synthesis: Theory and method. Acta Ecol. Sin. 2013, 33, 4539–4551. [Google Scholar]
  25. Zhang, Y.; Yang, Z.; Yu, X. Evaluation of urban metabolism based on emergy synthesis: A case study for Beijing (China). Ecol. Model. 2009, 220, 1690–1696. [Google Scholar] [CrossRef]
  26. Odum, H.T.; Brown, M.T.; Brandt-Williams, S. Handbook of Emergy Evaluation. A Compendium of Data for Emergy Computation Issued in a Series of Folios. Folio #1: Introduction and Global Budget; Center for Environmental Policy, University of Florida: Gainesville, FL, USA, 2000. [Google Scholar]
  27. Odum, H.T. Handbook of Emergy Evaluation. A Compendium of Data for Emergy Computation Issued in a Series of Folios. Folio #2: Emergy of Global Processes; Center for Environmental Policy, University of Florida: Gainesville, FL, USA, 2000. [Google Scholar]
  28. Brown, M.T.; Bardi, E. Handbook of Emergy Evaluation a Compendium of Data for Emergy Computation Issued in a Series of Folios. Folio #3: Emergy of Ecosystems; Center for Environmental Policy, University of Florida: Gainesville, FL, USA, 2001. [Google Scholar]
  29. Brandt-Williams, S. Handbook of Emergy Evaluation A Compendium of Data for Emergy Computation Issued in a Series of Folios. Folio #4: Emergy of Florida Agriculture; Center for Environmental Policy, University of Florida: Gainesville, FL, USA, 2002. [Google Scholar]
  30. Kangas, R.C. Handbook of Emergy Evaluation A Compendium of Data for Emergy Computation Issued in a Series of Folios. Folio #5: Emergy of Landforms; Center for Environmental Policy, University of Florida: Gainesville, FL, USA, 2002. [Google Scholar]
  31. Zhang, Y.; Zhang, Z.F. Emergy analysis of urban metabolism and evaluation of eco-efficiency in Beijing. Acta Sci. Circum. 2007, 27, 1892–1899. [Google Scholar]
  32. Brown, M.T.; Ulgiati, S. Emergy-based indices and ratios to evaluate sustainability: Monitoring economies and technology toward environmentally sound innovation. Ecol. Eng. 1997, 9, 51–69. [Google Scholar] [CrossRef]
  33. Chen, Y.L.; Xie, B.G.; Li, X.Q.; Deng, C.X.; Zhu, Y.G. The preliminary research on relationship between the change of land use and urbanization in Changsha from 2003 to 2013. Econ. Geogr. 2015, 35, 149–154. [Google Scholar]
Figure 1. Location of the study area and the land use map of 2008.
Sustainability 08 01004 g001
Figure 2. Diagram of the main energy flows considered in the analysis of residents’ lives.
Sustainability 08 01004 g002
Figure 3. Purchased emergy as a percentage of the total emergy used in Yangzhou. (F, food; F&E, fuels and electricity; G&S, goods and services).
Sustainability 08 01004 g003
Figure 4. Structure of land use in Yangzhou from 1995 to 2014.
Sustainability 08 01004 g004
Figure 5. (a) Relationship between the built-up area and the per capita emergy; (b) Relationship between the built-up area and the emergy-to-money ratio; (c) Relationship between the built-up area and the emergy sustainability index.
Sustainability 08 01004 g005
Table 1. Emergy-based indices considered in the study.
IndexCalculationUnit
StructureFlux (U)R + N + FseJ
Emergy export-oriented ratioF/U-
IntensityPer capita emergyU/urban populationseJ/person year
Emergy to money ratioU/total income of urban householdsseJ/USD
EfficiencyEmergy sustainability index[U/F]/[(N + F)/R]-
Table 2. Emergy synthesis for the urban metabolism of Yangzhou from 1995 to 2014.
ItemTransformitySourceEmergy
199520002005200820112014
Renewable resources (R)
1Sunlight1[3]4.13 × 10184.19 × 10184.40 × 10184.84 × 10186.28 × 10186.48 × 1018
2Wind2.51 × 103[3]3.63 × 10213.68 × 10213.86 × 10214.25 × 10215.51 × 10215.68 × 1021
3Rain (geopotential)1.74 × 10⁴[3]5.23 × 10226.98 × 10226.73 × 10226.61 × 10226.87 × 10226.66 × 1022
4Rain (chemical)3.05 × 10⁴[3]7.70 × 10211.03 × 10229.91 × 10219.74 × 10211.01 × 10229.81 × 1021
5Earth cycle4.70 × 104[3]3.44 × 10193.49 × 10193.66 × 10194.03 × 10195.22 × 10195.39 × 1019
Local non-renewable resources (N)
1Topsoil loss1.70 × 107[3]1.81 × 10211.79 × 10211.77 × 10211.74 × 10211.66 × 10211.65 × 1021
Purchased (imported) resources (F)
1Grain1.14 × 105[24]3.26 × 10204.63 × 10205.86 × 10207.00 × 10201.08 × 10211.16 × 1021
2Vegetables7.37 × 104[24]5.03 × 10206.19 × 10208.85 × 10201.26 × 10211.90 × 10212.01 × 1021
3Meat5.31 × 106[24]6.03 × 10208.99 × 10201.15 × 10212.07 × 10212.77 × 10213.05 × 1021
4Eggs1.71 × 106[4]8.84 × 10191.49 × 10201.72 × 10202.41 × 10203.16 × 10203.16 × 1020
5Fruits8.88 × 104[24]2.24 × 10203.15 × 10204.31 × 10206.68 × 10201.07 × 10211.10 × 1021
6Sugars8.49 × 104[4]3.08 × 10195.19 × 10195.57 × 10199.22 × 10198.43 × 10196.73 × 1019
7Aquatic product1.96 × 106[4]3.24 × 10205.42 × 10206.17 × 10209.61 × 10201.31 × 10211.63 × 1021
8Liquefied petroleum gas1.11 × 105[3]3.86 × 10197.86 × 10191.25 × 10208.65 × 10197.03 × 10196.58 × 1019
9Electricity1.74 × 105[3]1.78 × 10201.95 × 10201.99 × 10202.87 × 10205.28 × 10205.22 × 1020
10Gasoline1.05 × 105[3]8.38 × 10198.49 × 10199.81 × 10191.40 × 10201.83 × 10201.59 × 1020
11Diesel oil1.10 × 105[3]1.60 × 10202.14 × 10202.44 × 10203.50 × 10204.48 × 10203.96 × 1020
12Clothing1.14 × 1013*1.49 × 10211.45 × 10211.93 × 10213.83 × 10214.84 × 10214.00 × 1021
13Household items and medicines1.14 × 1013*9.10 × 10201.30 × 10211.18 × 10211.07 × 10213.15 × 10212.63 × 1021
14Other commodities and services1.14 × 1013*1.67 × 10213.02 × 10214.89 × 10219.07 × 10211.13 × 10221.20 × 1022
* The transformity was calculated according to Formula (11).
Table 3. Emergy-based indices calculated for Yangzhou.
IndexValue
199520002005200820112014
U7.20 × 10229.51 × 10229.55 × 10221.03 × 10231.15 × 10231.13 × 1023
Emergy export-oriented ratio11.43%11.72%16.79%25.25%31.48%33.98%
Per capita emergy3.41 × 10164.40 × 10164.30 × 10164.50 × 10165.00 × 10164.86 × 1016
Emergy-to-money ratio5.30 × 10136.01 × 10133.73 × 10132.36 × 10131.92 × 10131.62 × 1013
Emergy sustainability index55.4055.3227.1111.457.076.05
Table 4. Land use dynamic index (Rd) in Yangzhou from 1995 to 2014.
Land Types/Period1995–20002000–20052005–20082008–20112011–2014
Cultivated land−0.23%−0.24%−0.58%−1.55%−0.18%
Bodies of water0.74%0.31%0.01%−1.20%−0.24%
Built-up area0.28%0.98%3.35%9.92%1.05%
Forests−0.12%−0.31%−0.01%−2.50%−2.02%
Grassland0.00%0.29%0.00%−0.52%−0.85%
Table 5. The value of sensitivity of the emergy-based indices to the cultivated land.
Emergy-Based Indicesβ
1995–20002000–20052005–20082008–20112011–2014
U−27.41−0.44−6.60−10.091.66
Emergy export−oriented ratio−2.16−37.14−43.20−21.16−6.81
Per capita emergy−24.711.91−3.99−9.542.35
Emergy-to-money ratio−11.4432.4831.4815.9513.65
Emergy sustainability index0.1443.7349.5432.7612.41
Table 6. The value of sensitivity of the emergy−based indices to the built-up area.
Emergy-Based Indicesβ
1995–20002000–20052005–20082008–20112011–2014
U22.820.375.498.40−1.38
Emergy export−oriented ratio1.8030.9135.9617.615.66
Per capita emergy20.56−1.593.327.94−1.95
Emergy-to-money ratio9.52−27.04−26.21−13.27−11.36
Emergy sustainability index−0.11−36.40−41.24−27.27−10.33