Article

The Impact of Restaurants’ Green Supply Chain Practices on Firm Performance

1
Graduate Institute of Hospitality Management, National Kaohsiung University of Hospitality and Tourism, No. 1, Songhe Rd., Xiaogang Dist., Kaohsiung City 81271, Taiwan
2
Department of International Business, Chang Jung Christian University, 1 Changda Rd., Gueiren District, Tainan City 71101, Taiwan
*
Author to whom correspondence should be addressed.
Sustainability 2016, 8(1), 42; https://doi.org/10.3390/su8010042
Submission received: 28 October 2015 / Revised: 23 December 2015 / Accepted: 24 December 2015 / Published: 4 January 2016

Abstract

:
This study investigated crucial green supply chain management (GSCM) practice dimensions and firm performance based on restaurants firms in Taiwan. On the basis of a factor analysis, four green supply chain management dimensions were identified: corporate environment policy, green packing, green product, and economic transport. This study investigated crucial GSCM practice dimensions (including corporate environment policy, packaging waste, economic transport, and product recycling), green capability and organizational performance. The results shown: first, green practices in restaurants in Taiwan have an indirect effect on firm performance through green capability; second, when the ability of suppliers of green and green capability is at a higher degree, it will contribute to organizational performance, namely environmental and economic performance. Finally, green practices could be a key driver of green capability and it should be a priority in restaurants.

1. Introduction

The hospitality industry is considered to be a tertiary Industry, but it does affect the environment [1], the tourism industry has been recognized as an important emitter of green house gases, particularly carbon dioxide. It is important to take action to reduce the related environmental impact on the environment in the hospitality industry. Therefore, with their share in rising environmental awareness, many companies have successively declared their environmental and social responsibility. Otherwise, firms should pay attention to their awareness and ability to respond due to the environmental impact in the food and beverage industry. Companies play an integral role to prevent environmental impact, for example they are responsible for environmental degradation caused by the production process. Hence, many NGOs have the information they require companies to publish the impact of the environment, and customers have begun to look for environmentally friendly products to purchase, and began to demand that the company has a green system [2]. Previous research has generally found that environmental practices have a positive impact on organizational performance in terms of operations, composition savings, competitiveness, firm image, stakeholder satisfaction and the financial performance of services. Skjoett-Larsen found that the green supply chain is one of the most important challenges of this century’s European companies [3]. In the future, “green” or “environment”, will become an important competitive factor in the SCM system [3,4]. The enterprise should be “green” as a competitive ability, representatives active strategy, replacing the relevant provisions of past environmental compliance more passive way [5], and that the enterprise will receive if improved environmental performance better competitiveness [6].
Past studies have shown that supply chain management can improve organizational performance. Supply chains and organizations can gain a competitive advantage by being the first to adopt environmental sustainability and implement GSCM practices [7,8]. While focusing on your suppliers’ practices, consider the importance of your own eco-friendly strategies as the foundation of your operation’s wherewithal. In other words, greening the supply chain means using a systematic approach to choose suppliers whose products/services are proven to be more sustainable than those of their competitors, and whose own green practices are more sustainable. Additionally, firms must rethink business strategy and the development of green innovation practices to respond immediate needs for the market and environmental challenges [9]. In summary, the study investigated crucial GSCM dimensions and from capability view, explore green capability antecedents and organizational performance as a result of the relationship.

2. Literature Review and Hypotheses Development

2.1. Green Supply Chain

The supply chain consists of all parties that are involved in fulfilling a customer request, including the suppliers, transporters, warehouses, retailers and customers themselves [10]. Green supply chain management (GSCM) practices involve organizations assessing the environmental performance of their suppliers, requiring suppliers to undertake measures that ensure the environmental quality of their products, and evaluating the cost of waste in their operating systems [11]. GSCM definition has ranged from green purchasing to integrated supply chain flowing from supplier, to manufacturer, to customer and reverse logistics [12].
Hervani et al. [13] explore GSCM activities including green design, purchasing, manufacturing/processing, production, marketing, recycling and material source. Srivastava describes GSCM as combining environmental thinking and SCM and defines it as including product design, material sourcing and selection, manufacturing processes, delivery of the final product to the consumer, and end-of-life management of the product after its useful life [14]. GSCM, advocating efficiency and synergy between partners, facilitates environmental performance, minimal waste and cost savings [15]. Comparing the definitions of SCM and GSCM, it is clearly shown that green supply chain involved not only integrating the manufacturing process and distribution to customers. GSCM also covers from the very beginning stage when the product is designed until the product is disposed. However, it requires a full integration and collaboration of player along the product life cycle.

2.2. Motivations for the Adoption of Green Practices in Companies

Definitions of the constructs incorporated in the model are provided in Table 1. Generally, GSCM practices are the focal constructs in the theorized model with internal environmental management and green information systems as antecedents and green capability, economic performance and environmental performance, as consequences.
Table 1. Construct definitions.
ConstructDefinition
Corporate environment policyRestaurant waste properly handled, using local produce and saving food miles concept. Achieving sustainable food, furniture and environmentally friendly products and the acquisition of the green mark, environmentally friendly and designed to build energy-saving green building materials [16]
Packaging wasteThe management of packaging waste is therefore an important financial and environmental issue for restaurants in developing countries and economies in transition: it encourages continuous improvement in products and services; serves as a strategic tool for cutting costs; the decrease in processed and packaged foods; improves your public image; and promotes sustainable development
Economic transportBased on environmental sustainability, through the use of an energy-efficient transport system and to enhance the transport efficiency of energy use, reducing transport vehicle mileage, etc., restaurant food achieve a low-carbon transport activities
Product recyclingRecycling all resources that can be recycled, for example: plastic, paper, aluminum cans, glass bottles, cardboard boxes, and even cooking oil, reduce the use of a product that is lost. Reward guests for dining with recyclable mugs and containers
Green capabilityGreen capability relates to the manufacturing plant’s capabilities to more efficiently produce and improve firm’s strategic position in the market, whether domestic or international and as signals of a firm’s competitive aggressiveness, capabilities, and market position
Economic performanceEconomic performance relates to the manufacturing plant’s ability to reduce costs associated with purchased materials, energy consumption, waste treatment, waste discharge, and fines for environmental accidents
Environmental performanceEnvironmental performance relates to the ability of manufacturing plants to reduce air emissions, effluent waste, and solid wastes and the ability to decrease consumption of hazardous and toxic materials
There are several researches that disclose that supply chains and organizations can gain green capability by being the first to adopt environmental sustainability and implement GSCM practices. For example, Diabat and Govindan studied various drivers that affect the implementation of green supply chains and found that green design positively influences the performance of green supply chains [17]. The aim of eco-design is the reduction of a product’s environmental impact without creating a negative trade-off with other design criteria, such as costs and functionality. Seuring cautions that transaction costs associated with interactions among supply chain partners must be considered as the partners work to improve the environmental sustainability of the supply chain [18]. Both Pereira-Moliner and Molina-Azorín et al. [19,20] found hotels that adopted more environmental practices achieved better firm performance than those adopting fewer.
Bansal and Roth acknowledged the pursuit of competitive advantage as a focal firm’s environmental policy efforts, which contributes to a firm’s environmental management activity [21]. Firms implement environmental policy activities in an effort to create efficiencies and to obtain stakeholder approval and, thus, gain competitive advantage and realize superior returns [22]. In this study, we are particularly interested in examining the competitive drivers of environmental policy activities. Porter explains, “a signal is any action by a competitor that provides a direct or indirect indication of its intentions, motives, goals, or internal situation” (p. 75) [23]. In essence, signals convey information about product quality, firm reputation, or the competitive intentions of rivals to market participants. Hence, green capability and reactions signal to the market and to stakeholders the value that a firm is creating for them [24]. Green capability serves as signals of a firm’s competitive aggressiveness, capabilities, and market position [25].
In accordance with prior research, the following hypothesis is proposed:
H1: 
Corporate environment policy is positively related to restaurant’s green capability.
Environmental packing procurement is an increasingly important issue and decision-making tool for small and. It can be ignored by an enterprise only at peril to its long-term survival. The EU Directive on Packaging and Packaging Waste 94/62/EC seeks to reduce the impact of packaging and packaging waste on the environment. This does not apply directly to procurement services but will affect companies in our supply chain. The Welsh Assembly Government’s long term strategy for the environment of Wales, setting the strategic direction for the next 20 years including the need for more efficient materials consumption and waste management. Procurement Services has a role to play in contributing to the desired outcomes of the strategy, such as through encouraging our supply chain to design products (and packaging) that require less resources in their production, use and end of life, that create minimal waste and are easily reused or recycled. In the research of Hayami et al. (2015) to encouraging suppliers to reduce waste can lead to internal green product, process and managerial innovations and can enhance competitive advantage [26]. If this is so, then the main driving forces for implementation of environmental management include not only compliance with regulations and legislation but also cost savings. Therefore, the next hypothesis is proposed:
H2: 
Packaging waste is positively related to restaurant’s green capability.
Zsidisin and Siferd pointed out suppliers should not only be evaluated, but that supplier development should also be part of green purchasing [27]. Working with sustainable supplier development can also be seen as a way to reduce the environmental risk in supplier relationships, something that should also have positive effects on operational costs and overall competitive advantage [28]. In addition, supplier selection and development (SSD) are crucial processes for successful GSCM. If problems surface regarding waste levels, transportation of hazardous materials or carbon emissions, suppliers may not be considered for future contracts. Firms should enhance green procurement and stimulate their transport and logistics suppliers in developing collaborative initiatives. Through collaboration with other suppliers the size of the counterpart as well as enhanced buyer competence should reduce and share the risk associated with specific resource investment in the area of green logistics which was support by Large et al. [29] who suggest that green collaboration with a supplier supposedly influences the environmental performance of the supplier. Therefore, the next hypothesis is proposed:
H3: 
Economic transport is positively related to restaurant’s green capability.
The European Union, for example, passed the WEEE (Waste Electrical and Electronic Equipment) and RoHS (Restriction of Hazardous Substance) regulations, unequivocally proscribing the use of six hazardous substances in products for sale in the European market, and requiring compliance with the relevant product recycling laws. Moreover, the importance of GSCM activities such as green design, purchasing, manufacturing/processing, production, marketing, recycling and material source, has been explored in the green supply chain literature [13]. Diabat and Govindan find reducing energy consumption, reusing and recycling materials and packaging are influenced the implementation of GSCM [17]. Li also demonstrated recycling products processing ability was strongly balancing to other advanced management practices, and contributed to improving environmental performance [30]. Based on the findings listed above, the following hypothesis is proposed:
H4: 
Product recycling is positively related to restaurant’s green capability.

2.3. Impact of the Adoption of Green Practices on Firm Performance

Hoejmose et al. [31] remark that restaurants experience a high level of stakeholder scrutiny while using green practices to achieve green capability. Consequently, when a firm adopts such practices, it can improve its image, attract new, “green” consumers, further satisfy existing customers and thus ensure themselves a better overall position in the market [32]. Furthermore, firm usually implement these steps to achieve consumption economic savings. Green practices do not require significant financial investment but may provide immediate economic benefits [33]. For example, through the application of more efficiently water and energy consumption and waste recycling methods and the subsequent bring reduction in total operational costs.
Based on the findings listed above, the following hypothesis is proposed:
H5: 
Green capability is positively related to a restaurant’s economic performance
Enterprises to implement green supply chain management to increase efficiency and promote business relations between partners, in order to improve environmental performance, waste minimization and cost [34,35]. Chen believes that the implementation of environmental management strategies of the enterprise, not only to avoid penalties and regulations, but also to enhance their green image [36]. Our focus is on the sustainability incorporates the concepts of environmental performance has moved from the organization level to the supply chain level [37,38]. Seuring (2004) describes green capability as the managerial integration of material and information flows throughout the supply chain to satisfy the demand of customers for green products and services produced by green processes [39]. Supply chains strive to maintain internal health and environmental sustainability using the capability to correct based on information from the external environment [40].
Therefore, the next hypothesis is proposed:
H6: 
Green capability is positively related to restaurant’s environmental performance.

3. Materials and Methods

3.1. Data Collection

Data were obtained from on-site employee and shopkeeper in the samples of this study. Overall, 130 respondents from Taiwan completed the survey. The survey questionnaires included three sections. The survey questionnaires included three sections. The first section investigated the demographic profile of respondents and the second section included twenty-one statements/variables about the green supply chain practice. The twenty-one statements represented four green supply chain practice including “corporate environment policy,” “packaging waste,” “economic transport”, and “product recycling”. This section based on the comments from senior chain restaurants staffs are asked to clarify the belief statements and comment on their appropriateness for investigating green capability in the context of Taiwan. Respondents were asked to express the extent to which they disagreed or agreed with the statements. The second section of the questionnaire included sixteen questionnaires of firm performance including “economic performance,” “green capability,” and “environmental performance”. The third section of the questionnaires was designed based on the literature concerned with firm performance. The refined types of green supply chain practice were perceived as the predictor variables, while the three types of firm performance were regarded as the criterion variables.

3.2. Participants

The sample for this study consisted of all managerial employees of the chain restaurants were set up in Taiwan with around 170 shopkeeper in Taiwan Association of F&B Societies. Of the 135 questionnaires distributed, 130 shopkeeper responded, yielding a response rate of 96.30%. Five of the returned questionnaires were excluded from the analysis because of missing pages. Of the total 130 subjects, 50.8% were female. The age of respondents ranged from 30 to 60 years. A significant percentage of respondents (31.5%) were in the 31-year-old to 40-year-old age group. In terms of education, 27.7% had completed high school. 55.45% had a bachelor’s degree, and 1.5% had master degree. The age of respondents ranged from 20 to 60 years. A significant percentage of respondents (62.3%) were in the 31- to 50-year-old age group. Tenure in the organization ranged from 3 years to 9 years, with a mean of 6 years (45.4%). In terms of education, 55.4% had completed high school and 27.7% had a bachelor’s degree.

3.3. Measures

Measures of the survey were initially developed based on input from a thorough literature review. Drafted measuring instruments were then assessed by three academics knowledgeable about the topic under investigation. The assessed instruments were further pre-tested with 20 senior executives working for the F&B industry in Taiwan. All executives who participated in this instrument development process were excluded from the subsequent mail survey. English was initially used to develop the survey questionnaire, which was subsequently translated into Chinese. The linguistic equivalence between the two versions was ensured by employing the back-translation technique.

3.3.1. Corporate Environment Policy

Four items each for corporate environment policy were adapted from Bagur-Femenias et al. (2013) relevant scales [41]. The items were coded on a five-point scale ranging from 1 = “strongly disagree” to 5 = “strongly agree”.

3.3.2. Packaging Waste

To measure packaging waste, the scale proposed by Rao (2005) was used, Such as the optimization of processes to reduce solid waste [15]. The items were coded on a five-point scale ranging from 1 = “strongly disagree” to 5 = “strongly agree”.

3.3.3. Economic Transport

As mentioned, this investigation adapted proposed Rao (2005) proposed items to capture the three major economic transport s, such as change for more environmentally-friendly transportation [15]. The items were coded on a five-point scale ranging from 1 = “strongly disagree” to 5 = “strongly agree”.

3.3.4. Product Recycling

Three items each for corporate environment policy were adapted from Rao (2005) relevant scales [15]. The items were coded on a five-point scale ranging from 1 = “strongly disagree” to 5 = “strongly agree”.

3.3.5. Green Capability

The green capability of restaurants reflects their ability to manage their environmental impacts through provision of environmentally conscious products, adopting cleaner production processes, integrating environmental issues into business routines, sourcing from environmentally responsible upper-tier suppliers, and communicating their environmental policy with partners [26,42]. A four-item scale is adopted from Lee and Klassen (2008) Wong et al. (2012) and Bagur-Femenias et al. (2013) [41,42,43]. We asked respondents to assess their firms on these items using a five-point Likert scale with 1strongly disagree and strongly agree.

3.3.6. Economic Performance

To measure economic performance, the scale proposed by Rao (2005) was used. Such as new market opportunities [15]. The items were coded on a five-point scale ranging from 1 = “strongly disagree” to 5 = “strongly agree”.

3.3.7. Environmental Performance

The three-item environmental performance scale was based on a measure developed by Zhu et al. (2008) and Bagur-Femenias et al. (2013) [41,44]. Therefore, we tested the model using a perceptual measure of environmental performance in which each respondent rated his or her organization’s environmental performance relative to that of other firms in the restaurants using three items. It was used to assess overall environmental performance. The responses were on a five-point Likert-type scale, ranging from 1 = “strongly disagree” to 5 = “strongly agree”.

4. Research Methodology

4.1. Measurement Development

A descriptive analysis was given in Table 2 used to investigate the demographic information of the respondents, including type of operation and number of employees. A principal component analysis with a varimax rotation was used to test whether twenty-one statements/variables were loaded on five types of green supply chain practice and sixteen statements were loaded on three types of firm performance. The types of GSCM practice and firm performance were therefore refined, and the internal consistency of the refined orientations was examined using Cronbach’s alpha reliability coefficients.
A partial least square structural equation model was constructed to test both the reliability and validity of measurement and the structural model. The measurement model represents the relationship between the manifest variables (measurable items) and the unobserved latent variables, while the structural model focused on the hypothesized relationship between the latent variables [45]. A first order reflective model was employed in this study since the latent construct existed independent of the measures used; the variation in the construct caused variation in the item measures; this variation did not cause a variation in the construct; the items shared a common theme; the items were interchangeable so that adding or dropping an item did not change the conceptual domain of the construct; and the items should have had high positive intercorrelations in reflective models [46,47].
However, the PLS approach was employed in this study since PLS: (1) places less premium on explaining the covariance of all item measures, (2) avoids a negative impact due to errors in modeling or item usage, (3) values soft distributional assumptions, (4) sees the research as not simply exploratory in nature, but interactive, (5) has formative measurement items (even if the formative modelwas not used), (6) requires flexibility in modeling higher order Molar and Molecular models, (7) is interested in obtaining determinate scores/indices that are predictive (8) has high model complexity (9) faces a relatively smaller sample size, (10) is less concerned with the accuracy of parameter estimation or does not hold a belief in the notion of an underlying covariance based latent variable generating mechanism, (11) wants to shift the perspective of a “True” Model towards a Prediction Focus, and values ease of model specification and model interpretation [48]. Fornell and Bookstein stated that PLS is a powerful method of analysis because of its minimal demands on measurement scales, sample size, and residual distributions [49]. PLS avoids the two serious problems of inadmissible solutions and factor indeterminacy [49]. Many environmental based researchers have used the PLS method to analyze different relationships [50,51]. Smart PLS software was employed as the analysis tool in this research to test the proposed model. The results are shown below [52].
Table 2. Reliability of the measurement model.
LoadingsComposite ReliabilityAverage Variance ExtractedCronbach’s AlphaCommunality
Corporate environment policy0.780.8740.6350.8030.635
0.89
0.75
0.78
Packaging waste0.880.8690.6290.7910.629
0.85
0.81
0.66
Economic transport0.890.8200.6990.7670.699
0.88
0.71
Product recycling0.920.8920.7360.8110.736
0.88
0.77
Green capability0.830.9170.7360.8790.736
0.79
0.79
0.73
Economic performance0.830.9050.6590.8650.659
0.81
0.79
0.72
0.60
Environmental performance0.900.9050.6870.7630.687
0.89
0.52

4.2. Measurement Model

To assess how well the given indicators explained the construct, testing of the measurement model was crucial. Therefore, the factor loadings, the composite reliability, the average variance extracted (AVE), as well as Cronbach’s alpha, communality, convergent validity, and discriminant validity were used to test the measurement model. In essence, the reliability and internal consistency of the model were tested. According to the results, all the scores were above or near the threshold values. AVE scores for each construct ranged from 0.62 to 0.73, which exceeded the suggested threshold value of 0.5 [53]. The composite reliabilities were all well above the recommended threshold value of 0.8. Cronbach’s alpha showed as above 0.76 the recommended threshold value. Convergent validity was used for assessing each indicator’s relationship with the connected construct. The analysis of convergent validity is shown under factor loadings in Table 2, which shows how well each indicator was correlated with the construct that it is connected to. According to the table, factor loadings exceeded the value of 0.5 suggested by Hair et al. [45]. Examining the degree of divergence of each construct from each other is known as discriminant validity analysis. For this analysis, the square root of the AVE scores for each construct was compared with their correlation with the other constructs. It is recommended that the square root of AVE scores should be greater than their correlation with the other constructs [54].
The proposed hypothesized relationships, shown in Figure 1 were investigated in relation to the size of the firms. The robustness and reliability of the measurement model were also investigated by using average variance extracted (AVE), composite reliability and Cronbach's alpha. There was no issue with the reliability of the measurement model in each sector group. The results demonstrated that the hypothesized relationships.
Figure 1. Hypothesized relationships among green supply chain management (GSCM) practices, green capability and green performance.
Sustainability 08 00042 g001
Table 3 reveals the correlation matrix of constructs and the square root of AVE scores in bold. According to the obtained result, off-diagonal results (correlation of constructs) were less than or equal to the bolded diagonal (square root of AVE scores) values. There was no problem with discriminant validity, which indicated the validity of the proposed measurement model. It was therefore concluded that the measurement model was reliable.
Table 3. Correlation of constructs and square root of AVE.
GCECPENPCEPPWPRET
Green capability(GC)0.857
Economic performance(ECP)0.6500.811
Environmental performance(ENP)0.5570.4580.828
Corporate environment policy(CEP)0.5180.3570.4430.796
Packaging waste(PW)0.5350.3520.6260.4520.793
Product recycling(PR)0.4360.4710.4910.3230.4320.857
Economic transport(ET)0.5010.4550.4590.3240.5860.4830.836
Diagonals show the square root of AVEs.

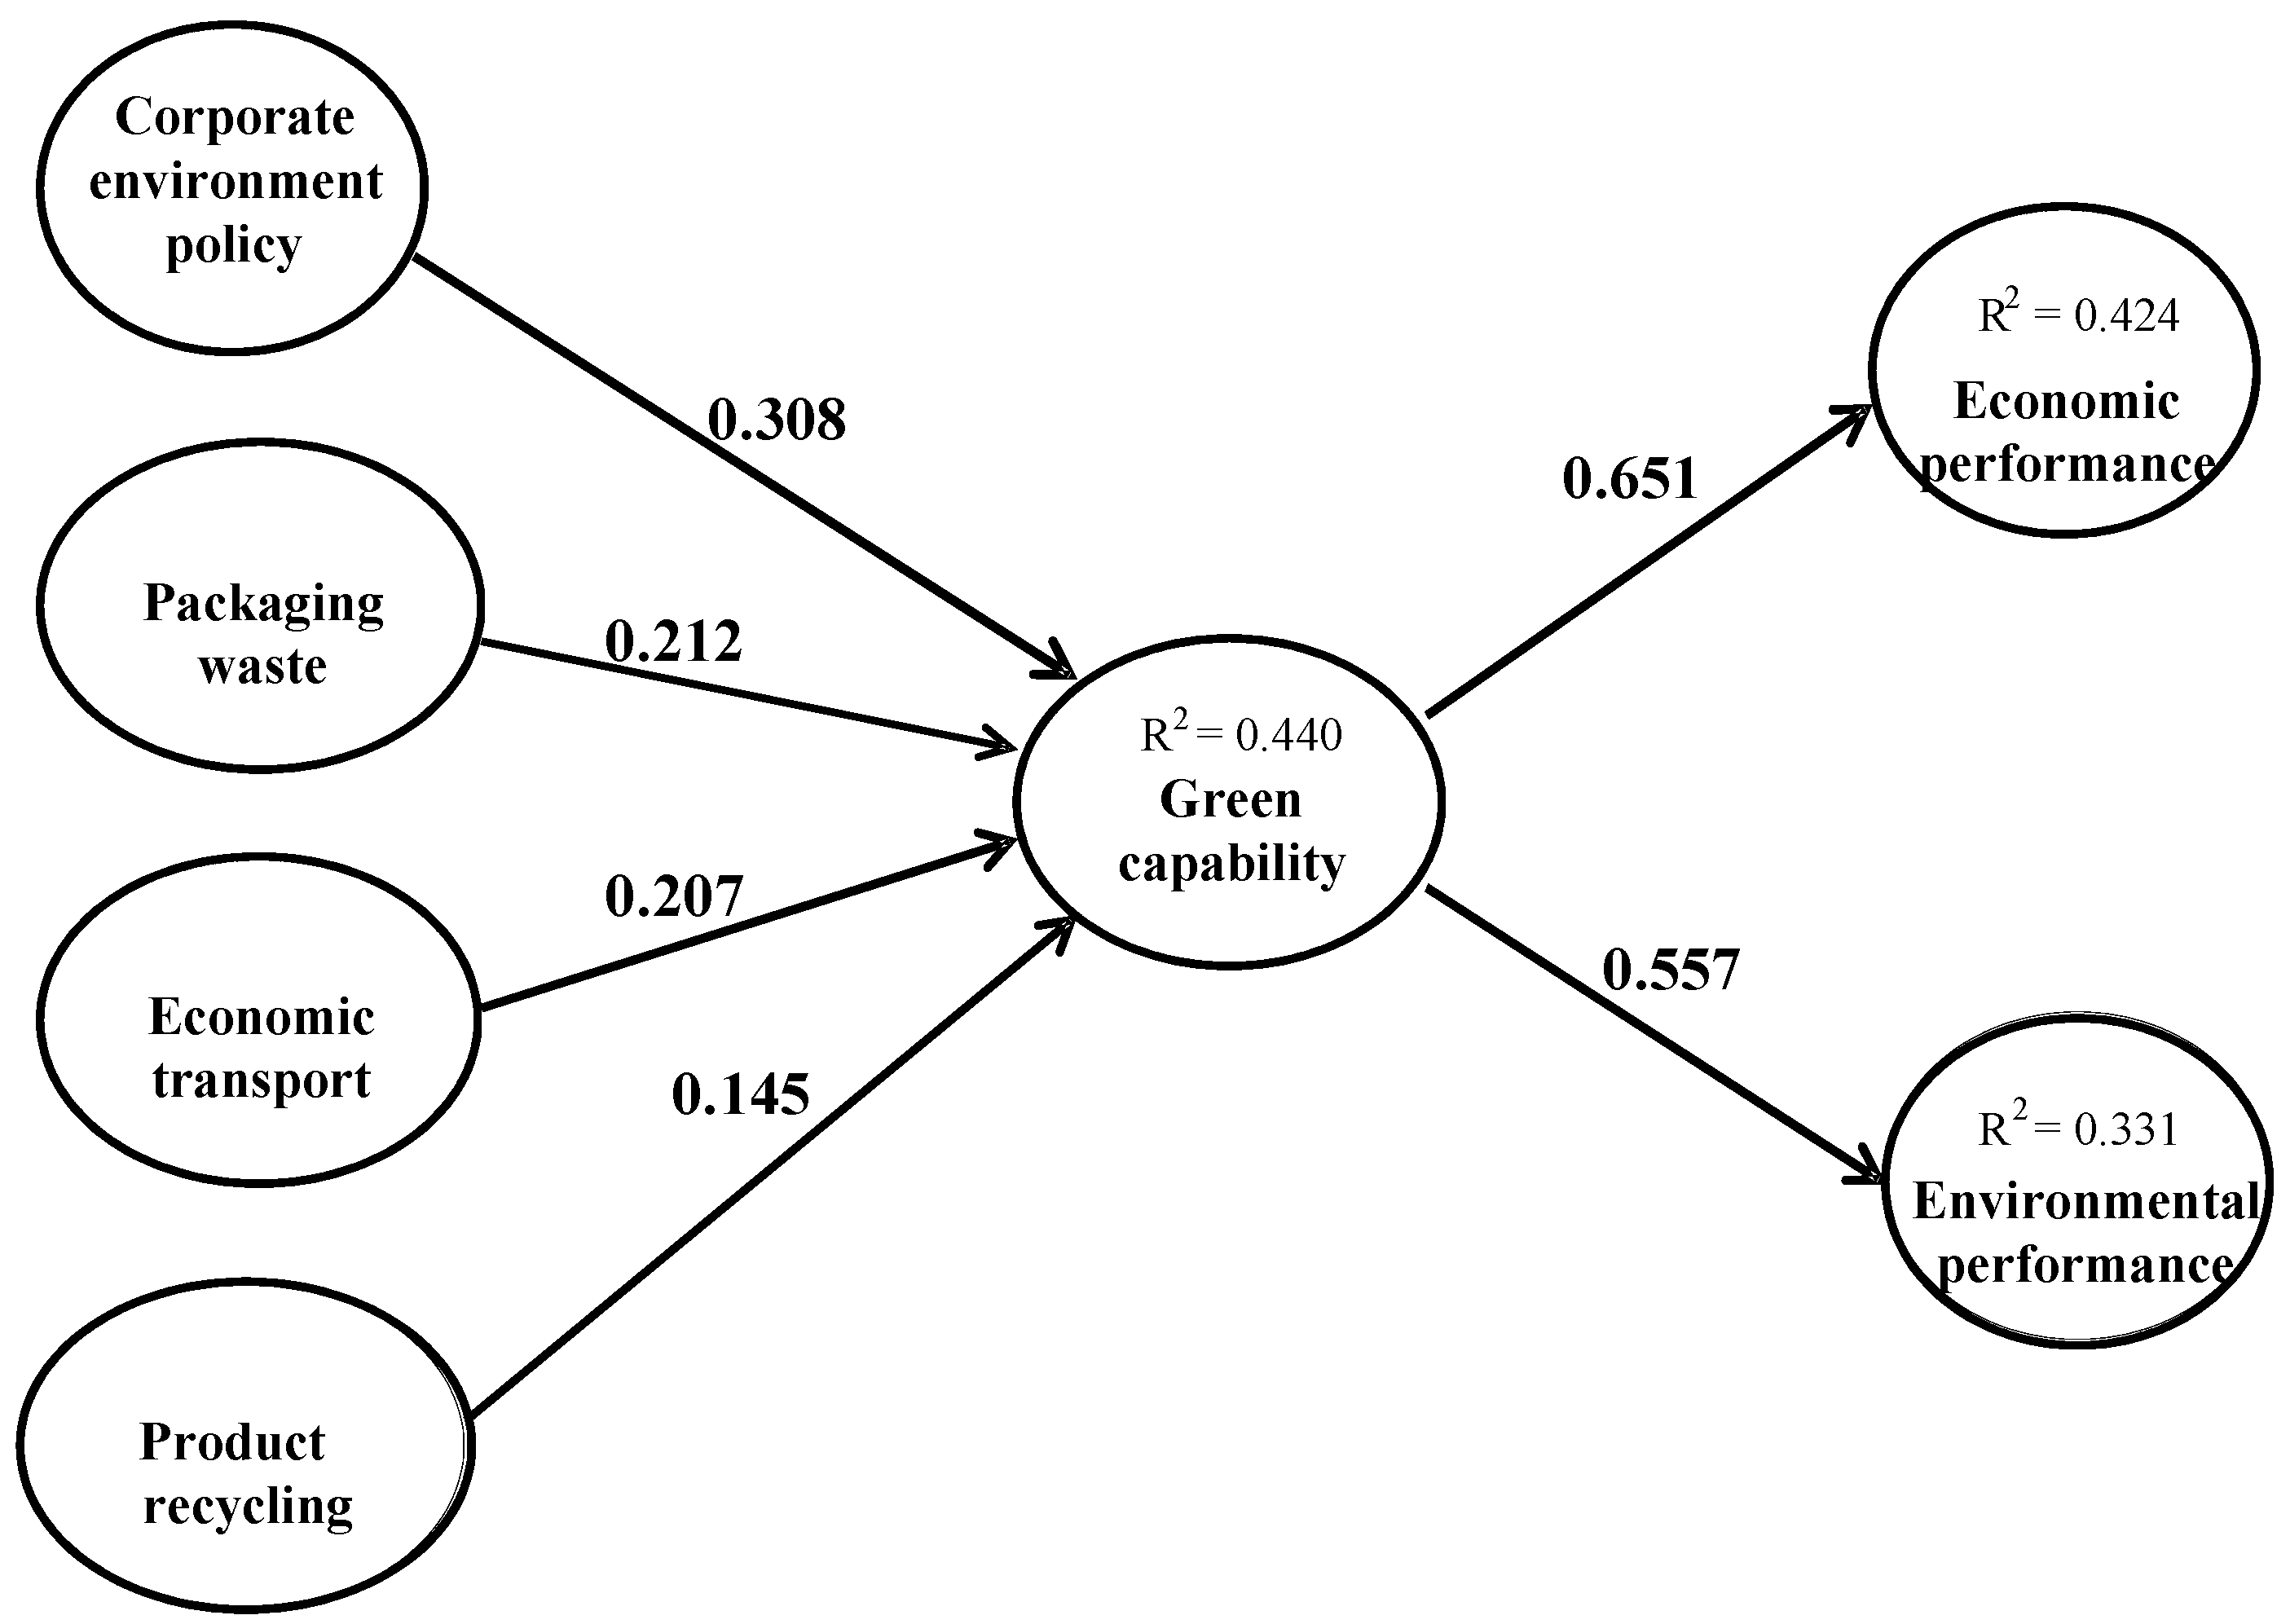
4.3. Structural Model

A structural model was used to assess the hypothesized relationship of the constructs, the coefficient of determination (R2), the path coefficient and their corresponding significance scores. To assess the statistical significance between latent variables (constructs), traditional parametric tests were inappropriate in PLS [54]. Therefore, bootstrapping as a non-parametric test was used to test the hypothesized relationship between constructs. In order to do this, 200 bootstrap samples were established by resampling with replacement from the original samples. Table 4 shows that the R2 value of green capability was 44%, the economic performance was 42.3%, and the environmental performance was 31% of the total variance.
Table 4. R square values.
ConstructsR2
Green capability0.440
Economic performance0.423
Environmental performance0.310
In order to assess overall performance of the model as well as the measurement and the structural models, a global criterion of goodness of fit index (GoF index) as developed by Tenenhaus et al. [55] was employed. The GoF index provides a single measure for the overall prediction performance of the model by taking the geometric mean of the average communality index and the average R2 value (Go Average × Communality Average × R 2 ) . The GoF index of the model was 0.542 which indicated that the model was able to take into account 54.2% of the achievable fit.
Table 5 shows the path coefficient results as well as their t-values which were obtained by using the bootstrapping re-sampling technique in Smart PLS. The path coefficients and their associated t-values demonstrated the direction and strength of each hypothesized relationship. Based on obtained results, there was a positive significant relationship between CEP and GC. It was found that the hypothesized relationship was statistically significant at the p < 0.01 level with a β = 0.308 path coefficient (CEP→GC; β = 0.308, p < 0.01). In addition, PW→ GC (β = 0.212, p < 0.1), ET→ GC (β = 0.207, p < 0.1), there was a weak positive significant relationship to the, PR→GC; β = 0.145, GC→EcP (β = 0.651, p < 0.001), GC→EnP (β = 0.557, p < 0.001). In conclusions, except H4 each of the five hypothesis were support at the 0.1 level.
Table 5. Summary of testing results.
RelationshipHypothesisCoefficientt-ValueHypothesis Test Result
CEP→ GCH10.3082.994 **supported
PW→ GCH20.2122.099 *supported
ET→ GCH30.2072.024 *supported
PR→ GCH40.1451.550not supported
GC→ EcPH50.65111.896 ***supported
GC→ EnPH60.5578.472 ***supported
* t > 1.96 ** t > 2.58 *** t > 3.3.

5. Discussion

Hypotheses test results are presented in Table 5. Except for H4 each of the five hypothesis were supported at the 0.1 level. Although the product recycling has a weak direct effect on green capability, in contrast to previous research on the food and beverage industry, this study does not find a positive effect between product recycling and green capability. Thus, it is necessary to assess the effect of environmental practices as a whole, which could be difficult for restaurants because the attributes of management systems are generally informal.
There are three reasons that express why product recycling is a limited resource being used faster in chain restaurant: first, most commonly used restaurant products like plastic wrap, toothpicks, paper napkins and towel, and straws can be purchased produced with recycled, biodegradable, tree-free, or organic components [56]. The cost, however, is what would make a restaurant think twice. Second, simply using a recycling program or changing standard operating procedures to lessen the amount of time certain appliances are left on will not affect a customer’s perception of a restaurant. According to a study conducted by the NPD Group, despite the restaurant industry’s effort to make operations more environmentally friendly, consumers do not view this sector as having made any progress with regards to going green [57]. This lack of awareness is directly contributing to the customer perception of the industry. In order to overcome this situation, it is important for third party certification organization to arise and make the efforts of the industry more relatable to customers. Third, Spanish regulations establish minimum sanitary controls and food traceability on operations that are mandatory; however, restaurant managers are free to determine the use of environmental practices within operations as a part of the company’s strategy. Thus, it appears that restaurants reacted to this pressure by implementing green operational practices such as conserving water, conserving energy, recycling hazardous product waste or using ecological food. This situation is the same in Taiwan. Previous studies (Ilomaki and Melanen 2001; Jacobs et al. 2010) indicate a lack of interest among small service companies with regard to the implementation of green practices because they could not perceive a direct effect on business performance. Our results reinforce the belief that there is not always a direct effect between product recycling and green capability [58,59].

6. Conclusions

This study has examined the GSCM in a Taiwanese restaurant context. The study’s main findings are summarized below. First, green practices in restaurants in Taiwan have an indirect effect on firm performance through green capability. The effect on green capability linked to the implementation of green practices has been widely studied [19,31]. This study reinforces previous findings and provides new evidence for the restaurant sector. Thus, green practices can improve capability both internally and externally. Externally, the restaurant’s reputation improves the customers’ perceptions of it [60,61,62,63], so green practices could be a good way to maintain positioning in the market during times of crisis [64]. Furthermore, the adoption of these measures can be used to attract a new type of customer to the restaurant by offering new menu selections according to their preferences and concerns thereby increasing sales more than the competition does [65,66]. Second, when the ability of suppliers of green and green capability is higher degree, it will contribute to organizational performance, namely environmental and economic performance which supported by Bowen et al. and Tseng et al. [34,35]. Restaurants implement GSCM practices to increase efficiency and promote business relations between partners, in order to improve environmental performance, waste minimization and cost savings. Additionally, when a higher degree of market-oriented firms faces the challenge, the higher the green capability firms have. This means that restaurants that own GSCM capability in the face of market-oriented firms will enhance their ability to make the ring environmental performance and economic performance has grown. Thus, the present study supports Zhu et al. [44]. when companies face external green market proposed to change the traditional mode of production and services for the new type of green management mode is available to develop green performance.
Finally, it appears that the improvement in terms of green capability overcomes the investment and additional costs related to the implementation and monitoring of green practices. Thus, this finding reinforces the results of previous studies [31,61]. Making a change to green practices could be a key driver of green capability and it should be a priority in restaurants. Further, the finding light on restaurants provide managers with insights into the characteristics of restaurants related supplier which are useful to them for formulating plans to benchmark and set targets for GSCM capability and performance improvement.

7. Managerial Practices

With regard to managerial practices, it is possible to draw two interesting conclusions from this study that may be of direct interest to practitioners working in the sector. First, sustainability is increasingly valued in times of recession. Green practices in restaurants in Taiwan have a direct effect on firm performance through green capability and can efficiency improvement and competitive improvement that restaurants can develop to survive economic downturns and achieve better positioning in the market. Second, practitioners must consider green practices to be a way to improve competitiveness. Internally, senior managers should consider that the adoption of certain green practices improves employee performance and achieves cost reduction in consumption. Thus, the application and communication of these policies increases the motivation of workers because they feel that they are part of an environmentally sustainable project. Ultimately, customers receive better quality service, which may positively affect the profit and loss statement. Externally, green practices can be used to build and reinforce the brand. It is clear that being a green restaurant helps to cement customer loyalty to the brand and generates new customer interest in the restaurant’s products. Thus, attaching the brand to a “green-friendly concept” may help practitioners to better satisfy customer needs.

8. Limitations and Areas for Future Study

Several limitations of this study that need further attention in the future should be noted. First, because all of the measures used are self-reported, common method variance due to single-source bias is a problem and may have inflated the magnitude of the relationships found. Second, the relatively small sample used for this study may limit the generalizability of the results. Future research is also needs to examine the influence of national or restaurants organizational culture on the proposed relationships, and other mediators, such as mark orientation, should also be explored.

Author Contributions

Jun-Zhi Chiu designed this study, collected and processed the data. Chao-Chen Hsieh provided some significant advice and checked through the whole paper. The first author wrote the paper and coauthors read and approved this version.

Conflicts of Interest

The authors declare no conflict of interest.

References

  1. Kasim, A. Towards a wider adoption of environmental responsibility in the hotel sector. Int. J. Hosp. Tour. Admin. 2007, 8, 5–49. [Google Scholar] [CrossRef]
  2. Han, H.; Hsu, L.; Sheu, C. Application of the theory of planned behavior to green hotel choice: Testing the effect of environmental friendly activities. Tour. Manag. 2011, 31, 325–334. [Google Scholar] [CrossRef]
  3. Skjoett-Larsen, T. European logistics beyond 2000. Int. J. Distrib. Logist. Manag. 2000, 30, 377–387. [Google Scholar] [CrossRef]
  4. Abukhader, S.M.; Jönson, G. Logistics and the environment: Is it and established subject? Int. J. Distrib. Logist. Res. Appl. 2004, 7, 137–149. [Google Scholar] [CrossRef]
  5. Van Hoek, R.I. From reversed logistics to green supply chains. Supply Chain Manag. 1999, 4, 129–124. [Google Scholar] [CrossRef]
  6. Bacallan, J.J. Greening the supply chain. Bus. Environ. 2000, 6, 11–12. [Google Scholar]
  7. Barratt, M.; Oke, A. Antecedents of supply chain visibility in retail supply chains: a resource-based theory perspective. J. Oper. Manag. 2007, 25, 1217–1233. [Google Scholar] [CrossRef]
  8. Sen, S. Linking green supply chain management and shareholder value creation. IUP J. Supply Chain Manag. 2009, 7, 95–109. [Google Scholar]
  9. Jaworski, B.J.; Kohli, A.K. Market Orientation: Antecedents and Consequences. J. Mark. 1993, 57, 53–70. [Google Scholar] [CrossRef]
  10. Cox, A. Power, value and supply chain management. Supply Chain Manag. 1999, 4, 167–175. [Google Scholar] [CrossRef]
  11. Handfield, R.; Walton, S.; Sroufe, R.; Melnyk, S. Applying environmental criteria to supplier assessment: A study in the application of the analytical hierarchy process. Eur. J. Oper. Res. 2002, 141, 70–87. [Google Scholar] [CrossRef]
  12. Zhu, Q.; Sarkis, J. Relationships between operational practices and performance among early adopters of green supply chain management practices in Chinese manufacturing enterprises. J. Oper. Manag. 2004, 22, 265–289. [Google Scholar] [CrossRef]
  13. Hervani, A.A.; Helms, M.M.; Sarkis, J. Performance measurement for green supply chain management. Benchmarking Int. J. 2005, 12, 330–353. [Google Scholar] [CrossRef]
  14. Srivastava, S.K. Green supply-chain management: A state-of-the-art literature review. Int. J. Manag. Rev. 2007, 9, 53–80. [Google Scholar] [CrossRef]
  15. Rao, P.; Holt, D. Do green supply chains lead to competitiveness and economic performance? Int. J. Oper. Prod. Manag. 2005, 25, 898–916. [Google Scholar] [CrossRef]
  16. Lorenzini, B. The green restaurant, part II: Systems and service. Restaur. Inst. 1994, 104, 119–136. [Google Scholar]
  17. Diabat, A.; Govindan, K. An analysis of the drivers affecting the implementation of green supply chain management. Resour. Conserv. Recycl. 2011, 55, 659–667. [Google Scholar] [CrossRef]
  18. Seuring, S. Green supply chain costing: joint cost management in polyester linings supply chain. Greener Manag. Int. 2001, 33, 71–80. [Google Scholar] [CrossRef]
  19. Pereira-Moliner, J.; Claver-Cortés, E.; Molina-Azorín, J.F.; Tarí, J.J. Quality management, environmental management and firm performance: Direct and mediating effects in the hotel industry. J. Clean. Prod. 2012, 37, 82–92. [Google Scholar] [CrossRef]
  20. Molina-Azorín, J.F.; Claver-Cortes, E.; Pereira-Moliner, J.; Tarí, J.J. Environmental practices and firm performance: An empirical analysis in the Spanish hotel industry. J. Clean. Prod. 2009, 17, 516–524. [Google Scholar] [CrossRef]
  21. Bansal, P.; Roth, K. Why companies go green: A model of ecological responsiveness. Acad. Manag. J. 2000, 43, 717–736. [Google Scholar] [CrossRef]
  22. Montabon, F.; Sroufe, R.; Narasimhan, R. An examination of corporate reporting, environmental management practices and firm performance. J. Oper. Manag. 2007, 25, 998–1014. [Google Scholar] [CrossRef]
  23. Porter, M.E. Competitive Strategy; The Free Press: New York, NY, USA, 1980. [Google Scholar]
  24. Basdeo, D.K.; Smith, K.G.; Grimm, C.M.; Rindova, V.P.; Derfus, P.J. The impact of market actions on firm reputation. Strateg. Manag. J. 2006, 27, 1205–1219. [Google Scholar] [CrossRef]
  25. Grimm, C.M.; Lee, H.; Smith, K.G. Strategy as Action: Competitive Dynamics and Competitive Advantage; Oxford University Press: Oxford, UK, 2005. [Google Scholar]
  26. Hayami, H.; Nakamura, M.; Nakamura, A. Economic performance and supply chains: The impact of upstream firms' waste output on downstream firms’ performance in Japan. Int. J. Oper. Econ. 2015, 160, 47–65. [Google Scholar] [CrossRef]
  27. Zsidisin, G.A.; Siferd, S.P. Environmental purchasing: A framework for theory development. Eur. J. Purch. Supply Managet. 2001, 7, 61–73. [Google Scholar] [CrossRef]
  28. Foerstl, K.; Reuter, C.; Hartmann, E.; Blome, C. Managing supplier sustainability risks in a dynamically changing environment—Sustainable supplier management in the chemical industry. J. Purch. Supply Managet. 2010, 16, 118–130. [Google Scholar] [CrossRef]
  29. Large, R.O.; Thomsen, C. G. Drivers of green supply management performance: Evidence from Germany. J. Purch. Supply Manag. 2011, 17, 176–184. [Google Scholar] [CrossRef]
  30. Li, Y. Research on the performance measurement of green supply chain management in China. J. Sustain. Dev. 2011, 4, 101–107. [Google Scholar] [CrossRef]
  31. Hoejmose, S.; Brammer, S.; Millington, A. An empirical examination of the relationship between business strategy and socially responsible supply chain management. Int. J. Oper. Prod. Manag. 2013, 33, 589–621. [Google Scholar] [CrossRef]
  32. Hillary, R. Environmental management systems and the smaller enterprise. J. Clean. Prod. 2004, 12, 561–569. [Google Scholar] [CrossRef]
  33. Zeng, S.X.; Meng, X.H.; Yin, H.T.; Tam, C.M.; Sun, L. Impact of cleaner production on business performance. J. Clean. Prod. 2010, 18, 975–983. [Google Scholar] [CrossRef]
  34. Bowen, F.E.; Cousins, P.D.; Lamming, R.C.; Farukt, A.C. Horses for courses: Explaining the gap between the theory and practice of green supply. Greener Manag. Int. 2001, 35, 41–60. [Google Scholar] [CrossRef]
  35. Tseng, M.L.; Chiu, A.S.F. Evaluating firm’s green supply chain management in linguistic preferences. J. Clean. Prod. 2010, 40, 22–31. [Google Scholar] [CrossRef]
  36. Chen, Y.S. The driver of green innovation and green image—Green core competence. J. Bus. Ethics 2008, 81, 531–543. [Google Scholar] [CrossRef]
  37. Linton, J.D.; Klassen, R.; Jayaraman, V. Sustainable supply chains: an introduction. J. Oper. Manag. 2007, 25, 1075–1082. [Google Scholar] [CrossRef]
  38. Preuss, L.L. Green light for greener supply. Bus. Ethics Eur. Rev. 2002, 4, 308–317. [Google Scholar] [CrossRef]
  39. Seuring, S. Industrial ecology, life cycles, supply chains: Differences and interrelations. Bus. Strategy Environ. 2004, 13, 306–319. [Google Scholar] [CrossRef]
  40. Vachon, S. Green supply chain practices and the selection of environmental technologies. Int. J. Prod. Res. 2007, 45, 4357–4379. [Google Scholar] [CrossRef]
  41. Bagur-Femenias, L.; Llach, J.; Alonso-Almeida, M.M. Is the adoption of environmental practice a strategic decision for small service companies? An empirical approach. Manag. Decis. 2013, 51, 41–62. [Google Scholar] [CrossRef]
  42. Wong, C.W.Y.; Lai, K.-H.; Shang, K.-C.; Lu, C.-S.; Leung, T.K.P. Green operations and the moderating role of environmental management capability of suppliers on manufacturing firm performance. Int. J. Prod. Econ. 2012, 140, 283–294. [Google Scholar] [CrossRef]
  43. Lee, S.-Y.; Klassen, R.D. Drivers and enablers that foster environmental management capability in small-and medium-sized suppliers in supply chains. Prod. Oper. Manag. 2008, 17, 573–586. [Google Scholar] [CrossRef]
  44. Zhu, Q.; Sarkis, J.; Lai, K. Confirmation of a measurement model for green supply chain management practices implementation. Int. J. Prod. Econ. 2008, 111, 261–273. [Google Scholar] [CrossRef]
  45. Hair, J.F.; Anderson, R.E.; Tatham, R.L.; Black, W.C. Multivariate Data Analysis, 5th ed.; Prentice-Hall International, Inc.: Upper Seddle River, NJ, USA, 1998. [Google Scholar]
  46. Edwards, J.; Bagozzi, R. On the nature and direction of relationships between constructs and measures. Psychol. Methods 2000, 5, 155–174. [Google Scholar] [CrossRef] [PubMed]
  47. Diamantopoulos, A.; Siguaw, J.A. Formative versus reflective indicators in organizational measure development: A comparison and empirical illustration. Br. J. Manag. 2006, 17, 263–282. [Google Scholar] [CrossRef]
  48. Chin, W.W. How to Write Up and Report PLS Analyses. In Handbook of Partial Least Squares; Esposito Vinzi, V., Chin, W.W., Henseler, J., Wang, H., Eds.; Springer-Verlag: Heidelberg, Germany, 2010; pp. 655–690. [Google Scholar]
  49. Fornell, C.; Bookstein, F.L. Two structural equation models: Lisrel and PLS appliead to consumer exit-voice theory. J. Mark. Res. 1982, 19, 440–452. [Google Scholar] [CrossRef]
  50. Monevan, J.M.; Ortas, E. Corporate environmental and financial performance: A multivariate approach. Ind. Manag. Data Syst. 2010, 110, 193–210. [Google Scholar] [CrossRef]
  51. Akamp, M.; Müller, M. Supplier management in developing countries. J. Clean. Prod. 2013, 56, 54–62. [Google Scholar] [CrossRef]
  52. Ringle, C.M.; Wendle, S.; Will, S. Smart PLS 2.0.; University of Hamburg: Hamburg, Germany, 2005. [Google Scholar]
  53. Fornell, C.; Larcker, D.F. Evaluating structural equation models with unobservable variables and measurement error. J. Mark. Res. 1981, 18, 39–50. [Google Scholar] [CrossRef]
  54. Chin, W.W. The partial least squares approach to structural equation modeling. Mod. Bus. Res. 1998, 295, 295–336. [Google Scholar]
  55. Tenenhaus, M.; Amato, S.; Esposito Vinzi, V. A Global Goodness-of-Fit Index for PLS Structural Equation Modelling. 2004. Available online: http://www.old.sis-statistica.org/files/pdf/atti/RSBa2004p739-742.pdf (accessed on 4 January 2016).
  56. Green Home. 2008. Avaiable online: http://www.greenhome.com/business/green-food-service-supplies.html (accessed on 1 January 2016).
  57. Glazer, F. NPD: Consumers perceive industry to be behind on green efforts. Nation's Restaur. News 2008, 14, 50. [Google Scholar]
  58. Ilomaki, M.; Melanen, M. Waste minimisation in small and medium sized enterprises- do environmental management systems help? J. Clean. Prod. 2001, 9, 209–217. [Google Scholar] [CrossRef]
  59. Jacobs, B.W.; Singhal, V.R.; Subramanianet, R. An empirical investigation of environmental performance and the market value of the firm. J. Oper. Manag. 2010, 8, 430–441. [Google Scholar] [CrossRef]
  60. Susskind, A.M. I told you so! Restaurant customers’ word-of-mouth communication patterns. Cornell Hotel Restaur. Adm. Q. 2002, 43, 75–85. [Google Scholar] [CrossRef]
  61. Susskind, A.M. Guest service management and processes in restaurants: what we have learned in fifty years. Cornell Hosp. Q. 2010, 51, 479–482. [Google Scholar] [CrossRef]
  62. Longart, P. What drives word-of-mouth in restaurants? Int. J. Cont. Hosp. Manag. 2010, 22, 121–128. [Google Scholar] [CrossRef]
  63. Hyun, S.S.; Kim, W. Dimensions of brand equity in the chain restaurant industry. Cornell Hosp. Q. 2011, 52, 429–437. [Google Scholar] [CrossRef]
  64. Alonso-Almeida, M.M.; Bremser, K. Strategic responses of the Spanish hospitality sector to the financial crisis. Int. J. Hosp. Manag. 2013, 32, 141–148. [Google Scholar] [CrossRef]
  65. Hu, H.; Parsa, H.G.; Self, J. The dynamics of green restaurant patronage. Cornell Hosp. Q. 2010, 51, 344–362. [Google Scholar] [CrossRef]
  66. Jang, Y.J.; Kimb, W.G.; Bonn, M.A. Generation Y consumers’ selection attributes and behavioral intentions concerning green restaurants. Int. J. Hosp. Manag. 2011, 30, 803–811. [Google Scholar] [CrossRef]

