Article

Performance Comparison of Reservation Based and Instant Access One-Way Car Sharing Service through Discrete Event Simulation

1
Department of Industrial & Systems Engineering, Dongguk University-Seoul, Seoul 100715, Korea
2
Nano Information Technology Academy, Dongguk University-Seoul, Seoul 100715, Korea
*
Author to whom correspondence should be addressed.
Sustainability 2015, 7(9), 12465-12489; https://doi.org/10.3390/su70912465
Submission received: 27 July 2015 / Revised: 27 August 2015 / Accepted: 6 September 2015 / Published: 11 September 2015
(This article belongs to the Special Issue Carbon reduction strategies and methods in transportation)

Abstract

:
A car sharing service has been highlighted as a new urban transport alternative for an environmentally friendly economy. As the demand for the service from customers increases, car sharing operators need to introduce a new service such as a one-way option that will allow customers to return the car to different stations. Due to the complexity of the one-way system, it needs to be managed and optimized for real cases. This paper focuses on developing a simulation model in order to help operators evaluate the performance of the one-way service. In addition, this research demonstrates a strategy for an open one-way service that can increase revenue and customer satisfaction. A real case dataset is used for investigation to find the best result from the simulation. The result showed that the total number of cars, number of one-way reservations and station size have an impact on one-way performance. Thus, company profit and customer satisfaction can be maximized by optimizing these factors.

1. Introduction

As the world population increases, private vehicles are becoming more attractive as they provide more flexibility for people. However, this has had a negative impact due to pollution and excessive energy consumption as well as increased time consumption due to congestion problems. Moreover, land prices and vehicle ownership costs such as fuel, parking, and the cost of purchasing and insuring a vehicle itself are increasing. While public transport could be a good alternative, it has several limitations such as lack of service flexibility. One strategy to solve the aforementioned problem is to provide car sharing services, an alternative type of transportation between private and public transport. Car sharing is a transportation strategy that can reduce personal transportation usage and its negative impacts.
From the perspectives of parking location, car sharing services can be divided into free-floating and station-based types. The free-floating type allows vehicles to be picked up and left anywhere within a designated operating area, while station-based type requires users to return vehicles to the next available station [1]. In North America, the station-based car sharing has resulted in the reduction of emissions, because of the fewer number of cars on the roads, and a 27 percent reduction in the average distance of observed vehicle travel per year [2]. Importantly, a worldwide increase occurred in the number of car sharing memberships, total number of vehicles, and member-vehicle ratios from 2006 to 2010. As car sharing services increasingly become a mainstream transportation mode, it is expected to be further integrated into metropolitan transportation, land use strategies, and multimodal nodes [3]. In addition, the research has reported that free-floating car sharing services have similar results compared to traditional car-sharing systems based on fixed stations which also reduce car ownership in cities [4].
It is important to distinguish between one-way and round-trip systems in terms of trip configuration. To date, car sharing systems enable a car to be driven between multiple stations (one-way service), whereas the traditional service (round-trip/two-way) means the users must return the car to the same station. A study carried out in U.S., Canada, Mexico, and Brazil showed that almost 70% of round-trip operators viewed one-way car sharing as a complement to round-trip car sharing [1]. However, one-way car sharing systems present an operational problem of imbalances in vehicle inventories across the network of stations due to the dissimilarity of trip demand between stations [5]. Despite this, considerable effort has been made to provide these flexible systems to users in recent years. Previous research has proposed several approaches to solve this problem: user-based relocation, i.e., pricing incentive policies for the users to relocate the vehicles themselves [6]; operator-based relocation, i.e., replenishing vehicle stocks where customers need more vehicles [7,8]; and station location selection to achieve a more favorable distribution of vehicles [9].
In addition, the reservation configuration can be divided into two types: reservation based and instant access car sharing systems. The reservation based system requires customers to make advanced reservations [10], while the instant access system does not require a reservation [11] and the users can simply arrive at the departure station and have instant access to a car. The combination of the round trip and one-way car sharing systems will generate a variety of service models that can be implemented in a real business. Furthermore, another critical factor that influences the car sharing service is the differences in user behavior [12,13,14]. The result of a study showed that customers require a variety of transactions and distance configurations. Thus, the evaluation of an alternative service with respect to the various types of customer transactions is important before it can be implemented as a practical business model [14].
In previous research on the one-way system of car sharing [6,7,8,9], the focus was mostly on devising a relocation algorithm to satisfy the vehicle demand from customers and an optimization model to optimize the determined values, i.e., to locate one-way car sharing stations to maximize the car sharing company’s profit. However, research to evaluate the performance of the one-way service operation from the view point of reservation configuration has not been performed. Thus, this study proposes a simulation that can represent the service operation of car sharing to evaluate the reservation based and instant access one-way systems with regard to different patterns of user behavior. The simulation will show how user behavior of service preference can affect the system. The simulation results can be a benchmark for management to optimize the one-way service, the number of car operations, and the size of the station in order to increase utilization rate and customer satisfaction.

2. Literature Review

2.1. Car Sharing

Car sharing services represent an intermediate strategy between public transit and private vehicle ownership to reduce the number of cars, traffic problems, and air pollution, saving service costs and solving parking space problems. The research showed the design of a new car-sharing service model is applicable to South Korea because such a service will facilitate sustainability by reducing traffic problems and air pollution [15]. Other research showed that car sharing strengthens public transportation services, as revealed by its members who tend to reside in medium-to high-density areas and use public transportation frequently. It also reported that car sharing membership means individuals are more likely to increase public transit use, reduce auto ownership, and reduce the vehicle miles they travel [16]. Furthermore, compared with other transportation modes, car sharing can be seen as the best option in terms of flexibility for intermediate length trips, while for longer trips, rental cars are usually less expensive, and for short distances, taxis tend to be more cost effective. Three differences that most distinguish the car sharing service from the traditional car rental service include short-term rentals, a decentralized self-accessing network of vehicles, and the bundling of gasoline and insurance rates [17].
One-way systems allow users to rent a vehicle at one of the system’s stations scattered around the city, use it for a short time period, and return it to any of the system’s stations. A station is a group of parking spaces where the vehicles are parked while not in use. Two one-way models are possible: Free-floating and station based. Free-floating car sharing allows vehicles to be picked up and left anywhere within a designated operating area, thus it gives the flexibility to the customer, while station-based car sharing requires users to return vehicles to the next available station [1]. The research on the environmental effects of a free-floating car-sharing system in Germany called car2go that allows users to take and leave vehicles at any point within the city limits has been done. The impact forecasted per user is similarly compared to traditional car-sharing systems based on fixed stations. Therefore, free-floating fleets could reduce car ownership in cities [4]. Furthermore, in order to improve the traditional service which requires users to define a starting time and ending time for reservation, previous research has proposed open-ended car-sharing, giving flexibility to users without defining the ending time for reservation and rendering the car-sharing service as convenient as car ownership [18].
In this paper, we focus on station-based one-way vehicle sharing systems. The implementation of a one-way service can be seen as complementary to the round trip service, to increase the customer trip flexibility. In October of 2013, the authors conducted a survey of 26 round-trip and five one-way car sharing operators in countries within America (USA, Canada, Mexico, and Brazil) to understand their perspectives on one-way car sharing and its future. Almost 70% of round-trip operators viewed one-way car sharing as a complement to round-trip car sharing [1].
The types of reservation configurations can be divided into reservation based and instant access. Various reservation mechanisms are used in car sharing, ranging from a manual system in which users call a reservation center to automated systems that can be accessed via the phone or Internet [10]. Reservations provide a control over the flow of demand and allow a better forecast of the system’s future state. Current services allow customer flexibility such as open-ended bookings (i.e., no fixed reservations) and instant access (i.e., no reservations). Instant access is available in the Personal Intelligent Accessible Vehicles (PICAV) transport system, which is a second generation car sharing system, intended to provide users a high level of flexibility, similar to a private car. One-way trips, open ended reservation, and instant access are the main characteristics of the proposed transport system. These three features provide users a high level of flexibility [11]. However, the services have several difficulties in terms of implementation because the customers are not able to choose when, and at which station, they will return the car. This will render a reservation uncertain, jeopardizing the next reservation at the same time.

2.2. Simulation

Simulation is typically used to identify the behavior of a system when a set of business constraints changes. On the one hand, the optimization is typically used when the goal is to find the best solution given a set of specific business objectives or constraints where the decision to be made is a set of variables of which the values are to be determined. In this paper, for evaluating a car sharing service operation that has high complexity and involves a stochastic process such as that for unpredictable customer trips, it is more realistic to implement the simulation model. In this part, the simulation can be used to generate how the customer trip impacts the movement of the vehicle each hour, thus achieving company profit. On the other hand, the use of optimization, even though it guarantees an optimal solution, is complicated to implement for service evaluation in car sharing. It is difficult to determine the input data, i.e., the customer trip and vehicle availability of each station during operation is unpredictable. In car sharing, optimization is usually used to determine a set of variables such as to locate one-way car sharing stations to maximize the profit of a car sharing company [9]. In the current study, the input data such as a car sharing trip matrix, a set of candidate sites for locating stations, driving travel times, and costs of operating the system are determined from the survey in advance.
In car sharing system services, the customers are usually able to make reservations by calling customer services, or use the web based reservation system. Once the reservation is made, the customer can arrive at the station and start using the car. After some time, the customer completes his/her travel and returns the car to the destination station. In this scenario, certain events (calling, starting, and ending) that change the situation of the system need to be considered. The system clock for a discrete model is determined from event to event and the system state is unchanged between events, changing only at event times. Thus, the discrete-event simulation is more suitable for implementation in this study rather than continuous simulation which uses a continuously advancing time clock.
Over the last few years, research in the area of car sharing vehicle relocation focused on operator-based vehicle movements. Previous research designed a simulation model in order to evaluate the overall system performance of a multiple station shared vehicle system allowing one-way rides [5]. Other research developed an optimization approach for determining the best number, location, and size of depots in one-way station-based car sharing systems [9]. In addition, a simulation method is used to test the operator based relocation techniques such as shortest time and inventory balancing [7,8]. In particular, a forecasting model has been implemented to evaluate the effects of relocation techniques [19]. In addition, the simulation approach is very relevant to validate the performance of all designs for a car sharing service and help managers prioritize the best service model before implementing it in a realistic situation [20]. A simulation also demonstrated that in order to optimize car operation, the operators need to consider other parameters such as customer reservation, acceptance ratio, and utilization ratio [21].
Compared to operator-based relocation algorithms, approaches that shift the task of relocation to the user are relatively rare. A user-based methodology was proposed by offering greater flexibility to users [6]. The Discrete Event Simulation (DES) model was applied to a case study to evaluate the proposed approach. The results showed a significant decrease in the rejection rate from the worst scenario (no relocation) to the best scenario (relocation of all vehicles by their users). Other research suggested a simulation-based method for optimal vehicle assignment for station-based one-way car sharing systems. The proposed user-based strategies are trip splitting (divided assignment) and trip joining (combined assignment) [22].

3. Methodology

3.1. Simulation for Car Sharing

In this paper, a simulation model is presented to evaluate a station based one-way service, which allows customers to use a car and return it to a different station. In addition, the result of simulation can be used to analyze the impact of a one-way service and the size of the station. A comparison is presented in this report based on the acceptance ratio, utilization ratio, average number of parked cars, and maximum number of parked cars for a one-way car sharing service. The simulation is run for every possible combination such as number of cars, number of reservations, and different distribution of one-way reservation.
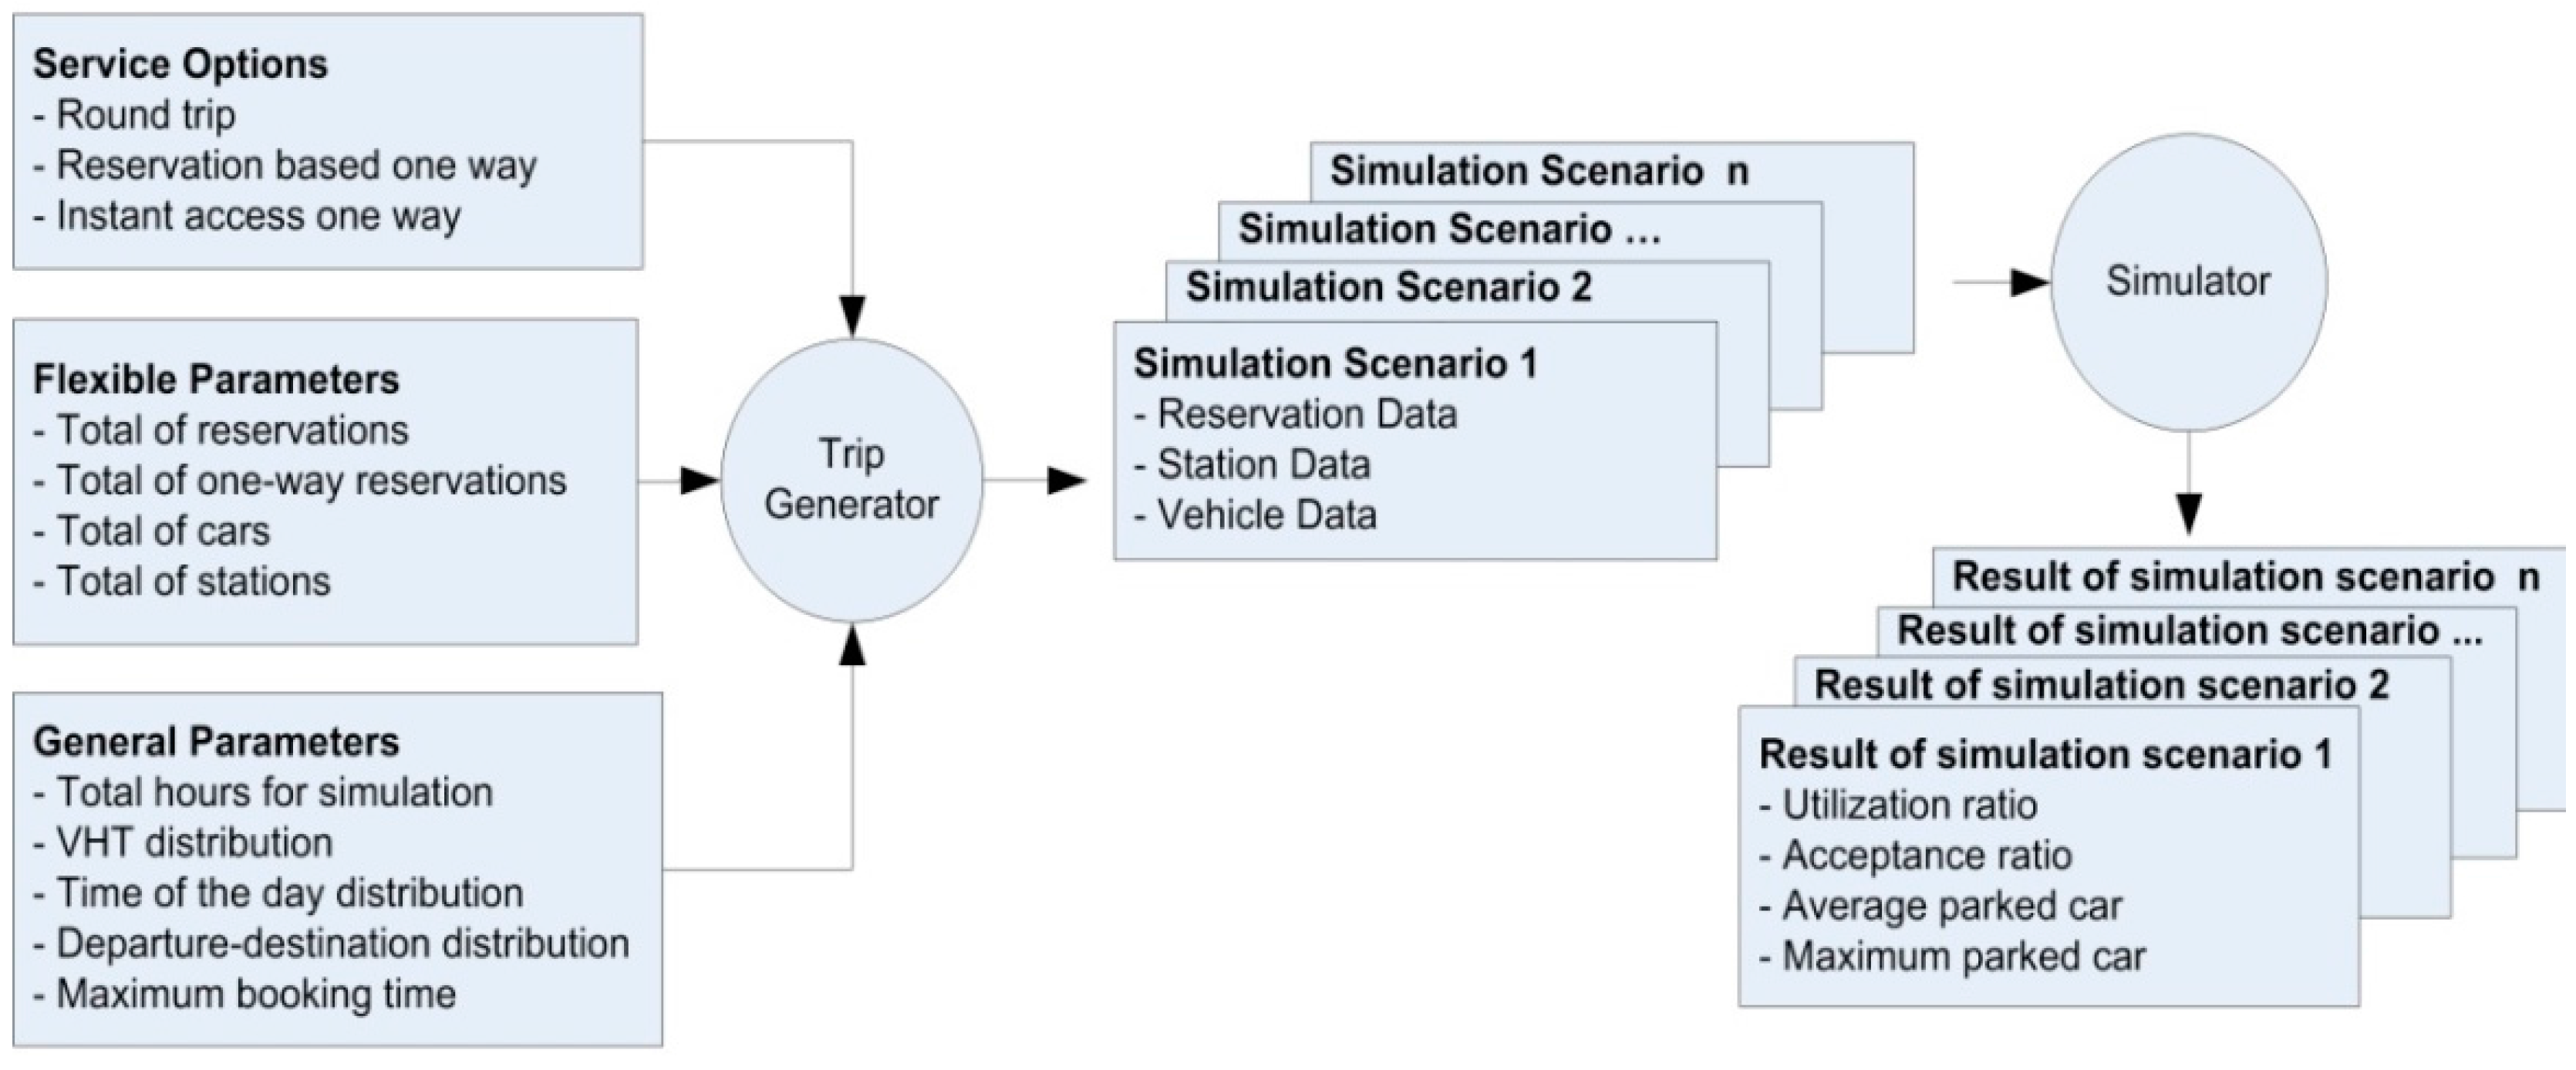
As shown in Figure 1, a three-step process is used in this study. First, the simulation scenarios which contain the artificial data (reservation, station, vehicle data) are generated using the trip generator based on customer travel demand, number of vehicles, number of stations, number of reservation and service options. Different combinations of this input (parameters) will generate different simulation scenarios. Thus, the simulation result of each scenario can be presented as a result in the third step.
Figure 1. Architecture of System.
Sustainability 07 12465 g001
Second, the simulation tool evaluates the round trip and one-way service for every simulation scenario, i.e., combination of the number of cars, number of stations, number of reservations, and different proportions of one-way reservations. For each scenario of simulation, the data (which was previously generated) are updated, once the simulation process is complete. The reservation data contains the customer trip plan, giving the starting time, ending time, departure station, destination station, and the status of the reservation in terms of whether it is accepted or rejected. The station data contains information about the number of available vehicles in each station for each hour during the simulation process. In addition, the vehicle data contains information about the vehicle status in terms of whether it is parked or on the road during the simulation process. The simulation checks the customer reservation in reservation data; thus, some values on reservation data, station data and vehicle data are changed during the simulation process.
Finally, the simulation results are presented and analyzed to define the efficiency of the service operation in car sharing. The result of each scenario is presented with output parameter, such as utilization ratio, acceptance ratio, average number of parked cars, and maximum number of parked cars in each station. In this section, a comparison of service performance on different input values is presented. The results can be used by car sharing companies to predict their future policy on implementing a new business service (one-way), given their current input parameters such as number of customers, number of operational cars, and number of stations.
In this report, the discrete event simulation is implemented, in which a list of events is generated from the customer reservation as shown in Table 1.
Table 1. List of events generated from customer reservation.
One-way ServiceEventDescription
Reservation basedInstant access
callingThe time when the customer makes reservation.
assignThe time when the system has to assign the free (parked) car to the particular reservation.
startingThe time when the customer starts the travel.
endingThe time when the customer ends the travel
As can be seen from Table 1, two event generations are possible that are based on the service model which is run in the simulation. The reservation based one-way generates all four events while the instant access one-way only generates the starting and ending time. This is because in instant access one-way, a reservation via phone/internet is not required, as customers directly visit the departure station at the starting time to pick up the car and return it to the destination station at the ending time. In this study, a simulation is presented to evaluate the round trip and one-way service. In the round trip service, the setting of the destination station of the trip is the same as the departure station, while in the one-way service the destination station differs from the departure station. In addition, this study considers the percentage of one-way reservations as simulation input. In the real car sharing business, if the company only operates a round trip service, the distribution of cars at each station will be fixed at the end of the day. On the other hand, if a company operates a one-way service, it also allows customers to use the round trip service since the roundtrip service is a standard service for car sharing businesses. For example, in the case where 70% of customers in a company will rent the car for a one-way trip, the simulation will run for both a round trip service and a one-way service with different proportions of the reservation. However, allowing the one-way service without relocation implementation will create an unbalanced car distribution at the stations.

3.2. Data Collection and Simulation Input

The best way to investigate the impact of car sharing in detail is to collect a targeted sample data. Therefore, this paper presents the results of investigation of car sharing user behaviors through an examination of the dataset from a car sharing service in Korea. The simulation input follows the time of day travel pattern, which reveals the customer reservations distribution of morning, afternoon, and evening is 10%, 20%, and 70%, respectively. In addition, the Korean dataset showed the distribution of Vehicle Hours Travel (VHT) and revealed that the average customer VHT is 2–3 hours, while the majority of trips made by customers are short-distance trips of less than 100 km and the average is 20–30 km. The VHT follows normal distribution with its average and standard deviations being 2.6 and 1.26, respectively. In terms of the day of the week, the percentage of trips is lowest at the beginning of the week and increases as the week progresses. The detailed explanations about the Korean car sharing dataset are described elsewhere and are not repeated here [21]. In this section, a survey study on different car sharing businesses was performed. A similarity is observed in the distribution of trips between a Toronto case study [14] and our dataset regarding trip length distribution. In the Toronto case study, more than 60 percent of trips were less than 40 km long, and similarly, in our dataset, trip length was mostly 10–40 km. This information is very important for generating an artificial dataset in this study. Due to the limitation of the dataset, in this paper the distribution of departure-destination station follows uniform distribution, which means that when the trip generator generates the reservation data, the information of departure-destination will be assigned randomly. In addition, the reservation is made by a customer with a maximum of 3 hours before the starting time in order to minimize the booking time; thus, the other customers will have a higher chance of gaining accepted reservations.
The trip generator generates three matrix based data sets for input of simulation such as Reservation data, Vehicle Data, and Station Data. This generation and simulation process requires high memory consumption, thus implementation in C++ for both the trip generator and simulator helps to reduce the time computation. The Reservation matrix is defined as R ×  n , where m is the number of reservations and n is the number of hours. If the simulation is run for one week, then the maximum n is 168. This discrete event simulation will check the event from the1st column until the nth column and perform the task based on the event. The rows represent all of the reservations made by all customers, which combines round trip and one-way reservations. The details can be seen in Table 2.
Table 2. The matrix of reservation data.
R m , n 1234..n
1calling,0,63,92,4,7,00,0,0,0,0,0,0assign,0,63,92,4,7,0starting,0,63,92,4,7,0...0,0,0,0,0,0,0
20,0,0,0,0,0,00,0,0,0,0,0,0calling,0,23,45,6,8,0assign,0,23,45,6,8,0...0,0,0,0,0,0,0
3calling,0,87,55,3,6,0assign,0,87,55,3,6,0starting,0,87,55,3,6,00,0,0,0,0,0,0...0,0,0,0,0,0,0
.................
m0,0,0,0,0,0,00,0,0,0,0,0,00,0,0,0,0,0,0calling,0,56,4,8,9,0...0,0,0,0,0,0,0
The reservation matrix in Table 2 shows R 1 , 1 = calling, 0, 63, 92, 4, 7, 0. These values represent the event status, decision, departure station, destination station, starting time, ending time, and vehicle id, respectively. The status of event is ‘calling’, which reveals the time when the customer makes the reservation (requests a car) to the system, while the decision is information on whether or not the reservation will be accepted by the system. The default of decision at the initial state before simulation process is 0, while the value of 1 shows that the reservation is accepted after being evaluated by the simulator. This example shows that the customer requests a reservation at the 1st hour of the total simulation hours, starts the car from the 4th hour at station 63, and returns it at the 7th hour to station 92. This value only appears at the time when the customer makes a reservation, the time when the system assigns a car, the starting time, and the ending time, and the remainder of the time will be assigned with the value 0, as no event has occurred. Next, the values of decision in reservation data are updated when the simulation is run since some of the reservations are accepted or others are rejected.
In addition, for the case of instant access one-way, the event only consists of a starting and ending time, due to no reservation being required for instant access one-way.
In addition, the matrix of the station is also generated and represented as S m x n , where m is the number of stations and n is the number of hours for the simulation. For the case in which a company owns 100 stations, the total number of rows of a station matrix will be 100 rows. The detail of the station matrix can be seen in Table 3.
Table 3. The matrix of station data.
S m , n 1234..n
11,10,0,0,5,51,10,0,0,5,51,10,0,0,5,51,10,0,0,5,5..1,10,0,0,5,5
22,10,0,0,5,52,10,0,0,5,52,10,0,0,5,52,10,0,0,5,5..2,10,0,0,5,5
33,10,0,0,5,53,10,0,0,5,53,10,0,0,5,53,10,0,0,5,5..3,10,0,0,5,5
..............
mm,10,0,0,5,5m,10,0,0,5,5m,10,0,0,5,5m,10,0,0,5,5..m,10,0,0,5,5
As can be seen from Table 3, the station matrix for S 1 , 1 = 1, 10, 0, 0, 5, 5. This value represents station id, total number of lots, VIN, VOUT, VPRESENT and AV_SPACE, respectively. The total lot/space in the station is the maximum number of lots/cars possible within a particular station. The VIN is the total number of cars scheduled to return to the particular station while VOUT is the number of vehicles that are not available for use because they have been reserved (scheduled to be out) from a particular station. VPRESENT is the actual number of parked vehicles at particular stations, while AV_SPACE is the available space (empty lots) at particular stations during the time simulation. In this example, station 1 has a maximum of 10 lots where no vehicle is scheduled to be IN and OUT, the total number of parked cars is 5, and the available parking space is 5. Table 3 shows that the total lots, VIN, VOUT, VPRESENT, and AV_SPACE in each station are the same at the initial time before a simulation is run.
Furthermore, the vehicle matrix is also generated and represented as V m x n , where m is the number of vehicles and n is the number of hours for simulation. For the case in which the company own 500 cars, the total rows of the vehicle matrix will be 500 rows. The detail of the station matrix can be seen in Table 4.
Table 4. The matrix of vehicle data.
V m , n 1234..n
11,parked,11,parked,11,parked,11,parked,1 1,parked,1
22,parked,12,parked,12,parked,12,parked,1 2,parked,1
33,parked,13,parked,13,parked,13,parked,1 3,parked,1
................
mm,parked,100m,parked,100m,parked,100m,parked,100 m,parked,100
As can be seen from Table 4, the vehicle matrix of V 1 , 1 = 1, parked, 1. This value represents the vehicle id, vehicle status, and the current location (station) of vehicle, respectively. Vehicle status consists of three choices, whether it is parked, booked, or on road. The parked value indicates that the car is unoccupied and parked at the station, booked shows that the customer already booked the car at a particular time, while on road indicates the status of the car when the car is driven by the customer. The current location of the vehicle is information about the station where the car is located at the current time. The matrix data from the reservation, vehicle, and stations are related to each other and some of the values in reservation, vehicle and station matrix are updated when the simulation is run since the values will change as the customers continue to make reservations and drive the cars to other stations.

3.3. Output Variable for Simulation

Four outputs (car utilization ratio, reservation acceptance ratio, average number of parked cars, and maximum number of parked cars) are defined in the simulation to evaluate the performance of the one-way service, as can be seen in Table 5.
Table 5. Output variables for simulation.
Output VariableEquation
Utilization Ratio v e h i c l e h o u r s o f c a r s   u s e d a v a i l a b l e v e h i c l e h o u r s o f e n t i r e f l e e t
Acceptance ratio c o m p l e t e r e s e r v a t i o n s t o t a l r e s e r v a t i o n s
Average of parked car s u m   o f   p a r k e d   v e h i c l e s   f r o m   a l l   s t a t i o n s a v a i l a b l e   s t a t i o n s
Maximum of parked car max ( p a r k e d   v e h i c l e s   f r o m   a l l   s t a t i o n s )
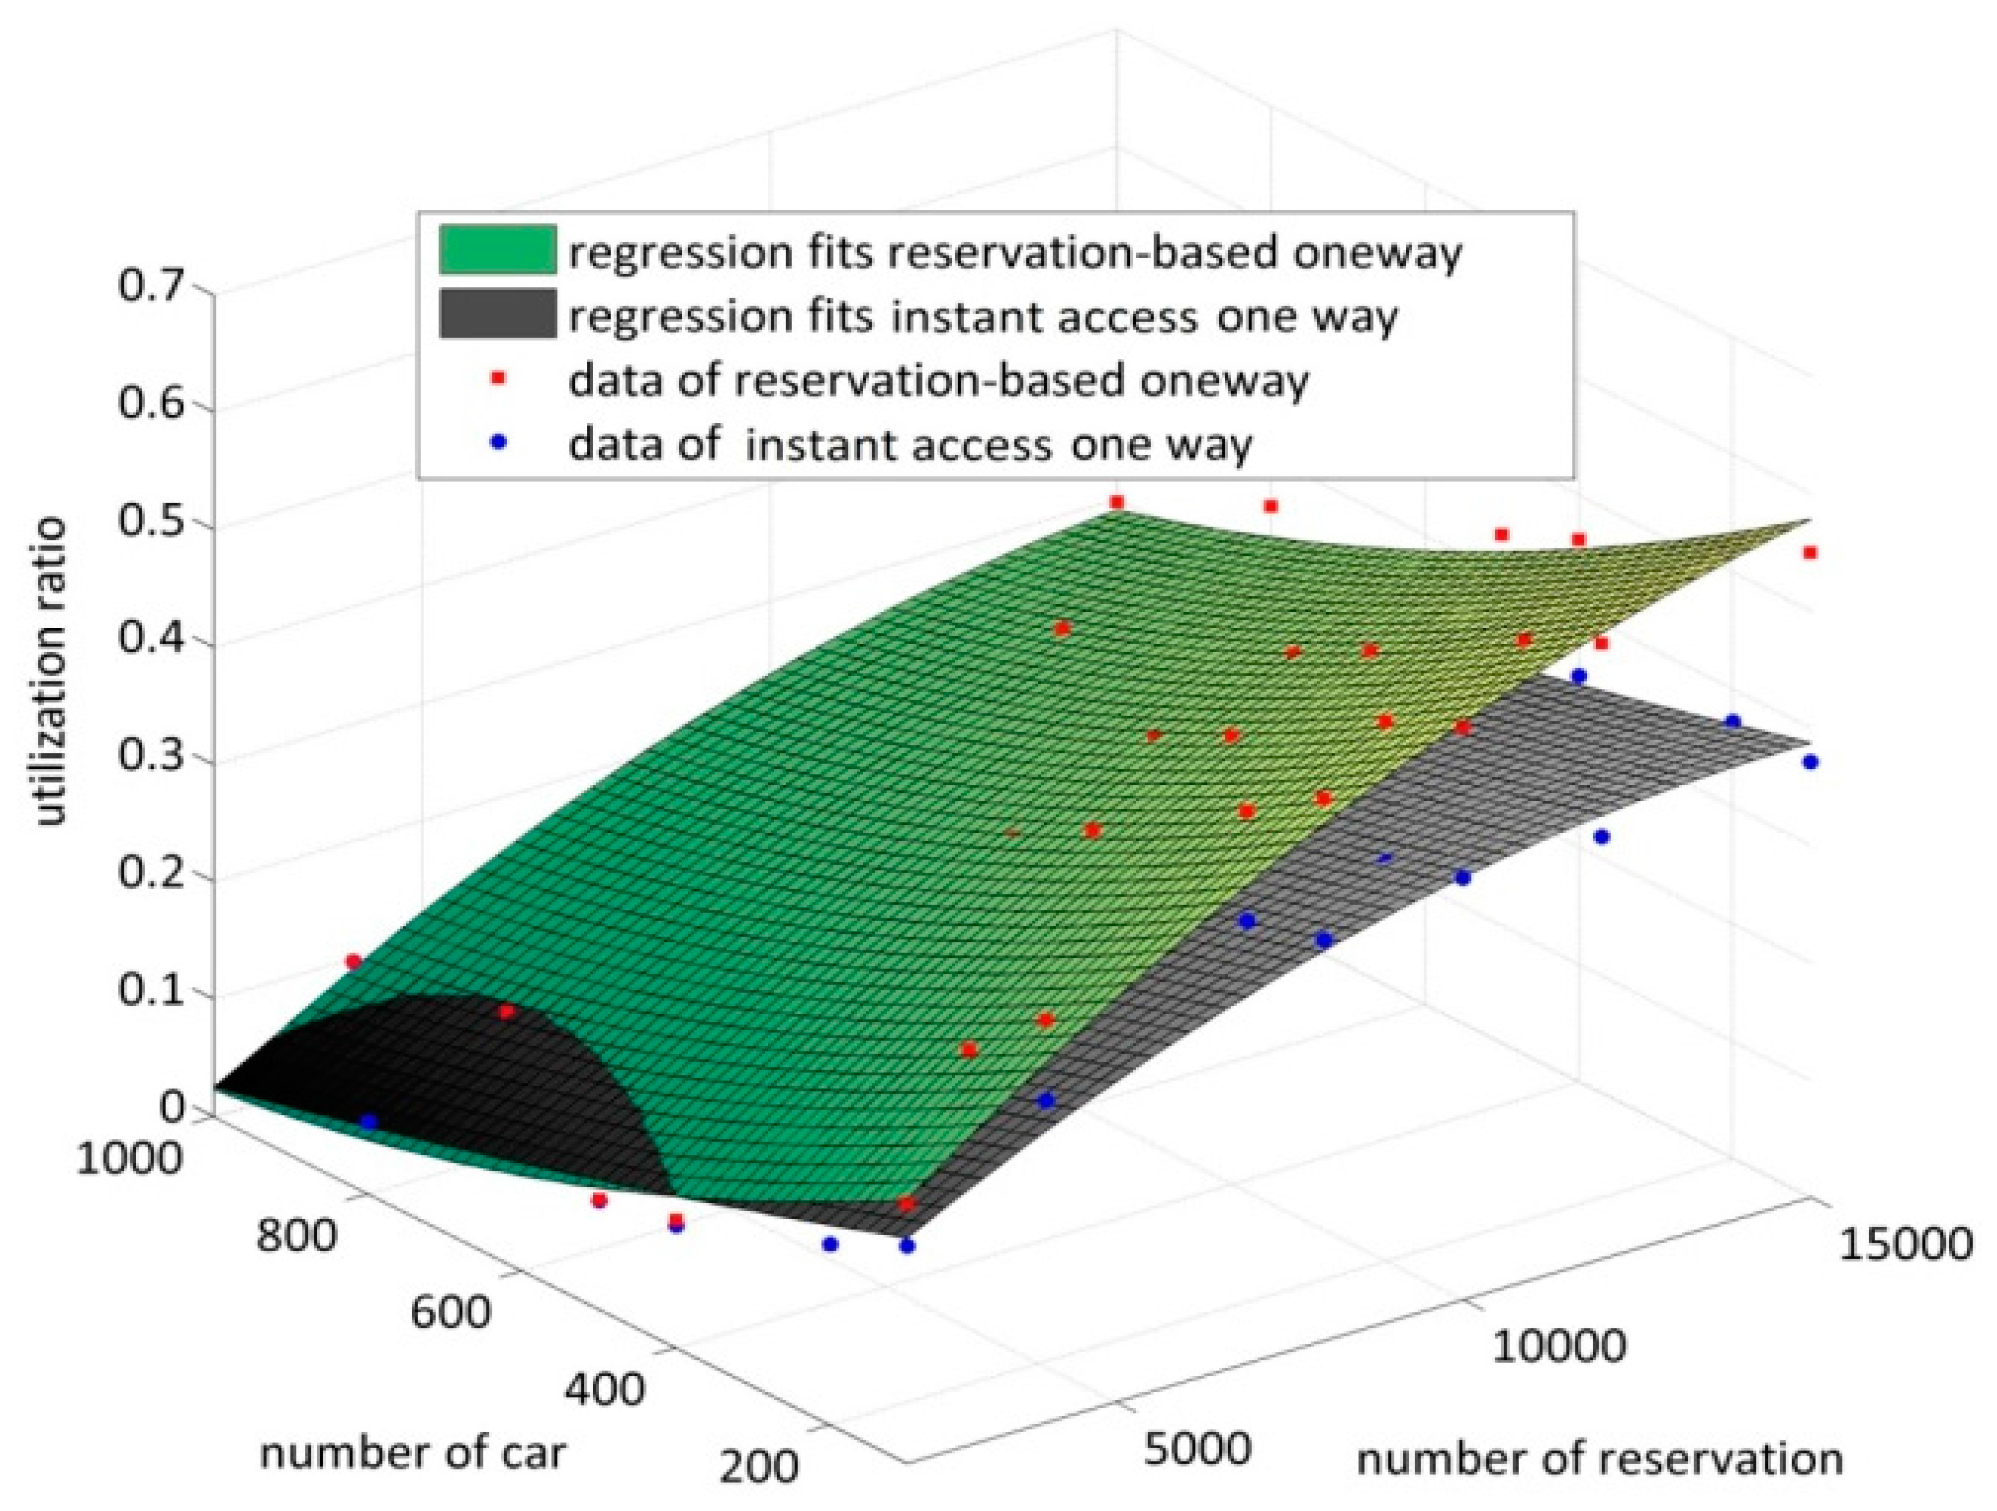
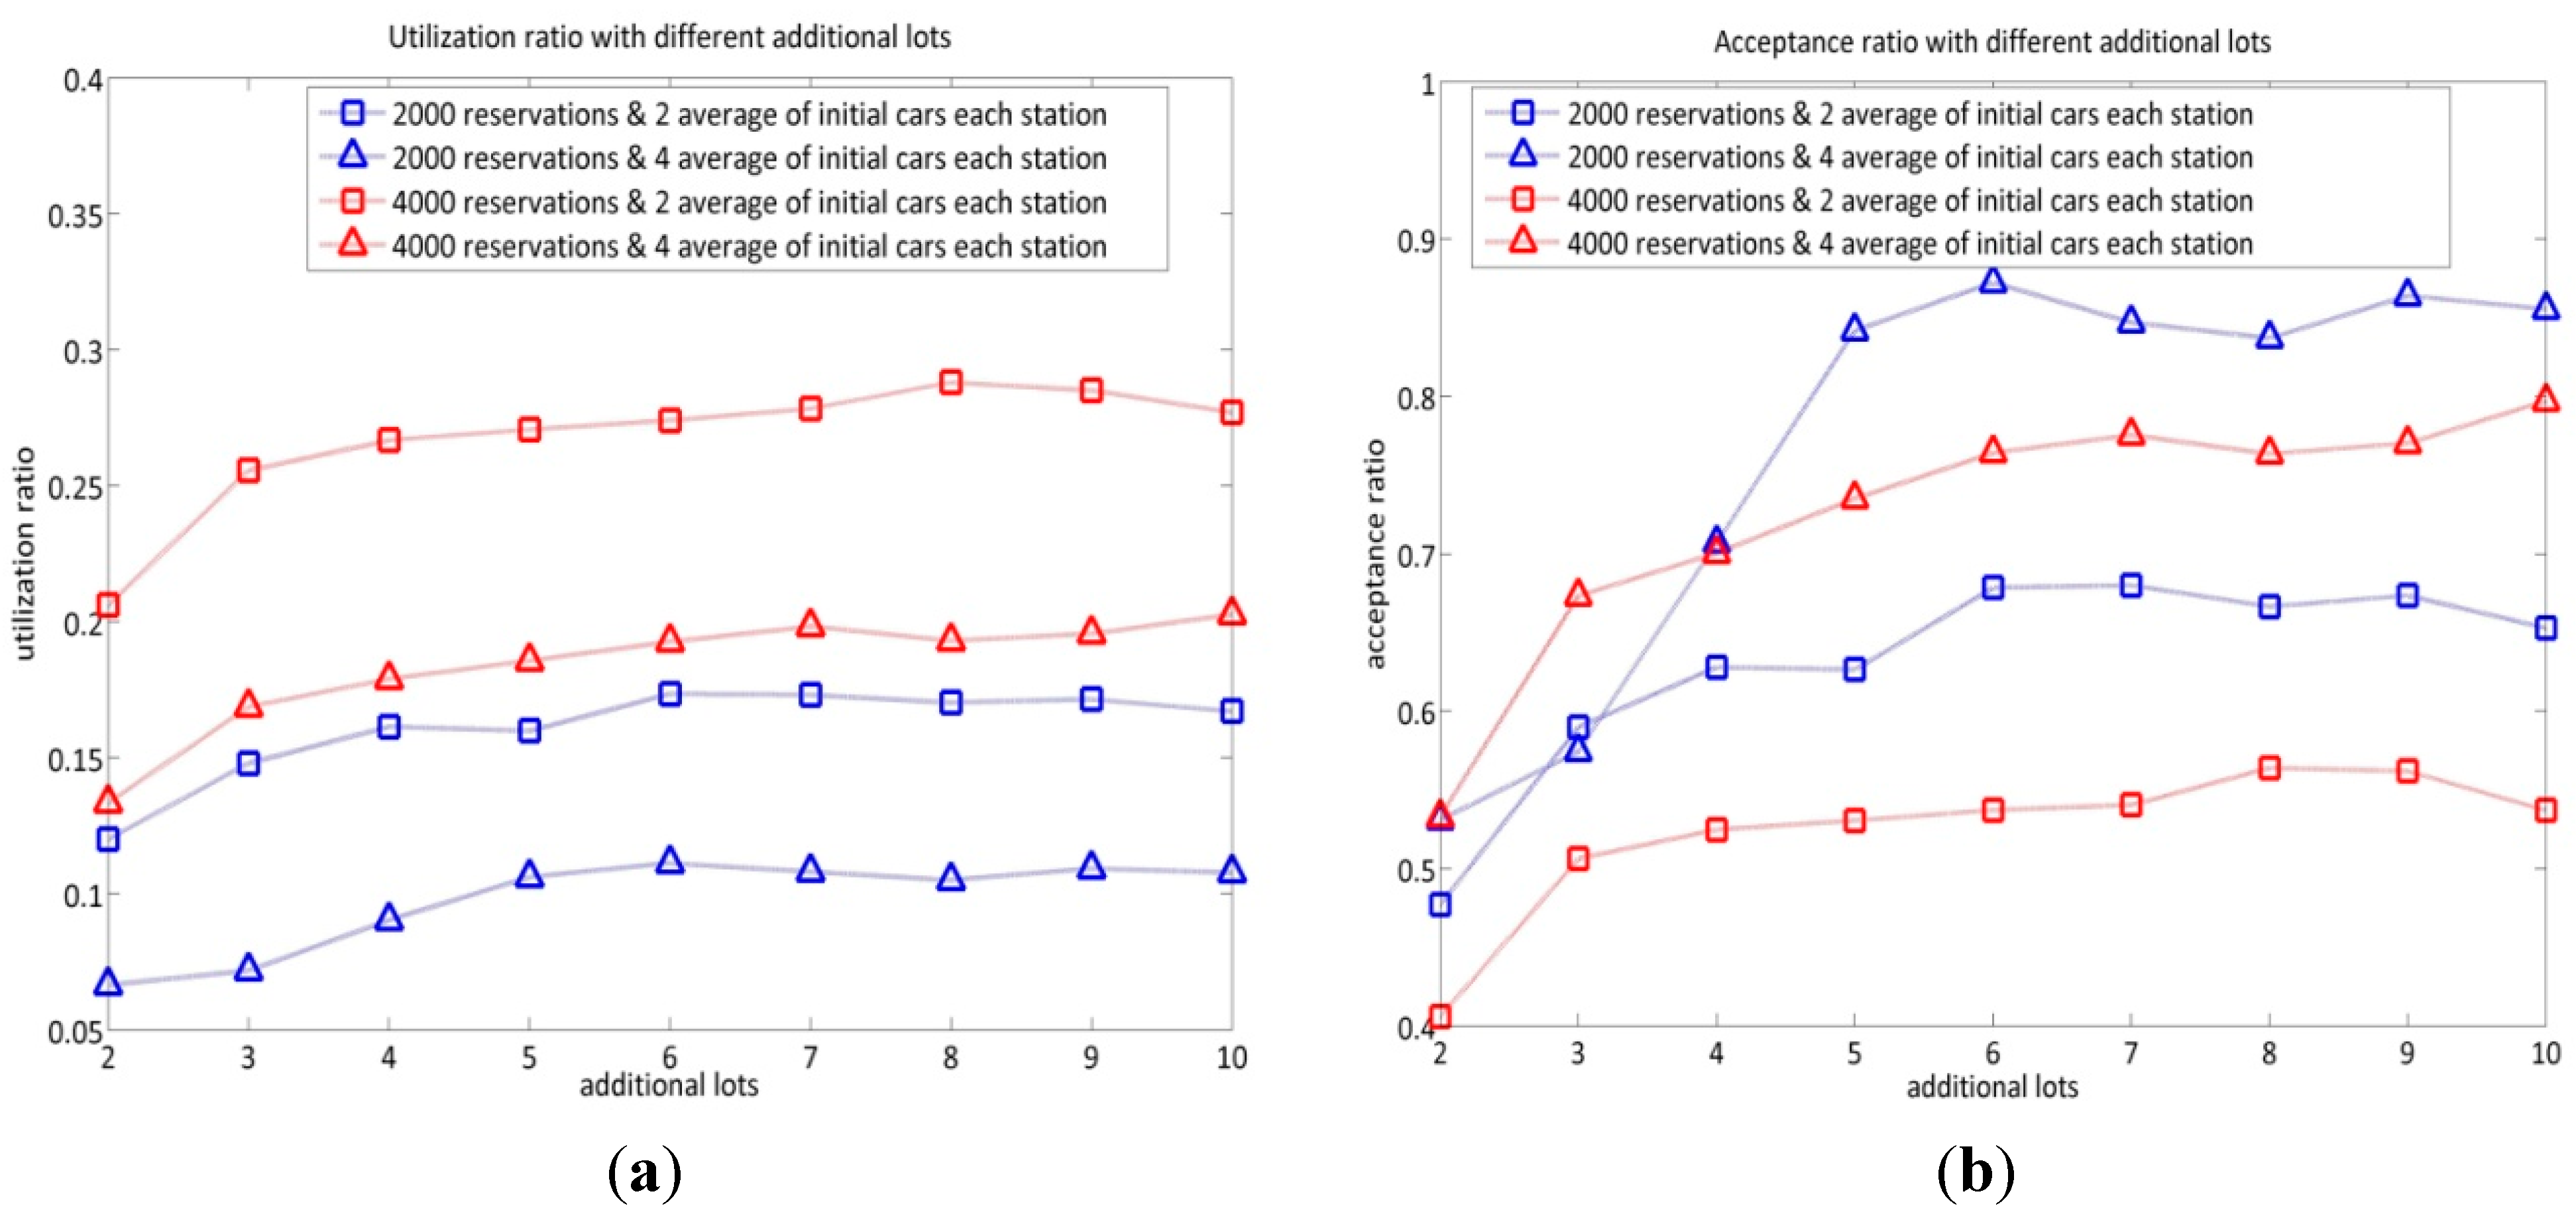
The car utilization ratio is the percentage of total actual driving hours of rented cars divided by the total possible driving hours of cars. The value of utilization ranges between 0 and 1, where the value of 0 means the cars are not rented by a customer, while the value of 1 shows that all of the cars are being driven by customers during the simulation time. Since a car sharing company normally wants to optimize the number of operational cars, the company needs to ensure that all cars can be rented (fully operated) to increase the profit and reduce the operational car cost.
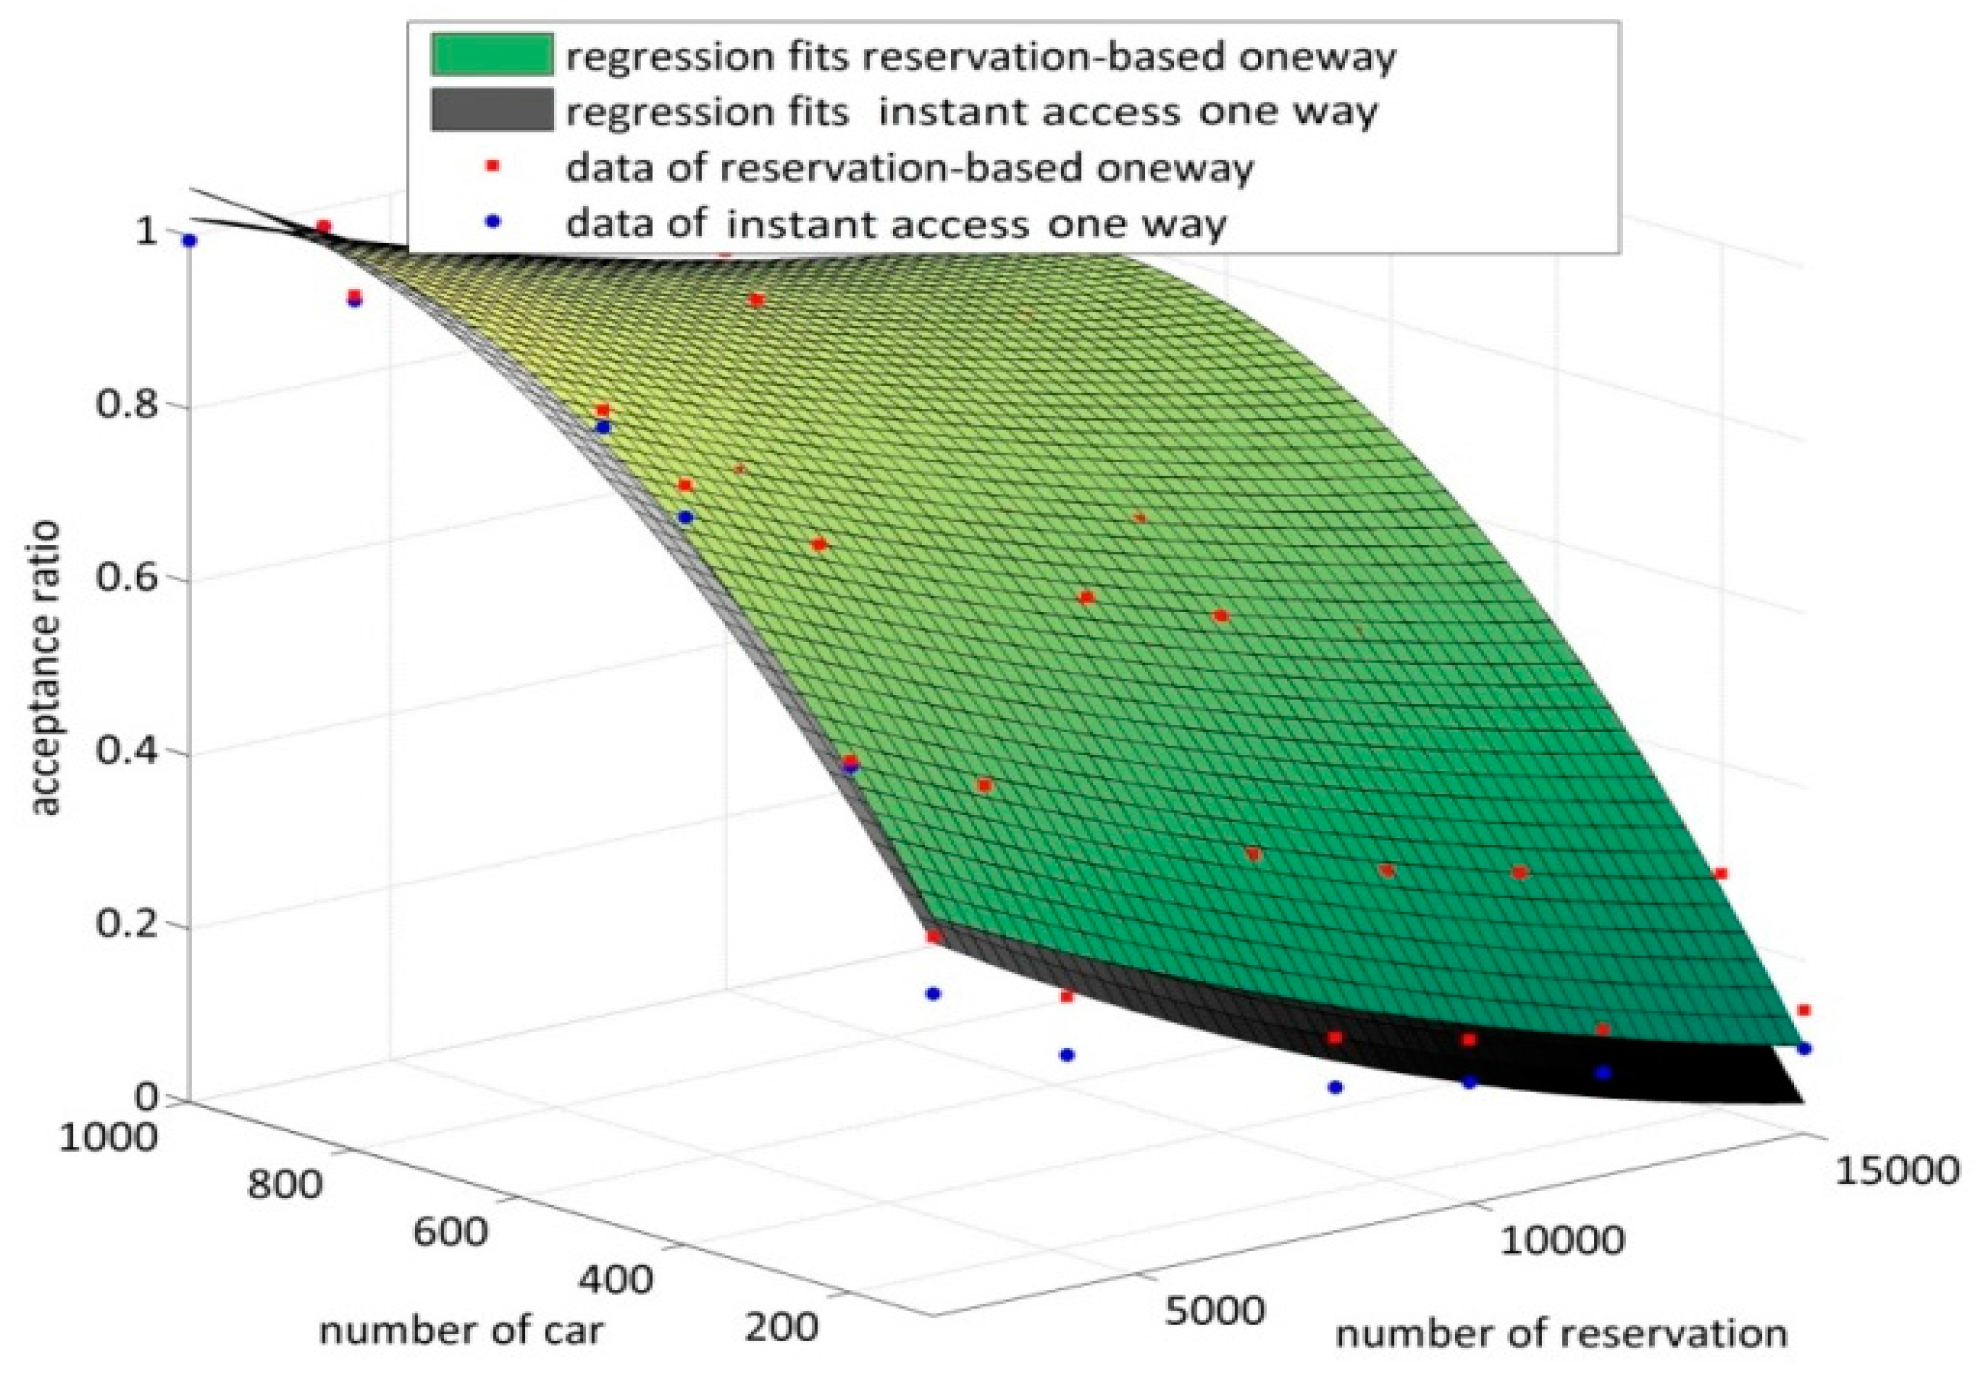
The acceptance ratio provides information on the number of reservations that have been accepted compared to the total number of requested reservations. An accepted reservation means that when a customer makes a reservation, the car sharing reservation system will check whether or not the customer can acquire an available car at the destination station. The value of the acceptance ratio is on a scale of between 0 and 1, where the value 0 implies no accepted reservation while the value 1 shows all reservations made by customers to the system are accepted. In this study, all reservations are assumed to be made by customers in a problem-free scenario, such as when a customer parks the car at the destination he/she decided upon earlier in the reservation or there is no cancelation for the earlier reservation. This reservation acceptance ratio can provide the ideal situation to reveal customer satisfaction.
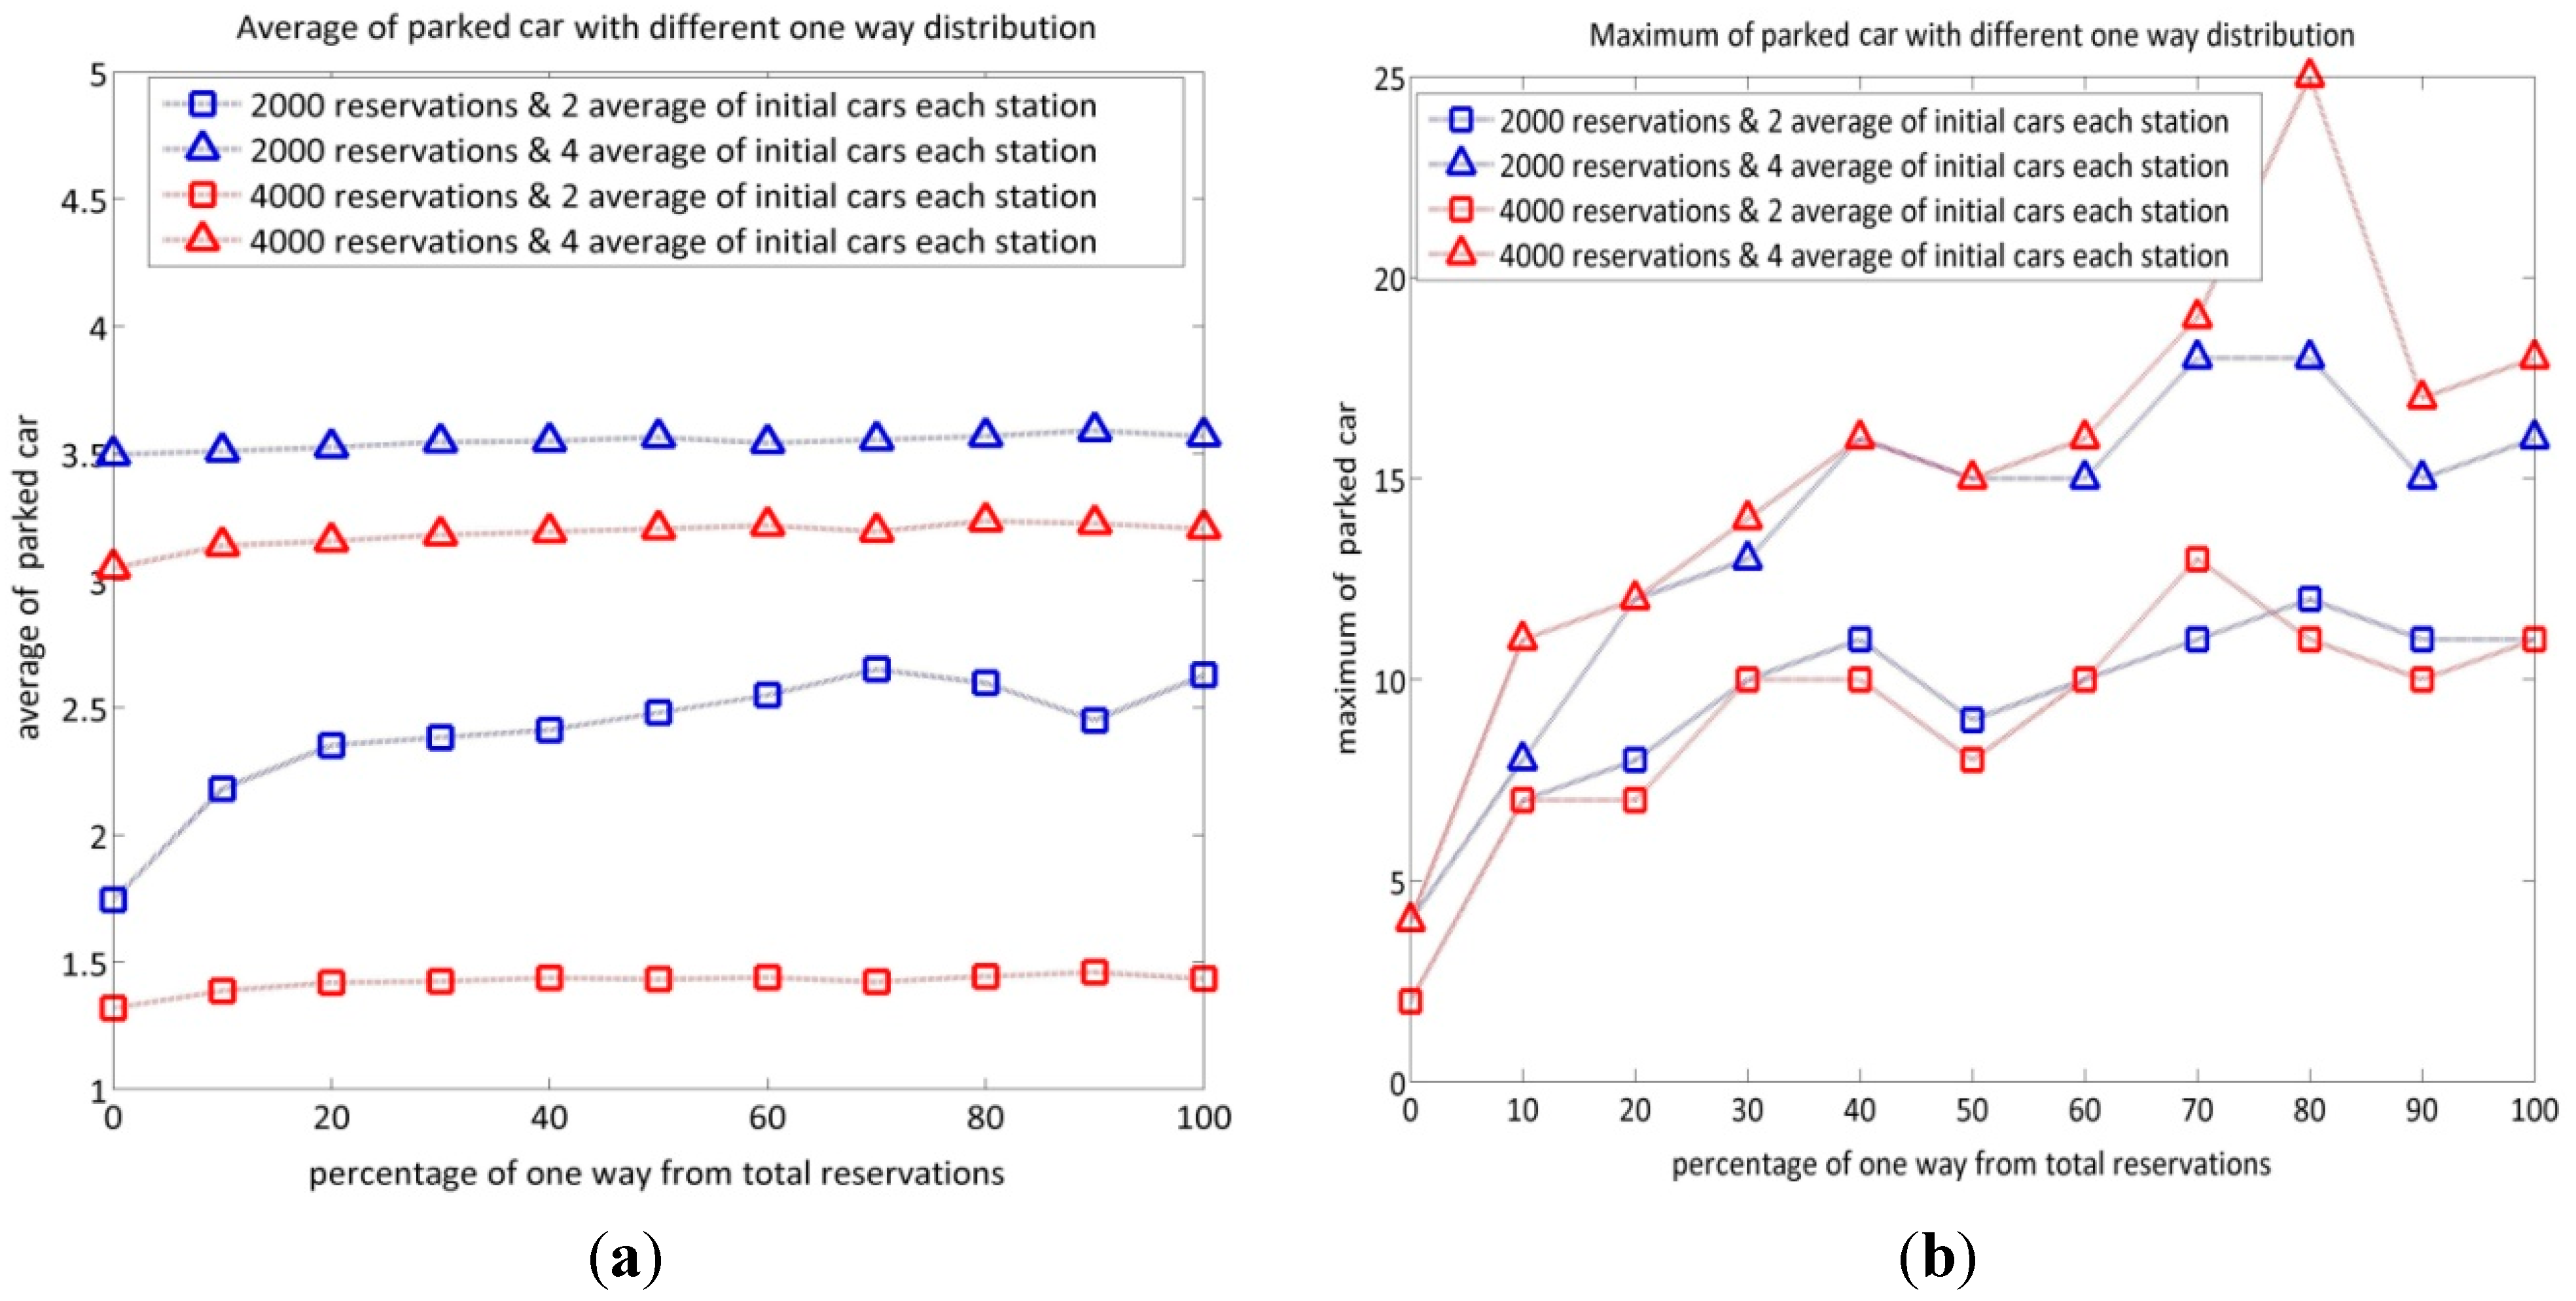
In addition, the average number of parked cars provides information about the average number of cars that are parked in all stations during the time of the simulation, while the maximum number of parked cars shows information about the maximum total number of cars that are parked in all stations during the time of simulation. This information is used to analyze the spread of imbalance of cars in stations during the simulation that evaluates the certain service model. Furthermore, this information can be used to predict the size of the station in order to maximize the profit and minimize station cost for the operator.

3.4. Experimental Scenarios

This simulation tool will check the event from the calendar sequentially from the earliest event until the last event, and the simulation tool will implement the task based on the calendar. The program will read the input matrix such as reservation, station, and vehicle in the memory and check every hour of each reservation. The program will check the event or reservation status to determine whether it is calling, assign, starting or ending.
The program will check reservation matrix, if the status of reservation is calling, the system will calculate vehicle availability from the departure station. To calculate the vehicle availability for reservation based one-way at time t in station s, the information is extracted from reservation, vehicle and station matrix and the details can be seen as follows:
V ( s , t ) = V P R E S E N T ( s , t ) + V I N ( s , t ) V O U T ( s , t )
where VPRESENT(s,t) is the real number of parked vehicles in station s at time t, VIN(s,t) is the total number of vehicles scheduled to return to station s as time t, and VOUT(s,t) is the number of vehicles that are not available for use because they have been reserved (scheduled to be out) from station s as time t. If the V ( s , t ) > 0 (vehicle is available in departure station) and AV_SPACE at the destination station is greater than 0, then the reservation will be accepted, otherwise it will be rejected. In addition, for the accepted reservation, the value of VOUT in the departure station will be added to 1, but AV_SPACE in the destination station will be subtracted from 1, starting from calling time reservation until end of time t simulation. The VIN in destination station will be added to 1, starting from the ending time reservation until the end of time t simulation. This is because an additional one car will depart from the departure station at the calling time and this additional car will arrive at the destination station at the ending time of the reservation. In addition, the system reserves one available space at the destination station starting from the calling time of the reservation.
The second possible event is when the status of the accepted reservation is assign, where the system will find a car which is located (current location) in the departure station and its status is parked only at the starting time. The system randomly selects parked car and assigns it to the particular reservation. Once the process finishes, the status of the car is changed from parked to booked, starting from assign time in the reservation until the end of time t simulation. The status of the car is changed to booked to prevent the car being assigned to the next reservation until the status of that particular car changes to parked again.
For the case where the status of an accepted reservation is starting, the system will update the VOUT (number of cars scheduled to be out) and the VPRESENT of the departure station by subtracting 1, but the AV_SPACE at the departure station will be added to 1, start from starting time until end of time t simulation. This is because, at the time t simulation, the car is no longer scheduled to be OUT or parked, but is being driven by the customer; thus, the status of the car is changed from booked to on road start from the starting time until end of time t simulation. In addition, the system adds one available space in the departure station when the car leaves at the starting time of the reservation. Once the customer trip ends, shown as the status of acceptance of the ending of the reservation, the system will update the VPRESENT of destination station by adding 1, starting from ending time reservation until end of time t simulation. In addition, the system updates the VIN (number of cars scheduled to be in) of the destination station by subtracting 1, starting from end of reservation until end of time t simulation. This is because the car is not scheduled to be in the destination station at a future time, because it has already arrived at the destination station; thus, the status of the car is changed from on road to park and its current location is updated to destination station. All of the updated information described above will be updated to reservation, station, and vehicle matrix; thus, the values of this matrix will always change while the simulation is operating.
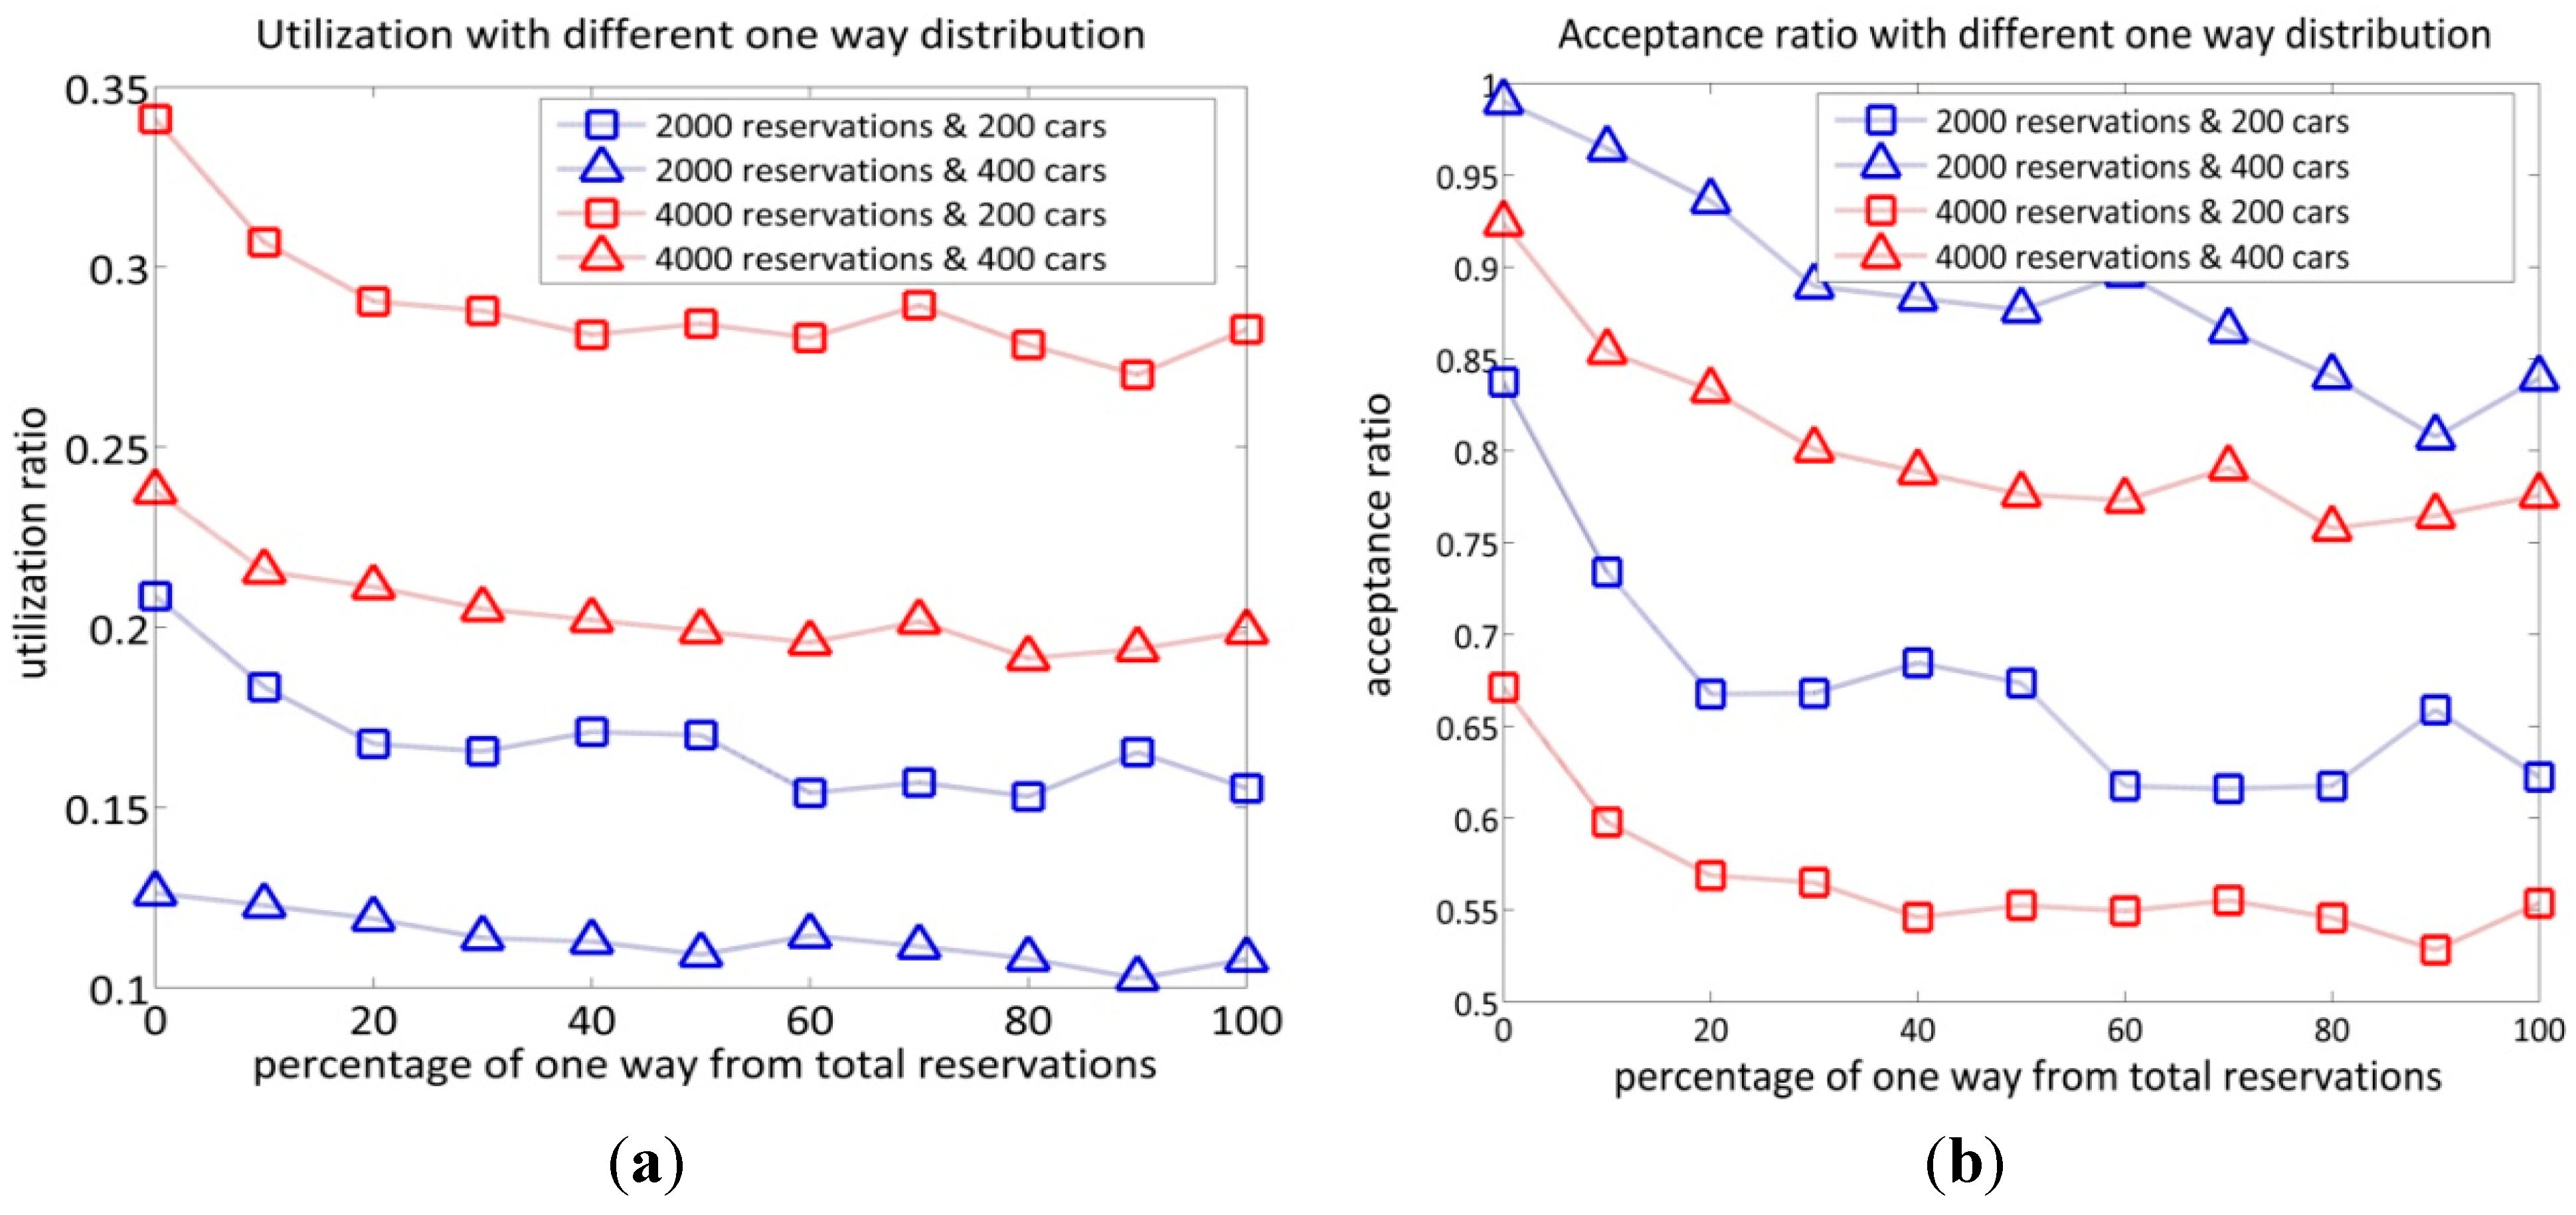
At the end of the time t simulation, the simulation will show the average car utilization ratio, reservation acceptance ratio, average number of parked cars, and maximum number of parked cars for a certain simulation scenario. The different scenario simulations will then be completed, the input of which consists of the total number of cars, number of reservations, and one-way proportion in reservations. All simulation results are then collected and ready to be analyzed to evaluate the reservation based one-way model.
In addition, a different implementation is used for instant access one-way as its event only consists of starting time and ending time. The program will check reservation matrix, and if the status of the customer travel plan is starting, the system will calculate the vehicle availability from the departure station. To calculate the vehicle availability for instant access one-way at time t in station s, the information is extracted from reservation, vehicle, and station matrix and the details can be seen as follows:
V ( s , t ) = V P R E S E N T ( s , t )
where VPRESENT(s,t) is the real number of parked vehicles at station s at time t. The instant access one-way does not recognize the VIN and VOUT information, since the instant access one-way does not have reservation system capability; however, it does have reservation system capability in the situation where a customer visits the departure station and picks up an available car. If V ( s , t ) > 0 (vehicle is available), then the customer travel plan will be accepted, otherwise it will be rejected. In this paper, for the case of instant access one way, the destination spaces are assumed to be always available since, in a real case, the customers are allowed to park the car in nearby stations if the spaces at the station are full. Next, the system updates the VPRESENT at departure station by subtracting it from 1, start from starting time of travel plan until end of time t simulation. The system will find a random parked car of which the location is (current location) the departure station and assign it to the particular customer travel plan. In addition, the status of the car is changed from parked to on road starting from the starting time until the end of time t simulation. This status shows that at the starting time of simulation, the car is driven by the customer.
Once the customer trip ends, of which the status of the accepted trip plan is ending, the system will update the VPRESENT of destination station by adding it to 1, starting from the end of time travel plan until end of time t simulation. The car has already arrived at the destination station; thus, the status of the car is changed from on road to parked and its current location is updated to destination station.
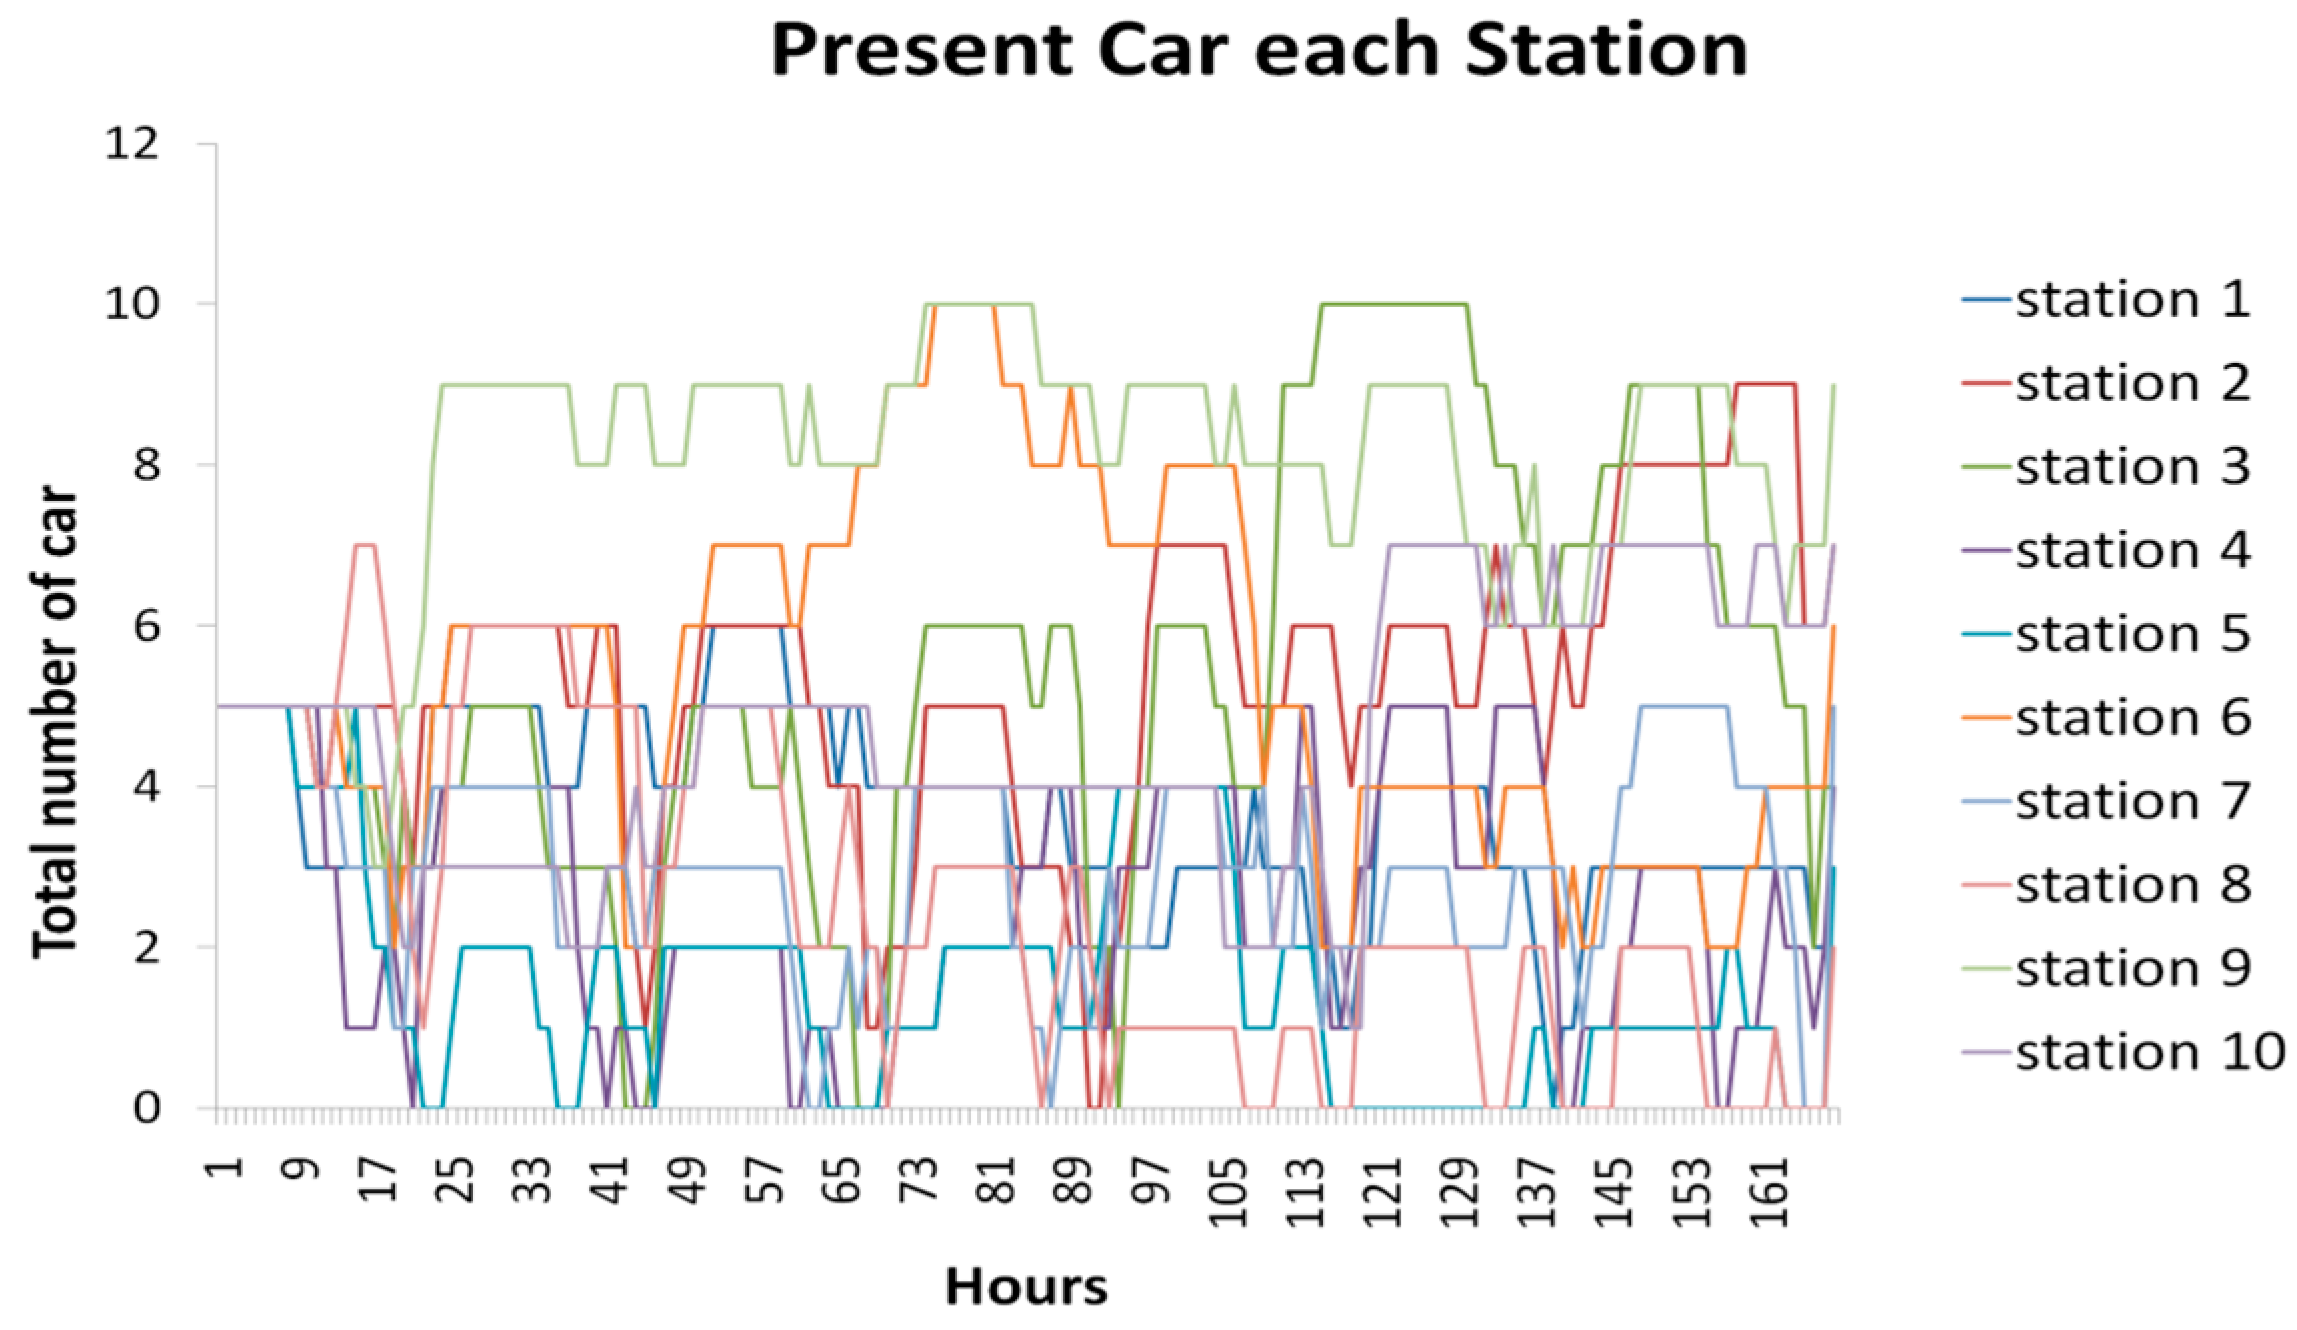
In addition, at the end of simulation time, the program will show the status of parked cars (present car) for all stations during time simulation (hourly basis) in a week as can be seen in Figure 2. Figure 2 shows an example of a simulation scenario with 10 stations in which its initial number of parked cars is the same, 5 cars in each station with total reservation is 400 in a week. The figure shows that the total number of parked cars at each stations is changed once the simulation is complete; the figure also shows the imbalance distribution of parked cars in each station. The result showed the utilization is 0.15 while acceptance ratio is 0.78.
Figure 2. Result of VPRESENT each hours
Sustainability 07 12465 g002
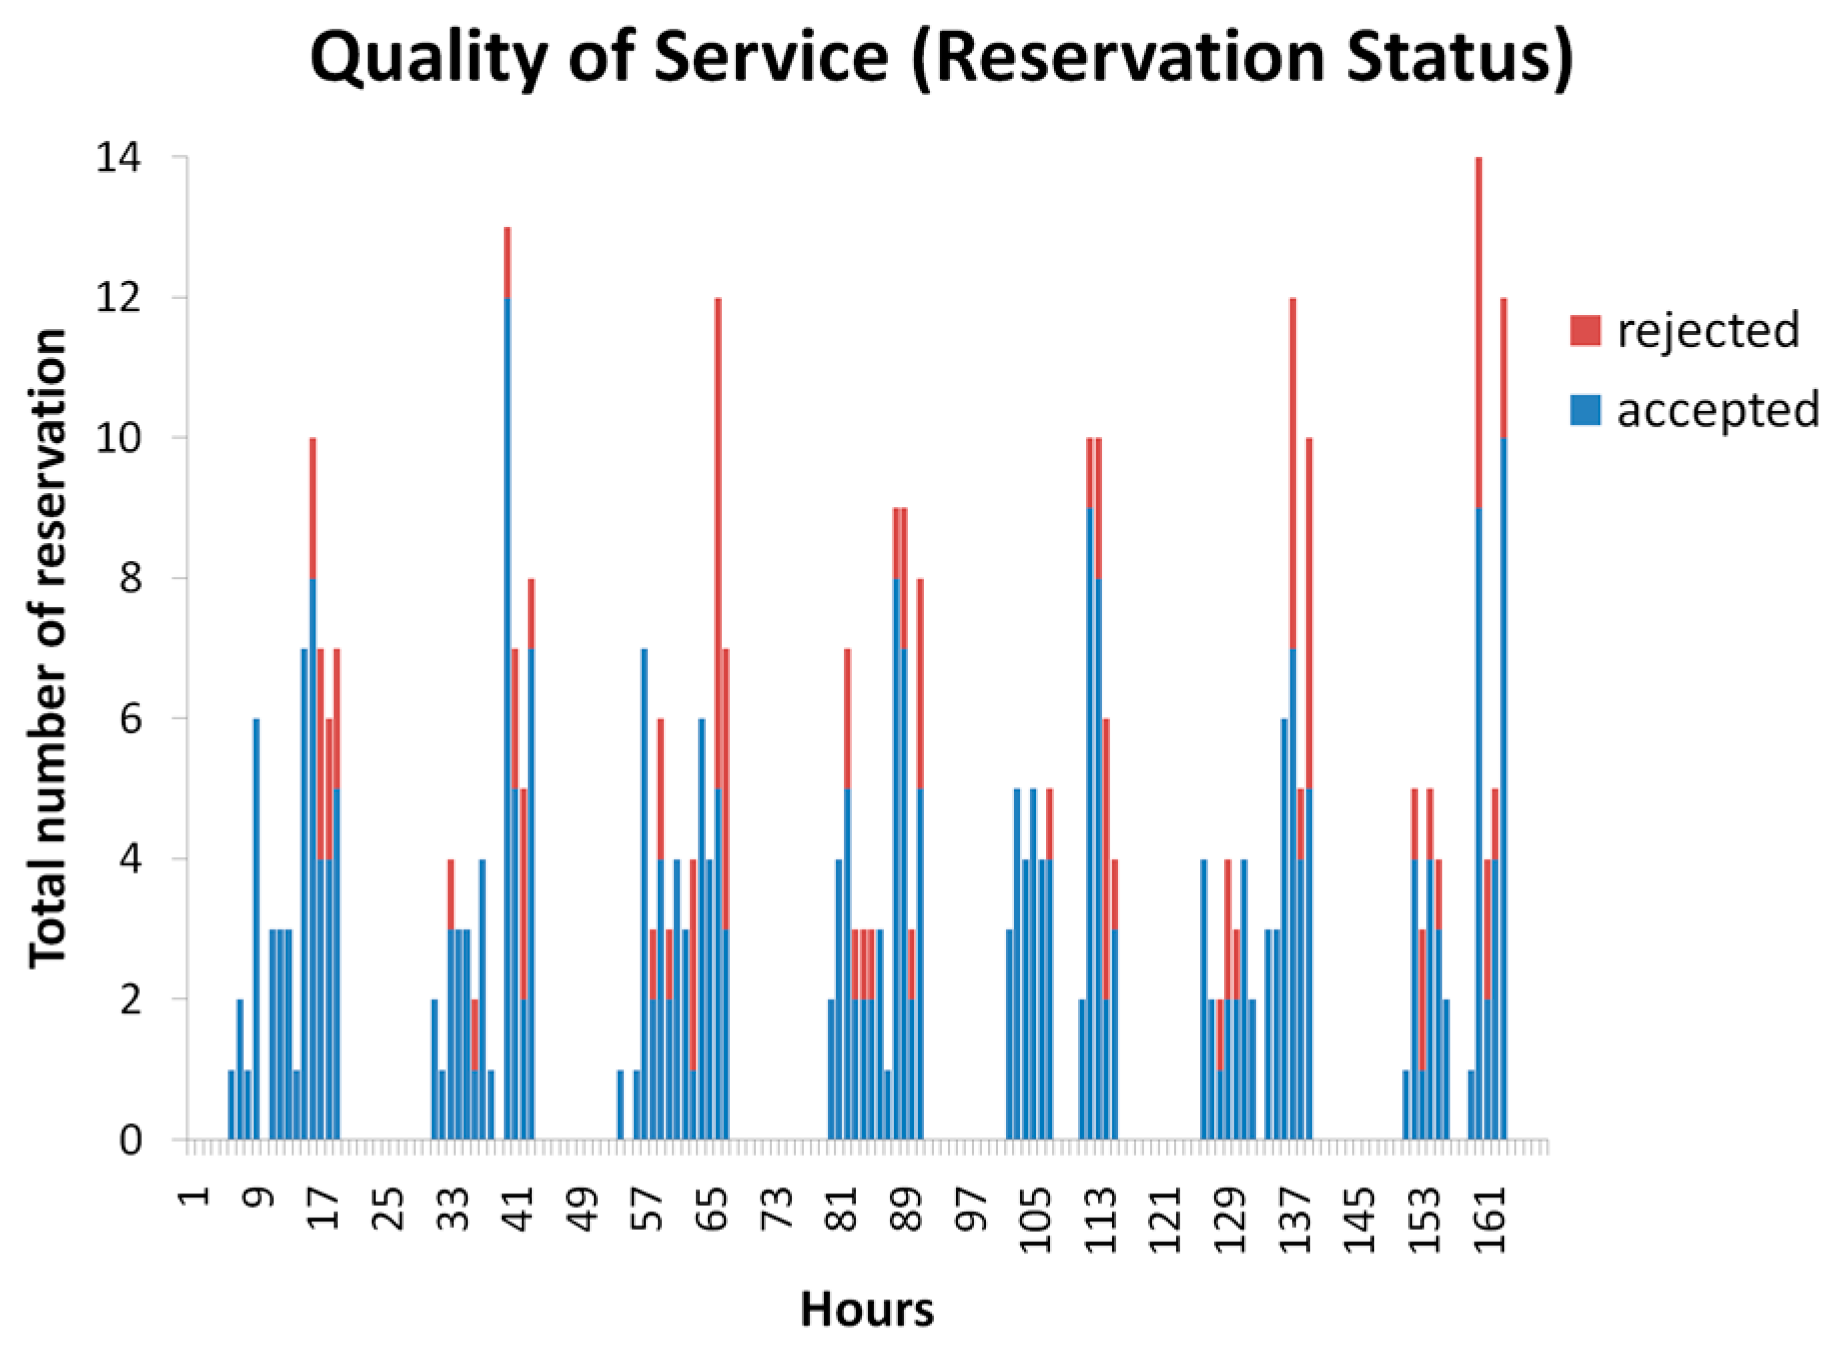
The status of the reservation at calling time is also presented in Figure 3, once the simulation has been completed. Two possible reservation results, accepted and rejected, are both presented on an hourly basis during the time simulation. The figure shows that the total number of accepted and rejected reservations in one week is equal to the initial input of total reservation, which is represented in the reservation matrix before simulation starts. Furthermore, 
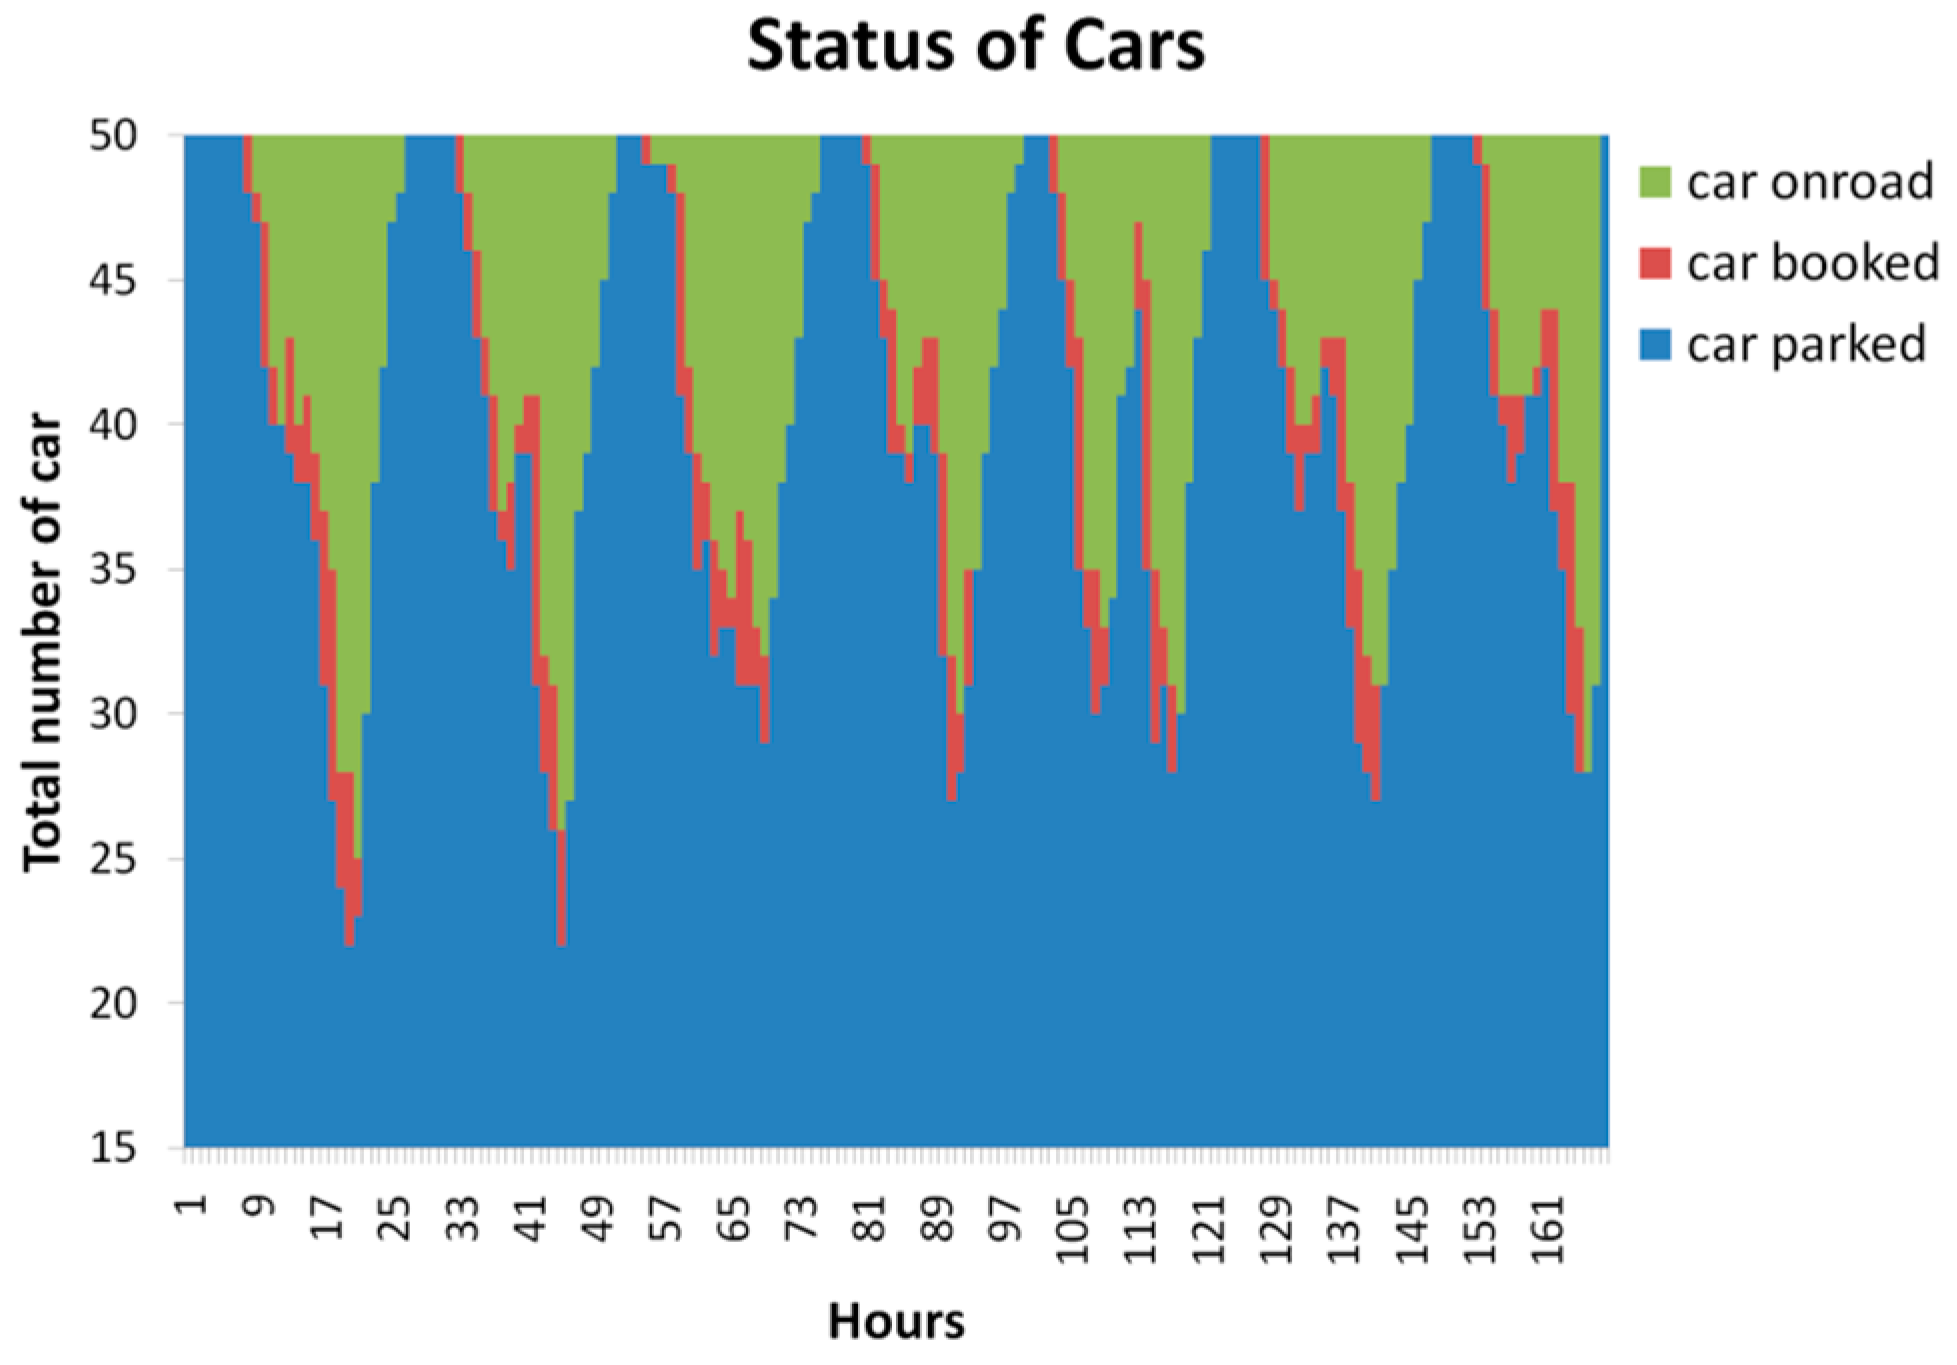
Figure 4 shows the status of all 50 cars during the time of simulation. The total number of cars is a combination of booked cars, parked cars, and on road cars.
Figure 3. Quality of Service.
Sustainability 07 12465 g003
Figure 4. Status of Cars.
Sustainability 07 12465 g004

3.5. Analysis of Simulation Results

In this part, statistical analysis of the simulation result is presented. The confidence interval estimation is used to express the degree of uncertainty from simulation result at 95% confidence level. A simulation scenario with 400 reservations in a week, 50 cars and 10 stations (each station has five cars) are used as simulation input. The reservation is made in a way using the combination of round trip and one way with probability 50:50. The simulation scenario is run 50 times (n = 50) and the result of a confidence interval, which assumes the simulation outputs are normally distributed, is presented in Table 6.
Table 6. Statistical analysis of simulation result.
EquationSimulation Output
Utilization RatioAcceptance RatioParked carsMax of Parked Cars
Average Y ¯ = 1 n i = 1 n Y i 0.1736690.85084.13165413.42
Standard Deviation σ = i = 1 n ( Y i  Y ¯ ) 2 n 0.0096060.0424580.0480292.330718
Confidence Interval Y ¯ ± z * σ n 0.1736 ± 0.0026630.8508 ± 0.01174.13 ± 0.01313.42 ± 0.646
Based on the previous scenario, 95% of the simulation output for utilization, acceptance ratio, number of parked cars and maximum of parked car are 0.1736 ± 0.002663, 0.8508 ± 0.0117, 4.13 ± 0.013, 13.42 ± 0.646 respectively, and the details can be seen in Table 6.

4. Result and Discussion

In this study, a comparison is carried out to evaluate the performance of service in terms of reservation type. In addition, an analysis is performed of the impact of one-way reservation and the size of the station. The simulation model was used for one week reservation data with four evaluation criteria such as the acceptance ratio, utilization ratio, average number of parked cars, and maximum number of parked cars.

4.1. Service Comparison

The simulation results of reservation based and instant access one-way are plotted in three-dimensional data with their quadratic regression models, as can be seen in Figure 5. The inputs for comparison include the total number of cars and the total number of reservations during one week, while the output for comparison is the utilization ratio. A trip generator was developed to transform the trip distribution into artificial reservation data. In this section, the trip generator generates the same number of round trips and one-way reservations for one week (50% round trip, 50% one-way). The result of simulation revealed that reservation based one-way outperforms instant access one-way in terms of the utilization ratio. The simulation data revealed that if the number of reservations increases with respect to a certain number of cars, then the utilization ratio will increase (most cars are used by customers), but if the number of cars increases with respect to a certain number of reservations, then the utilization ratio will decrease (most of the cars are parked). This result of a one-way pattern shows similarity with the previous research on round trip pattern results [21]. The quadratic regression models are used to fit both the simulation data results of service models. The objective of a quadratic regression analysis is to predict the single dependent variable (utilization ratio) using a set of independent variables (number of cars, number of reservations in a week).
Furthermore, the simulation result showed that when the total number of reservations for a certain number of cars increased, the utilization ratio of reservation based one-way becomes vastly superior to instant access one-way. However, the simulation also showed different results, as an increasing number of cars for a certain number of reservations will minimize the gap of the utilization ratio between instant access one-way and reservation based one-way. The impact of this relationship is that if the operator tends to implement reservation-based one-way in a real case, as the number of customers increases, the system will provide a high profit compared to the instant access one-way. The reservation system will help the operator to maximize the car operation, and minimize uncertainty over the number of returned cars, thus increasing their profit. On the other hand, if the operator tends to implement instant access one-way, the operator needs to provide a large number of operational cars, otherwise the profit of the instant access system cannot be maximized.
Quadratic regression models were used to analyze the utilization ratio based on a certain number of cars and number of reservations for two service models. Since the real information on the utilization ratio can be extracted from a real transactional dataset, the difference when compared to the prediction result can be used to measure the maximum error of our prediction model. In addition, this model can be used to predict future utilization ratios such as when an operator considers opening another type of service (one-way), predicts the increase of customers in the future, and predicts the effect of new policies on increasing the capacity of car operations. The quadratic regression was applied first to predict the data of reservation based one-way, using RMSE 0.01707. The strength of dependence between the two variables (actual value and predicted value) is 0.9881. Moreover, quadratic regression was also used to predict the instant access one-way data using RMSE 0.01367, while the strength of dependence between the two variables (actual value and predicted value) is 0.9825. Both quadratic regressions showed high accuracy in prediction for service models. Further details on the quadratic model for predicting utilization ratio can be seen in Table 7.
Figure 5. Service comparison of utilization ratio.
Sustainability 07 12465 g005
Table 7. Quadratic regression model for prediction of utilization ratio of service models.
ModelDetailParametersR2RMSE
Quadratic Regression fits reservation based one-way y = a + b x 1 + x 2 + d x 1 2 +  e x 1 x 2 + f x 2 2
where
y = utilization ratio of reservation based
x1= total reservation in a week
x2= total cars
a = 0.1695
b = 4.914 × 10⁻⁵
c = −0.0003811
d = −1.25 × 10⁻⁹
e = −7.296 × 10⁻⁹
f = 1.56 × 10⁻⁷
0.98810.01707
Quadratic Regression fits instant access one-way y = a + b x 1 + x 2 + d x 1 2 +  e x 1 x 2 + f x 2 2
where
y = utilization ratio of instant access
x1= total reservation in a week
x2= total cars
a = 0.1493
b = 3.509× 10⁻⁵
c = −0.0002356
d = −1.201 × 10⁻⁹
e = 3.422 × 10⁻⁹
f = 3.99 × 10⁻⁸
0.98250.01367
In addition, the result showed that the utilization ratio is inversely proportional to the acceptance ratio, as can be seen in Figure 6. The simulation revealed that the reservation based one-way still outperforms instant access one-way in terms of the acceptance ratio. Based on the simulation data, if the number of reservations increases with respect to a certain number of cars, then the acceptance ratio will decrease (most customers will not obtain an available car), but if the number of cars increases with respect to a certain number of reservations, then the acceptance ratio will increase (most of the customers have the chance to rent the car). The simulation is performed to compare the reservation based one-way and instant access one-way with various numbers of reservation and number of cars, and the result is analyzed based on the acceptance ratio. The quadratic regression model is also used to fit the simulation data.
The simulation result also showed that as the total number of reservations for a certain number of cars increases, the gap of acceptance ratio between reservation based one-way and instant access one-way will be higher. However, the opposite result is found, whereby as the number of cars for a certain number of reservations increases, the gap of the acceptance ratio between instant access one-way and reservation based one-way is minimized. Similar to the previous results on utilization ratio, if the operator tends to implement reservation-based one-way in a real case, as the number of customers increase, even though customer satisfaction reduces, the reservation based one-way showed better customer satisfaction than the instant access one-way. The reservation system plays an important role in scheduling the customer reservation; thus, returning cars can be expected by the next customer. The instant access one-way still needs a high number of operational cars, otherwise the chance of a customer obtaining an available car will be low.
The quadratic regression models were also used to analyze the acceptance ratio based on a certain number of cars and number of reservations for the two service models. Unlike the utilization ratio that can be gathered from a transactional database, the acceptance ratio cannot be easily collected. For the case of reservation based one-way, the car sharing system (website, Smartphone app) allows the customer to easily make a reservation. Customers can avoid conflicting times by choosing different reservation times if they have a flexible time schedule. Thus, it is difficult to trace the acceptance ratio information (searching history of a customer is not stored in the car sharing database). In addition, for the case of instant access one-way, the customer will be disappointed if they arrive at the station and find that no car is available, and this customer disappointment cannot be easily measured by the company. By using this model, operators can predict the present or future acceptance ratio. The customer acceptance of new policies, such as considering another service or increasing the car operation, can also be predicted using this quadratic regression model. The quadratic regression was applied first to predict the data of reservation based one-way, using RMSE 0.02631. The strength of dependence between the two variables (actual value and predicted value) is 0.9912. Moreover, quadratic regression was also used to predict the instant access one-way data, using RMSE 0.03697, while the strength of dependence between the two variables (actual value and predicted value) is 0.9845. Both quadratic regressions showed high accuracy of prediction for service models. Further details on the quadratic model for predicting the acceptance ratio can be seen in Table 8.
Figure 6. Service comparison of acceptance ratio.
Sustainability 07 12465 g006
Table 8. Quadratic regression model for prediction of acceptance ratio of service models.
ModelDetailParametersR2RMSE
Quadratic Regression fits reservation based one-way y = a + b x 1 + x 2 + d x 1 2 +  e x 1 x 2 + f x 2 2
where
y = acceptance ratio of reservation based
x1= total reservation in a week
x2= total cars
a = 0.3835
b = −4.237 × 10⁻⁵
c = 0.001656
d = 8.058 × 10⁻¹⁰
e = 1.048 × 10⁻⁸
f = −9.581 × 10⁻⁷
0.99120.02631
Quadratic Regression fits instant access one-way y = a + b x 1 + x 2 + d x 1 2 + e x 1 x 2 + f x 2 2
where
y = acceptance ratio of instant access
x1= total reservation in a week
x2= total cars
a = 0.3835
b = −5.142 × 10⁻⁵
c = 0.001534
d = 1.213 × 10⁻⁹
e = 2.747 × 10⁻⁹
f = −7.699 × 10⁻⁷
0.98450.03697

4.2. The Impacts of One-Way Reservation Compared to Roundtrip Reservation

In this section, the simulation investigates the impact of reservation based one-way reservation on the utilization ratio, acceptance ratio, average number of parked cars, and maximum number of parked cars. For a one-way service implementation in a real case, the operator allows the customer to return the car at a different station, as an additional service to that offered with the round trip service. The reservation data of car sharing will be the combination of roundtrip and one-way reservations. The previous result (Figure 5 and Figure 6) showed the relationship of acceptance ratio and utilization ratio with the total number of reservations as input. The distribution of the number of reservations showed that 50% were round trip reservations, while the other 50% were one-way reservations.
In this simulation, the different one-way reservation distributions are used as the input, while the acceptance ratio (Figure 7b) and utilization ratio are used as the output (Figure 7a). The four scenarios for the combination of total reservations and total cars operating were also used as input for the simulation. The percentage of one-way reservations shown on the x-axis represents the total number of one-way reservations divided by the total number of all reservations (combination of one-way and round trip). The result showed that for the four different simulation scenarios, as the distribution of one-way reservations increases, the utilization ratio (Figure 7a) as well as the acceptance ratio will be reduced (Figure 7b). The result also showed that the utilization ratio is sensitive to the total number of reservations, meaning that if the reservation number is high, then the utilization is high and if the reservation number is low, then the utilization is low, as can be seen in Figure 7a. The simulation with the scenario of 4000 reservations showed high utilization compared to the simulation of the scenario of 2000 reservations. In contrast, the acceptance ratio is sensitive to the total number of cars, meaning that if the number of cars is high, then the acceptance ratio will also be high and if the number of cars is low, then the acceptance ratio will also be low, as can be seen in Figure 7b.The result showed that a simulation with an input of 400 cars outperforms the simulation with an input of 200 cars in terms of the acceptance ratio.
Figure 7. (a) Impact of one-way reservation on utilization; (b) Impact of one-way reservation on acceptance ratio.
Sustainability 07 12465 g007
In addition, a simulation was also performed with different one-way reservation distributions when the output is the average number of parked cars (Figure 8a) and the maximum number of parked cars in some stations (Figure 8b). In this simulation, 100 stations are used as input for simulation, while the initial number of cars in each station is set at the same value. The four scenarios of a combination between the total number of reservations and the number of initial cars in each station for simulation were also used as input. The result showed that as the percentage of one-way reservations divided by the total number of reservations increases, the average number of parked cars in each station (Figure 8a) and the maximum number of parked car in each station also increase (Figure 8b). The result showed that if the number of initial cars in each station is high and the number of reservations is low, then the average number of parked cars in each station is also high, and if the number of initial cars in each station is low and the number of reservations is high, then the average number of parked cars in each station is also low (Figure 8a). In addition, a similarity is observed between the average number of parked cars and the maximum number of parked cars, whereby a high number of initial cars showed a high average and maximum number of parked cars. However, the high number of reservations generates a large distribution imbalance of cars in the stations (maximum of parked cars), as can be seen in Figure 8b.
Figure 8. (a) Impact of one-way reservation on average of parked cars at each station; (b) Impact of one-way reservation on maximum of parked cars at each station.
Sustainability 07 12465 g008
The impact of this model on the real case implementation is that, if the operator tends to open a one-way service, the operator first needs to analyze the proportion of customers who are interested in the one-way service. As the number of customers who are interested in the one-way service increases, the profit and customer satisfaction will be reduced (Figure 7a,b).The one-way service leads to a high average number of parked cars and maximum number of parked cars compared to the round trip service (Figure 8a,b with the input of the 0% one-way reservation). If the operator only offers a round trip service, they do not need to consider adding further spaces (lots) in each station because the average and maximum number of parked cars never exceeds the initial number of cars in each station (the roundtrip only allows the customer to return to the same station). In addition, as can be seen from Figure 8a,b, the difference between the average number of parked cars and the maximum number of parked cars in some stations is very high as the percentage of one-way reservations increases. This information revealed an imbalance in the distribution of cars at each station, which is caused by the one-way reservations. The solution is that for a one-way service, the operator needs to increase the size (number of lots) of the station; thus, there will be spaces available for the customer to return the car at different stations.

4.3. The Impact of Station Size

In this section, the simulation investigates the impact of station size on the utilization ratio and acceptance ratio. The simulation of reservation based one-way with a 50:50 ratio of round trip reservations to one-way reservations is performed. The previous result (Figure 5 and Figure 6) showed the relationship of acceptance ratio and utilization ratio to the total number of reservations and the total number of cars as input, whereby the size of the parking lot (station) was set as unlimited, showing high maximum number of parked cars, as can be seen in Figure 8b. This unlimited station size is impossible to implement since the operator needs to first determine the number of lots in each station in order to maximize profit and minimize station cost.
In this simulation, the different additional lots are used as an input while the output is the acceptance ratio (Figure 9b) and utilization ratio (Figure 9a). The number of additional lots, which is shown on the x-axis, represents the total number of additional lots over and above the standard lots. The number of standard lots is equal to the initial number of cars at each station. By using the lots limitation of each station, the available number of destination lots from the customer reservations will be checked; if the number of destination lots required are available, then the reservation is accepted; otherwise, it is rejected. The four scenarios for the combination of total number of reservations and initial number of cars at each station were also used as input for simulation. The result showed for the four different simulation scenario, as the additional number of lots increases, the utilization ratio (Figure 9a) and the acceptance ratio will also increase (Figure 9b). The result also showed the same pattern as that of the previous result, whereby if the number of reservations is high, then the utilization ratio is also high and if the number of reservations is low, then the utilization ratio is also low, as can be seen in Figure 9a. The simulation with the scenario of 4000 reservations showed a high utilization compared to the simulation with the scenario of 2000 reservations. In addition, if the number of cars is high, then the acceptance ratio will also be high and if the number of cars is low, then the acceptance ratio will also be low, as can be seen in Figure 9b. The result showed that the simulation with an input of four initial cars outperforms the simulation with an input of two initial cars in terms of the acceptance ratio. The relationship between acceptance ratio and number of additional lots showed a higher slope compared to the relationship between utilization ratio and number of additional lots; thus, it was revealed that the acceptance ratio is sensitive to the additional number of lots at each station. In the four scenarios we investigated, if the additional number of lots is less than 6, then the utilization and acceptance decrease significantly compared with the additional number of lots, which is over 6. However, this result might differ (utilization and acceptance) for a different combination of the number of reservations and number of initial cars at each station, as suggested in Figure 5 and Figure 6.
Figure 9. (a) Impact of additional lots on utilization ratio; (b) Impact of additional lots on acceptance ratio.
Sustainability 07 12465 g009
The impact of this model on the real case implementation is that, if the operator wants to open a one-way service, the operator needs to determine the total number of lots needed at each station. The result showed that additional lots are needed in order to increase the acceptance ratio (customer satisfaction) and utilization ratio. As the number of initial cars at each station and the number of reservations increase, the operator needs to increase the number of additional lots; thus maximizing the customer satisfaction and car utilization (Figure 9a,b).
In addition, the relocation model is used as an input while the output is utilization ratio each day during one week simulation (Figure 10a). A relocation model which is used in this study is based on periodical relocation i.e., for every 24 hours the relocation is triggered. To implement vehicle relocations, an operator sets vehicle inventory thresholds at each station. This threshold is calculated first and based on the history of customer demand in each station. The system will regularly calculate the total number of vehicles in the end of day (midnight) and the system triggers the relocation model in order to move vehicles from an oversupplied station (over the threshold) to the other stations which are short of cars (below the threshold). Figure 10a (daily utilization rate) shows that the relocation model leads to the high utilization ratio compared to a case without the relocation scheme. The relocation strategy can be considered by an operator as the other solution to provide a higher chance that a customer can obtain an available car.
The result showed that as the number of reservations increases, the number of relocated cars will decrease (Figure 10b). In addition, if the number of cars is high, the number of relocated cars will also be high. If the number of cars is low, the number of relocated cars will also be low, as shown in Figure 10b. High number of reservations with low number of cars will increase the utilization ratio (Figure 9a) and decrease the maximum of parked cars (Figure 8b), reducing the number of relocated cars. If the company operates a high number of cars, it will increase the relocation cost. However, as the number of reservations increases (increasing the number of customers), naturally it will reduce the relocation cost.
Figure 10. (a) Impact of relocation on utilization ratio; (b) Impact of number of reservations on relocation cost.
Sustainability 07 12465 g010
A previous research showed that the benefits of a cars haring service include cost savings, and reducing the negative impacts of private vehicle ownership and the environmental impacts of automobile use [2]. However, the potential cost effect of car sharing service from different stakeholders’ viewpoints must be analyzed. From the customer perspectives, customers must consider the change in their travel behaviors as compared with vehicle ownership, such as the need to plan trips in advance and not having immediate access to a car, particularly for those who do not live within easy walking distance of a car-sharing location. The operational/maintenance costs of owning shared cars (including cost of purchase), marketing, education (research) and other incidentals are the other issues that must be considered from the company perspective.

5. Conclusions and Future Work

Because it is important to evaluate an alternative service before it can be implemented as a practical business model, this paper demonstrates that a discrete event simulation model must first be developed to evaluate the alternative one-way service on acceptance ratio, utilization ratio, and the average number of parked cars based on the travelling frequency, number of vehicles, VHT, and VKT patterns from the Korean car sharing dataset. The result showed that the total number of reservations, number of cars, one-way reservation distribution, and total number of lots at each station will affect the utilization and acceptance ratio. The result of simulation revealed that reservation based one-way outperformed instant access one-way in terms of utilization ratio and acceptance ratio. The result suggested that, as the number of customers increases, the reservation based one-way service is the better service for the operator to implement in a real case, due to its impact on high profit and high customer satisfaction compared to the instant access one-way. The reservation system will help the operator to maximize car operation by minimizing uncertain return cars from previous customers. On the other hand, this paper suggests that instant access one-way is better for application in real cases if the operator provides a high number of operational cars, thus maximizing profit and customer satisfaction.
The result showed that the utilization ratio is inversely proportional to the acceptance ratio and is applied for both services, reservation based one-way and instant access one-way. This is based on the result showing that as the number of reservations increases with respect to a certain number of cars, the acceptance ratio decreases (most customers will not obtain an available car), but it will increase the percentage of utilization ratio (more cars will be rented by customers).The result also showed that the acceptance ratio is sensitive to the total number of cars, while utilization is sensitive to the total number of reservations. The quadratic regression is applied in this study and can be used to predict the future utilization ratio and customer satisfaction such as when the operator predicts the effect of opening a one-way service, predicts the impact of increasing customers in the future, and predicts the effect of new policies on increasing the capacity of car operations.
In addition, the simulation showed the impact of one-way implementation whereby, as the distribution of the one-way service in the reservation increases, the utilization ratio and acceptance ratio decrease, leading to a high distribution imbalance of cars at each station. This means that as the number of customers interested in the one-way service increases, profit will decrease, resulting ultimately in low customer satisfaction. This result forces the operator to be very careful when considering the one-way service, by first analyzing the proportion of customers who are interested in the one-way service. The total number of lots in each station also affects the utilization and acceptance ratios of the one way service; thus, increasing the capacity of the lots in each station and relocation model can be considered as a solution due to its impact on maximizing profit and customer satisfaction.
Finally, this project has obvious limitations. First, we used a standard relocation algorithm to solve the imbalance distribution of cars in a station. In future projects, introducing and upgrading the relocation model with forecasting capabilities might be considered. The evaluation of other parameters in the future might also be considered, such as station cost, the station network, the departure-destination distribution for reservations, fuel costs, the distance between home and the parking lot, cleaning costs, and maintenance costs.

Acknowledgments

This research was supported by the Industrial Technology Innovation Programs-International Collaborative Research and Development Program (N0000701) of the Ministry of Trade, Industry & Energy, Korea.

Author Contributions

Jongtae Rhee and Byungun Yoon designed the research. Ganjar Alfian implemented and performed the simulation, while Yong-Shin Kang evaluated and analyzed the simulation results. The paper was mainly written by Ganjar Alfian, while Byungun Yoon revised the paper. All authors have read and approved the final manuscript.

Conflicts of Interest

The authors declare no conflict of interest.

References

  1. Shaheen, S.; Chan, N.D.; Micheaux, H. One-way carsharing’s evolution and operator perspectives from the Americas. Transportation 2015, 42, 519–536. [Google Scholar] [CrossRef]
  2. Martin, E.; Shaheen, S. Greenhouse Gas Emission Impacts of Carsharing in North America. IEEE Trans. Intell. Transp. 2011, 12, 1074–1086. [Google Scholar] [CrossRef]
  3. Shaheen, S.; Cohen, A. Carsharing and Personal Vehicle Services: Worldwide Market Developments and Emerging Trends. Int. J. Sustain. Transp. 2013, 7, 5–34. [Google Scholar] [CrossRef]
  4. Firnkorn, J.; Muller, M. What will be the environmental effects of new free-floating car-sharing systems? The case of car2go in Ulm. Ecol. Econ. 2011, 70, 1519–1528. [Google Scholar] [CrossRef]
  5. Barth, M.; Todd, M. Simulation model Performance Analysis of a Multiple Station Shared Vehicle System. Transp. Res. C-Emer. 1999, 7, 237–259. [Google Scholar] [CrossRef]
  6. Di Frebbraro, A.; Sacco, N.; Saeednia, M. One-Way CarsharingSolving the Relocation Problem. TRR J. 2012, 2319, 113–120. [Google Scholar]
  7. Kek, A.G.H.; Cheu, R.L.; Chor, M.L. Relocation Simulation Model for Multiple-Station Shared-Use Vehicle Systems. TRR Journal 2006, 1986, 81–88. [Google Scholar] [CrossRef]
  8. Kek, A.G.H.; Cheu, R.L.; Meng, Q.; Fung, C.H. A Decision Support System for Vehicle Relocation Operations in Carsharing Systems. Transp. Res. Part E 2009, 45, 149–158. [Google Scholar] [CrossRef]
  9. Correia, G.; Antunes, A. Optimization Approach to Depot Location and Trip Selection in One-Way CarsharingSystems. Transp. Res. Part E 2012, 48, 233–247. [Google Scholar] [CrossRef]
  10. Barth, M.; Todd, M. Intelligent transportation system architecture for a multi-station shared vehicle system. In Proceedings of the IEEE Intelligent Transportation Systems Conference, Dearborn, MI, USA, 1–3 October 2000; IEEE: Piscataway, NJ, USA, 2000; pp. 240–245. [Google Scholar]
  11. Cepolina, E.M.; Farina, A. A methodology for planning a new urban car sharing system with fully automated personal vehicles. Eur. Transp. Res. Rev. 2014, 6, 191–204. [Google Scholar] [CrossRef]
  12. Morency, C.; Trepanier, M.; Agard, B.; Martin, B.; Quashie, J. Car Sharing System: What Transaction Datasets Reveal on Users’ Behaviors. In Proceedings of Intelligent Transportation Systems Conference, Seattle WA, USA, 30 September–3 October 2007; IEEE: Piscataway, NJ, USA, 2007; pp. 284–289. [Google Scholar]
  13. Habib, K.M.N.; Morency, C.; Islam, M.T.; Grasset, V. Modeling users' behavior of a carsharing program: Application of a joint hazard and zero inflated dynamic ordered probability model. Transp. Res. Part A Policy Pract. 2012, 46, 241–254. [Google Scholar] [CrossRef]
  14. Costain, C.; Ardron, C.; Habib, K.N. Synopsis of Users Behavior of a Carsharing Program: A Case Study in Toronto. Transp. Res. Part A Policy Pract. 2012, 46, 421–434. [Google Scholar] [CrossRef]
  15. Yoon, B.; Kim, S.; Rhee, J. An Evaluation Method for Designing a New Product-Service System. Expert Syst. Appl. 2012, 39, 3100–3108. [Google Scholar] [CrossRef]
  16. Shaheen, S.; Rodier, C. Travel effects of a suburban commuter carsharing service: CarLink case study. TRR J. 2005, 1927, 182–188. [Google Scholar] [CrossRef]
  17. Millard-Ball, A.; Murray, G.; Schure, J. T.; Fox, C. Car-Sharing: Where and How It Succeeds, TCRP Report 108; Transportation Research Board of the National Academies: Washington, DC, USA, 2005. [Google Scholar]
  18. Schwieger, B. International Developments towards Improved CarSharing Services; Writersworld: Oxford, UK, 2004. [Google Scholar]
  19. Cheu, R.L.; Xu, J.; Kek, A.G.H.; Lim, W.P.; Chen, W.L. Forecasting of Shared-Use Vehicle Trips with Neural Networks and Support Vector Machines. TRR J. 2006, 1968, 40–46. [Google Scholar]
  20. Alfian, G.; Rhee, J.; Yoon, B. A Simulation tool for prioritizing product-service system (PSS) models in a carsharing service. Comput. Ind. Eng. 2014, 70, 59–73. [Google Scholar] [CrossRef]
  21. Rhee, J.; Alfian, G.; Yoon, B. Application of Simulation method and regression analysis to optimize car operations in carsharing service: A case study in South Korea. J. Public Transp. 2014, 17, 121–160. [Google Scholar] [CrossRef]
  22. Uesugi, K.; Mukai, N.; Watanabe, T. Optimization of Vehicle Assignment for Car Sharing System. In Knowledge-Based Intelligent Information and Engineering Systems, Lecture Notes in Computer Science; Apolloni, B., Howlett, R.J., Jain, L., Eds.; Springer: Berlin Heidelberg, Germany, 2007; pp. 1105–1111. [Google Scholar]

