Article

Cultivated Land Changes and Agricultural Potential Productivity in Mainland China

1
Institute of Geographic Sciences and Natural Resources Research, Chinese Academy of Sciences, 11A Datun Rd., Beijing 100101, China
2
University of Chinese Academy of Sciences, 19A Yuquan Rd., Beijing 100049, China
3
Jiangsu Center for Collaborative Innovation in Geographical Information Resource Development and Application, No.1 Wenyuan Rd., Nanjing 210023, China
4
Chinese Land Surveying and Planning Institute, No. 37 West district of Guanyingyuan, Beijing 100035, China
*
Author to whom correspondence should be addressed.
Sustainability 2015, 7(9), 11893-11908; https://doi.org/10.3390/su70911893
Submission received: 20 July 2015 / Revised: 23 August 2015 / Accepted: 24 August 2015 / Published: 27 August 2015

Abstract

:
With rapid and continuous population growth and the associated declining quality of cultivated land, food security in China has been attracting the attention of scholars both domestically and internationally. In recent decades, the implications of the cultivated land balance policy have promoted spatial changes of cultivated land. Estimating the agricultural potential productivity and assessing its response to cultivated land changes could provide a scientific basis for strategic decision-making concerning grain production and thus guarantee food security. In the present study, the Agro-Ecological Zone (AEZ) model was applied to estimate the agricultural potential productivity. Data from the second national land survey were first applied to characterize the changes of cultivated land (by comparing the cultivated land in 2009 with that in 2012) and their influence on potential productivity in Mainland China. We propose a utilization degree of total potential productivity (UTP) and its ratio coefficient (RUTP) to reveal the utilization status of potential productivity and its change characteristics at the provincial level. It was found that there was a trend for cultivated land to be shifted away from cities, and the average productive capability per hectare of cultivated land declined from 7386.5 kg/ha to 6955.2 kg/ha by occupying highly productive cultivated land generally near the cities and compensating less productive cultivated land in remote areas. UTPs and RUTPs indicate a significant difference in the utilization status of potential productivity among the 31 provinces of Mainland China. Grain production with the aim of sustainable development should be strategized according to the particular facts of each province. The methods we applied can mine the impacts of cultivated land changes on potential productivity and the utilization of potential productivity effectively.

1. Introduction

Explosive urban growth in China has converted cultivated land at the urban-rural divide to non-agricultural uses at enormous rates [1,2], particularly in the southeast coastal areas of China, which have experienced the most rapid economic growth in the nation [3,4]. To mitigate the pressure of cultivated land loss, the government has implemented numerous farmland protection programmes, with various degrees of success. The most important one is the cultivated land balance policy, implemented in 1997, which stipulates that any area taken out of cultivation must be offset by putting at least an equal area into cultivation [5,6].
Therefore, there has hardly been a significant change in the total area of cultivated land in recent decades. According to the Ministry of Land and Resources of China, total cultivated land in Mainland China continually decreased by approximately 5.6 million ha during the period of 1980–1997. During 1997–2012, because of the implementation of the cultivated land balance policy, the cultivated land decrease was contained. This is consistent with the research of Feng et al. [7], who found that the general trend in cultivated land changes gave the impression that the decline would be halted in the future. By contrast, despite the dynamic equilibrium of total cultivated land resulting from the cultivated land requisition-compensation balance, the spatial pattern of cultivated land has been changing greatly [8]. In addition, associated with the spatial pattern change of cultivated land, cultivated land quality in China is usually believed to have decreased over past decades due to the loss of high quality cultivated land, which could not be compensated sufficiently with low quality areas [6,9].
China’s food security is a hotspot for researchers both domestically and internationally. A controversial topic is whether food security could be threatened by the cultivated land conversion mentioned above [10,11,12]. Despite the improving crop yields per unit of cultivated land area by increased fertilizer application and the use of hybrid seed varieties [13,14], many researchers have still labelled the conversion of cultivated land as a threat to China’s food security. For example, Feng et al. [15] noted that the cultivated land conversion caused an overall decline in cultivated land and thus a restraint on China’s crop production in the 1990s. Yan et al. [16] evaluated the impact of cultivated land conversion on agricultural productivity for the period of 1990–2000 in China, and found that cultivated land conversion reduced the sustainability of China’s crop production. Yang et al. [17] also claimed that the current cultivated land management strategy could generate more harm than benefit to the long-term food security of China. Essentially, food security could not entirely be accounted for in terms of the annual grain yield. The emphasis of food security should be shifted towards the security of grain productive capability, rather than the security of grain yield [18]. For a certain grain crop in a given area, the potential productivity of cultivated lands stands for the theoretically highest grain yield, restricted by local natural resources and current technical and economic conditions [19,20]. The key influencing factor of potential productivity is cultivated land [21], which could directly alter the growing environment of crops through the changes in quantity and quality. Nowhere is the need for the evaluation of cultivated land change and its influence on potential productivity greater than in China because of its heavy demand for food [22,23,24] and the shortage of cultivated land [25,26].
However, previous studies primarily focused on the basic condition (quantity and quality) of potential productivity and its changes associated with cultivated land conversion. There are still some questions that have not yet been answered, such as those regarding the utilization degree of potential productivity and the characteristics of the change in that utilization degree. In addition, for the time being, the latest change in cultivated land and its impact on potential productivity since 2010 has not yet been evaluated from a national perspective because of data limitations [17]. For example, the National Land-Use/Land-Cover data sets (NLCD), developed by the Chinese Academy of Sciences (CAS) with Landsat TM/ETM, were the most widely employed data source for cultivated land in recent decades [9,27,28]. Nevertheless, the NLCD covers only the period of 1980–2010. The Chinese government conducted the second national land survey based on the combination of remote sensing interpretation and an actual field survey in 2007. The survey was finished in 2009. Since 2010, subsequent land change surveys have been implemented annually to detect the land use change against the land use status of 2009. These reliable and systematic data sources provide us an opportunity to investigate the latest conditions of cultivated land and potential productivity.
In this paper, the agricultural potential productivity in 2009 and 2012 was calculated. The change characteristics between the cultivated land in 2009 and that in 2012 were studied in Mainland China, as was the influence of cultivated land change on potential productivity. Three questions were addressed: (i) What are the characteristics of change in cultivated land in China? (ii) How large a development space does grain yield have? (iii) What are the characteristics of the change in the utilization degree of potential productivity? The results provide important information for macroscopic decision-making in terms of cultivated land application.

2. Materials and Methods

2.1. Data Sources

2.1.1. Cultivated Land Data

During 2007–2009, China conducted its second national land survey [29,30]. The Ministry of Land Resources and its directly facilitated institutions at the provincial, prefectural, and county levels were primarily responsible for the detailed implementation. There were roughly three implementation phases. First, remote sensing images were uniformly purchased and interpreted. Taking villages as units, the digital maps of land use were produced by using visual interpretation and digitalization techniques. These objective maps provided basic references for an actual field survey and effectively prevented deliberate fraud by the local governments. Second, an actual field survey was conducted by local professionals to validate and modify the digital maps of land use. Last, the land resources sectors at higher levels (e.g., prefecture, province, and nation) gathered and examined the land survey outcomes from their directly facilitated institutions. Based on these, the Ministry of Land Resources eventually established China’s land use database in the year 2009 at a scale of 1:10,000.
Remarkably, the authoritativeness and accuracy of that database were ensured by government participation, a strict verification system, and sufficient financial support. In subsequent years, the work introduced above has been repeated to investigate the land use change against the land use status of 2009. However, in China, the publishing of high-resolution data (at a scale of 1:10,000) is bound by legal regulations that are made by the government to ensure the country’s security [31]. After all, the higher resolution data can provide details of military areas. To enable their service to society and for research production, the Chinese Land Surveying and Planning Institute (CLSPI), a directly facilitated institution of the Ministry of Land Resources, developed the National Grating Data of Land Use (NGDLU) with a spatial resolution of 1.6 km × 1.6 km [32], based on the second national land survey and subsequent land use change surveys. Each grating of the NGDLU includes a series of land use types and their corresponding areas. The NGDLU covers the period of 2009–2012 thus far and has been updated annually. This systematic data can provide spatial information of land use in Mainland China that is accurate and the most recent. It is noteworthy that this is the first application of the NGDLU originating from the second land survey data in the present study.
Cultivated land data, represented by the percentage information of all land use types, were extracted from the NGDLU, which was provided by the CLSPI.

2.1.2. Meteorological Data

Based on such daily observation data as temperature, precipitation, relative humidity, wind speed at 10 m height and sunshine hours from 824 weather stations from 2009 to 2012 provided by the National Meteorological Bureau of China (http://cdc.nmic.cn/home.do), a 1 km × 1 km spatial grid database was developed by interpolating with the Arc/Info grid spline method. Then, projection transformation was carried out to match the spatial cultivated land data. Employing the hourly data of the geostationary metrological satellite (GMS-5), we calculated the daily solar radiation according to the radiative transfer model [33]. The productions were also converted to 1.6 km × 1.6 km spatial data with the resample method. The average discrepancy between gridded and observed data was less than 1%.

2.1.3. Terrain Elevation Data and Soil Data

The Shuttle Radar Topography Mission (SRTM) version 2 data were obtained from the Jet Propulsion Laboratory (http://srtm.csi.cgiar.org/SELECTION/inputCoord.asp). With a spatial resolution of 90 m, the SRTM-DEM data have been widely applied in various research fields [34,35]. A nationwide soil dataset at a scale of 1:1,000,000 was sourced from the Data Sharing Infrastructure of Earth System Science (http://www.geodata.cn/Portal/index.jsp). Soil properties included in this dataset are: soil type, effective soil depth, soil nutrient content (e.g., nitrogen, phosphorus, and potassium) and soil water-holding capacity.

2.2. Methodology

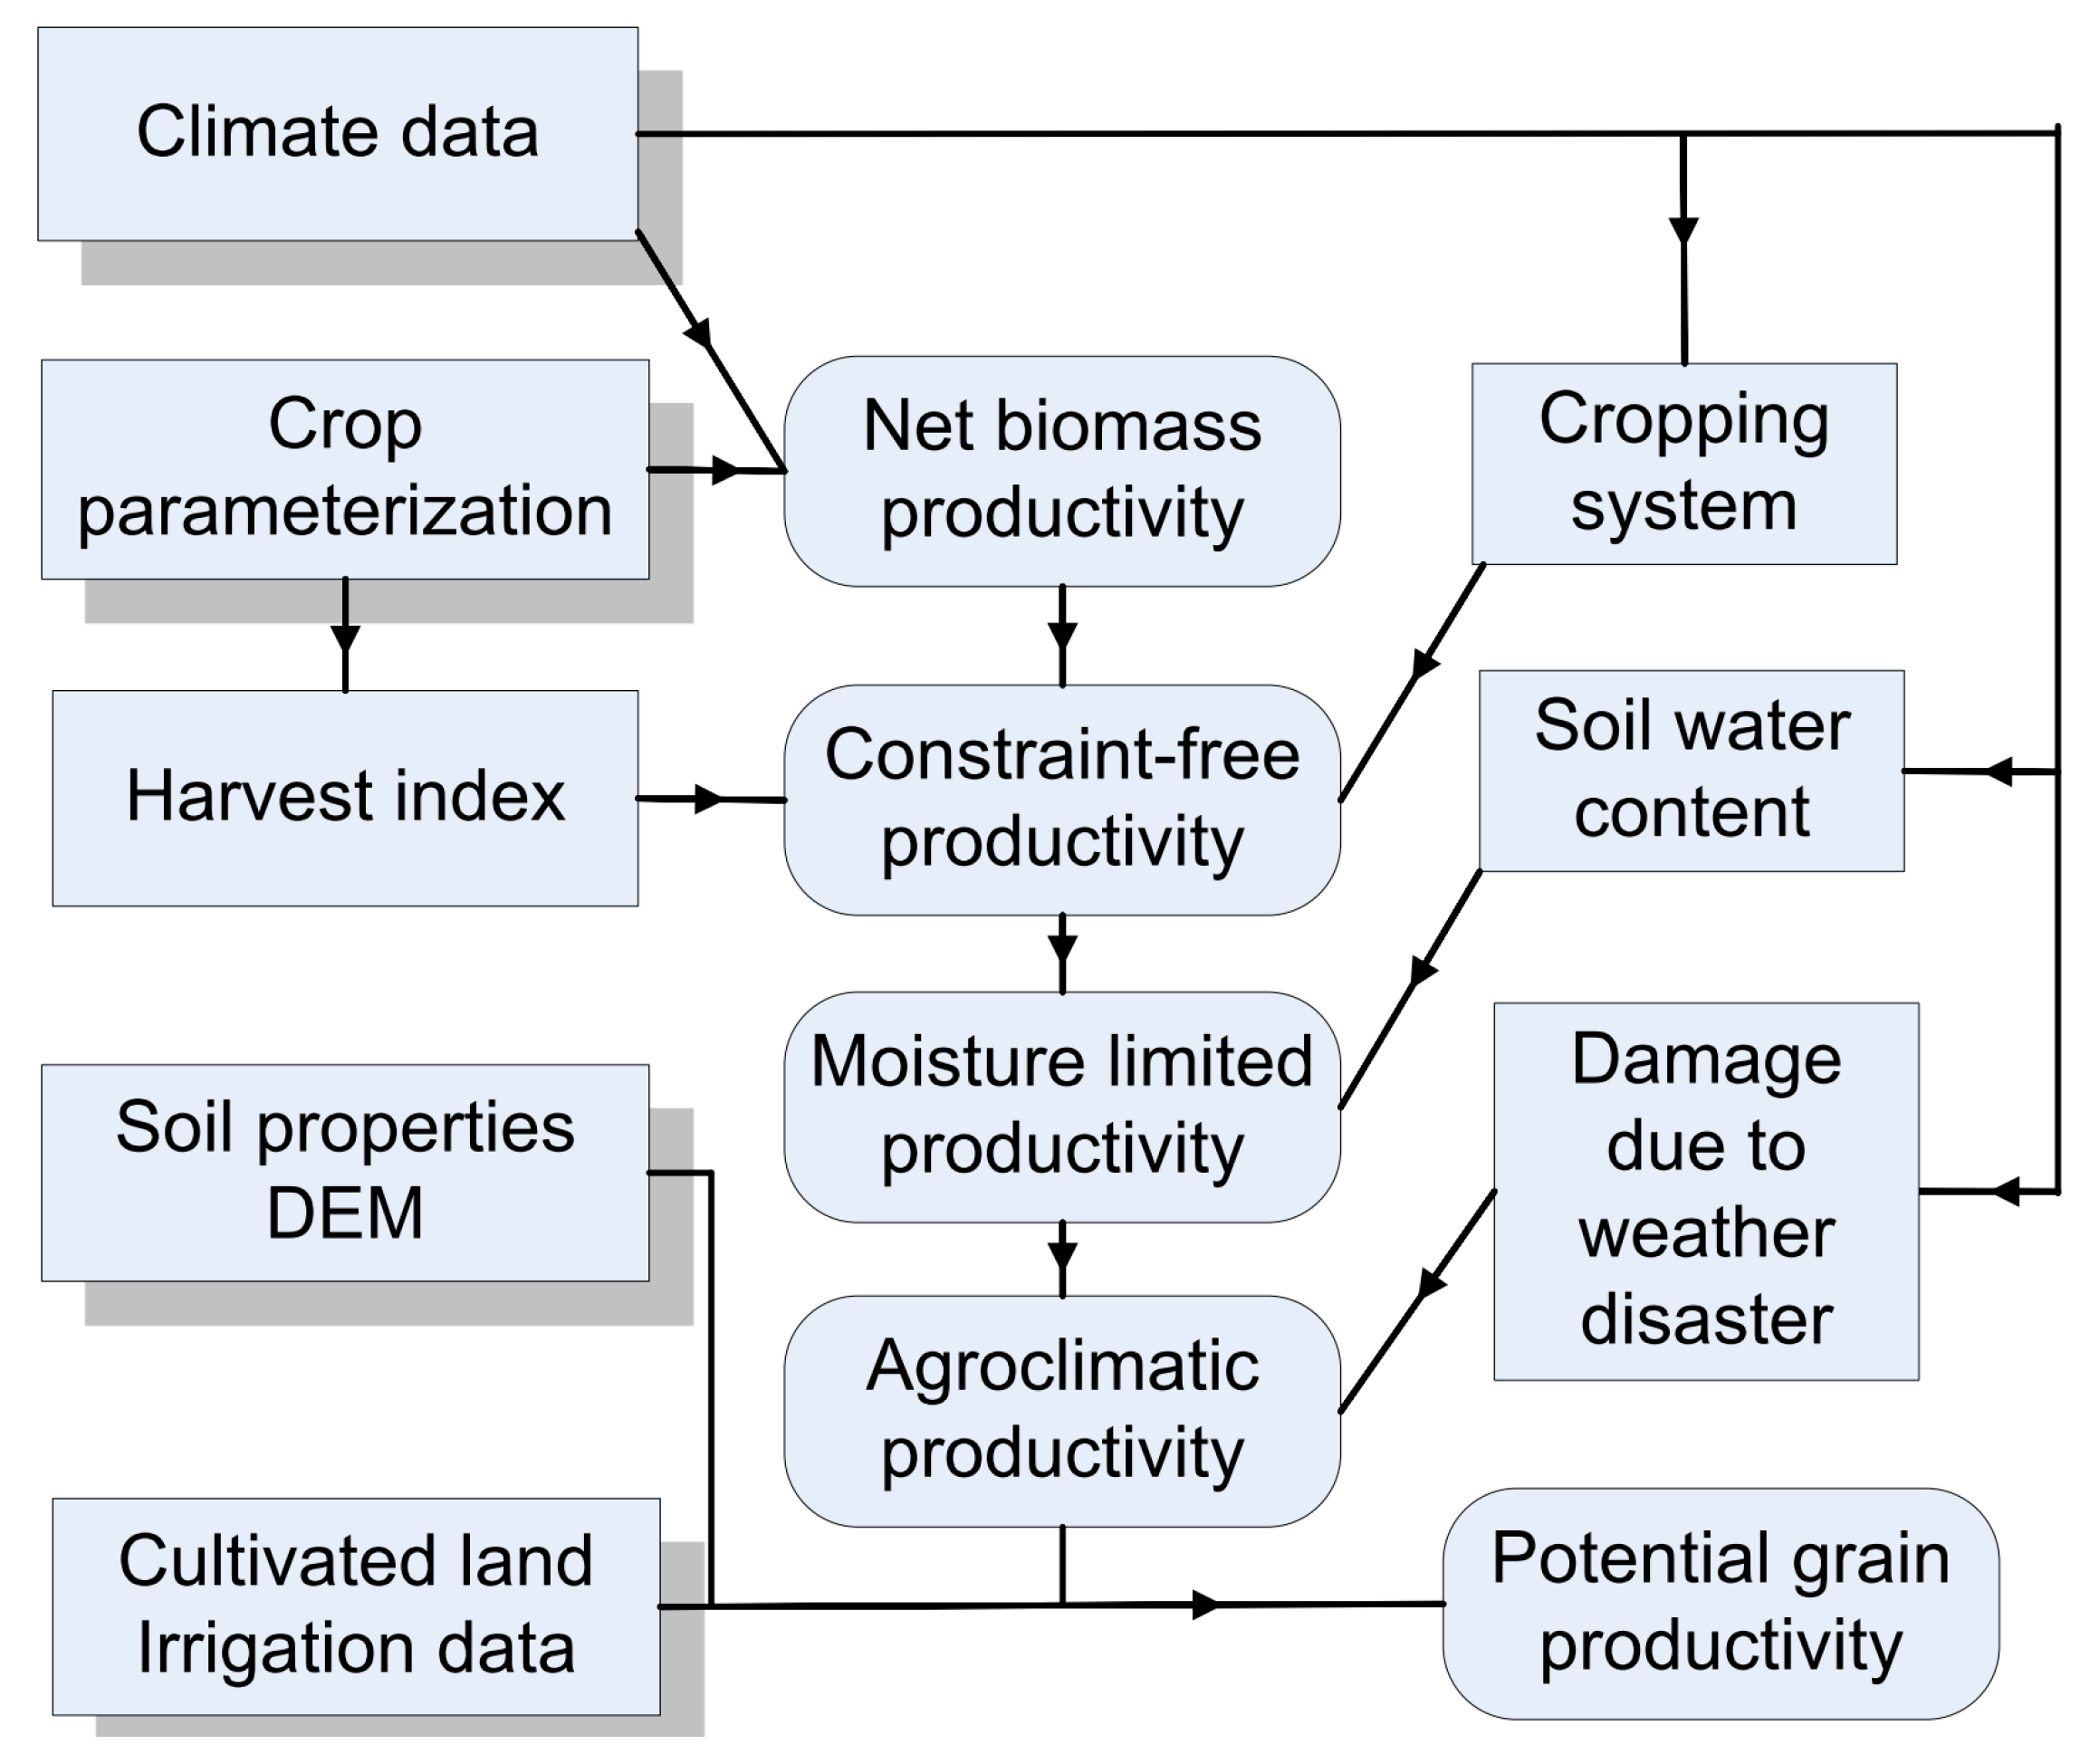
2.2.1. Potential Productivity Calculation

In collaboration with the International Institute for Applied Systems Analysis (IIASA), the Food and Agriculture Organization of the United Nations (FAO) developed the Agro-Ecological Zone (AEZ) methodology, which is commonly employed for calculating potential productivity [36]. In this study, the potential productivity of wheat, maize, rice, sweet potato, and soybean was simulated using the AEZ model. These five crops are characterized by the major crops, accounting for 97.7% of the total grain yield in China. Meteorological data, terrain elevation data, soil data, and cultivated land distribution data were applied as input data. The flowchart for calculating potential productivity employing the AEZ model is shown in Figure 1.
Figure 1. Flowchart for calculating the potential productivity employing the AEZ model; cells with round corners represent simulation results, and rectangles represent input data.
Sustainability 07 11893 g001
First, the net biomass productivity in one growing period was calculated on each grid cell using meteorological data (e.g., radiation levels and temperature profiles) and crop parameters in a simple crop growth model for each type of crop (wheat, maize, rice, sweet potato, and soybean). Second, the AEZ model computed the constraint-free productivity by selecting the optimal crop combinations using cropping systems and harvest index. China is one of the largest countries and has the highest multiple cropping systems (e.g., single per year, triple cropping per 2 years, double cropping per year and triple cropping per year). Therefore, there can be various crop combinations. The potential productivity of all possible combinations was simulated, and the optimal crop combinations with the highest potential productivity were selected for each grid cell. Last, moisture limited productivity, agroclimatic productivity and potential grain productivity were calculated successively with a set of reduction factors (e.g., soil water content, weather disaster, soil properties and terrain conditions). For example, the moisture limited productivity was computed by multiplying the constraint-free productivity by a correction coefficient of soil water content produced in the AEZ model.
The irrigated and rain-fed scenarios were considered to reveal the impact of water conditions. We supposed that the irrigated area had no water stress and its potential productivity was primarily determined by the availability of solar radiation and temperature. By contrast, the rain-fed potential yields were further limited by other factors (e.g., water availability, soil properties and terrains). We considered irrigated conditions to be appropriate for rice because most rice crops had been cultivated under irrigation in China. For other crops both irrigated and rain-fed conditions were considered. The equation used to calculate potential productivity within each grid cell under rain-fed and irrigated scenarios was as follows [37]:
T P   =   P r a i n f e d ×   ( 1 i )   +   P i r r i g a t e d ×   i
where TP is the production potential within each grid cell (kg/ha), Prain-fed is the yield under rain-fed scenarios within each grid cell (kg/ha), Pirrigated is the yield under irrigated scenarios within each grid cell (kg/ha), and i (%) is the ratio of irrigation-cultivated area to total cultivated area based on official statistics from the National Bureau of Statistics of China.
The potential productivity was simulated only on cultivated land, and areas that are highly susceptible to erosion were excluded to guarantee sustainable production [34,38]. There are various factors affecting potential productivity. To reveal the effects of cultivated land change on potential productivity in Mainland China, the average climate conditions from 2009 to 2012 were calculated to eliminate fluctuations, and other factors (with the exception of cultivated land) were assumed to be constant.

2.2.2. Evaluation Method for Changes in Potential Productivity

Differences exist between the total agricultural potential productivity estimated using the AEZ methodology and the actual grain yield. While the AEZ measures the “potential”, the actual grain yields generally published as statistical sources measure the realization of that potential. In other word, actual yield stands for the developed potential productivity. Unfortunately, statistics of the actual yield are available only for administrative units, not at the pixel level in which the process of cultivated land conversion occurs. Therefore, we selected provincial administrative districts as the research unit. The changes in cultivated land and potential productivity were also aggregated at the provincial level to integrate the data of actual yield. For a given province, the remaining potential can be calculated by the follow equation:
R P y e a r j = T P y e a r j D P y e a r j
where RP is the remaining potential, TP is the total potential, DP is the developed potential, and j is the serial number of the province. The utilization degree of total potential productivity (UTP) is proposed as:
U T P y e a r j = D P y e a r j T P y e a r j × 100 %
To reveal the characteristics of change in UTP between 2009 and 2012 in each province, a ratio of UTP2012/UTP2009 (RUTP) was calculated. Theoretically, for a given province, when RUTP > 1, it illustrates that the utilization of potential productivity could be further intensified; when RUTP < 1, it shows an alleviation of potential productivity utilization; when RUTP = 1, the utilization degree of potential productivity remains unchanged.

3. Results and Discussions

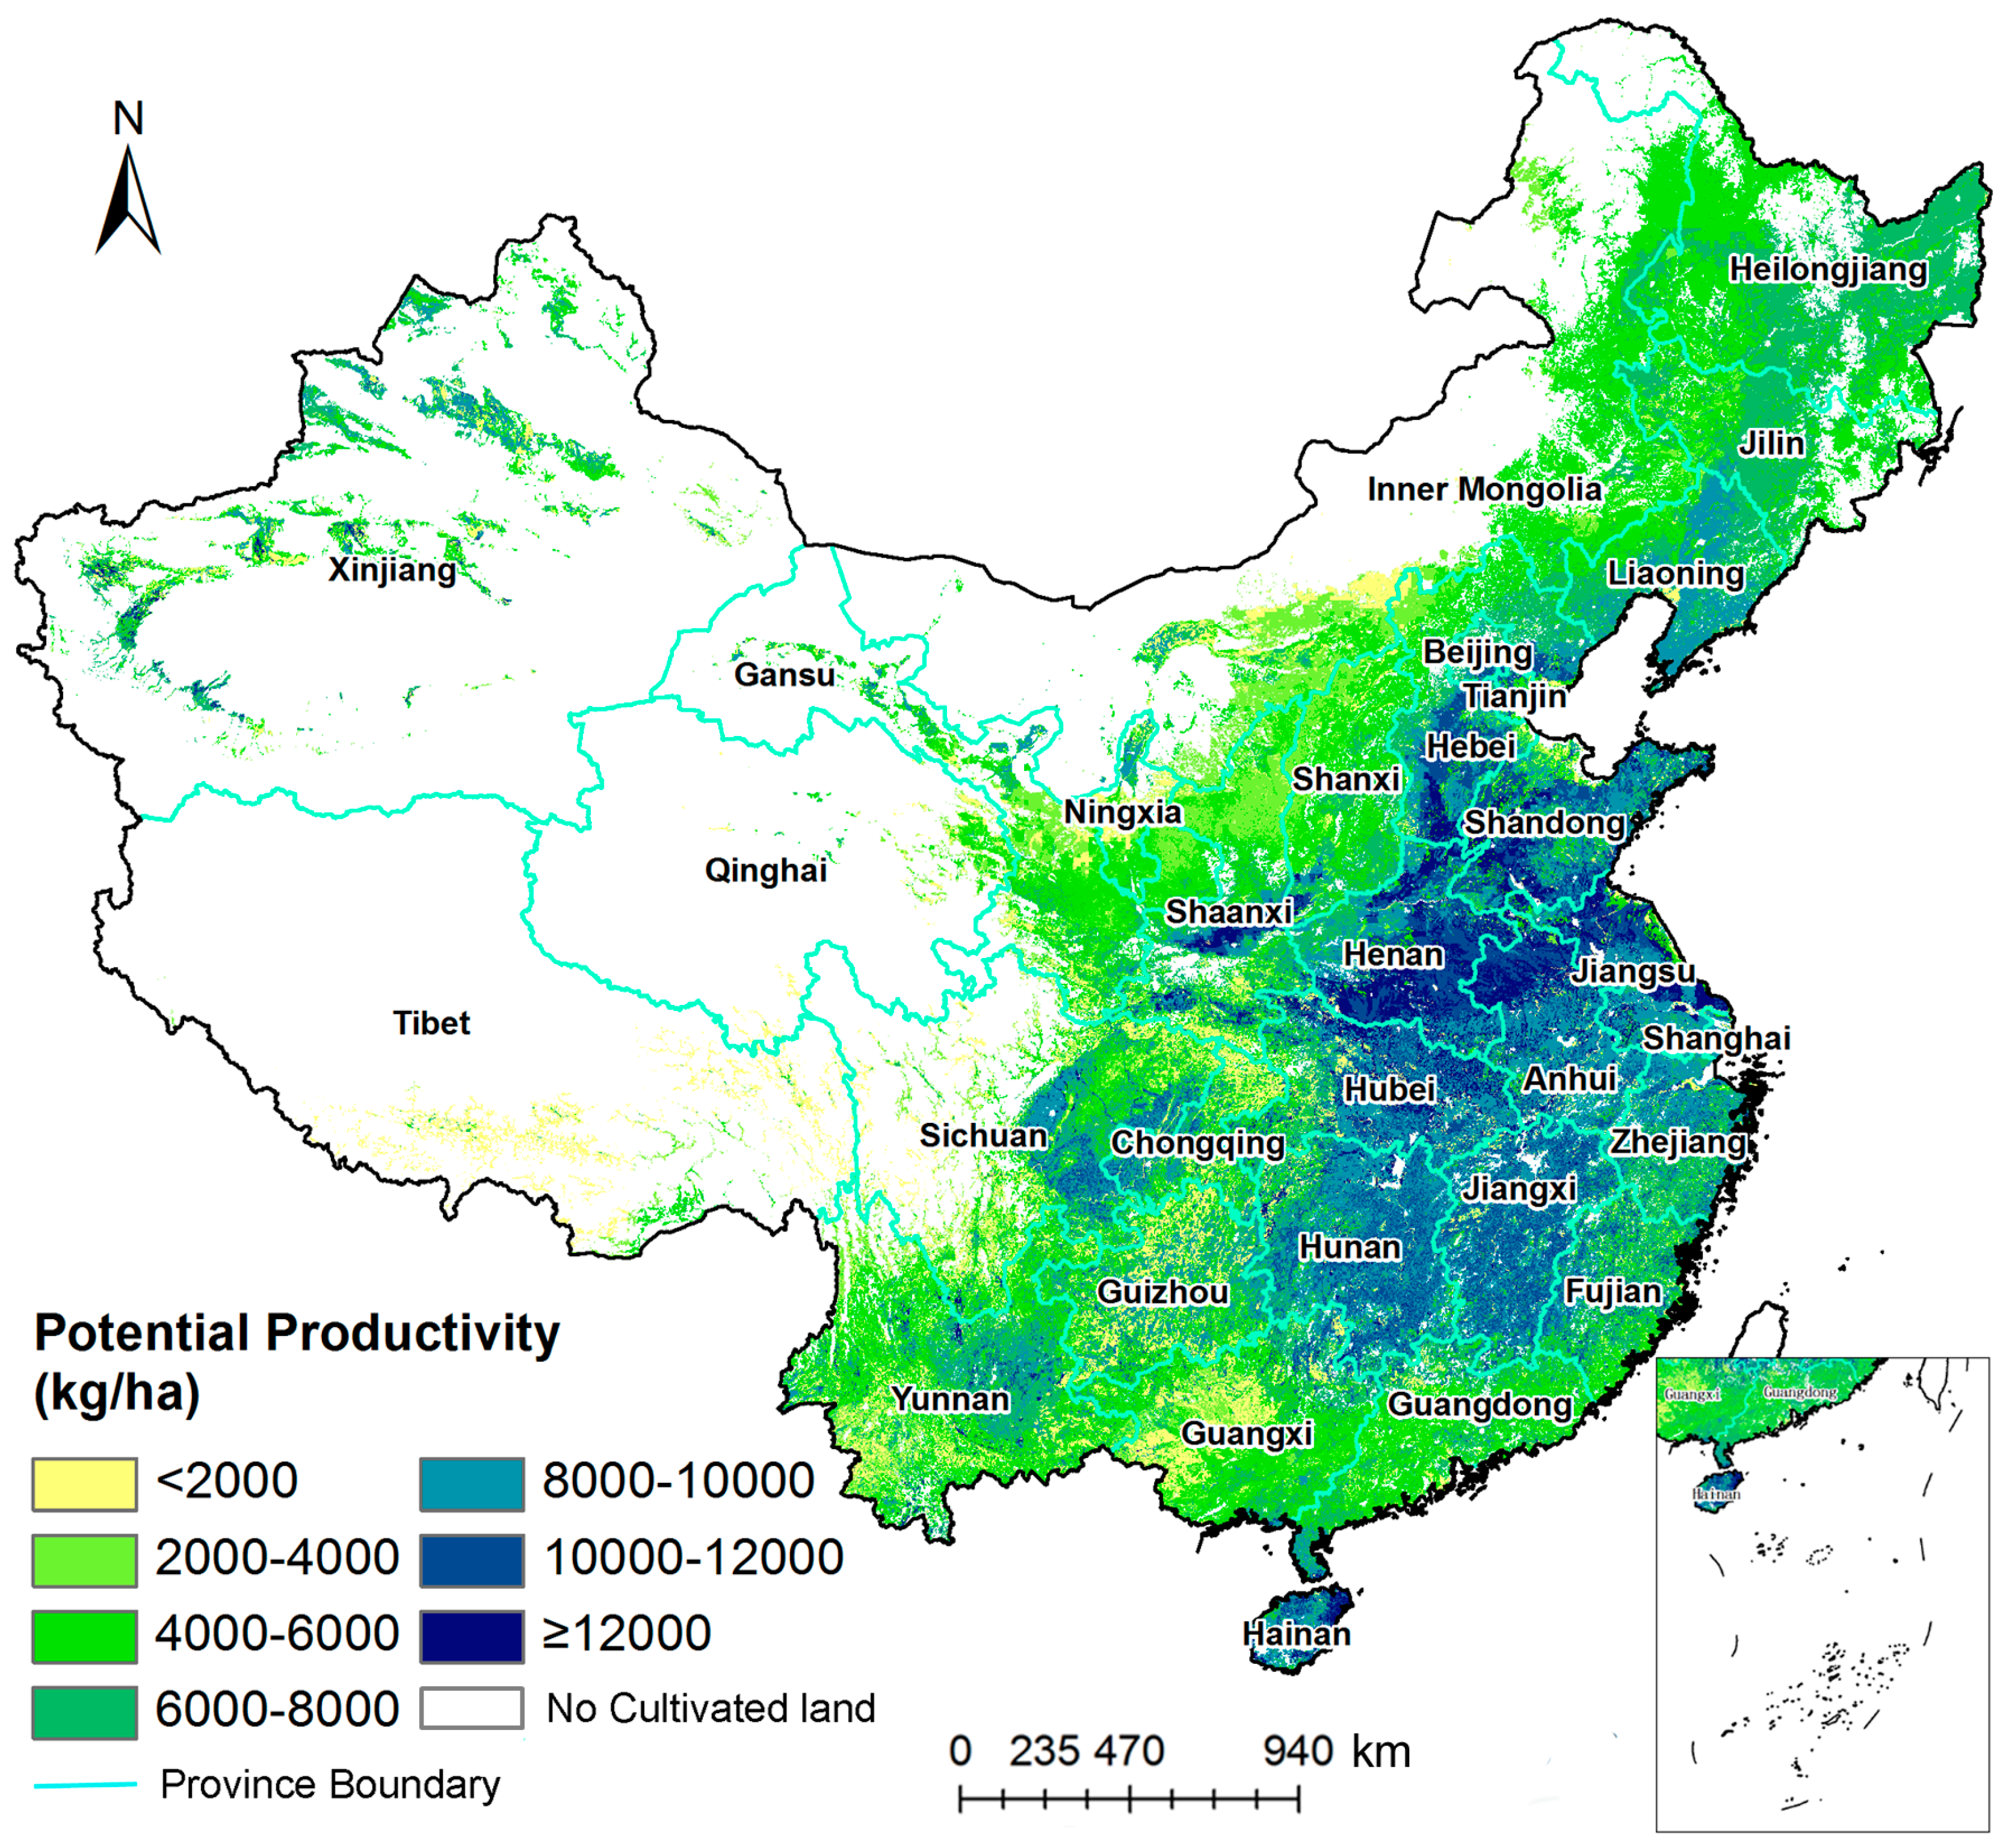
3.1. Potential Productivity of Mainland China in 2012

When the simulation of potential productivity was completed, it was essential to verify the availability of those results for research purposes. According to previous studies, there is a fairly high linear correlation between the estimated potential and actual grain yield [35,39]. To demonstrate this, a correlation analysis between the estimated potential of 2012 and actual grain yield reported in official statistics for 2012 was performed. As shown in Figure 2, the determination coefficient was 0.88, indicating a good correlation between the estimated potential and actual grain yield. Consequently, the trend of the estimated potential productivity reflected, to a great extent, the trend of the actual yield. Hence, we believe that, in some small way this legitimizes the use of the AEZ methodology for the case of Mainland China.
Figure 2. Comparison between the potential and actual production in each county in 2012; the dashed red line is a linear regression line of actual production (X) and potential productivity (Y); the green line is a 45 degree diagonal line.
Sustainability 07 11893 g002
According to our estimates, the total potential productivity was 1.0 billion and 0.94 billion tons for 2009 and 2012, respectively. Figure 3 presents the distribution of potential agricultural productivity for 2012. An imbalance is reported as its main overall characteristics. Henan, Heilongjiang, Shandong, Anhui, Hubei, Hebei, Jiangsu, Sichuan, and Hunan were the provinces with the most potential productivity; 88.91, 79.95, 69.49, 63.38, 53.19, 51.80, 46.55, 45.41, and 41.30 million tons, respectively. These nine provinces accounted for 57.4% of the total potential productivity of Mainland China. Meanwhile, the nine provinces with the least potential productivity were Tibet, Shanghai, Qinghai, Beijing, Tianjin, Ningxia, Hainan, Fujian and Chongqing (0.96, 1.60, 1.88, 1.89, 3.14, 5.17, 7.90, 9.70 and 16.02 million tons, respectively), accounting for merely 5.2% of the total potential productivity.
Figure 3. Distribution of potential agricultural productivity in China in 2012 (kg/ha).
Sustainability 07 11893 g003

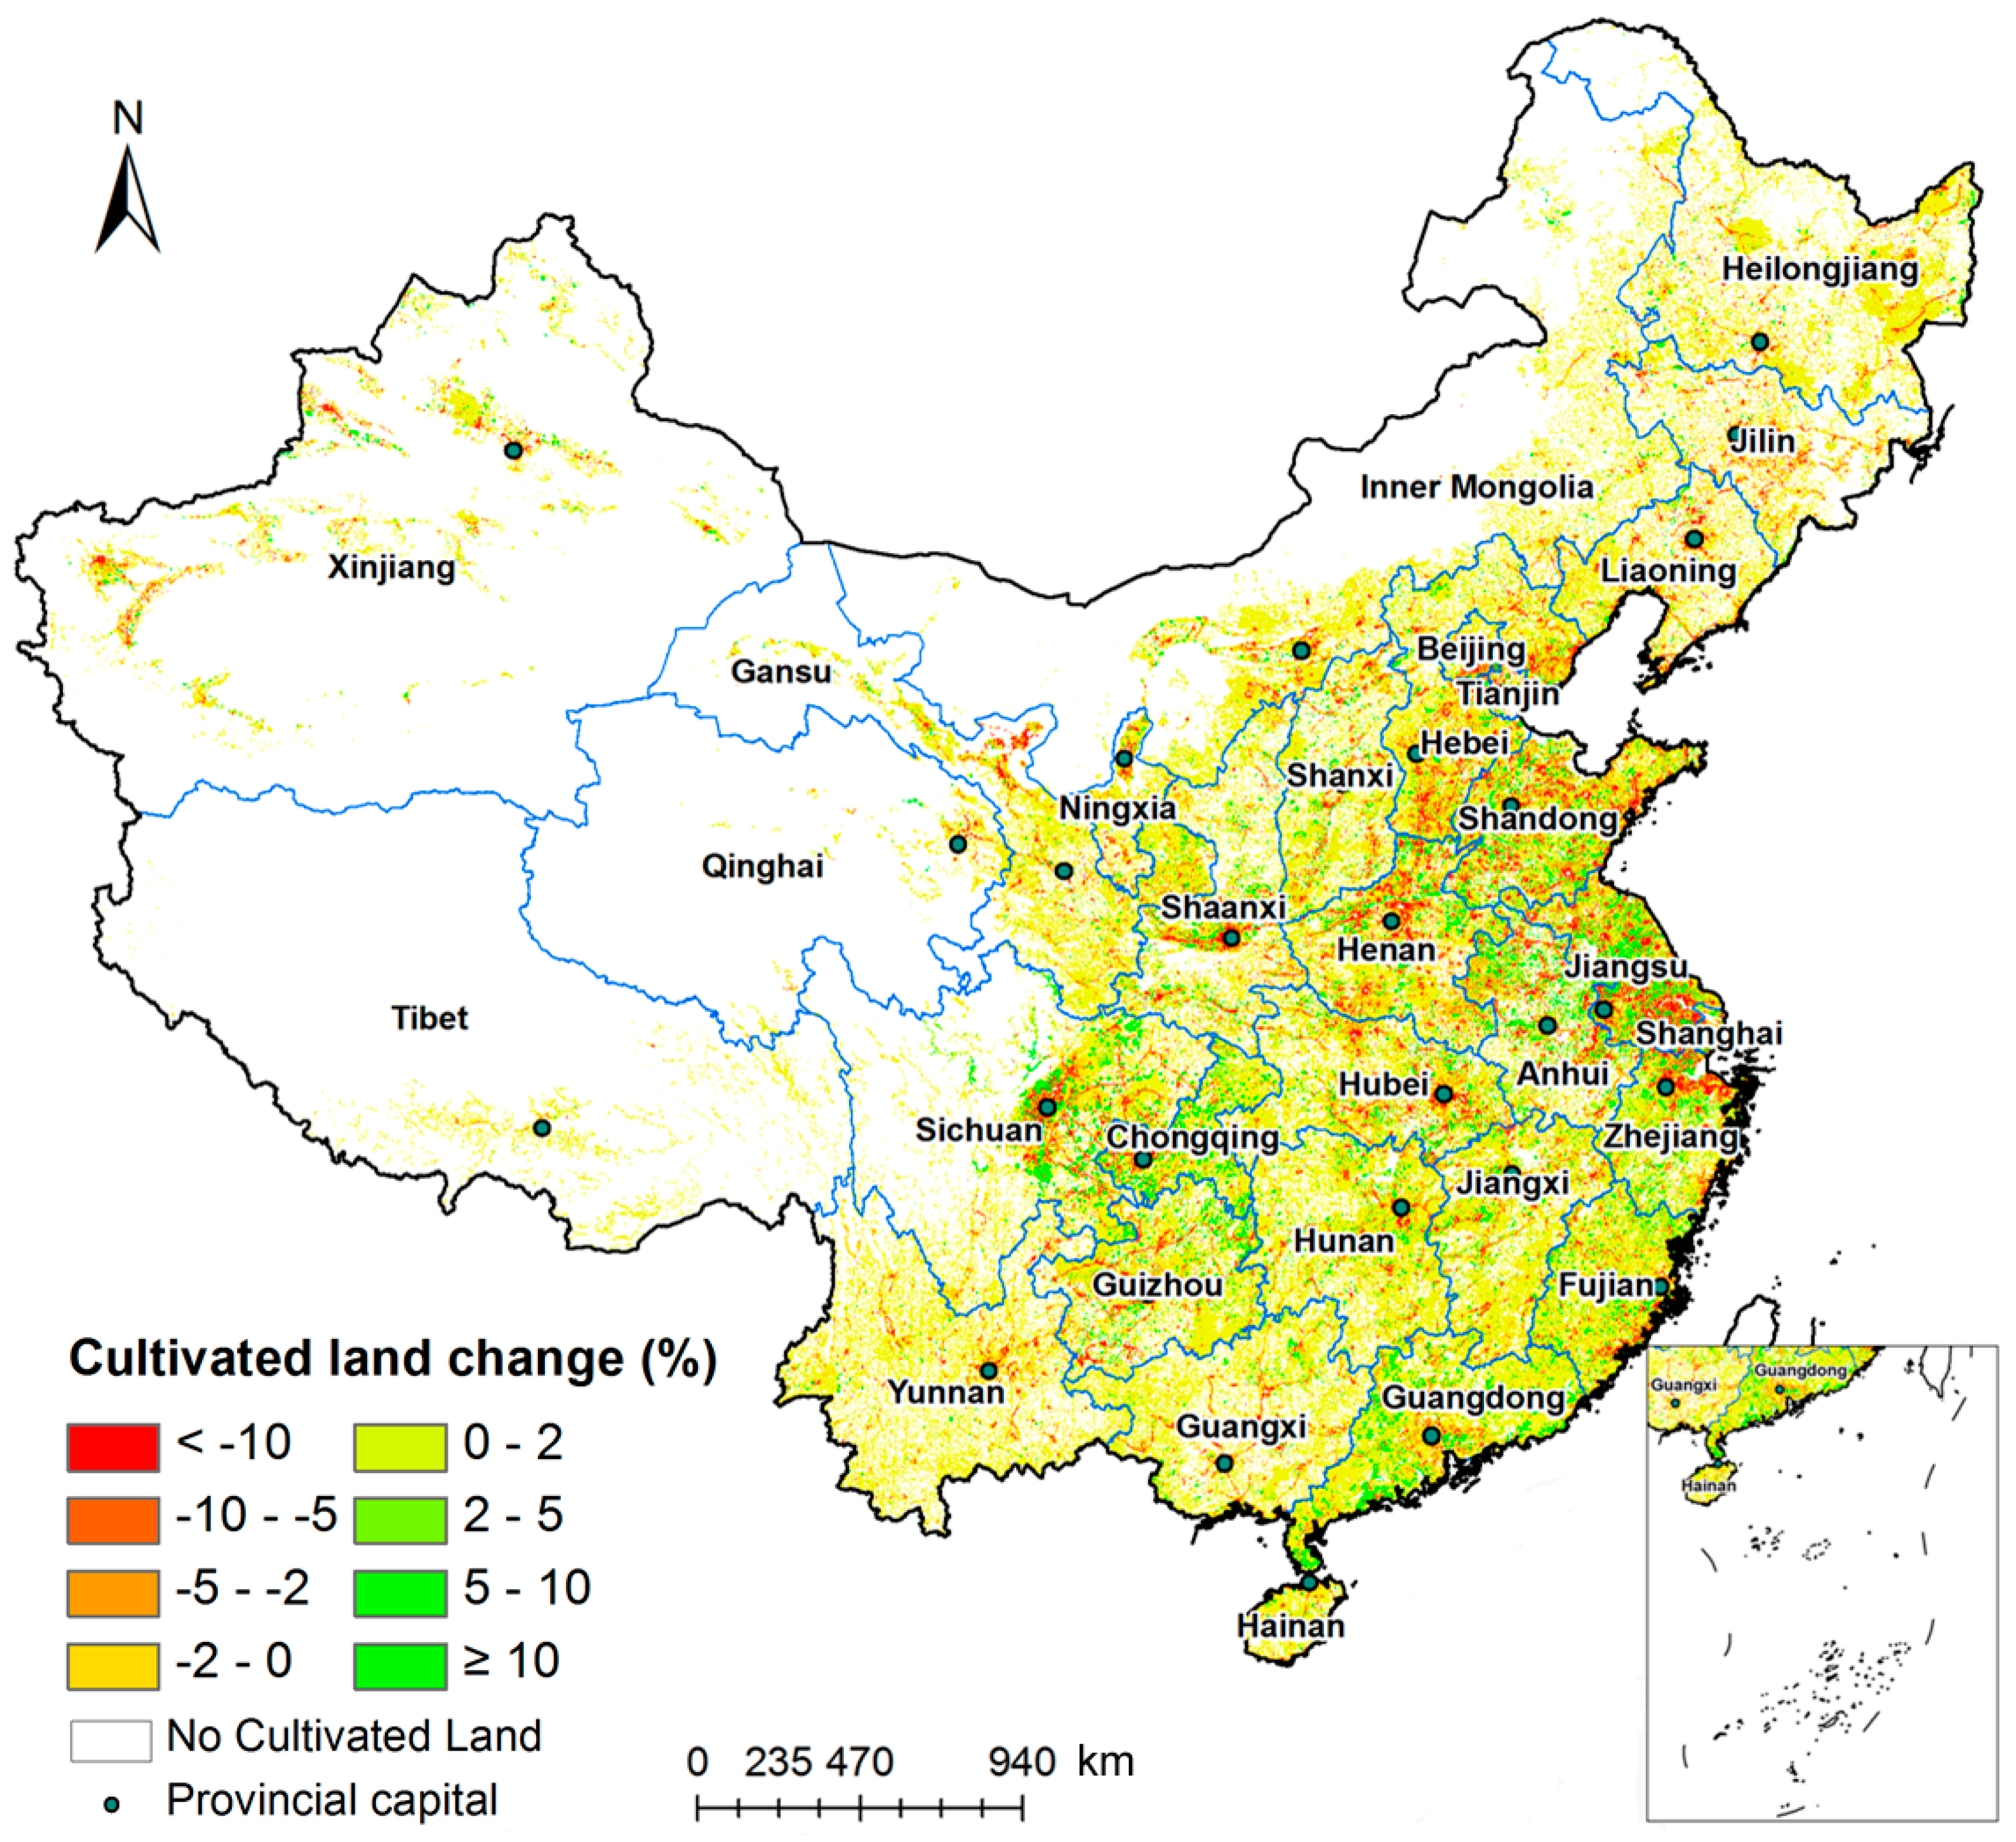
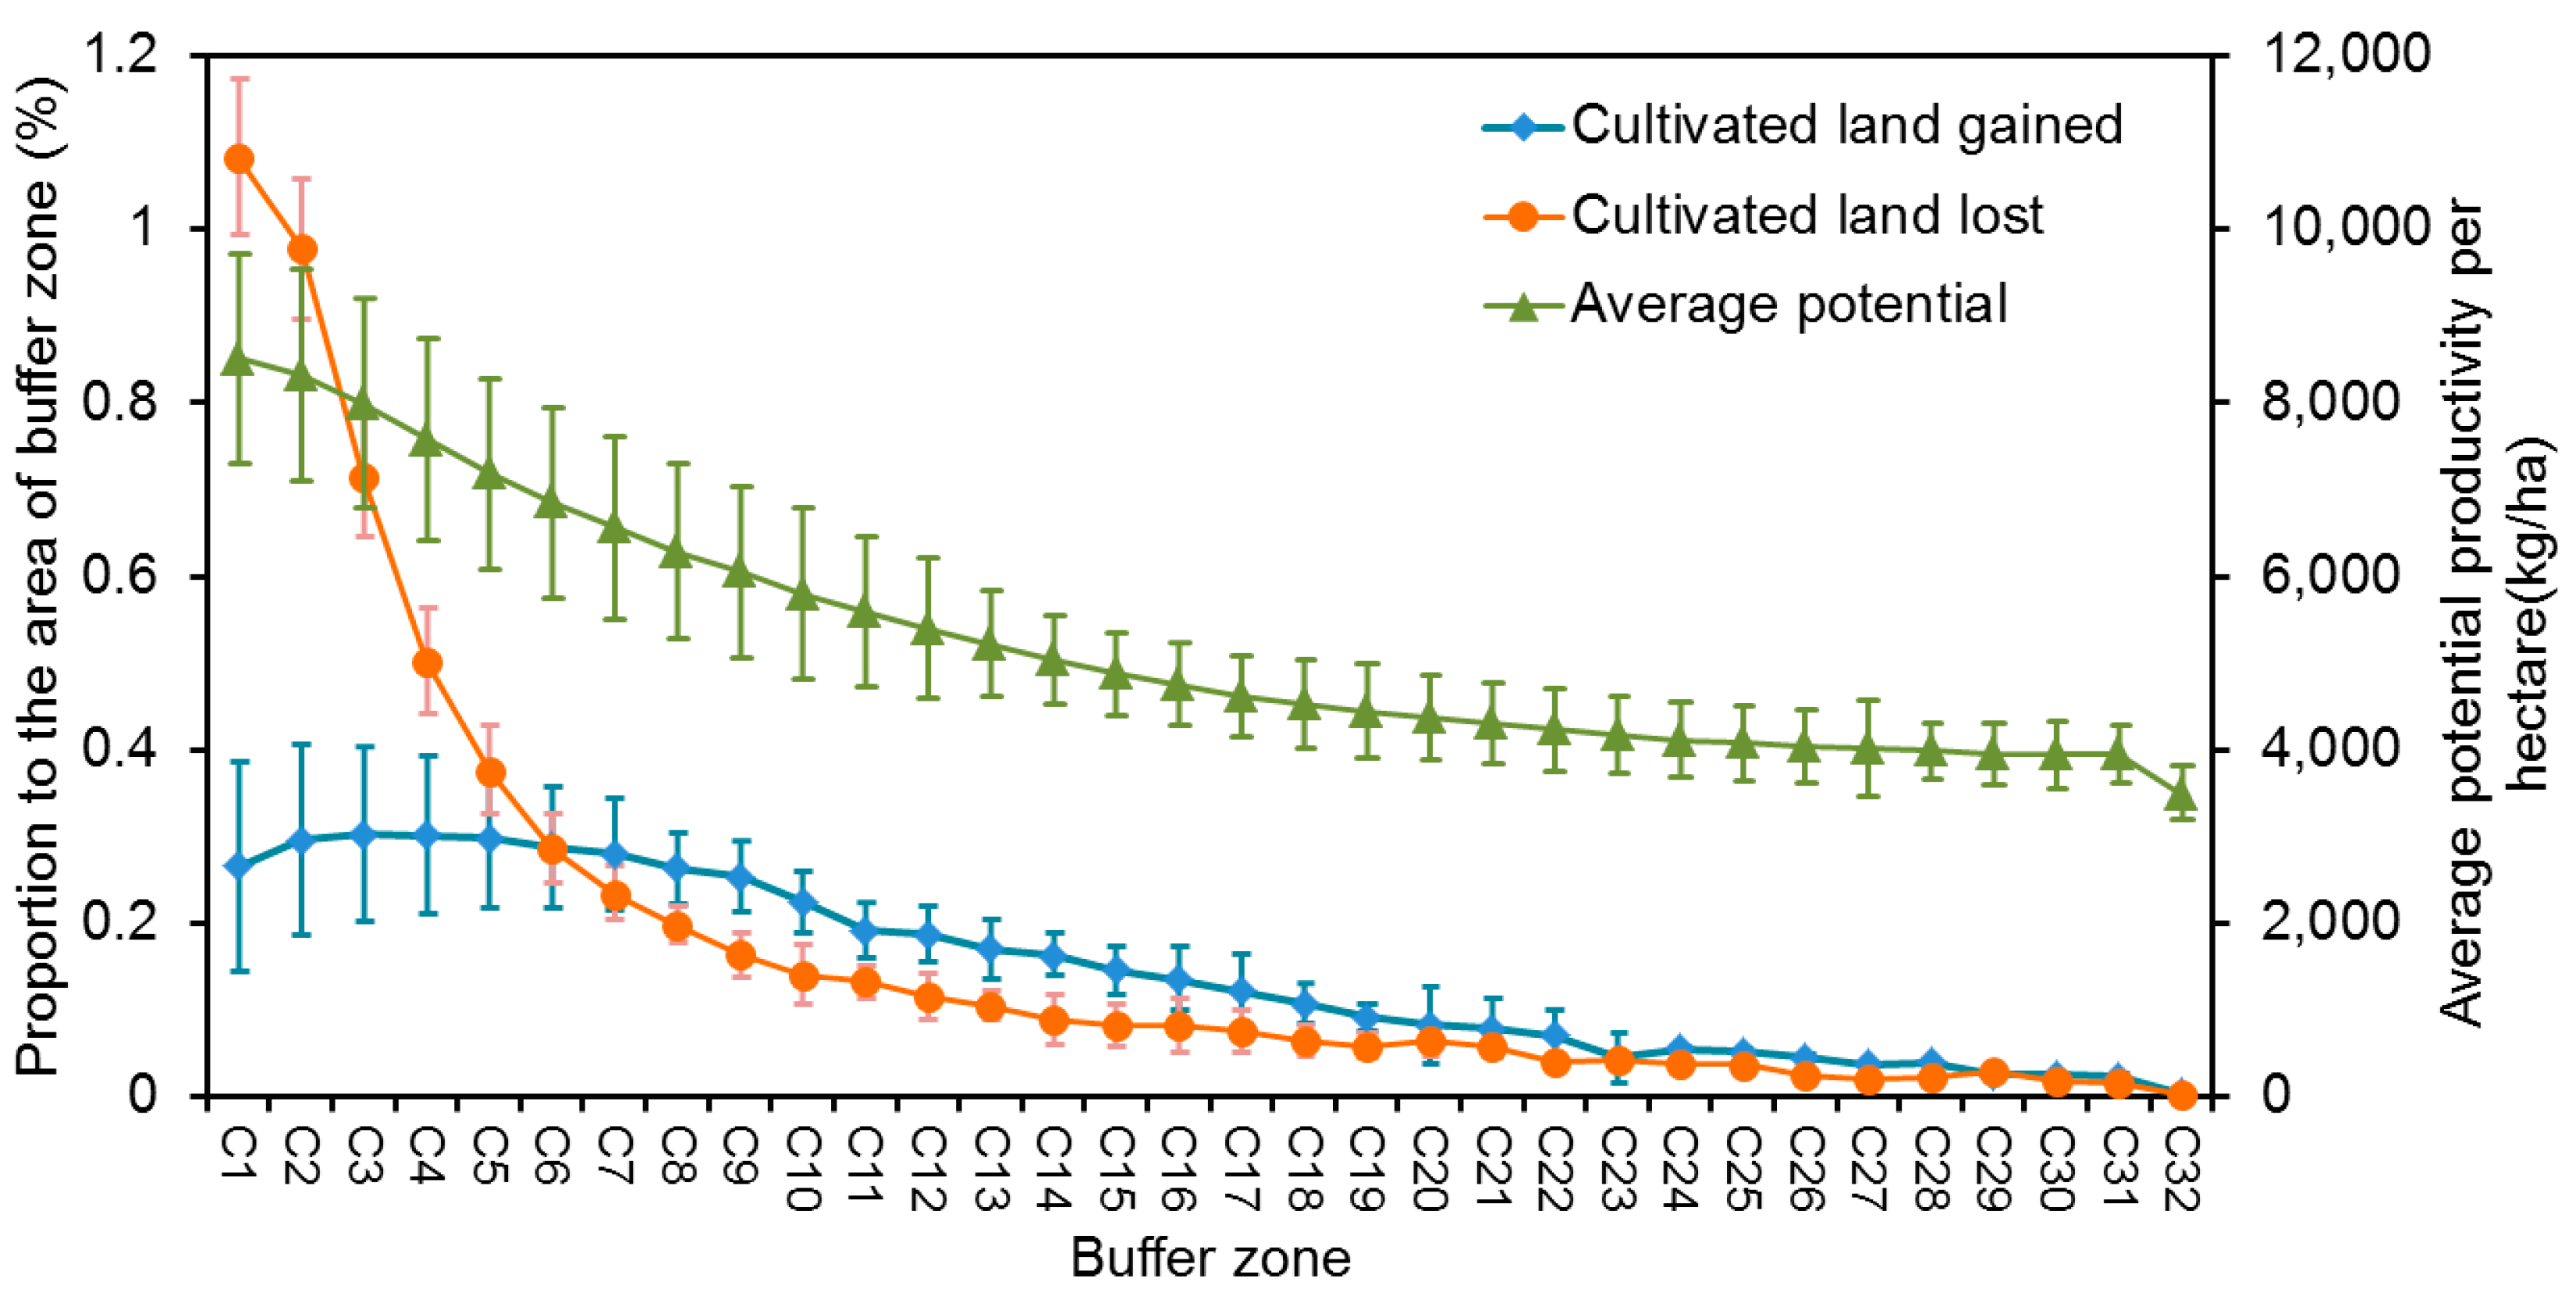
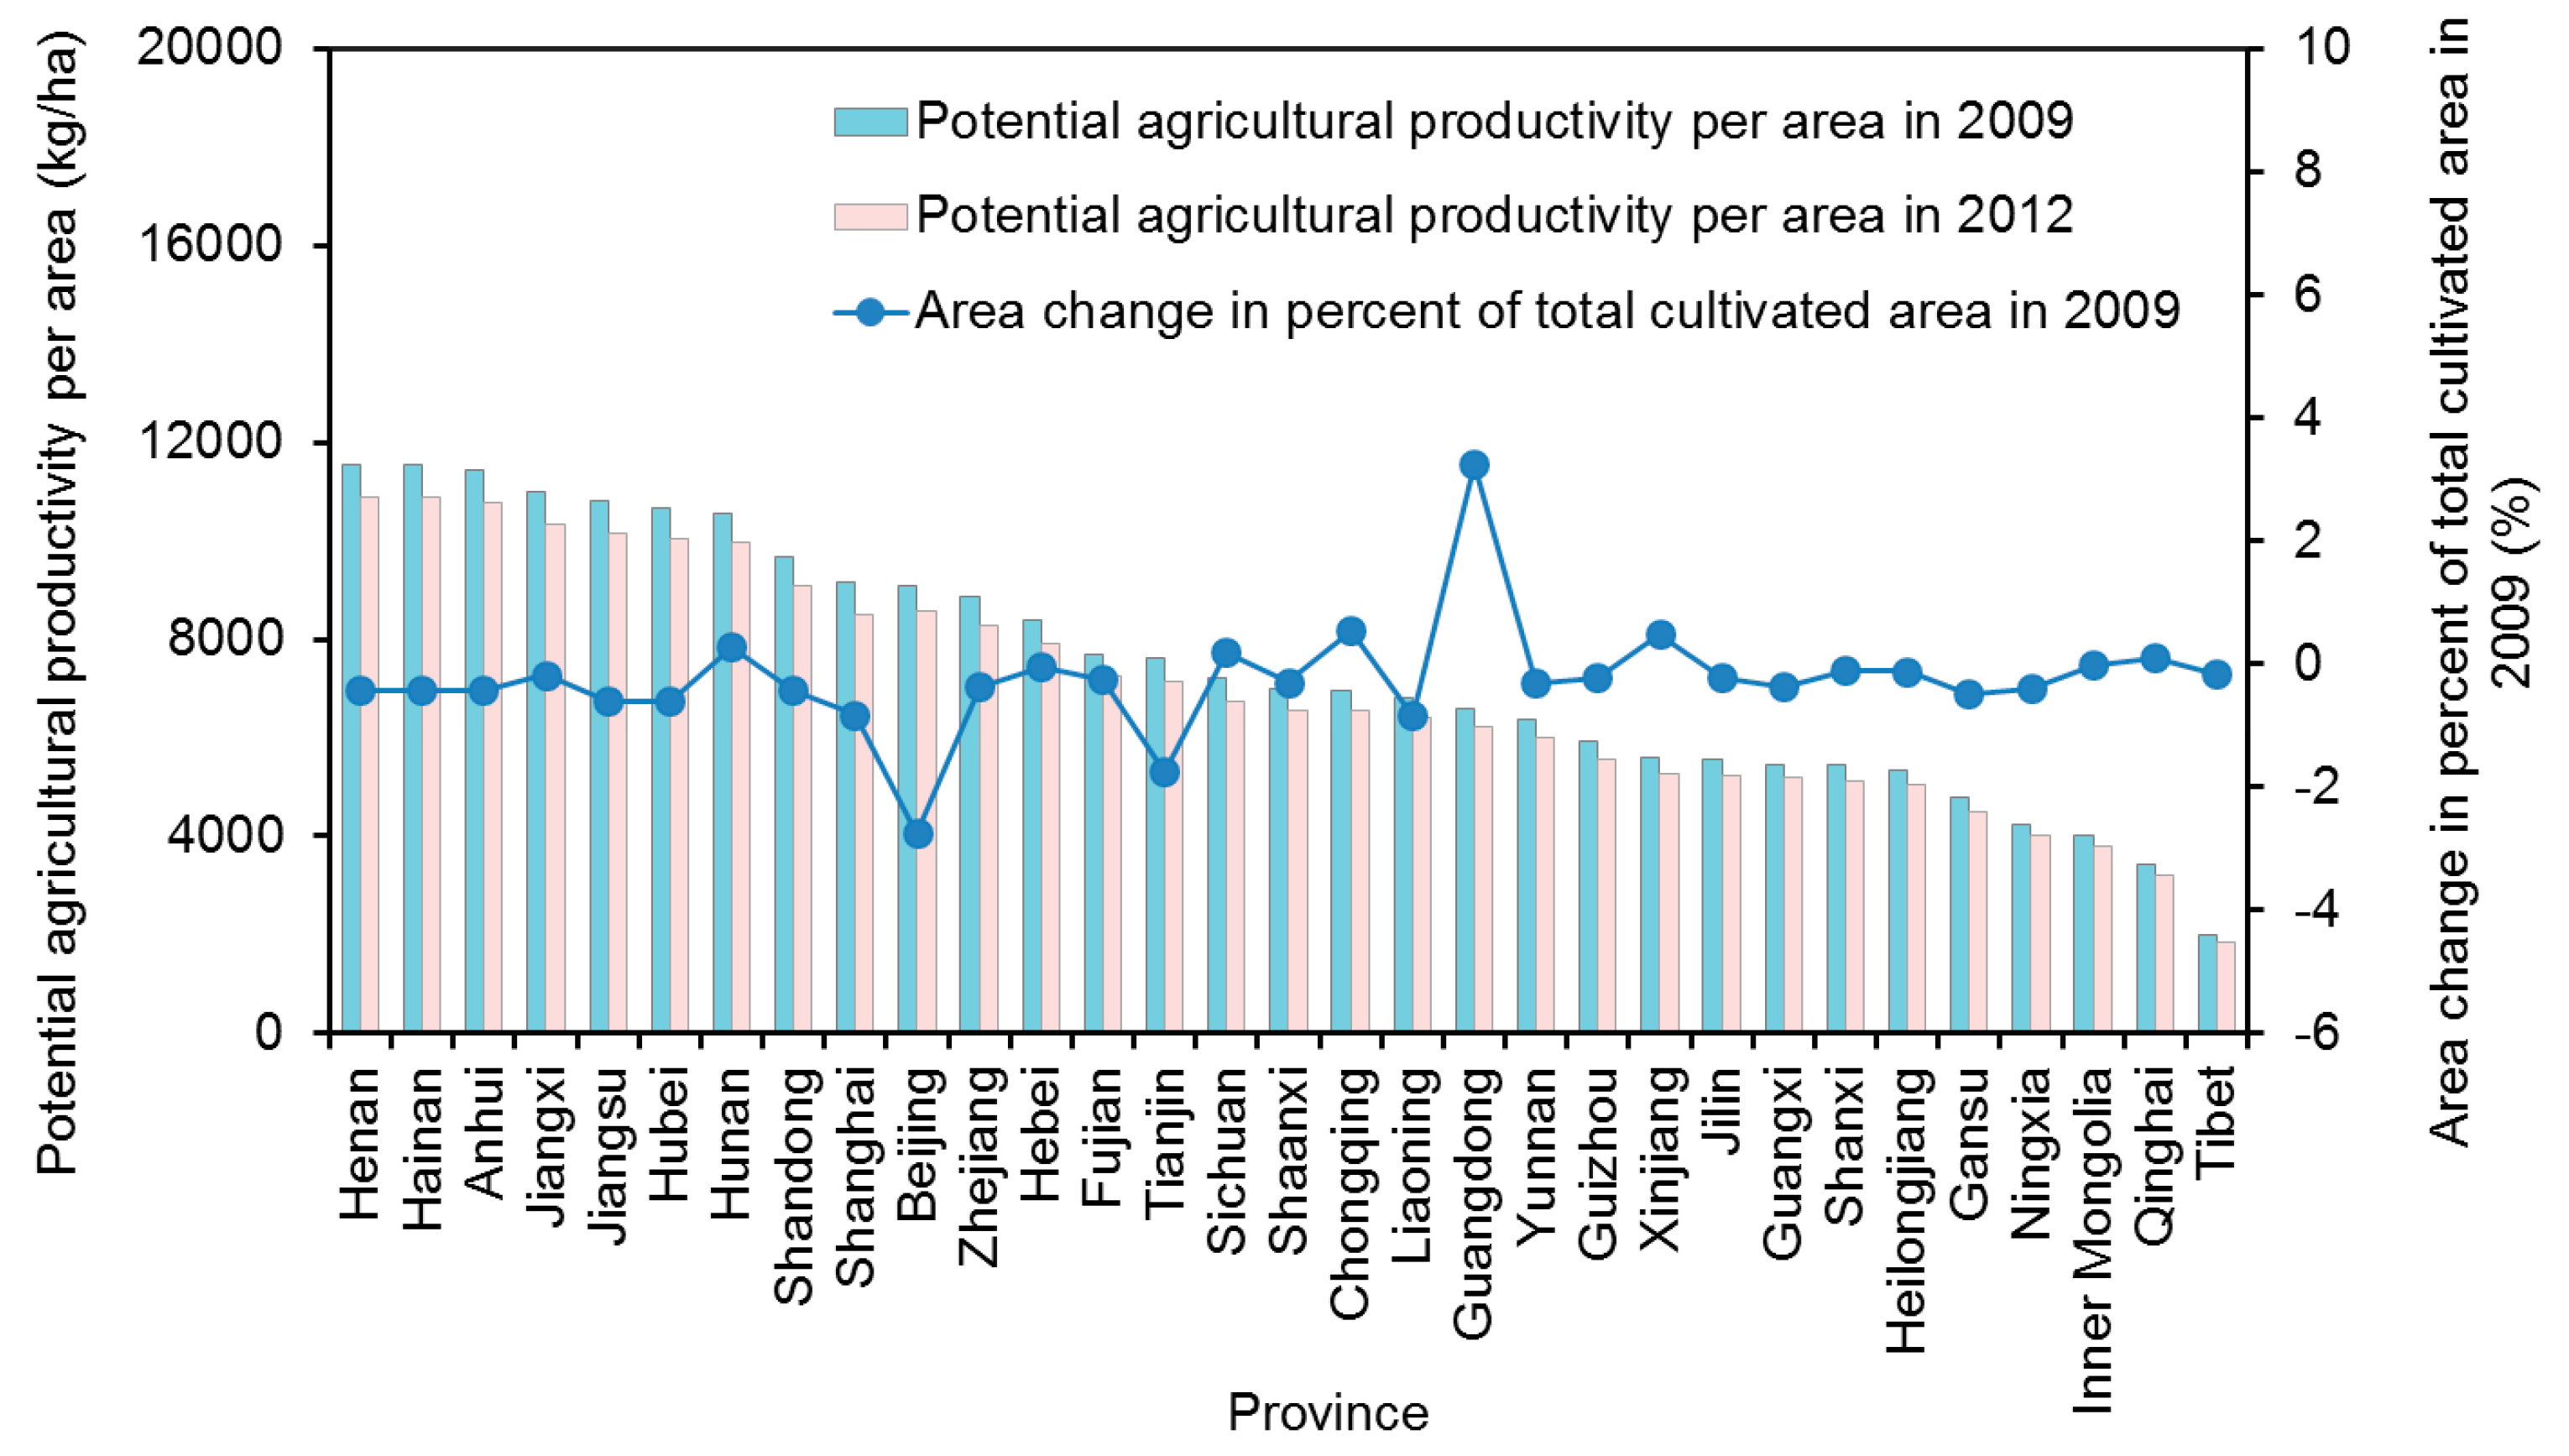
3.2. Changes in Cultivated Land and Their Influence on Potential Productivity

The total area of cultivated land for 2009 and 2012 was 135.38 and 135.15 million ha, respectively. The net decrease was merely 0.17%. The spatial change in cultivated land was achieved by subtracting the cultivated land of 2009 from that of 2012 in a geographical information system (GIS) environment. A negative value represents a net decrease of cultivated land, and a positive value represents a net increase. We supposed that a pixel characterized by a net decrease experienced only a loss of cultivated land, no gain, and vice versa. As seen from Figure 4, there was an obvious change in the spatial pattern of cultivated land in the year 2012 compared with that in 2009.
Figure 4. Percentage change in cultivated land (%).
Sustainability 07 11893 g004
We overlaid the point features standing for capital cities on the map of cultivated land change. As illustrated in Figure 4, cultivated land loss was more likely to occur near capital cities. We applied the spatial analysis function of GIS to mine the deeper spatial relationship between major cities and the change in cultivated land. A map of Euclidean distance to cities was generated at a spatial resolution of 1 km × 1 km. Pixels with values of Euclidean distance ranging from 0 to 960 km were then reclassified into 32 zones at intervals of 30 km. In another words, 32 buffer zones were created every 30 km away from the core of cities. We coded the 32 buffer zones, from the nearest to the farthest from cities, as C1, C2, C3,…, and C32, respectively. According to our statistics, 99.2% of the total cultivated land was distributed in those buffer zones in 2012. For each buffer zone, the proportion of cultivated land lost to the area of the buffer zone was calculated, as was the cultivated land gained. The average potential productivity per hectare was also computed.
According to the trends of broken lines for both cultivated land gained and lost (Figure 5), the 32 buffer zones can be classified into two groups. The first group includes six zones (from C1 to C6), in which there is an immediate decrease of the proportion of cultivated land lost to the area of the buffer zone (max. 1.1%, min. 0.28%) and an almost constant level for cultivated land gained (max. 0.30%, min. 0.26%). The second group includes the remaining zones, in which there is a slight decrease of both cultivated land lost and gained. In the first group, there is more cultivated land lost than that gained, while, in the second group, the opposite is true. As regards the average potential productivity per hectare of cultivated land, it decreases constantly with the increasing distance to cities (max. 8510 kg/ha, min. 3494 kg/ha). According to the above, we can determine that the cultivated land surrounding the cities has been diminishing and that the cultivated land compensation has occurred generally far away from cities (approximate 180 km away from cities). To some extent, the cultivated land lost possesses higher quality than that gained.
Figure 5. Change in cultivated land and mean potential in different buffer zones (bars represent standard deviation).
Sustainability 07 11893 g005
This spatial relationship of cities and cultivated land changes indicates the existence of a nationwide conflict between urban expansion and the protection of highly productive cultivated land. Undoubtedly, smooth topography, convenient transport facilities, and abundant water resources are the basic conditions required for high quality cultivated land [9,37]. However, areas possessing those superiorities are also preferred for urban expansion [2,40,41,42]. Research demonstrates that the urban expansion has been inevitable in recent decades [2]. The cultivated land balance policy, however, is obligatory [5]. Consequently, the compensation of cultivated land tends to occur at remote areas with low production conditions, which may provide a rational explanation for the spatial relationship between cities and cultivated land changes found in our study.
Based on our statistics, the average potential productivity per hectare decreased from 7386.5 kg/ha in 2009 to 6955.2 kg/ha in 2012 because of the cultivated land changes. As regards the provincial level, there was a uniform decrease of total potential productivity and the average potential productivity per hectare (Figure 6). Actually, the decrease in average potential productivity per hectare triggered by cultivated land change is a long-standing problem [39,43,44,45]. By combining previous studies, we obtained three overall stages. Stage one (1986–1998): A net increase of cultivated land almost offset the decrease in average potential productivity per hectare, causing little decrease in total potential productivity [39]. Stage two (1999–2008): An achieved quantity balance for cultivated land could not offset the decrease in average potential productivity per hectare overall. Nevertheless, there were still some places (e.g., Heilongjiang and Xinjiang) that were helped by a considerable expansion in cultivated land and did not experienced any harm to their total potential productivity [6,8]. Stage three (2009–2012): According to our study, there was a nationwide decrease in cultivated land. The total potential productivity decreased in all provinces. Consequently, we can safely draw the conclusion that despite the relatively stable quantity of cultivated land, the average potential productivity per hectare decreased continuously, and the total potential productivity began to generally decrease from 2009.
Figure 6. Area change of cultivated land and potential productivity per area in each province.
Sustainability 07 11893 g006

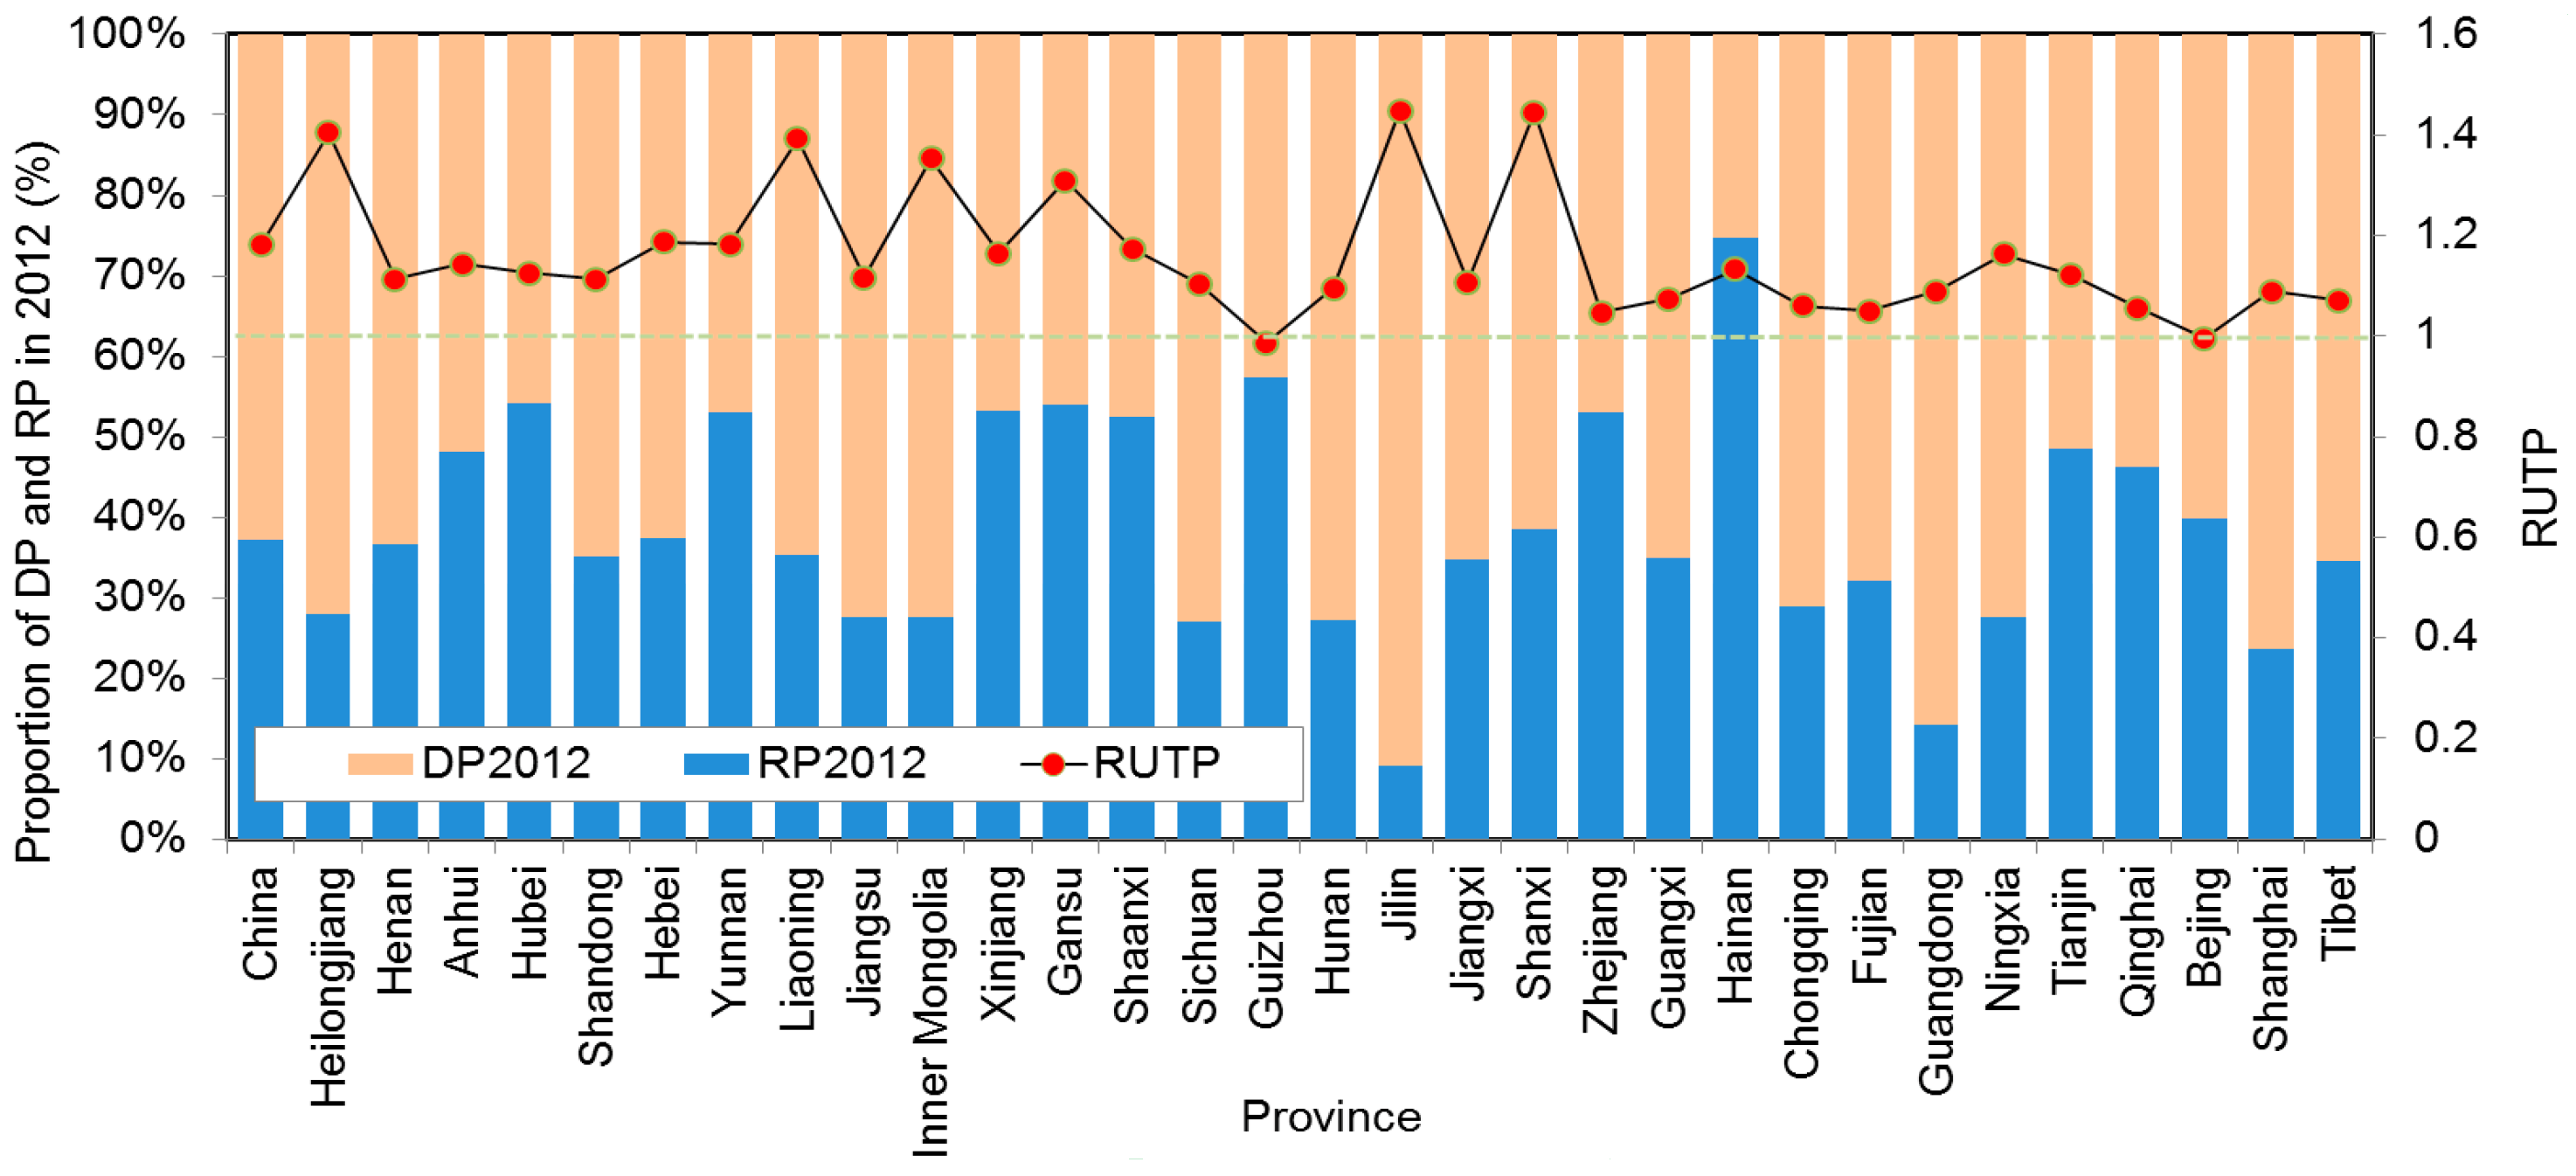
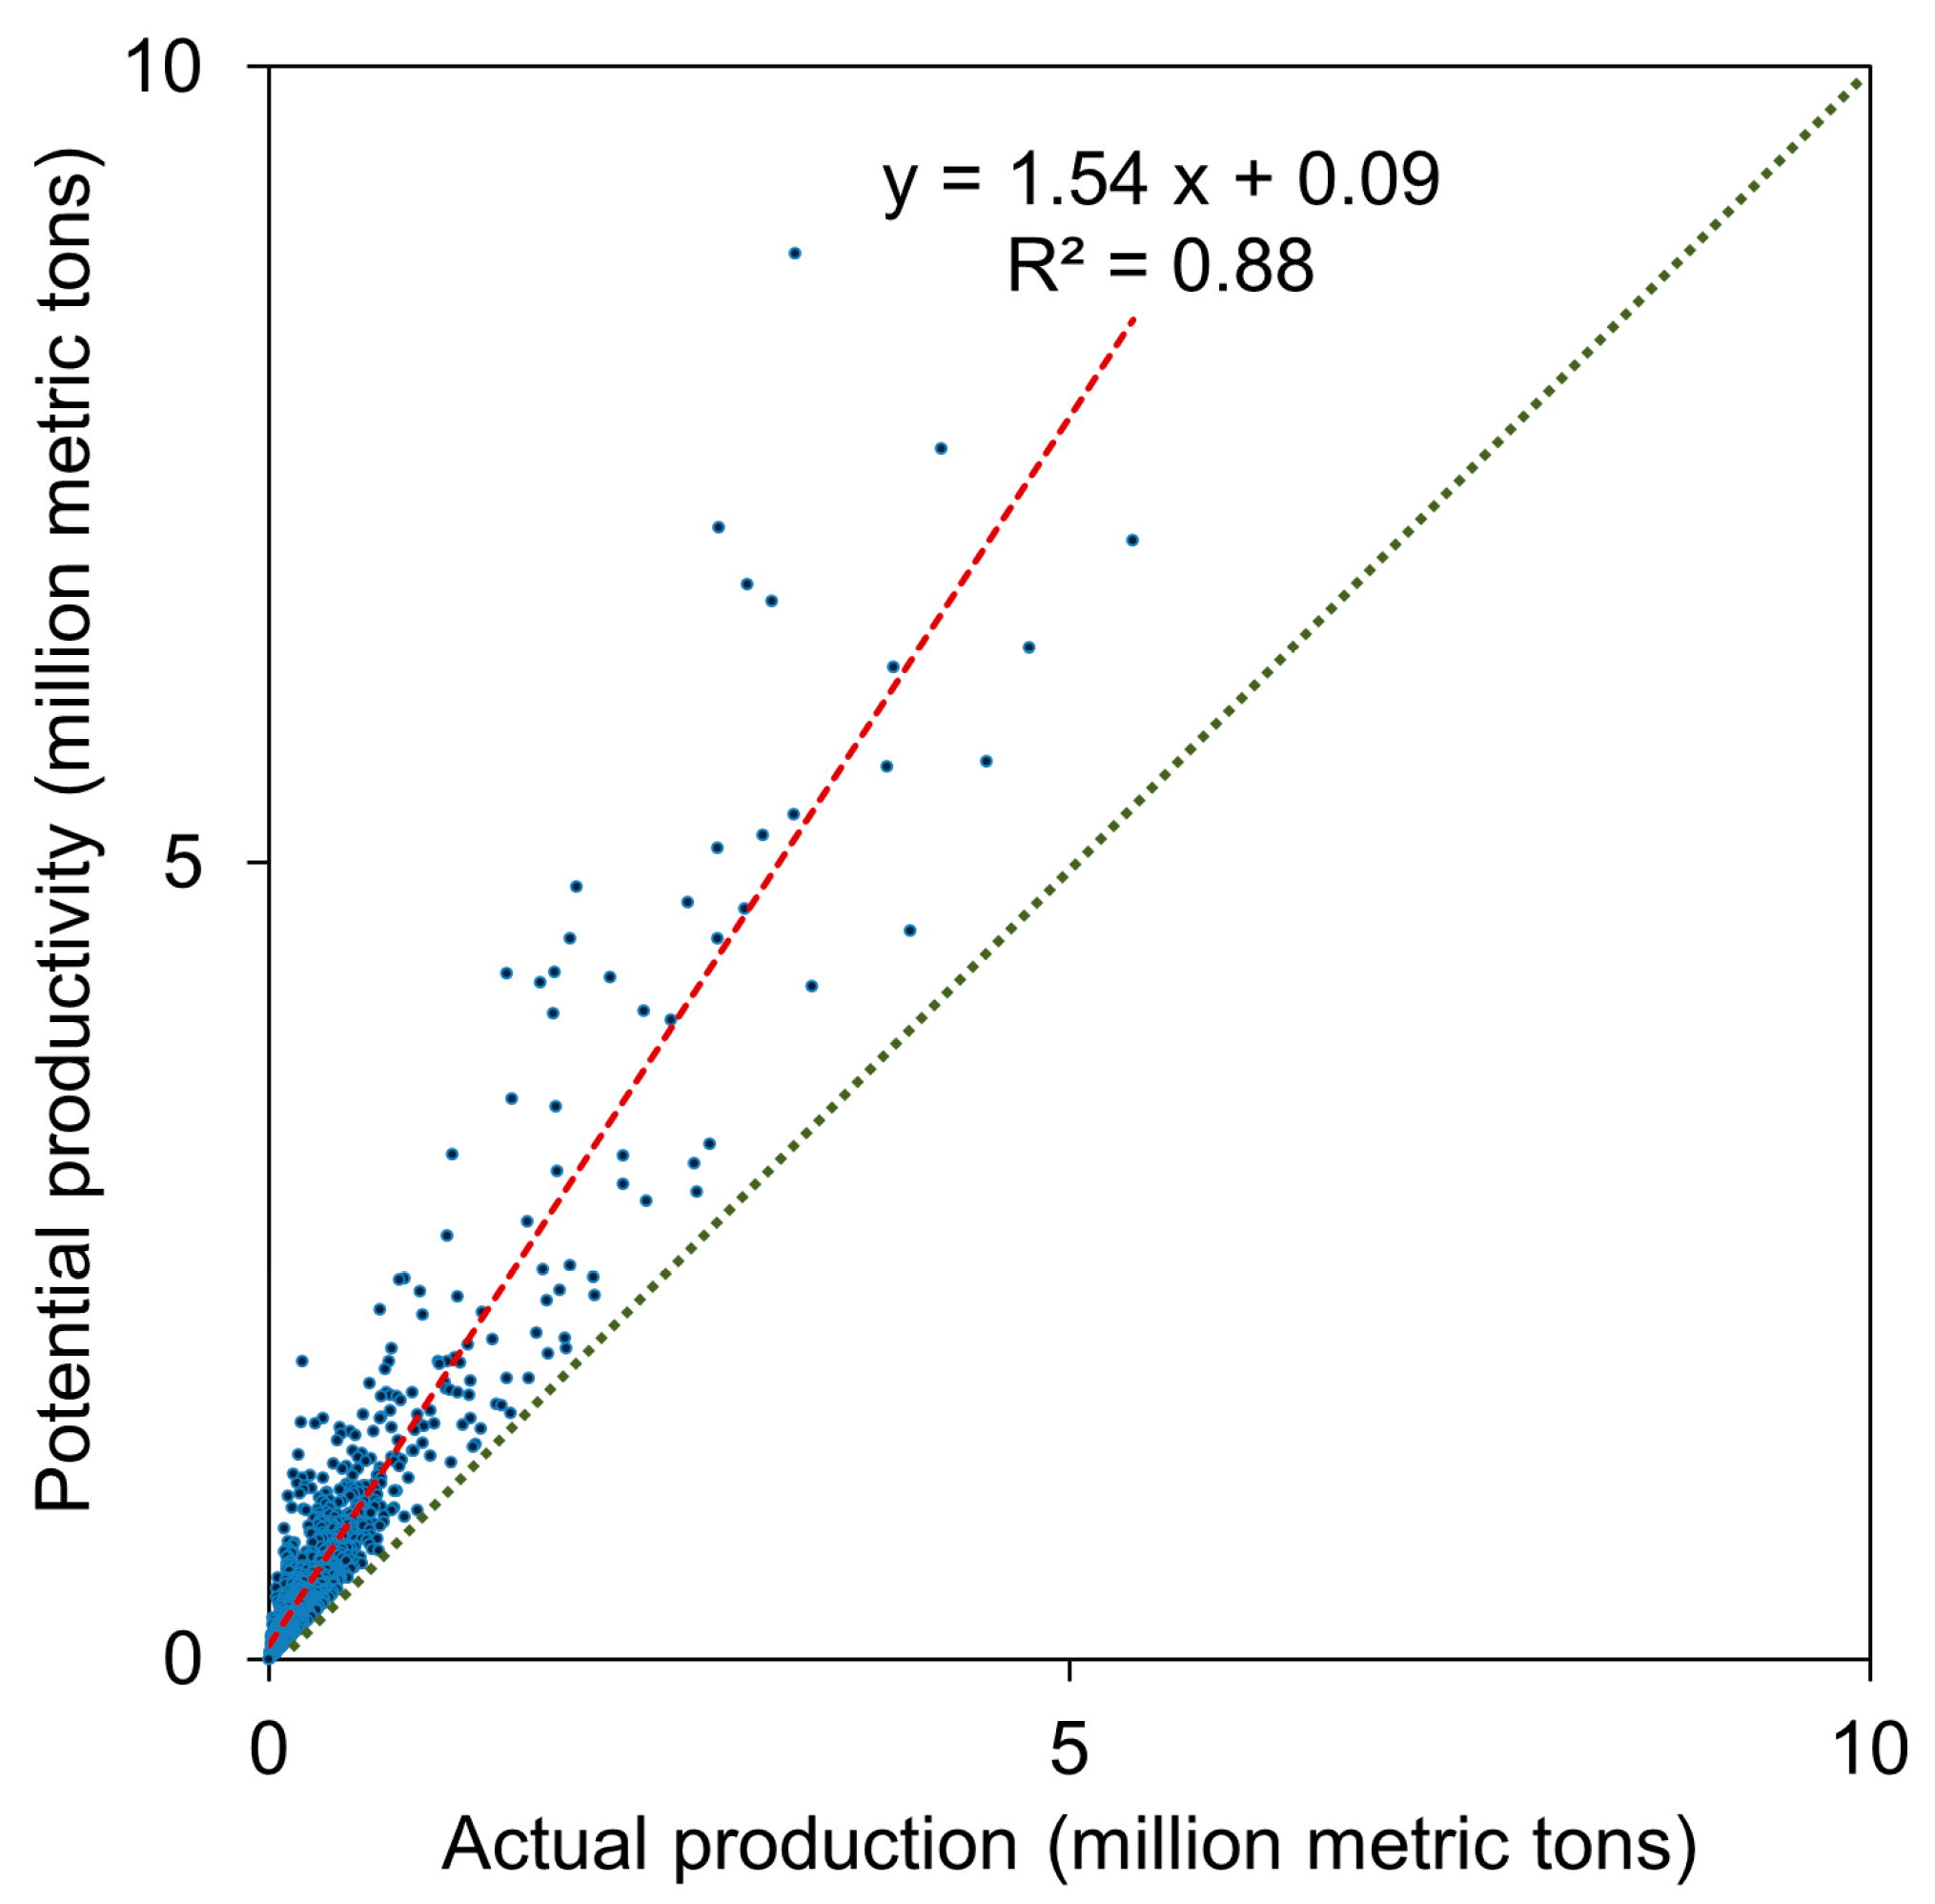
3.3. The Utilization of Potential Productivity

In 2012, the UTP of Mainland China was 62.7%, with the remaining 37.3% of potential productivity unexploited (Figure 7). Among the 31 provinces, Jilin, Guangdong and Shanghai have the highest utilization degree of potential productivity; 90.9%, 85.7% and 76.3%, respectively. The lowest degrees are for Hainan, Guizhou and Hubei; 25.2%, 42.6% and 45.9%, respectively. As regards the RUTP, all provinces yielded a RUTP > 1 except for Guizhou and Beijing, with a RUTP < 1 (0.98 and 0.99, respectively). This illustrates a universal intensification of the utilization of potential productivity, which might explain why China achieved a continuous increase of grain production [46] despite the net decrease of cultivated land (Figure 6) in the year 2012 compared to 2009.
Figure 7. The DP, RP, and RUTP for each province.
Sustainability 07 11893 g007
One thing is certain: China demands more food for its increasing population. There are two ways to improve grain yields: expanding the area of cultivated land [47] and improving grain yields per unit of cultivated land area by strengthening the management of agricultural inputs such as nutrients, water and the use of hybrid seed varieties [13,14,48,49].
However, from the viewpoint of sustainable development, different provinces should have their own strategies to boost grain yields. For instance, Jilin (UTP2012 = 90.9%, RUTP = 1.44, the same below), Guangdong (85.7%, 1.1), Heilongjiang (72.06%, 1.4), Liaoning (64.7%, 1.39) and Inner Mongolia (72.4%, 1.35) are typical provinces in that they have almost reached their maximum potential productivity, accompanied by the fast intensifying speed of the utilization of potential productivity. Therefore, their priority strategy for increasing grain yields should be cultivated land expansion. In contrast, Hainan (25.2%, 1.1), Guizhou (42.6%, 0.98), Yunan (46.9%, 1.18), Hubei (45.9%, 1.12) and Zhejiang (46.8%, 1.04) have relatively more exploitation space for grain production and slower accelerations in the speed of the utilization of potential productivity. Consequently, strengthening the management of agricultural inputs to improve grain yields per unit of cultivated land area might be their priority strategy.

4. Conclusions

Agricultural potential productivity was developed at a pixel level for the years of 2009 and 2012 in Mainland China. We employed buffer analysis to mine the spatial relationship among changes in cultivated land (by comparing the cultivated land in 2009 with that in 2012), the distribution of capital cities, and the average potential productivity per hectare of cultivated land. The UTP and RUTP were proposed to embody the utilization degree of potential productivity and the change characteristics of utilization intensity, respectively. It was found that a nationwide decrease was reported as a main characteristic of potential productivity change. Average potential productivity per hectare of cultivated land in China has been decreased by reducing the amount of highly productive cultivated land surrounding cities and adding less productive cultivated land in remote areas. Meanwhile, it can also be deduced that the cultivated land is being lost from the main cities. UTPs and RUTPs can vary significantly among the 31 provinces of Mainland China. Generally speaking, food security is a complicated issue in China. In terms of basic research regarding nationwide grain production, we could safely conclude that the threat from the reduction in potential productivity (triggered by the cultivated land conversion) to food security has been growing. This phenomenon will continue if effective measures are not taken in the future. For the sustainable development goals, we propose the following suggestions: (1) Developing a grain production strategy according to the particular facts of each province. For example, provinces (e.g., Jilin, Liaoning, Heilongjiang, Inner Mongolia and Guangdong) having limited potential productivity remaining and high acceleration of the utilization of potential productivity should emphasize the expansion of cultivated land. In contrast, provinces (e.g., Hainan, Hubei, Yunnan, Guizhou and Zhejiang) with relatively more exploitation space for potential and slower acceleration may increase inputs per unit of cultivated land rather than opening up new cultivated land; (2) Strengthening the protection of high-quality cultivated land. In the future, the formulation and implication of policy should emphasize settlement of the conflict between urban expansion and high-quality cultivated land protection.

Acknowledgments

The work was supported by the Project of the National Natural Science Foundation of China (41271173, 41301155) and a special project of the Ministry of Science and Technology (2012FY111800-01-01). Many thanks go to the anonymous reviewers for their comments on the manuscript.

Author Contributions

Linlin Xiao and Xiaohuan Yang designed this study, and Linlin Xiao was responsible for the writing of this paper. Hongyan Cai and Dingxiang Zhang were responsible for the data collection and processing. All the authors were involved in the results analysis and discussion.

Conflicts of Interest

The authors declare no conflict of interest.

References

  1. Tan, M.H.; Li, X.B.; Lu, C.H. Urban land expansion and arable land loss of the major cities in China in the 1990s. Sci. China Ser. D 2005, 48, 1492–1500. [Google Scholar] [CrossRef]
  2. Song, W.; Pijanowski, B.C.; Tayyebi, A. Urban expansion and its consumption of high-quality farmland in Beijing, China. Ecol. Indic. 2015, 54, 60–70. [Google Scholar] [CrossRef]
  3. Ramankutty, N.; Foley, J.A.; Olejniczak, N.J. People on the land: changes in global population and croplands during the 20th Century. J. Hum. Environ. 2002, 31, 251–257. [Google Scholar] [CrossRef]
  4. Liu, J.Y.; Liu, M.L.; Zhuang, D.F.; Zhang, Z.X.; Deng, X.Z. Study on spatial pattern of land-use change in China during 1995–2000. Sci. China Ser. D 2003, 46, 373–384. [Google Scholar]
  5. Ministry of Land and Resources of China (MLRC). Land Yearbook of China; Land Publishing House: Beijing, China, 1997; pp. 50–91. [Google Scholar]
  6. Song, W.; Pijanowski, B.C. The effects of China’s cultivated land balance program on potential land productivity at a national scale. Appl. Geogr. 2014, 46, 158–170. [Google Scholar] [CrossRef]
  7. Feng, Z.M.; Liu, B.Q.; Yang, Y.Z. A study of the changing trend of Chinese cultivated land amount and data reconstructing: 1949–2003. J. Nat. Resour. 2005, 20, 35–43. [Google Scholar]
  8. Liu, J.Y.; Liu, M.L.; Tian, H.Q.; Zhuang, D.F.; Zhang, Z.X.; Zhang, W.; Tang, X.M.; Deng, X.Z. Spatial and temporal patterns of China’s cropland during 1990–2000: An analysis based on Landsat TM data. Remote Sens. Environ. 2005, 98, 442–456. [Google Scholar] [CrossRef]
  9. Yang, X.H.; Cheng, C.Z.; Li, Y.J. Effect of Cropland Occupation and Supplement on Light-temperature Potential Productivity in China from 2000 to 2008. Chin. Geogr. Sci. 2010, 20, 536–544. [Google Scholar] [CrossRef]
  10. Cao, M.; Ma, S.; Han, C. Potential productivity and human carrying capacity of an agro-ecosystem: an analysis of food production potential of China. Agric. Syst. 1995, 47, 387–414. [Google Scholar] [CrossRef]
  11. Weinhold, D. Estimating the loss of agricultural productivity in the Amazon. Ecol. Econ. 1999, 31, 63–76. [Google Scholar] [CrossRef]
  12. Washington-Ottombre, C.; Pijanowski, B.; Campbell, D.; Olson, J.; Maitima, J.; Musili, A. Using a roleplaying game to inform the development of land-use models for the study of a complex socio-ecological system. Agric. Syst. 2010, 103, 117–126. [Google Scholar] [CrossRef]
  13. Huang, J.K.; Rozelle, S. Environmental-stress and grain yields in China. Am. J. Agric. Econ. 1995, 77, 853–864. [Google Scholar] [CrossRef]
  14. Wang, Q.B.; Halbrendt, C.; Johnson, S.R. Grain production and environmental management in China’s fertilizer economy. J. Environ. Manag. 1996, 47, 283–296. [Google Scholar] [CrossRef]
  15. Feng, Z.; Li, X. The strategy of cultivated land and food supplies security: storing food in land—raising the comprehensive productivity of land resource of China. Geogr. Territ. Res. 2000, 16, 1–5. (In Chinese) [Google Scholar]
  16. Yan, H.M.; Liu, J.Y.; Huang, H.Q.; Tao, B.; Cao, M.K. Assessing the consequence of land use change on agricultural productivity in China. Glob. Planet. Change 2009, 67, 13–19. [Google Scholar] [CrossRef]
  17. Yang, H.; Li, X.B. Cultivated land and food supply in China. Land Use Policy 2000, 17, 73–88. [Google Scholar] [CrossRef]
  18. Lu, J.; Xu, C. The Construction of the Assurance System of Food Security in China. Issues Agric. Econ. 2004, 8, 29–79. (In Chinese) [Google Scholar]
  19. Yu, L.; Zhao, F. Radiation and heat resources and crop photosynthetic and heat potential productivity. J. Meteorol. 1982, 3, 327–334. (In Chinese) [Google Scholar]
  20. Zhang, J.K.; Zhang, F.R.; Zhang, D.; He, D.X.; Zhang, L.; Wu, C.G.; Kong, X.B. The grain potential of cultivated lands in Mainland China in 2004. Land Use Policy 2008, 26, 68–76. [Google Scholar] [CrossRef]
  21. Cai, Y.; Fu, Z.; Dai, E. The minimum area per capita of cultivated land and its implication for the optimization of land resource allocation. Acta Geogr. Sin. 2002, 57, 127–134. (In Chinese) [Google Scholar]
  22. Ash, R.F.; Edmonds, R.L. China’s land resources, environment and agricultural production. China Q. 1998, 156, 836–879. [Google Scholar] [CrossRef]
  23. Smil, V. China’s agricultural land. China Q. 1999, 158, 414–429. [Google Scholar] [CrossRef]
  24. Lichtenberg, E.; Ding, C.G. Assessing farmland protection policy in China. Land Use Policy 2008, 25, 59–68. [Google Scholar] [CrossRef]
  25. He, J.H.; Liu, Y.L.; Yu, Y.; Tang, W.W.; Xiang, W.N.; Liu, D.F. A counterfactual scenario simulation approach for assessing the impact of farmland preservation policies on urban sprawl and food security in a major grain-producing area of China. Appl. Geogr. 2013, 37, 127–138. [Google Scholar] [CrossRef]
  26. Huang, J.K.; Zhu, L.; Deng, X. Regional differences and determinants of built-up area expansion in China. Sci. China Ser. D 2007, 50, 1835–1843. [Google Scholar] [CrossRef]
  27. Zhuang, D.; Liu, J.; Liu, M. Research activities on land use/land cover in the past ten years in China using space technology. Chin. Geogr. Sci. 1999, 4, 330–334. [Google Scholar] [CrossRef]
  28. Liu, J.Y.; Zhang, Z.X.; Xu, X.L.; Kuang, W.H.; Zhou, W.C.; Zhang, S.W.; Li, R.D.; Yan, C.Z.; Yu, D.S.; Wu, S.X.; et al. Spatial patterns and driving forces of land use change in China during the early 21st century. J. Geogr. Sci. 2010, 20, 483–494. [Google Scholar] [CrossRef]
  29. Liu, X.; Cai, S.B. 3S technology application in the second national land survey. Geomat. Spat. Inf. Technol. 2013, 36, 111–114. (In Chinese) [Google Scholar]
  30. Qiu, D.H.; Tian, S.F. The choice of aerospace remote sensing data in the second national land survey. Guangdong Land Sci. 2008, 7, 4–7. (In Chinese) [Google Scholar]
  31. Ma, L.Q. Research on the second land survey data classification of sharing mechanism. Territ. Nat. Resour. Study 2012, 6, 20–21. (In Chinese) [Google Scholar]
  32. Zhang, D.X.; Chen, H.L.; Li, H.W.; Li, S.J.; Fu, Q. National grating data production methods of land use. Land Resour. Inf. 2014, 2, 32–38. (In Chinese) [Google Scholar]
  33. Wei, H.L.; Xu, Q.S.; Zhang, T.S. Observation of solar irradiance at the surface from GMS-5. J. Remote Sens. 2003, 7, 465–471. (In Chinese) [Google Scholar]
  34. Xiao, L.L.; Yang, X.H.; Chen, S.X.; Cai, H.Y. An assessment of erosivity distribution and its influence on the effectiveness of land use conversion for reducing soil erosion in Jiangxi, China. Catena 2015, 125, 50–60. [Google Scholar] [CrossRef]
  35. Liu, L.; Xu, X.L.; Chen, X. Assessing the impact of urban expansion on potential crop yield in China during 1990–2010. Food Secur. 2014, 7, 33–43. [Google Scholar] [CrossRef]
  36. Heilig, G.K.; Fischer, G.; van Velthuizen, H.T. Can China feed itself? An analysis of China’s food prospects with special reference to water resources. Int. J. Sustain Dev. World Ecol. 2000, 7, 153–172. [Google Scholar] [CrossRef]
  37. Tatsumi, K.; Yamashiki, Y.; Roberto, V.D.S.; Takara, K.; Matsuoka, Y.; Takahashi, K.; Maruyama, K.; Kawahara, N. Estimation of potential changes in cereals production under climate change scenarios. Hydrol. Process. 2011, 25, 2715–2725. [Google Scholar] [CrossRef]
  38. Fischer, G.; Sun, L. Model based analysis of future land-use development in China. Agric. Ecosyst. Environ. 2001, 85, 163–176. [Google Scholar] [CrossRef]
  39. Deng, X.Z.; Huang, J.K.; Rozelle, S.; Uchida, E. Cultivated land conversion and potential agricultural productivity in China. Land Use Policy 2006, 23, 372–384. [Google Scholar] [CrossRef]
  40. Morschel, J.; Fox, D.M.; Bruno, J.F. Limiting sediment deposition on roadways: topographic controls on vulnerable roads and cost analysis of planting grass buffer strips. Environ. Sci. Policy 2004, 7, 39–45. [Google Scholar] [CrossRef]
  41. Foley, J.A.; DeFries, R.; Asner, G.P.; Barford, C.; Bonan, G.; Carpenter, S.R. Global consequences of land use. Science 2005, 309, 570–574. [Google Scholar] [CrossRef] [PubMed]
  42. Tsadila, E.; Evangelou, L.; Tsadilas, C.; Giourga, C.; Stamatiadis, S. Land-use effect on selected soil quality parameters. Commun. Soil Sci. Plant Anal. 2012, 43, 595–604. [Google Scholar] [CrossRef]
  43. Ramankutty, N.; Delire, C.; Snyder, P. Feedbacks between agriculture and climate: An illustration of the potential unintended consequences of human land use activities. Glob. Planet. Change 2006, 54, 79–93. [Google Scholar] [CrossRef]
  44. Selvaraju, R.; Gommes, R.; Bernardi, M. Climate science in support of sustainable agriculture and food security. Clim. Res. 2011, 47, 95–110. [Google Scholar] [CrossRef]
  45. Qin, Y.W.; Liu, J.Y.; Shi, W.J.; Tao, F.L.; Yan, H.M. Spatial-temporal changes of cropland and climate potential productivity in northern China during 1990–2010. Food Secur. 2013, 5, 499–512. [Google Scholar] [CrossRef]
  46. Chen, Y.F.; Li, X.D. Spatial-temporal characteristics and influencing factors of grain yield change in China. Trans. Chin. Soc. Agric. Eng. 2013, 29, 1–10. (In Chinese) [Google Scholar]
  47. Tilman, D.; Fargione, J.; Wolff, B.; D’Antonio, C.; Dobson, A.; Howarth, R. Forecasting agriculturally driven global environmental change. Science 2001, 292, 281–284. [Google Scholar] [CrossRef] [PubMed]
  48. Fan, M.S.; Shen, J.B.; Yuan, L.X.; Jiang, R.F.; Chen, X.P.; Davies, W.J; Zhang, F.S. Improving crop productivity and resource use efficiency to ensure food security and environmental quality in China. J. Exp. Bot. 2012, 63, 13–24. [Google Scholar] [CrossRef] [PubMed]
  49. Lin, J.Y. The household responsibility system reform in China—A peasants institutional choice. Am. J. Agric. Econ. 1987, 69, 410–415. [Google Scholar] [CrossRef]

